Writing the report and the assessment criteria
Structure the report within 3,200 words, understand what research design, data analysis, conclusion and evaluation each reward, and write top-band sections, using model extracts from one worked investigation.
- IB Sports, Exercise and Health Science
- Internal assessment
- SL and HL
Your teacher and the moderator assess the report, not the work behind it, so a well-designed investigation that is reported vaguely loses marks. The writing deserves as much planning as the method. This final stage of the scientific investigation brings together the worked warm-up investigation from "Planning the scientific investigation" and "Collecting and processing data", and sets out what each of the four assessment criteria rewards, in plain language, with model extracts.
The structure of the report
There is no compulsory structure, but a conventional scientific layout makes it easy for the reader to find what each criterion looks for. The diagram maps the usual sections to the criteria.
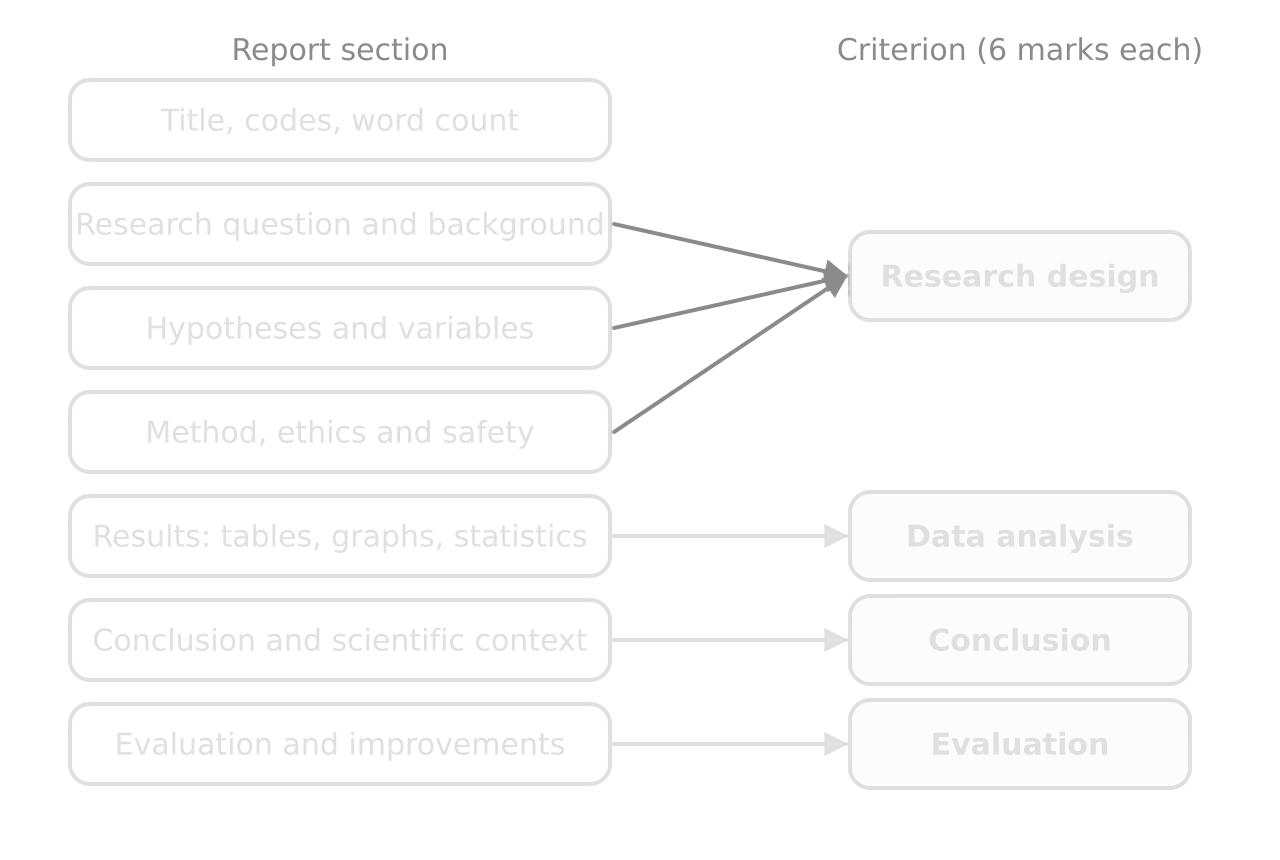
The 3,200-word limit is generous for a focused question but tight for a broad one. Data tables, graphs, equations and calculations, citations, the bibliography and headers do not count, so use tables for anything that would otherwise be a long list (variables, controls, apparatus, weaknesses and improvements) and keep prose for reasoning. A budget like the one in the table stops the evaluation, which is written last, from being squeezed.
Section | What it contains | Approximate words |
|---|---|---|
Start of report | Title, personal code, group members’ codes, word count | – |
Introduction | Research question; the system and why it matters for health or performance; background theory with citations | 450–550 |
Hypotheses and variables | Prediction with reasoning; H₀ and H₁; IV, DV and control variables (mostly in a table) | 200–300 |
Method | Participants and sampling; apparatus with resolution; numbered procedure; pilot and changes; safety, ethics, environment | 500–600 |
Results | Raw data sample; processed tables; one worked example of each calculation; graphs; statistical tests; brief description of trends | 300–400 |
Conclusion | Answer to the research question with the evidence and uncertainties; comparison with published findings; practical implications | 500–600 |
Evaluation | Specific weaknesses and limitations, their relative impact, realistic improvements | 550–650 |
References | Full, consistent references for every source cited | – |
Referencing
Every source of information, value, image or idea that is not your own is cited where it is used and listed in full in a bibliography. The conclusion criterion asks for comparison with the accepted scientific context to be traceable, so a citation must give enough detail for the reader to find the source: authors, year, title, journal or publisher, volume and pages, or a URL with an access date. Choose one recognised referencing style and use it consistently.
In-text citations do not count towards the word limit, so cite generously. Prefer primary research articles, systematic reviews and position statements from bodies such as the American College of Sports Medicine to websites and blogs, and say what kind of evidence each source provides: a meta-analysis of 32 studies carries more weight than a single small study.
How the criteria are applied
Each criterion has descriptors for three bands: 1–2, 3–4 and 5–6 marks (0 if the work does not reach the first band). The command term in each descriptor sets the depth expected. State is a brief answer without explanation, outline is a brief account, describe is a detailed account, explain gives reasons or causes, and justify gives valid reasons or evidence to support a conclusion. Moving from 4 to 6 marks in a criterion almost always means adding the "why".
Your teacher reads the descriptors and chooses the band that best fits the work as a whole (best fit), not the lowest band in which every point is met. Within a band, the upper mark goes to work that largely meets the descriptor and the lower mark to work that meets it to a lesser extent. The top band does not require a flawless report, and the four criteria are judged independently of each other.
Research design
Research design judges how well the report communicates the purpose and practice of the methodology: what question is being asked and why, what decisions were made in collecting the data and why, and whether the method could be repeated. It has three strands.
Strand | 1–2 marks | 3–4 marks | 5–6 marks |
|---|---|---|---|
Research question in context | Stated, without context | Outlined in a broad context | Described in a specific and appropriate context |
Methodological considerations | Stated | Described | Explained |
Description of the method | Too little detail to repeat it | Repeatable with a few ambiguities or omissions | Repeatable |
The descriptors are paraphrased in the table. "Context" means the two variables (or two correlated variables), a concise description of the system studied and background theory that bears directly on the question. "Methodological considerations" are the decisions behind the method: how the variables were measured, how data or databases were selected and sampled, the range, interval, number of repeats and precision of measurements, which variables were controlled and how, and the safety, ethical and environmental issues.
What top-band research design does
States a focused question naming both variables, the range of the independent variable and the population, then explains in a paragraph or two the theory that predicts the relationship, with citations.
Gives a reason for every important decision: why this range, why four levels, why three jumps, why 60 s between them, why a cross-over design, why this instrument.
Explains how each control variable was controlled, or monitored where control was impossible, usually in a table.
Describes ethics and safety specifically for this investigation, including informed consent (and parental consent for participants under 18), screening, the right to withdraw and anonymity.
Reports the pilot study and what it changed.
Gives a numbered, precise procedure with quantities, timings and instruments with their resolution, and nothing a competent reader would not need.
Data analysis
Data analysis judges how the report records, processes and presents the data so that they bear on the research question. Its three strands are communication, uncertainties and the processing itself.
Strand | 1–2 marks | 3–4 marks | 5–6 marks |
|---|---|---|---|
Communication of recording and processing | Neither clear nor precise | Either clear or precise | Both clear and precise |
Consideration of uncertainties | Limited evidence | Present, with some significant omissions or inaccuracies | Appropriate |
Processing relevant to the question | Major omissions, inaccuracies or inconsistencies | Some significant omissions, inaccuracies or inconsistencies | Appropriate and accurate |
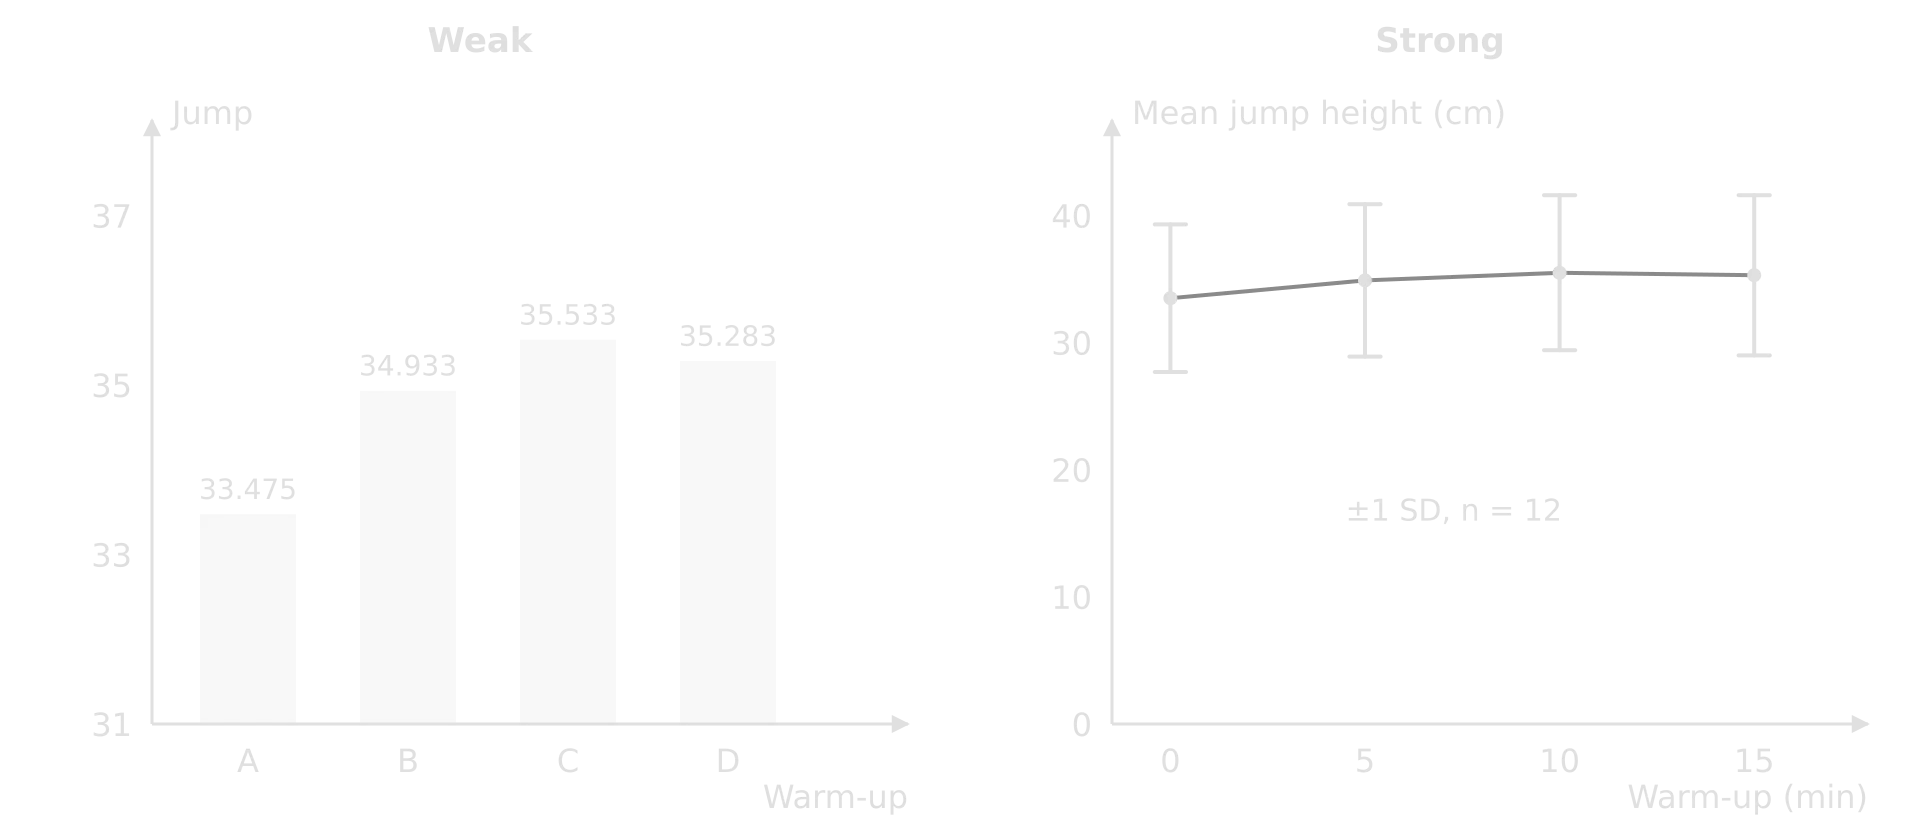
Clear means that a reader can follow how the processing was done: a worked example of each calculation, a sentence saying which spreadsheet function or statistical test was used, tables that lead from raw to processed values. Precise means following the conventions: units and uncertainties in table headings, consistent decimal places, sensible significant figures, labelled graph axes with units, and captions saying what error bars show. A "major" problem is one that prevents a valid conclusion (a wrong test, an averaging error); a "significant" one still allows a conclusion but limits it.
What top-band data analysis does
Shows a sample of raw data with units, uncertainties and qualitative observations, and explains any excluded values.
Gives one worked example of each calculation (a participant mean, a percentage change, an uncertainty), then presents the rest in tables.
States the uncertainty of each measured quantity, compares instrument uncertainty with the variation between repeats, and shows uncertainty on graphs as error bars.
Chooses a statistical test that matches the design (a paired t-test for a cross-over design), says how it was calculated and reports the result correctly.
Presents only the graphs that help answer the question, each clear and correctly labelled.
Conclusion
The conclusion criterion judges how well the report answers its research question, using its own analysis and the accepted scientific context. It has three strands.
Strand | 1–2 marks | 3–4 marks | 5–6 marks |
|---|---|---|---|
Consistency with the analysis | Relevant, but not supported by the analysis | Described; not fully consistent with the analysis | Justified; relevant and fully consistent with the analysis |
Scientific context | Superficial comparison | Some relevant comparison | Justified through relevant comparison |
Practical implications | Stated | Outlined | Explained |
A conclusion that is "fully consistent" interprets the processed data including their uncertainties: it does not claim more than the error bars, the p-value and the range of the data allow. The scientific context is published material (research articles, reviews, published values, textbooks) cited so that it can be traced. Practical implications are real-world applications of the findings to health or performance.
What a top-band conclusion does
Answers the research question directly in its first sentence or two, in terms of both variables and the population.
Quotes the key processed values with their uncertainty or spread, and the result of the statistical test, and says what they mean for the hypotheses.
Describes the shape of the relationship across the range, not only the difference between the extremes.
Explains the result with the theory set out in the introduction.
Compares the findings with specific published results, saying where they agree, where they differ and why they might differ (population, protocol, measurement).
Explains who could use the findings and how, for health or performance, within the limits of the sample and the range investigated.
The comparison with published research comes next. In the worked investigation, it can draw on two real sources: a systematic review and meta-analysis of 32 high-quality studies, which found that warming up improved performance in 79% of the criteria examined, and a review of stretching research that concluded that dynamic stretching either has no effect on subsequent performance or improves it, particularly when it lasts longer. A 6% improvement after a dynamic warm-up is consistent with both, and the plateau after 10 min adds detail for this age group and this jump test.
Sources: Fradkin, Zazryn and Smoliga, Journal of Strength and Conditioning Research, 2010; Behm and Chaouachi, European Journal of Applied Physiology, 2011.
Evaluation
The evaluation criterion judges how well the report evaluates the methodology and suggests improvements. Its two strands are the weaknesses and limitations, and the improvements.
Strand | 1–2 marks | 3–4 marks | 5–6 marks |
|---|---|---|---|
Weaknesses and limitations | Generic ones stated | Specific ones described | The relative impact of specific ones explained |
Improvements | Realistic improvements stated | Realistic improvements relevant to the weaknesses described | Realistic improvements relevant to the weaknesses explained |
Weaknesses and limitations
The two words have different meanings. Weaknesses are problems in how the data were collected: control of variables, precision of measurement and variation in the data. Limitations restrict the scope of the conclusion even if the data are perfect: the range of the independent variable, the confines of the system (who or what was studied) and the assumptions made. A strong evaluation covers both.
A weakness or limitation is generic if it would fit almost any investigation ("human error", "a small sample", "more repeats"). It is specific if it names what happened in this investigation and how it affected these data. The top band then asks for relative impact: which issues mattered most for the conclusion and which hardly mattered, with reasons.
Issue (warm-up investigation) | Weakness or limitation | Effect on the results | Relative impact | Realistic improvement |
|---|---|---|---|---|
Warm-up intensity was set by RPE 11–13, so jogging speed varied between participants and sessions | Weakness: control of the IV | Some participants’ "10 min" may have been harder than others’, adding random variation to the differences | Medium: heart rates confirm the conditions differed, but by varying amounts | Pace the jog with a metronome or a fixed lap time, and record heart rate at the end of every block |
Learning across the four sessions | Weakness: control of variables | Later sessions could produce higher jumps whatever the condition | Low: one familiarisation session and a counterbalanced order spread any learning across conditions | Two familiarisation sessions until jump height stabilises |
Flight-time method assumes the same body position at take-off and landing | Weakness: precision and validity of measurement | Bent-knee landings overestimate height; observed and repeated, but small flexion could go unnoticed | Low for the comparison (affects all conditions); higher for comparison with published norms | Film jumps at 240 fps from the side to check landing posture on a sample |
Twelve recreationally active 16–17-year-olds from one school, volunteers | Limitation: confines of the system | Conclusion applies only to similar students | High for practical implications; does not affect the internal validity of the comparison | Repeat with a team of jumping athletes, or a wider age range, to test whether the plateau changes |
Only four durations, 5 min apart, all tested 2 min after the warm-up | Limitation: range of data | The position of the plateau between 5 and 15 min is uncertain; effects of a longer gap before competing are unknown | Medium: the 5–10 min difference (p = 0.035) is the least certain finding | Add 7.5 and 12.5 min, or vary the rest after the warm-up as a second investigation |
The table is a structure for the evaluation, not a replacement for it. In the prose, rank the issues: in this investigation the variable warm-up intensity is the most important weakness, because it changes the independent variable itself; the restricted sample is the most important limitation, because it determines who the practical implications apply to. Learning effects and the landing assumption had little effect on the comparison because the design controlled them. That ranking is what "relative impact" means.
Realistic improvements
An improvement is realistic if a student could carry it out with school equipment and time, and relevant if it answers a weakness or limitation you have identified. Explaining it means saying how it would reduce the problem. "Use a force platform" is unrealistic in most schools; "film each jump at 240 fps and calculate flight time from the frames to check the mat on a sample of jumps" is realistic and explained.
Applying the criteria to other investigations
The same criteria apply whatever the theme. A biomechanics investigation is usually easier to control, because a ball does not get tired or learn, but its weaknesses lie in measurement and in the assumptions of the model. A psychology or motor learning investigation measures behaviour that changes with expectation, practice and mood, so its weaknesses lie in control of human factors and in the validity of the measure.
In motor learning and psychology, the commonest serious weakness is a design in which every participant meets the conditions in the same order, so that practice, fatigue or boredom changes along with the independent variable.
Using feedback on your draft
Your teacher reads one complete draft and gives advice, orally or in writing, on how it could be improved; they do not edit or correct it, and the next version you hand in is final. That makes the draft valuable: submit a full draft, with every section written, so that the advice covers the evaluation as well as the introduction.
Before submitting the draft, check it against the four criteria yourself and note what you are unsure about. Ask about those points specifically.
Act on every comment, and check whether the same problem appears elsewhere in the report. A comment about an unexplained control variable usually applies to several.
Do not add new data collection after the draft unless your teacher agrees it is feasible; most improvements at this stage are in explanation, processing and evaluation.
Recheck the word count and every number after editing: a changed mean must be changed in the table, the graph, the conclusion and the evaluation.
Final checklist
Work through the list before you submit the final version.
- To do:
The report starts with the title, my personal code, any group members’ codes and the word count, and is within 3,200 words.
- To do:
The research question names both variables with units and range, the measuring method and the population, and the introduction explains the theory behind it with citations.
- To do:
Every methodological decision (range, interval, repeats, sample, instruments, controls, design) is explained, not only stated.
- To do:
Safety, ethics (consent, PAR-Q, right to withdraw, anonymity, minors) and environmental issues are specific to my investigation.
- To do:
The method is a numbered, repeatable procedure, and the pilot and its changes are reported.
- To do:
Raw and processed tables have titles, units and uncertainties in the headings and consistent decimal places.
- To do:
One worked example of each calculation is shown, and uncertainties are stated, propagated and shown as error bars.
- To do:
The statistical test fits the design and is interpreted correctly against p = 0.05.
- To do:
The conclusion answers the research question, quotes the key values with their uncertainty and stays within the data.
- To do:
The findings are compared with specific, traceably cited published research.
- To do:
The practical implications for health or performance are explained, with their limits.
- To do:
Weaknesses and limitations are specific, and their relative impact on the conclusion is explained.
- To do:
Each improvement is realistic, linked to a named weakness and explained.
- To do:
Every source is cited in the text and listed in full in a bibliography in one consistent style.
Carry on with SEHS in Augment
With a free account, Augment remembers where you stopped in the notes and which questions you have marked.