2 Functions
An overview of functions: how straight lines, function notation, graphs and their key features lead to modelling real situations, and how HL adds composites, transformations, further models and logarithmic scales.
- IB Mathematics: Applications and Interpretation
- SL and HL
10 subtopics in Functions
Each one has its own page once something is published for it.
- 2.1Equations of straight lines60 questions · notes
- 2.2Functions, domain and range30 questions · notes
- 2.3Graphing functions with technology33 questions · notes
- 2.4Key features of graphs53 questions · notes
- 2.5Modelling with functions195 questions · notes
- 2.6The modelling process27 questions · notes
- 2.7Composite and inverse functionsHL only28 questions · notes
- 2.8Transformations of graphsHL only26 questions · notes
- 2.9Further modellingHL only73 questions · notes
- 2.10Scaling very large and small numbers using logarithmsHL only31 questions · notes
An overview of 2 Functions
Introduction
A function is a rule that gives exactly one output for each input: the cost of a taxi ride for each distance, the height of a tide at each hour, the population of a country in each year. Topic 2 studies functions in three linked representations, the equation, the table of values and the graph, and uses technology to move between them. Its aim is practical. A function is chosen to describe a real situation, fitted to data, and then used to answer a question.
This makes functions the language of modelling for the whole course. A mathematical model is useful only where it fits reality well, so the topic also teaches how to test a model, where it can be trusted, and why predictions far outside the data are risky. At HL the range of models widens, and functions can be combined, reversed and transformed.
 YouTube
How the subtopics fit together
The subtopics form two strands. The map of the topic shows each strand as a row, with the SL subtopics shaded and the HL-only subtopics dashed; an arrow means the first subtopic is used in the second.
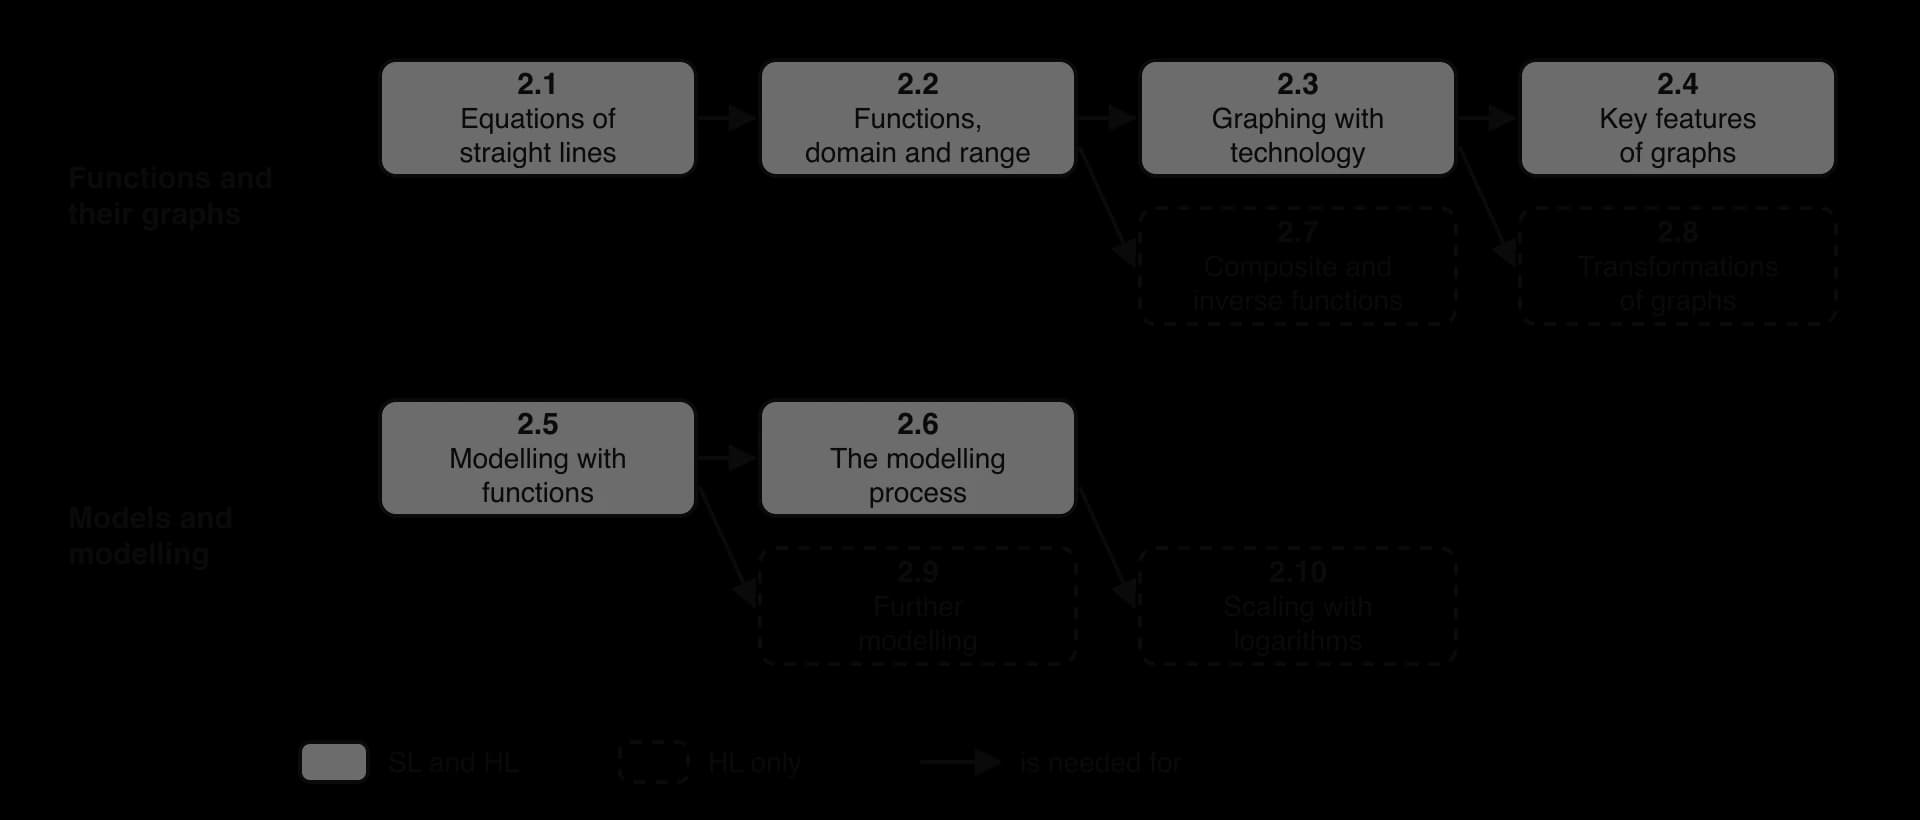
The functions and their graphs strand starts from the straight line, the simplest function, with its gradient as a rate of change. Function notation, domain and range follow, then graphing with a GDC and reading off the key features: intercepts, zeros, maximum and minimum points, asymptotes and points of intersection. Solving an equation by finding where two graphs meet is the method used throughout the course when algebra alone would be slow.
The models and modelling strand applies these skills. Subtopic 2.5 builds the families of models, and subtopic 2.6 turns the work into a cycle: state assumptions, fit the parameters, test the model against data, reflect on its limitations and use it. At HL the strand adds logistic, natural logarithmic, phase-shifted sinusoidal and general piecewise models, and logarithms straighten curved data so that an exponential or a power model can be chosen and fitted.
The subtopics
Subtopic | Level | What it covers |
|---|---|---|
2.1 Equations of straight lines | SL | Gradient and intercepts, the three forms of a line's equation, parallel and perpendicular lines, and the steepness of real inclines |
2.2 Functions, domain and range | SL | Function notation, domain and range in context, and inverse functions as reflections in , used to find values such as |
2.3 Graphing functions with technology | SL | Graphing any function with a GDC, choosing a window, drawing, sketching and plotting, transferring a graph to paper, and sums and differences of functions such as profit |
2.4 Key features of graphs | SL | Intercepts, zeros, maximum and minimum points, symmetry, asymptotes and points of intersection, including break-even points |
2.5 Modelling with functions | SL | Linear, piecewise linear, quadratic, exponential, direct and inverse variation, cubic and sinusoidal models, with their parameters interpreted |
2.6 The modelling process | SL | The modelling cycle: assumptions, fitting, a reasonable domain, testing, validity, limitations and the dangers of extrapolation |
2.7 Composite and inverse functions | HL | Composite functions in context, finding inverses algebraically and restricting a domain so an inverse exists |
2.8 Transformations of graphs | HL | Translations, reflections and stretches, alone and combined, and how points and asymptotes move under them |
2.9 Further modelling | HL | Half-life from exponential models, natural logarithmic, phase-shifted sinusoidal, logistic and piecewise models, and continuity |
2.10 Scaling very large and small numbers using logarithms | HL | Logarithmic scales, linearizing data to choose between exponential and power models, and reading semi-log and log-log graphs |
Links to other topics
Functions connect to every other topic. Exponential models are the continuous form of the geometric sequences and compound interest of topic 1, and the GDC's equation solvers from subtopic 1.8 find a model's parameters from given points. Fitting a model to data by regression belongs to topic 4: linear regression in subtopic 4.4 and, at HL, curved models with in subtopic 4.13.
Calculus in topic 5 analyses the same functions: the derivative is used to find where a model reaches its maximum, and the integral gives the area under its graph. Sinusoidal models use the trigonometry of topic 3, with angles in degrees at SL and radians at HL (subtopic 3.7).
From the formula booklet
The entries of the mathematics: applications and interpretation formula booklet that 2 uses. Each opens in the explained booklet.
- Distance between two points and Prior learning › SL and HL › Distance between two points and
- Coordinates of the midpoint of a line segment with endpoints and Prior learning › SL and HL › Coordinates of the midpoint of a line segment with endpoints and
- Solutions of a quadratic equationHL onlyPrior learning › HL only › Solutions of a quadratic equation
- Gradient–intercept formTopic 2: Functions › SL and HL › SL 2.1 Equations of a straight line
- General formTopic 2: Functions › SL and HL › SL 2.1 Equations of a straight line
- Point–gradient formTopic 2: Functions › SL and HL › SL 2.1 Equations of a straight line
- Gradient formulaTopic 2: Functions › SL and HL › SL 2.1 Gradient formula
- Axis of symmetry of the graph of a quadratic functionTopic 2: Functions › SL and HL › SL 2.5 Axis of symmetry of the graph of a quadratic function
- Logistic functionHL onlyTopic 2: Functions › HL only › AHL 2.9 Logistic function
Carry on with 2 in Augment
With a free account, Augment remembers where you stopped and what you have practiced.