2.3 Graphing functions with technology
Graph any function with a GDC, choose a viewing window, transfer a screen graph to paper as a labelled sketch or an accurate drawing, and graph sums and differences such as profit = revenue − cost.
- IB Mathematics: Applications and Interpretation
- Part of 2 Functions
- SL and HL
Key terms introduced here
Each is in the Maths AI glossary, with every other term in the subject.
- Difference of functions
The function whose output at each input is the output of minus the output of , so for every in both domains.
- Draw
To represent a function by an accurate, labelled graph made in pencil, on axes with a stated scale, with points correctly plotted and joined by a ruled straight line or a smooth curve.
- Graph of a function
The set of all points in the plane with in the domain of the function and .
- Key feature
A point, line or behaviour of a graph that describes the function and must be labelled on a sketch, such as an intercept, a maximum or minimum point, an asymptote, a point of intersection or an end point of the domain.
- Plot
To mark the positions of given or calculated points accurately on a pair of axes.
- Profit function
A function giving the income left after costs when items are made and sold, equal to revenue minus cost, ; a negative value is a loss.
- Revenue function
A function that gives the total income from selling items; at a fixed price per item, .
- Scale (of an axis)
The size of the step represented by each marked division along an axis, which fixes how far apart given values appear.
- Sketch
To represent a function by a graph, labelled as appropriate, that gives a general idea of its shape and shows its relevant features, without needing to be drawn to scale.
- Smooth curve
A continuous curve drawn freehand through plotted points without corners, gaps or straight-line segments, following the gradual bending of the function between the points.
- Sum of functions
The function whose output at each input is the sum of the outputs of and , so for every in both domains.
- Table of values
A table that lists chosen inputs of a function alongside the corresponding outputs , giving points that lie on its graph.
- Viewing window
The rectangular part of the coordinate plane displayed by a GDC or graphing software, set by the minimum and maximum -values and the minimum and maximum -values.
Notes on 2.3 Graphing functions with technology
Learning objectives
State the meaning of the graph of a function and its equation , and determine whether a point lies on a graph.
Use a GDC to graph a function, including functions not met elsewhere in the course, choosing a suitable viewing window.
Distinguish between the command terms draw, sketch and plot, and produce each kind of graph.
Sketch a graph from information given in words or from a real context.
Transfer a graph from a GDC screen to paper, labelling the axes and every key feature.
Use technology to graph sums and differences of functions, and interpret them in context, including profit as revenue minus cost.
Introduction
A formula, a table and a graph can all describe the same function, but the graph is the one that shows its whole behaviour at a glance: where it rises and falls, where it crosses the axes, where it levels off and where it is undefined. Engineers, economists and scientists use graphs constantly, and the graphic display calculator (GDC) can graph almost any function in seconds. The calculator does not decide which part of the graph to look at, and it does not turn what the screen shows into a clear, labelled graph on paper; those two skills stay with the person using it.
The same skills apply to real measurements. The concentration of carbon dioxide in the air above Hawaii, for example, rises every year and also rises and falls with the seasons; graphing the two effects as separate functions and adding them reproduces the saw-tooth shape of the Keeling Curve.
The graph of a function and its equation
A function takes each input from its domain and gives exactly one output . Pairing each input with its output gives an ordered pair . Marking every such pair as a point on a pair of axes produces a picture of the whole function.
The equation is called the equation of the graph. It is a test that every point must pass: a point lies on the graph exactly when substituting gives . The test works in both directions. Every point on the curve satisfies the equation, and every pair that satisfies the equation (with in the domain) is on the curve. This two-way link is what allows a question to be answered either from the formula or from the picture.
Because a function gives only one output for each input, a vertical line meets its graph at most once. The vertical line test from subtopic 2.2, Functions, domain and range, is the graphical form of this rule.
Tables of values
Before graphing technology existed, every graph started as a list of inputs and outputs. The list is still useful: it gives exact points to plot, it checks what a screen shows, and a GDC produces one instantly.
For with whole-number inputs from to 6, each output comes from one substitution. For instance, at , .
−2 | −1 | 0 | 1 | 2 | 3 | 4 | 5 | 6 | |
|---|---|---|---|---|---|---|---|---|---|
5 | 1.5 | −1 | −2.5 | −3 | −2.5 | −1 | 1.5 | 5 |
The outputs fall to −3 at and then rise again, and they repeat in mirror order on either side of . A table therefore already shows a minimum and a symmetry before any graph is drawn. Its weakness is that it shows only the chosen inputs: a table with steps of 1 says nothing certain about what happens between and , and a sharp feature between two rows can be missed completely.
Plotting points and joining them
Marking each pair from a table as a point on the axes is called plotting. The points alone are not yet a graph of the function: the domain usually contains every real number in an interval, not just the integers in the table.
When the function is defined at every point of an interval and has no jumps, the plotted points are joined by a smooth curve. Joining them with straight segments instead suggests sharp corners that the function does not have; a quadratic such as bends continuously, so its graph between two plotted points is curved, not straight.
Points are not always joined. A function whose domain is a set of separate values, such as a cost function for a whole number of tickets, has a graph that is a set of isolated points, and joining them would claim values (half a ticket) that do not exist.
- y = 0.5x² − 2x − 1
Graphing with technology
The GDC carries out the substitutions of a table of values for hundreds of inputs and joins the results, so it shows in seconds a shape that would take a long time to plot by hand. Using it well depends on three decisions: entering the function correctly, choosing what part of the plane to view, and reading values with the right tool.
Entering a function
Every GDC has a function editor where the right-hand side of is typed in terms of (on a TI-84 Plus CE, the Y= screen; on a Casio fx-CG50, MENU → Graph). Several functions can be stored at once as and drawn on the same axes.
Brackets matter. The function must be typed as 12/(x^2+1); without the brackets the calculator reads 12/x^2+1 as , a different function with a different graph. Negative signs need the same care: means , which is always negative or zero, and a GDC follows that convention.
Functions with angles need the correct angle mode. Sinusoidal models in this course use degrees (subtopic 2.5), so the GDC must be in degree mode before is graphed; in radian mode the same keystrokes produce a curve with a completely different period. The mode is set in the settings menu (MODE on a TI-84 Plus CE; SHIFT MENU (SET UP) → Angle on a Casio fx-CG50).
The viewing window
A screen shows only a rectangle of the plane. The edges of that rectangle are the smallest and largest values of and displayed.
On a TI-84 Plus CE the window is set with WINDOW (Xmin, Xmax, Ymin, Ymax); on a Casio fx-CG50 with SHIFT F3 (V-Window). The same settings also contain the gap between tick marks on each axis, which is the screen's version of a scale.
The window decides what part of a function is seen, so it decides what conclusions can be drawn. A window that is too small in cuts the top off a maximum; one that is too narrow in hides a second crossing of the axis; one that is far too large flattens every bend into an almost straight line. In a model, the window should therefore cover the inputs and outputs that matter in the context.
Choosing a window from the context
An open box is made from a rectangular sheet of card 30 cm by 20 cm by cutting a square of side cm from each corner and folding up the sides. Its volume, in cm³, is
Entered on a GDC with its standard window (, ), the graph is little more than a steep line through the origin, because the volumes are in the hundreds and almost all of the curve lies off the top and bottom of the screen.
- V = x(30 − 2x)(20 − 2x)
The context gives the right window. A square cut from each corner must have , and two cuts from the 20 cm side need , so . In that domain the factors , and are all positive, so . A rough size for comes from one value: . A window of and therefore shows the whole useful curve.
- V = x(30 − 2x)(20 − 2x)
A reliable routine for choosing a window combines the context, the table and the calculator's automatic tools:
Set to the domain given in the question, or to a domain the context forces (lengths positive, time from 0).
Use the table, or evaluate a few values, to see how large and how small the outputs become on that domain.
Set a little beyond those values, or use the GDC's automatic -scaling (
ZOOM→ZoomFiton a TI-84 Plus CE; theAUTOoption of the Zoom menu on a Casio fx-CG50).Zoom out once to check that no feature lies just outside the window, then zoom back to the domain required.
Reading values from the graph
A GDC offers two ways to read coordinates. The trace cursor moves along the curve from pixel to pixel, so it jumps over most values and can only approximate a maximum or a crossing. The analysis tools (the CALC menu, 2nd TRACE, on a TI-84 Plus CE; G-SOLVE, SHIFT F5, on a Casio fx-CG50) instead solve for the feature numerically and give it to many digits. The tools are named for what they find: value, zero or root, maximum, minimum, intersection.
For the box function, the trace cursor might stop at with or at with , while the maximum tool gives , . Near a maximum the curve is almost flat, so the traced volumes look nearly right, but the traced -values are already wrong in the second significant figure; only the maximum tool gives correct to 3 significant figures. Subtopic 2.4, Key features of graphs, gives each tool in full; for graphing, they supply the coordinates of the features a graph must show.
 YouTube
Functions not met elsewhere
The functions in an applied problem are not limited to the model families of subtopic 2.5. A volume, a cost per item or a population can be given by a formula such as or , which belong to no named family. The method is the same for every function: enter it, choose a window from its domain and outputs, read its features with the analysis tools, and transfer them to paper. Unless a domain is given, it is taken to be the largest set of real numbers for which the formula works, as in subtopic 2.2, so has domain .
Key features
A graph on paper is only useful if the reader can find the important points on it without the calculator. These points are the graph's key features.
The features that most graphs need are listed in the table, together with how each is shown. Subtopic 2.4, Key features of graphs, explains how to find each one precisely. When graphing, the task is to recognise which are present and to label them.
Feature | How it is shown on a sketch |
|---|---|
-intercept | the point where the graph crosses the -axis |
-intercepts (zeros) | points where the graph meets the -axis |
local maximum or minimum | the turning point with its coordinates |
asymptotes | dashed lines with their equations, the curve approaching but not touching them |
end points of a given domain | the first and last points, with coordinates, and nothing drawn beyond them |
points of intersection | where two graphs on the same axes meet, with coordinates |
End points are easily forgotten because they are not special points of the function itself. When a domain such as is given, the graph starts and stops there, and its first and last points carry information (the starting value and the final value) that a reader needs.
Draw, sketch and plot
Three command terms ask for a graph, and they ask for different amounts of accuracy. Plotting only marks points. Drawing and sketching both produce a complete graph, but only drawing requires it to be to scale.
Because a drawing is to scale, values can be read from it with a ruler, and an extra line drawn on it (a tangent, a horizontal line ) can be used to estimate a solution. Drawings are usually made on graph paper or on axes printed in the question.
A sketch records what a graph looks like and where its features are. It must have the correct shape (rising or falling in the right places, bending the right way, approaching asymptotes correctly) and its key features labelled with their coordinates, but the distances between points need only be roughly right. A sketch drawn freehand on plain paper is acceptable, provided the axes are labelled and some indication of scale is given, for example by labelling values at the ends of the axes or at the key points.
Plot | Sketch | Draw | |
|---|---|---|---|
What is produced | points only | the shape of the whole graph | the whole graph, to scale |
Accuracy | each point in its exact position | features in the right order and roughly the right place | every point in its exact position |
Labels | points as required | axes, some scale, all key features with coordinates | axes, full scale, key features |
Tools | ruler or grid | freehand | graph paper or given grid, ruler for straight lines, smooth curves |
Typical use | data, a few calculated points | recording a GDC graph, showing a relationship | reading values off the graph, adding lines |
Drawing a graph accurately
A drawing follows a fixed sequence, and each step prevents a particular error.
Make a table of values across the whole domain, with extra points where the curve bends sharply.
Choose a scale for each axis that uses most of the grid and has easy steps (1, 2, 5 or 10 units per division), so points can be placed exactly. The two axes may have different scales.
Label each axis with its variable (and units in context) and number the divisions.
Plot each point with a small, sharp cross or dot.
Join the points with one smooth curve (or a ruled line for a linear function), staying inside the domain.
Label the curve with its equation and add any key features asked for.
Transferring a graph from screen to paper
Most graphs in applied problems are found on a GDC and then copied by hand. Copying a screen faithfully needs more than tracing its outline, because a screen has no labels, its pixels blur steep sections, and its window may cut off parts of the curve. The aim is a sketch from which another person could recover every important fact without the calculator.
A routine for transferring a graph
Set the window to the domain asked for, and a -range that shows the whole curve on it. Write the window down if no axes are given.
Find every key feature with the analysis tools: intercepts, maximum and minimum points, and the values at the end points. Note any vertical or horizontal asymptotes from the formula and the screen.
Draw and label the axes with the variables used in the question ( and , not and , if those are the question's letters), and mark the ends of the window or the key values to show the scale.
Mark the key features first, in proportion: a point at should be about three-quarters of the way to . Draw asymptotes as dashed lines and label their equations.
Join the features with a smooth curve that has the screen's shape, bending the same way and approaching asymptotes without touching or crossing them.
Stop the curve at the end points of the domain and label them.
The function on shows why each step matters. Its formula has in a denominator, so it is undefined at and the outputs grow without limit as approaches 0 from either side: the -axis is a vertical asymptote. On a screen, the two branches near run off the top and can look as if they join the axis; on paper they must clearly approach the dashed line and never meet it.
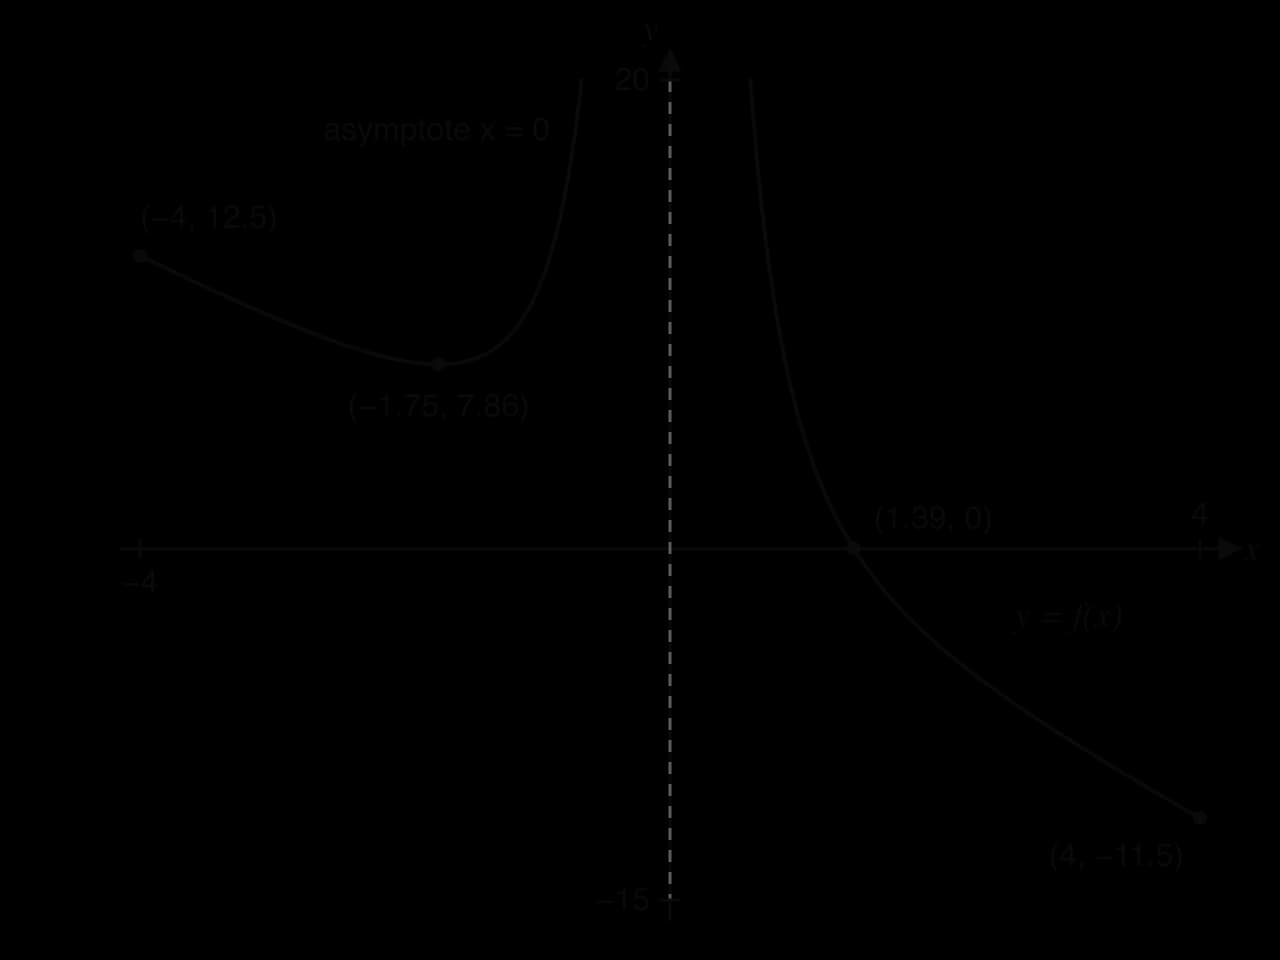
The sketch of shows every feature the GDC found, with coordinates to 3 significant figures: the left branch starts at , falls to a local minimum at and then climbs towards the asymptote; the right branch comes down from the asymptote, crosses the -axis at and ends at . There is no -intercept, because does not exist.
Sketching a sinusoidal model over a given domain
Periodic functions are where a careless sketch most often has the wrong shape. A wind turbine has its hub 80 m above the ground and blades 35 m long, and turns once every 4 seconds. The height, in metres, of the tip of one blade seconds after it points straight down is modelled by
The tip is lowest, m, when the cosine is 1, and highest, m, when the cosine is −1. The cosine returns to the same value every time increases by 360, so every 4 seconds. The parameters and their meanings belong to subtopic 2.5, Modelling with functions; graphing the model only needs these values.
Sketching from information or a context
Some sketches start from words, not formulas. The description fixes the key features, and the context fixes the shape between them. The method is to list the facts, turn each into a point, a line or a direction on the axes, and then join them with the simplest smooth curve that agrees with all of them.
The temperature inside a car parked in strong sunshine gives an example. The temperature is 22 °C when the car is locked, rises quickly at first, then more and more slowly, and never exceeds 52 °C.
Three facts follow from this description. The graph starts at . It rises throughout, steeply at first and then flattening. It approaches but stays below the line , which is a horizontal asymptote, drawn dashed. A curve that rises in a straight line, or levels off at 52 and then stops, contradicts the description.
 YouTube
Sums and differences of functions
Two functions with the same input can be combined output by output. If a shop's income from sales and its income from delivery charges both depend on the number of orders, the total income is the sum of the two functions; the money left after costs is a difference.
Subtracting works in the same way, output by output, but the order of the two functions now matters.
The rule works point by point, which gives a way to build the graph of a sum by hand. At each input, the height of is the height of plus the height of , with signs: where is negative the sum lies below , and where is zero the graphs of and meet. For example, with and :
Algebraically, and , and substituting into these gives the same 7 and 11. The order matters for a difference: , the negative of .
The domain of a sum or difference consists of the inputs where both functions are defined. If and , then needs for the square root and for the fraction, so its domain is the set of inputs that satisfy both conditions.
Graphing sums and differences on a GDC
A GDC builds the sum without any algebra. Store the two functions as and , then define (or ) by inserting the names and from the variables menu (VARS → Y-VARS → Function on a TI-84 Plus CE; on a Casio fx-CG50, VARS → GRAPH → Y followed by the function's number). This has two advantages over typing out the combined formula: there is no chance of an algebra or bracket error, and changing or updates automatically.
Graphing all three together shows how the sum is built. The functions and can be hidden afterwards (de-selected) so that only is drawn and the analysis tools act on it.
Revenue, cost and profit
The most common difference of functions in applied problems is profit. A business that sells items has a cost function (subtopic 2.2) and earns money from the sales.
Revenue is not the same as profit, because the costs of making the items have not yet been paid out of it.
Graphing , and on the same axes links the three. The profit at any is the vertical gap between the revenue and cost graphs, positive where revenue is above cost. Where the two graphs cross, the gap is zero, so the profit graph crosses the horizontal axis at the same . Those values are the break-even points, studied as intersections in subtopic 2.4.
Case study: the Keeling Curve as a sum of two functions
Since 1958, the concentration of carbon dioxide (CO₂) in the air has been measured continuously at Mauna Loa Observatory in Hawaii. The graph of the monthly averages, called the Keeling Curve after the scientist who began the record, rises year after year and also wobbles up and down within every year. The wobble is seasonal: the concentration is highest around May and lowest around September or October, because plants in the Northern Hemisphere, where most land is, take in CO₂ as they grow in spring and summer and release it as leaves decay in autumn and winter.
These two effects can be modelled separately and added. For the 24 months of 2024 and 2025, with the number of months after January 2024, fitting a straight line and a 12-month sine wave to the data together gives a long-term trend and a seasonal cycle (coefficients rounded):
Here is the CO₂ concentration in parts per million (ppm). The trend rises by 0.244 ppm a month, about 2.9 ppm a year, and the cycle adds up to 3 ppm above the trend or takes up to 3 ppm below it, a swing of about 6 ppm each year. The graph of the seasonal part alone shows a wave that repeats every 12 months.
- S(t) = 3sin(30t°)
On a GDC (in degree mode), the model is built exactly as a sum: , , , with window , . The resulting graph rides along the trend line, rising above it in the first half of each year and dropping below it in the second half. Against the measured monthly averages, the sum follows the data closely.
Month | Jan 2024 | Apr 2024 | Jul 2024 | Oct 2024 | Jan 2025 | Apr 2025 | Jul 2025 | Oct 2025 |
|---|---|---|---|---|---|---|---|---|
0 | 3 | 6 | 9 | 12 | 15 | 18 | 21 | |
Measured CO₂ (ppm) | 422.80 | 426.51 | 425.55 | 422.38 | 426.65 | 429.64 | 427.87 | 424.87 |
Model (ppm) | 423.20 | 426.93 | 424.66 | 422.40 | 426.13 | 429.86 | 427.59 | 425.32 |
Source: NOAA Global Monitoring Laboratory, Mauna Loa CO₂ monthly mean data (co2_mm_mlo), accessed October 2026.
- trend T(t)
- C(t) = T(t) + S(t)
Every model value is within about 1 ppm of the measurement, against a seasonal swing of about 6 ppm, so the sum captures both effects. The table also shows the model's main weakness. The real cycle is lopsided: the concentration climbs slowly from October to May and falls quickly from June to September, while a sine curve rises and falls at the same rate. The model therefore peaks in April ( and ) rather than in May, and it is too high in spring and too low in early summer. A straight trend is also only right for a short period: over the whole record since 1958 the yearly increase has itself grown, so extending decades into the past or future would be extrapolation beyond what the model can support.
Exam focus
Graphing appears in most function questions on Paper 2 and in many on Paper 1. The graph is rarely the whole question: a typical part asks you to sketch a function, often one not met before, worth 2 to 4 marks, followed by parts that use the graph to find a maximum, solve an equation or interpret the result in context. Draw appears when an accurate graph is needed on given axes or graph paper, often to add a line; plot appears with data. Sums and differences appear mainly as profit, revenue and cost, or as a total built from two parts.
What the markscheme rewards on a sketch:
the correct shape: rising and falling in the right places, the right curvature, smooth, with asymptotic behaviour that approaches but does not cross or veer away from the asymptote;
key points labelled with coordinates (or values marked on the axes): maximum, minimum, intercepts, and any point the question names;
the curve drawn in the given domain only;
axes labelled with the question's variables and some indication of scale.
The GDC is expected throughout. Write down the function you entered and, if it helps, the window; give coordinates found with the analysis tools to 3 significant figures, not values read with the trace cursor.
Answers in context need care with units. Here is in hundreds of cases and in hundreds of dollars, so the GDC's 5.22 and 57.8 become 522 cases and $5780.
A common trap combines the window and the domain. The question restricts to , so the sketch must end at ; a GDC left on its default window would show the cubic continuing beyond both ends.
Practice questions
The function is defined by . Determine whether the point lies on the graph of . [2]
Explain the difference between the command terms draw and sketch when applied to the graph of a function. [2]
A rectangular field has perimeter 200 m and width m. Its area is . (a) Write down a suitable domain for . (b) Write down a suitable viewing window for graphing on a GDC. [3]
Let , . Sketch the graph of for , labelling the zero, the local minimum and the end points with their coordinates, and showing the vertical asymptote. [4]
Let and . (a) Find and . (b) Write down an expression for . [3]
A seat on a Ferris wheel has height metres, seconds after the ride starts. Sketch the graph of for , labelling the maximum and minimum points. [3]
A theatre sells tickets for $18 each. The cost of putting on a show for people is dollars, for . (a) Write down the revenue function. (b) Find the profit function. (c) Find the smallest number of tickets that must be sold to make a profit. [5]
A cup of coffee is poured at 85 °C into a room at 20 °C. It cools quickly at first and then more slowly, getting closer and closer to room temperature. Sketch a graph of its temperature against time, labelling the key features. [3]
A function is given by , . (a) Find the coordinates of the local maximum and local minimum points. (b) Write down the greatest value of on the domain, and explain why it is not at the local maximum. [5]
Answers
, so yes, lies on the graph.
A drawing is accurate and to scale, with points plotted correctly and joined by a ruled line or smooth curve; a sketch shows the general shape and the relevant features, labelled, but need not be to scale.
(a) (width and length both positive). (b) For example , ; the largest area is .
GDC: , window , . Zero (); local minimum (); end points and (); vertical asymptote , both branches rising towards it.
(a) , ; , . (b) .
Degree mode; minimum points and ; maximum points and , the second also the end point. Symmetrical about , period 60 s, drawn only for .
(a) . (b) . (c) at ; profit needs at least 172 tickets.
Start at ; decreasing curve, steep at first then flattening; dashed horizontal asymptote , approached from above but never reached; axes labelled time and temperature (°C).
(a) GDC maximum , minimum (). (b) , so the greatest value is 121 (120.96), at the end point . After the local minimum the curve rises again and passes the local maximum value of 80 before the domain ends, so the end point must be checked as well as the turning points.
Summary
The graph of a function is the set of points ; a point lies on exactly when .
A table of values gives exact points to plot; points from a continuous function are joined by a smooth curve, points from a discrete domain are left unjoined.
The viewing window decides what part of the graph is seen: set to the domain, choose from the table or by automatic scaling, and zoom out to check nothing is hidden.
Read features with the GDC's analysis tools (value, zero, maximum, minimum, intersection), not the trace cursor; use degree mode for trigonometric models.
Plot marks points; sketch gives the shape with labelled key features, not to scale; draw gives an accurate graph to scale.
Transferring a graph to paper: set the window, find every key feature, label the axes with the question's variables, mark the features, join them smoothly, respect asymptotes, and stop at the end points.
A sketch from words turns each fact into a point, line or direction, then joins them with the simplest smooth curve that agrees with all of them.
and ; on a GDC use or .
Profit = revenue − cost, ; the profit graph is zero where the revenue and cost graphs cross.
Self-check
- To do:
I can test whether a point lies on a graph by substituting into .
- To do:
I can make a table of values and use it to plot points.
- To do:
I can decide whether plotted points should be joined by a smooth curve.
- To do:
I can enter a function with fractions, powers and negative signs correctly, using brackets.
- To do:
I can choose a viewing window from a domain and a context, and change it when features are hidden.
- To do:
I can set my GDC to degree mode before graphing a trigonometric model.
- To do:
I can find coordinates with the analysis tools rather than the trace cursor.
- To do:
I can explain the difference between plot, sketch and draw.
- To do:
I can draw an accurate graph with a suitable scale on each axis.
- To do:
I can transfer a GDC graph to paper with labelled axes, coordinates, asymptotes and end points.
- To do:
I can sketch a graph from a description in words.
- To do:
I can calculate and for a given and graph them with .
- To do:
I can write a profit function from revenue and cost, using brackets correctly.
- To do:
I can interpret the zeros and the maximum of a profit graph in context.
Questions on 2.3
33 exam-style questions on this subtopic, written in the style of the IB papers. The first has its markscheme open. Counted on
Question 1 · AI-002546 marks
A museum opens a new dinosaur exhibition. The number of visitors to the exhibition, thousand per week, weeks after it opens, can be modelled by
- (a)
Sketch the graph of for , labelling the maximum point with its coordinates.
3 marks
Markscheme (a)
A1 for a curve starting at the origin, increasing to a single maximum, then decreasing towards (but not reaching) the -axis
A1 for the maximum point labelled
A1 for the curve drawn only for , ending at approximately , above the -axis
Note: Award the second mark for the maximum within half a grid square if coordinates are not written, provided the scale is shown.
[3 marks]
- (b)
Write down the greatest number of visitors in one week, according to the model.
1 mark
Markscheme (b)
visitors (accept ) A1
Note: Accept thousand. Do not accept alone without reference to thousands.
[1 mark]
- (c)
Find the values of for which there are visitors per week.
2 marks
Markscheme (c)
sketch of with the line OR (M1)
and A1
Note: Award A1 only if both values are given.
[2 marks]
Question 2 · AI-002556 marks
Femi is investigating how bright a lamp appears at different distances. The intensity of the light, lux, at a distance of metres from the lamp is given by , for .
The following table shows some values of .
(m) | 1 | 1.5 | 2 | 3 | 4 | 5 | 6 |
|---|---|---|---|---|---|---|---|
(lux) | 36 | 9 | 2.25 | 1.44 | 1 |
- (a)
Find the value of and the value of .
2 marks
- (b)
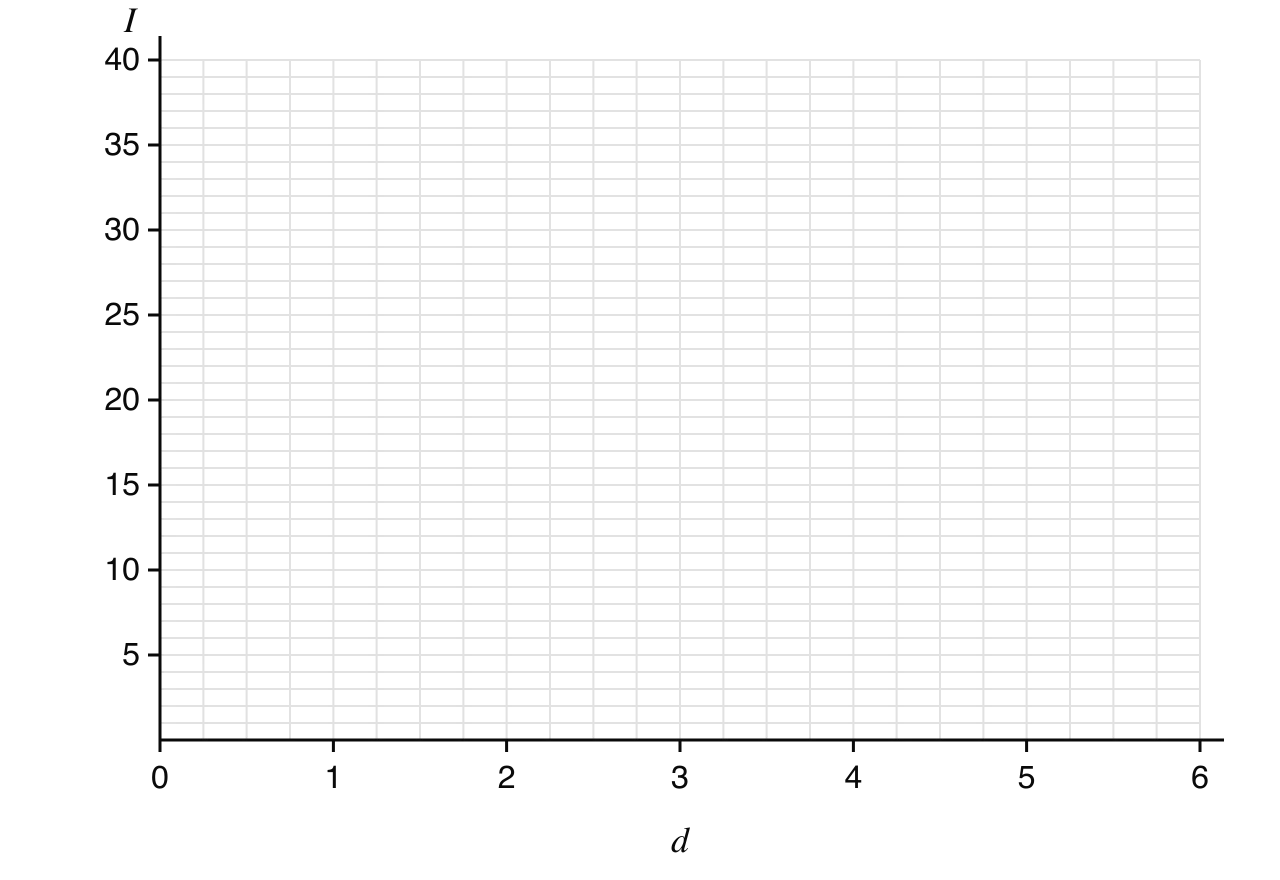
On the following grid, draw the graph of for .
3 marks
- (c)
Use your graph to estimate the distance from the lamp at which the intensity is 6 lux.
1 mark
Answer it, then compare with the markscheme.Check this one with a free account
Question 3 · AI-002566 marks
Hannah pours a cup of tea at and leaves it on her desk in a room kept at a constant . The tea cools quickly at first and then more and more slowly, getting closer and closer to the temperature of the room.
Let be the temperature of the tea, in , minutes after it was poured.
- (a)
Sketch a graph of against for . Label clearly the value where the graph meets the -axis and the equation of any asymptote.
3 marks
- (b)
The temperature of the tea can be modelled by .
Find the time it takes for the tea to cool to .
2 marks
- (c)
Hannah claims that, according to the model, the tea will eventually cool to . Explain why she is wrong.
1 mark
Answer it, then compare with the markscheme.Check this one with a free account
Carry on with 2.3 in Augment
With a free account, Augment remembers where you stopped and what you have practiced.