Notes on 2.8 Transformations of graphs
Learning objectives
Sketch the image of a graph under a translation or , and write down the translation vector.
Sketch the image of a graph under a reflection in the -axis, , or in the -axis,
Sketch the image of a graph under a vertical stretch or a horizontal stretch , and state the scale factor and the invariant axis.
Find the image of a point, an intercept or an asymptote under a transformation.
Find the equation of a transformed graph from a description of the transformations.
Describe a sequence of transformations that maps one graph onto another, using correct mathematical language.
Explain why the order of transformations can change the result, and determine the correct values when the order is changed.
Interpret transformations of graphs in context, such as a tax on producers, a change of time origin or sinusoidal models of different sizes.
Introduction
Many graphs in applied mathematics are versions of a few basic shapes. The graph of a Ferris wheel passenger's height against time, the voltage of a mains supply and the daily temperature cycle are all the same cosine curve, moved, flipped and stretched by different amounts. Knowing how each change to an equation moves its graph means that one well-understood graph gives a whole family, and that the parameters of a model can be read from the features of its graph.
The transformations involved are translations, reflections and stretches. Each one has a simple rule for how the equation changes and a matching rule for how every point on the graph moves.
Transformations and images
A transformation changes the position, orientation or shape of a graph by moving every point on it according to one rule.
The original graph is called the object. Each point of the object has exactly one new position, and the set of all the new positions forms the transformed graph.
There are two ways to work out the effect of a transformation. The first is to track a few key points, such as intercepts, turning points and end points, and move each one by the rule. The second is to change the equation and graph the result with the GDC. The two approaches should agree, and checking one against the other is the most reliable way to avoid the most common error, which is moving a graph in the wrong direction.
In each rule, the base function is any function: a line, a quadratic, an exponential, a sinusoid or a function never met before. Because the rules act on the input or on the output , they work for every function in the same way, so one set of rules covers every graph used in modelling.
Translations
A translation slides a graph without turning or reshaping it. Every point moves the same distance in the same direction.
Vertical translation: y = f(x) + b
Adding to the output adds to every -coordinate. A point on the graph of
Horizontal asymptotes move with the graph. The exponential has asymptote , so
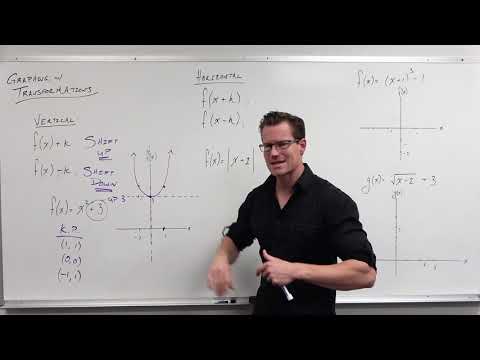
Horizontal translation: y = f(x − a)
Replacing by moves the graph units to the right when , even though the minus sign seems to point to the left. The reason lies in what the new function needs as input. The graph of
So is the graph of moved 3 units right and
The graph shows the vertex of at the origin moving to under
The translation vector
A translation that moves a graph units horizontally and units vertically is written as a column vector. The top number is the horizontal movement (positive to the right) and the bottom number is the vertical movement (positive upwards).
A translation by combines both rules: replace by and add
The order of the horizontal and vertical parts of a translation does not matter, because one changes only -coordinates and the other only -coordinates.
When a question gives two points on a translated graph and asks for the translation, each point gives an equation. Solving the pair finds both components of the vector.
Translating to reduce rounding errors
A horizontal translation is often used with real data before a model is fitted. Fitting a model to calendar years such as 2017, 2018 and 2019 makes the coefficients enormous, and rounding them can make the model's predictions useless. Using = years since 2000 instead translates the data 2000 units to the left, so the inputs are small numbers and the coefficients are of a sensible size.
Suppose a quantity is modelled by , where is the number of years since 2000 (a hypothetical model). In terms of the calendar year , this is
For 2020, both forms give . If the calendar-year coefficients are rounded to 3 significant figures, the model becomes , which gives
A tax on producers
In economics, a supply curve gives the price at which producers will supply a quantity . If the government charges producers a tax of a fixed amount on every unit sold, each producer needs that much more per unit to supply the same quantity. The whole supply curve is translated vertically upwards by the amount of the tax.
Suppose the supply of a product is and the demand is , with in dollars and
The market equilibrium is where supply meets demand. Before the tax, gives thousand units at
Reflections
A reflection flips a graph over a mirror line. Every point is moved to the same distance on the other side of the line.
Reflection in the x-axis: y = −f(x)
Multiplying the output by changes the sign of every -coordinate: points above the -axis go below it and points below go above.
Points on the -axis have , and , so the zeros of are invariant points: they stay where they are. A local maximum becomes a local minimum and the other way round. A horizontal asymptote
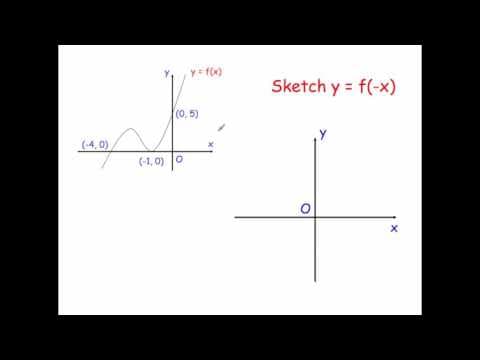
Reflection in the y-axis: y = f(−x)
Replacing by means the new graph takes at the value that took at . Every point moves to the other side of the
The -intercept is invariant, because it lies on the mirror line. A vertical asymptote becomes . An increasing graph becomes decreasing, and the other way round. Exponential decay is the reflection of exponential growth in the -axis:
The graph shows the point on mapping to under the reflection in the
Symmetry and reflections
Some graphs are unchanged by a reflection. If for every , as for or
Stretches
A stretch pulls a graph away from one axis, or pushes it towards that axis, by the same factor everywhere. Unlike a translation, it changes the shape of the graph.
Vertical stretch: y = pf(x)
Multiplying the output by multiplies every -coordinate by , so every point moves vertically to times its distance from the -axis.
Points on the -axis have , and , so they do not move. The zeros of are the same for
Invariant lines
Under a vertical stretch every point of the -axis stays exactly where it is, so the -axis is a line of invariant points. Every vertical line is also mapped onto itself, though its points slide along it. Both are examples of an invariant line.
Horizontal stretch: y = f(qx)
Replacing by changes the inputs. The new graph takes the value when , that is at
So squashes the graph to half its width (scale factor ), and
The graphs of and , drawn in degrees, show both stretches at once.
The maximum of maps to : the -coordinate is halved by the horizontal stretch and the
Case study: mains electricity
The voltage of a mains electricity supply alternates in a sine wave. In much of the world the nominal supply is 230 V at a frequency of 50 Hz, while in North America the most common supply is 120 V at 60 Hz. These voltages are root mean square (rms) values; for a sine wave the peak voltage is times the rms value, so the peaks are
Both waveforms are stretches of the single curve , with measured in radians (subtopic 3.7), whose period is . For a period of
The 120 V wave is the image of the 230 V wave under two stretches. Vertically, the peak changes from 325 V to 170 V, a vertical stretch with scale factor
The zeros of the 230 V wave at s move to of those times. The -axis is invariant under the vertical stretch, so the zeros are moved only by the horizontal stretch. The model is an idealisation. Real supplies may vary from the nominal voltage (in the UK by up to 10% above and 6% below 230 V), and their waveforms are not perfect sine waves.
 YouTube
Composite transformations
Most graphs in applications are the result of more than one transformation. Applying transformations one after another gives a composite transformation, in the same way that applying functions one after another gives a composite function (subtopic 2.7).
When the order matters
Two transformations that act in different directions, one on and one on , can be applied in either order. A horizontal translation followed by a vertical stretch gives the same graph as the stretch followed by the translation, because one changes only -coordinates and the other only -coordinates.
Two transformations that act in the same direction usually cannot be swapped. Starting from :
The second order stretches the translation as well, so the vertex ends at instead of . To reach with the translation first, the translation must be
Reading the order from the equation
For vertical changes, the order follows the order of arithmetic on the output. In , the output of is multiplied by first and then is added, so the vertical stretch comes before the vertical translation.
For horizontal changes, the order follows what happens to before acts, read the other way round. In , the graph of
This form describes the image of under: a horizontal stretch with scale factor , a horizontal translation of , a vertical stretch with scale factor
Finding the equation of a transformed graph
To build the equation from a description, apply the transformations one at a time, in the stated order, changing the equation at each step: replace by or by for horizontal changes, and act on the whole expression for vertical changes. Writing each intermediate equation avoids errors.
A question may instead give the transformed equation and ask for an unknown scale factor or translation. Writing the general image with the unknowns, then matching coefficients with the given equation, finds them.
Transforming an asymptote and key points together
When a graph is given only as a sketch with labelled points, the transformed graph is drawn by moving each labelled point and each asymptote by the point mapping, then joining them with the same shape. Asymptotes must be moved and labelled too.
Sinusoidal models as transformations
Every sinusoidal model is a transformed cosine or sine curve, and its amplitude, period and principal axis are the effects of particular transformations: the amplitude is the vertical scale factor, the period is (or ) times the horizontal scale factor, and the principal axis is the vertical translation. A horizontal translation moves the curve sideways; in subtopic 2.9 this is called a phase shift.
The London Eye has a diameter of 120 m and a height of 135 m, so its lowest point is 15 m above the ground, and it turns once in about 30 minutes. Subtopic 2.5 models a passenger's height metres, minutes after boarding at the bottom, as . From
A smaller fairground wheel with a diameter of 40 m, its lowest point 3 m above the ground and one turn every 10 minutes (hypothetical figures) has . Its graph is the image of the London Eye graph under a vertical stretch with scale factor
The maximum of the London Eye curve maps to : the time is divided by 3 and the height becomes
 YouTube
The six basic transformations
Equation | Transformation of | Point mapping | Invariant |
|---|---|---|---|
translation by |
Changes outside the function act on in the direction they appear to; changes inside the bracket act on in the opposite way (subtract to move right, multiply by to scale by ).
Exam focus
Transformations of graphs are examined on Paper 1 in short questions of 3–7 marks and inside longer Paper 2 questions on models, especially sinusoidal models, and sometimes combined with areas or volumes from calculus. Common shapes are: describe a sequence of transformations from one graph to another; find the equation of a graph after described transformations; find the image of a point, an intercept or an asymptote; sketch a transformed graph from a given sketch with labelled points; and find unknown parameters such as a translation vector from points on the image. Questions use describe, write down, find, sketch and draw.
Descriptions of transformations earn their marks only with the correct name and the correct size and direction. "Translation by ", "horizontal translation of 1 unit to the right", "vertical stretch with scale factor 3" and "reflection in the -axis" all earn full credit. Words such as "move", "shift" on its own, "slide" or "enlarge" do not. For a stretch, name the direction (vertical or horizontal, or "parallel to the -axis") and give the scale factor as a number,
When asked to sketch or draw a transformed graph, mark the images of every labelled point, draw any asymptote as a dashed line with its equation, and keep the shape of the original. A sketch with a missing or unmoved asymptote loses marks even when the curve is correct.
Practice questions
The graph of passes through . Write down the image of this point on the graph of (a)
Answers
(a) (b) (c) (d)
Summary
A translation by gives
Self-check
- To do:
I can write the point mapping for each of the six basic transformations.
- To do:
I can explain why moves a graph to the right.
- To do:
I can write a translation as a column vector and use it to write the new equation.
- To do:
I can tell the reflection