Criteria B and C: planning and system overview
Decompose your IA problem and plan it with a Gantt chart or sprints (Criterion B), then design it with a system model, algorithms and a test plan clear enough for someone else to rebuild it (Criterion C), with weak and strong samples.
- IB Computer Science
- Internal assessment
- SL and HL
Criteria B and C at a glance
Criteria B and C turn the specification from Criterion A into a plan and a design. B (Planning) is worth 4 marks and C (System overview) 6 marks. Each has a recommended length of only 150 words, because most of the evidence is diagrams and tables, and diagrams do not count towards the 2,000-word limit. Ten of the 30 marks therefore depend mainly on drawing the right diagrams and making them consistent with each other.
Both criteria must stay consistent with what comes before them: the plan in B with the problem and success criteria in A, and the system overview in C with both A and B. A component that appears in the decomposition but nowhere in the design, or a success criterion that no test in C checks, is a visible gap.
Criterion B: planning
Criterion B judges two things: how well you have broken the problem into parts, and whether your plan covers the success criteria with a sensible order and dates.
Part | 1–2 marks | 3–4 marks | What the step up means |
|---|---|---|---|
Decomposition | Constructs a partial decomposition of the problem scenario | Constructs a reasonable decomposition of the problem scenario | Every essential component is there, broken down far enough to plan from |
Plan | Constructs a plan that addresses some of the success criteria | Constructs a plan that addresses the success criteria | Every success criterion is covered by the plan, with a chronology from planning to evaluation |
Decomposing the problem
Decomposition means breaking the problem scenario from Criterion A into smaller sub-problems or components, each of which can be designed, built and tested on its own. The IB describes a reasonable decomposition as one that breaks the problem into the essential components that support the construction of a plan. The usual way to show it is a decomposition diagram: the whole system at the top, its main components below, and the tasks inside each component below those.
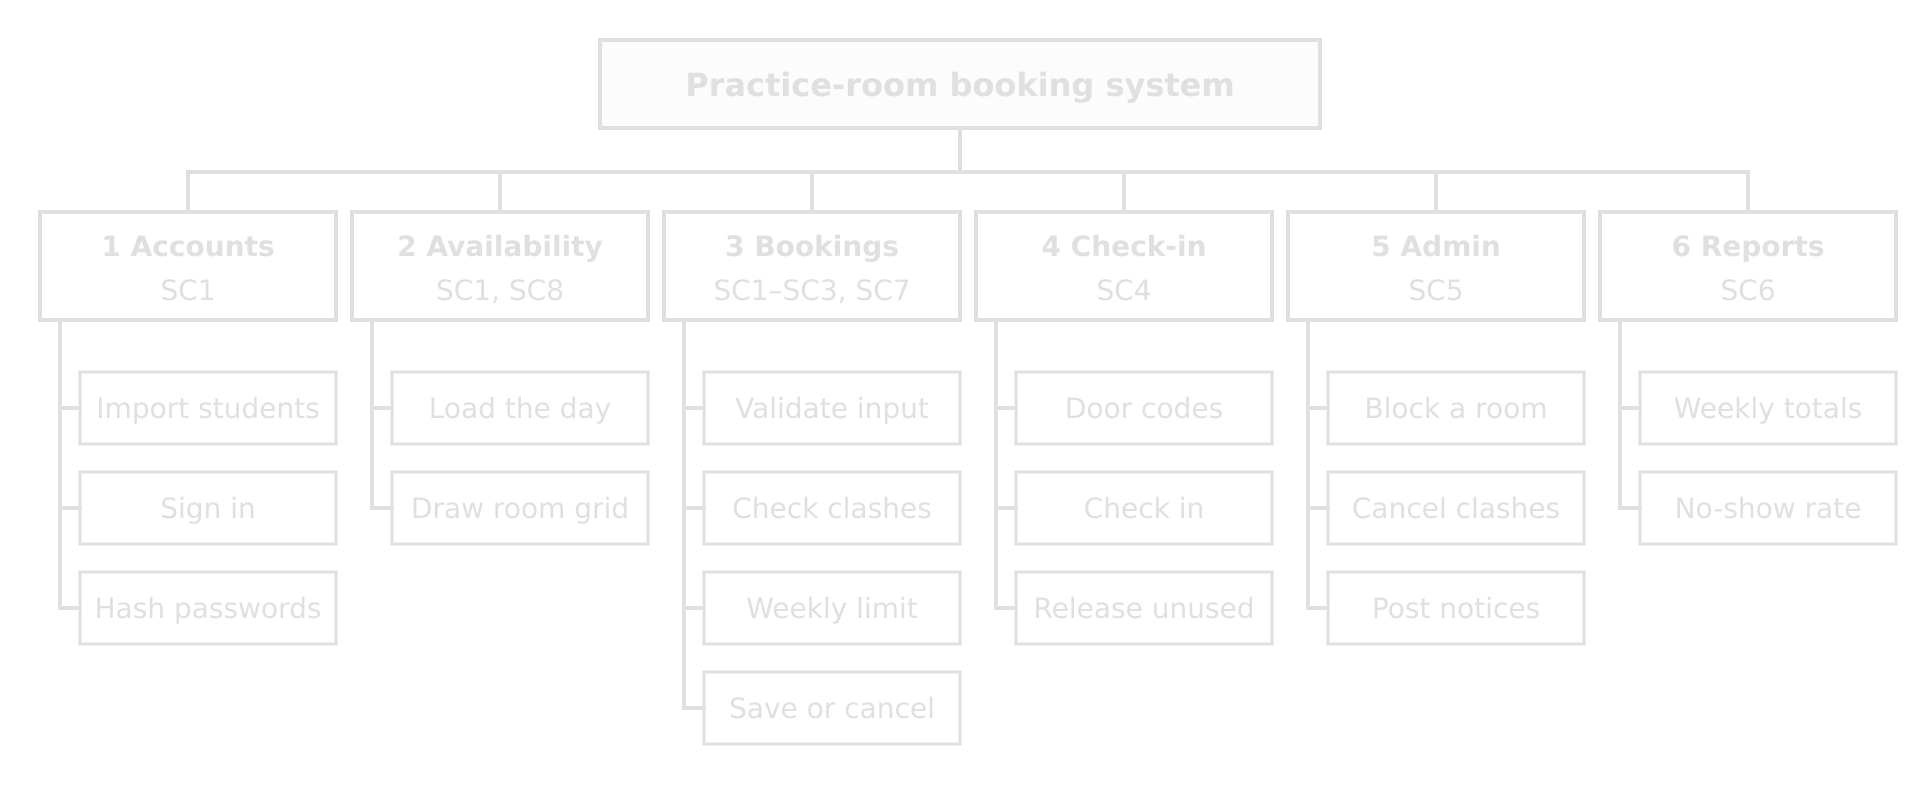
Three choices make a decomposition reasonable rather than partial. The components are parts of the product ("Bookings", "Check-in"), not stages of the project. The breakdown stops at tasks small enough to plan, typically one to three days of work each. And every component is traced to success criteria, which is the link the B descriptors ask for.
 YouTube
A plan with a chronology
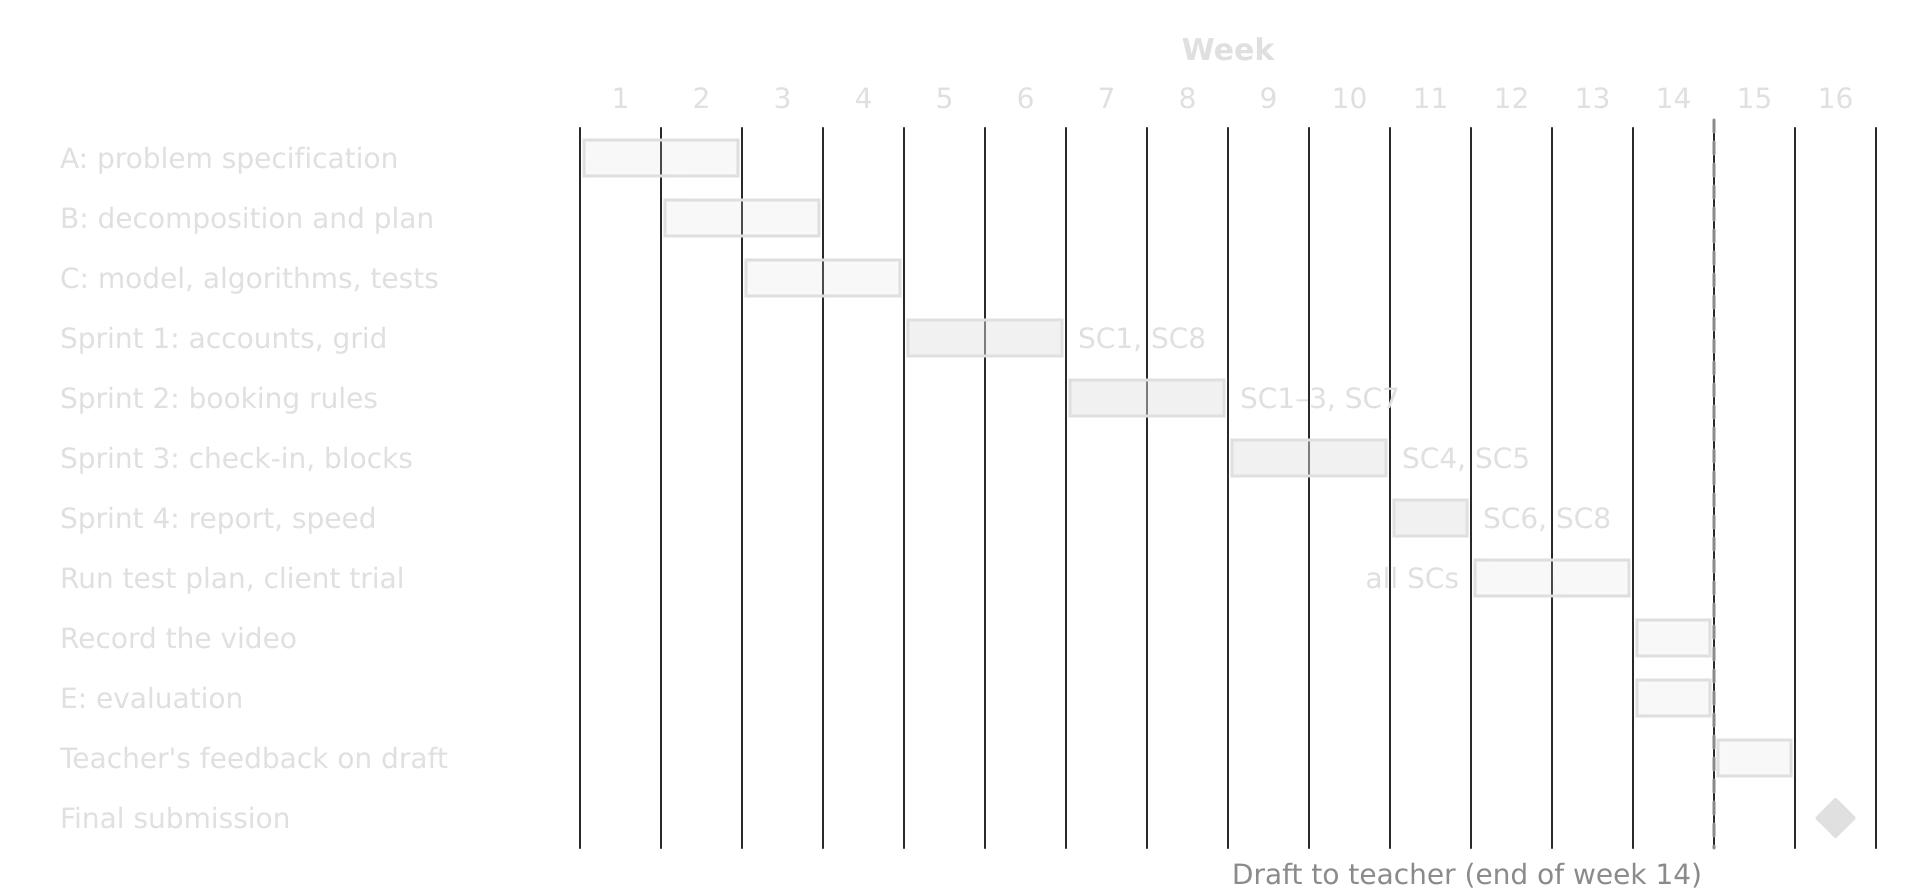
The plan must cover the success criteria and include a proposed chronology for planning, designing, developing, testing and evaluating. Any clear form is acceptable; the IB names Gantt charts and agile charts as effective formats. A Gantt chart lists tasks down the side and time along the bottom, with a bar for each task's duration. Subtopic A1.3 uses Gantt charts to show how an operating system schedules processes on a CPU; the IA uses the same kind of chart for its original purpose, scheduling the work of a project.
The Gantt chart is named after Henry Gantt, who designed it in about 1910–1915 to schedule and track work. Source: Wikipedia, "Gantt chart".
The chart shows three planning decisions. The specification, plan and design come before any development; the riskiest rules (clashes and the weekly limit, SC2 and SC3) are built early, in sprint 2; and the last weeks hold testing, the video and the evaluation, so that the one draft your teacher reads is complete.
Agile development and sprints
Many IA plans follow an agile approach instead of a single long build. The product is built in short cycles, each ending with something that works and can be tested.
The agile approach was set out in the Manifesto for Agile Software Development, written by 17 software practitioners at Snowbird, Utah, in 2001. Sources: Wikipedia, "Agile software development" and "Scrum (software development)".
For an IA, agile suits a project where the client's feedback may change details: the head of music might see the first room grid and ask for lessons to be shown differently. It also reduces risk, because each finished sprint leaves tested, working parts even if a later sprint runs short. Its weakness for an IA is that Criterion B still needs a proposed chronology at the start, so the sprints must be planned in advance, then adjusted.
An agile plan is often shown as a sprint table. Each row is a piece of work written from the user's point of view, called a user story, tagged with the success criteria it serves and given a definition of when it is done.
Sprint (weeks) | User story | Success criteria | Done when |
|---|---|---|---|
1 (5–6) | As a student, I want to see which rooms are free today so that I can choose one | SC1, SC8 | Grid shows bookings and blocks from the database; loads in under 2 s with 2,000 bookings |
2 (7–8) | As a student, I want to book a free slot so that nobody else can take it | SC1, SC2, SC3, SC7 | Tests T1–T9 and T15–T16 pass |
3 (9–10) | As the head of music, I want unused rooms freed so that other students can practise | SC4 | Tests T10–T12 pass |
3 (9–10) | As the head of music, I want to block a room for a lesson so that no student is booked into it | SC5 | Test T13 passes; affected students see a notice |
4 (11) | As the head of music, I want a weekly report so that I can see how rooms are used | SC6, SC8 | Test T14 matches the hand-calculated report |
Research in the plan
The plan may include research, such as the existing code libraries you will use. Recording it in B shows that you know which parts you will write yourself and which you will take from a library, which matters later in Criterion D. For the booking system, the research is short: the Flask web framework for pages and forms, the sqlite3 module from Python's standard library for the database, and a library function for hashing passwords, since writing a secure hashing function is neither the point of the project nor a safe thing to do from scratch.
A weak and a strong Criterion B
Weak sample
Decomposition. A single list: "1. Login. 2. Booking page. 3. Admin page. 4. Testing."
Plan. "I will start in September, code in October and November, test in December and finish in January."
The weak sample's decomposition lists screens and a stage of work, misses the rules (clashes, limits, release, reports) and is not linked to any success criterion: a partial decomposition. The plan has a rough order but no tasks, no link to the success criteria and no time for evaluation, so it addresses only some of them. It fits the 1–2 band.
Strong sample (about 140 words, plus two diagrams)
Decomposition. The decomposition diagram (Figure B1) splits the system into six components. Each component is labelled with the success criteria it delivers; every criterion from SC1 to SC8 appears at least once. Component 3, Bookings, is the largest because it enforces three rules (SC2, SC3, SC7).
Plan. The Gantt chart (Figure B2) covers 16 weeks. Specification and design (weeks 1–4) come before development. Development runs in three two-week sprints and a one-week sprint, each delivering complete success criteria; the clash and weekly-limit rules come first because the rest of the system depends on them. Testing against the full test plan and a two-week client trial follow in weeks 12–13, then the video and evaluation in week 14, before the draft goes to my teacher.
Research. Flask (web pages), sqlite3 (database, in Python's standard library) and a library password-hashing function.
Criterion C: system overview
Criterion C is the design of the product. It asks for three things: a system model, algorithms for the components, and a testing strategy. The IB adds a test of quality: the overview should be clear enough for a third party to recreate the product.
Part | 1–2 marks | 3–4 marks | 5–6 marks |
|---|---|---|---|
System model | Outlines a limited system model | Constructs a system model that is not complete | Constructs a complete system model |
Algorithms | Identifies algorithms for the components | Constructs algorithms that lead to partial functionality | Constructs algorithms that enable the product to perform |
Testing strategy | Identifies a testing strategy for at least one success criterion | Outlines a testing strategy aligned with at least three success criteria | Describes a testing strategy aligned with the success criteria |
The command terms mark different amounts of work. "Identifies algorithms" can be satisfied by naming them; "constructs algorithms that enable the product to perform" means writing them out fully enough that the product could be built from them. A testing strategy aligned with three success criteria matches the middle band, while the top band asks for alignment with the success criteria as a whole, so plan tests for all of them.
The system model
The system model is a set of diagrams showing the components of the system, how they are connected, the rules governing how they interact, and the design of the user interface. A complete system model does not include the algorithms: those come separately, one per component. Keeping the two apart makes the model easier to read and makes it obvious when a component has no algorithm.
Which diagrams make up the model depends on the computational context. Most products need one diagram showing the parts and the data moving between them, one showing the stored data, and the screen designs.
Diagram | Shows | Suits |
|---|---|---|
Data flow diagram | Processes, data stores, external people and systems, and the data passing between them | Any product that takes in, stores and outputs data |
The tables or entities, their attributes and keys, and how they relate | Products with a relational database | |
The classes, their attributes and methods, and the relationships between them | Object-oriented programs, games, simulations | |
Wireframe | The layout of each screen: its controls, data and navigation | Every product with a user interface |
Structure or navigation diagram | Which screens or modules lead to which | Web and mobile apps with several screens |
Data flow diagram
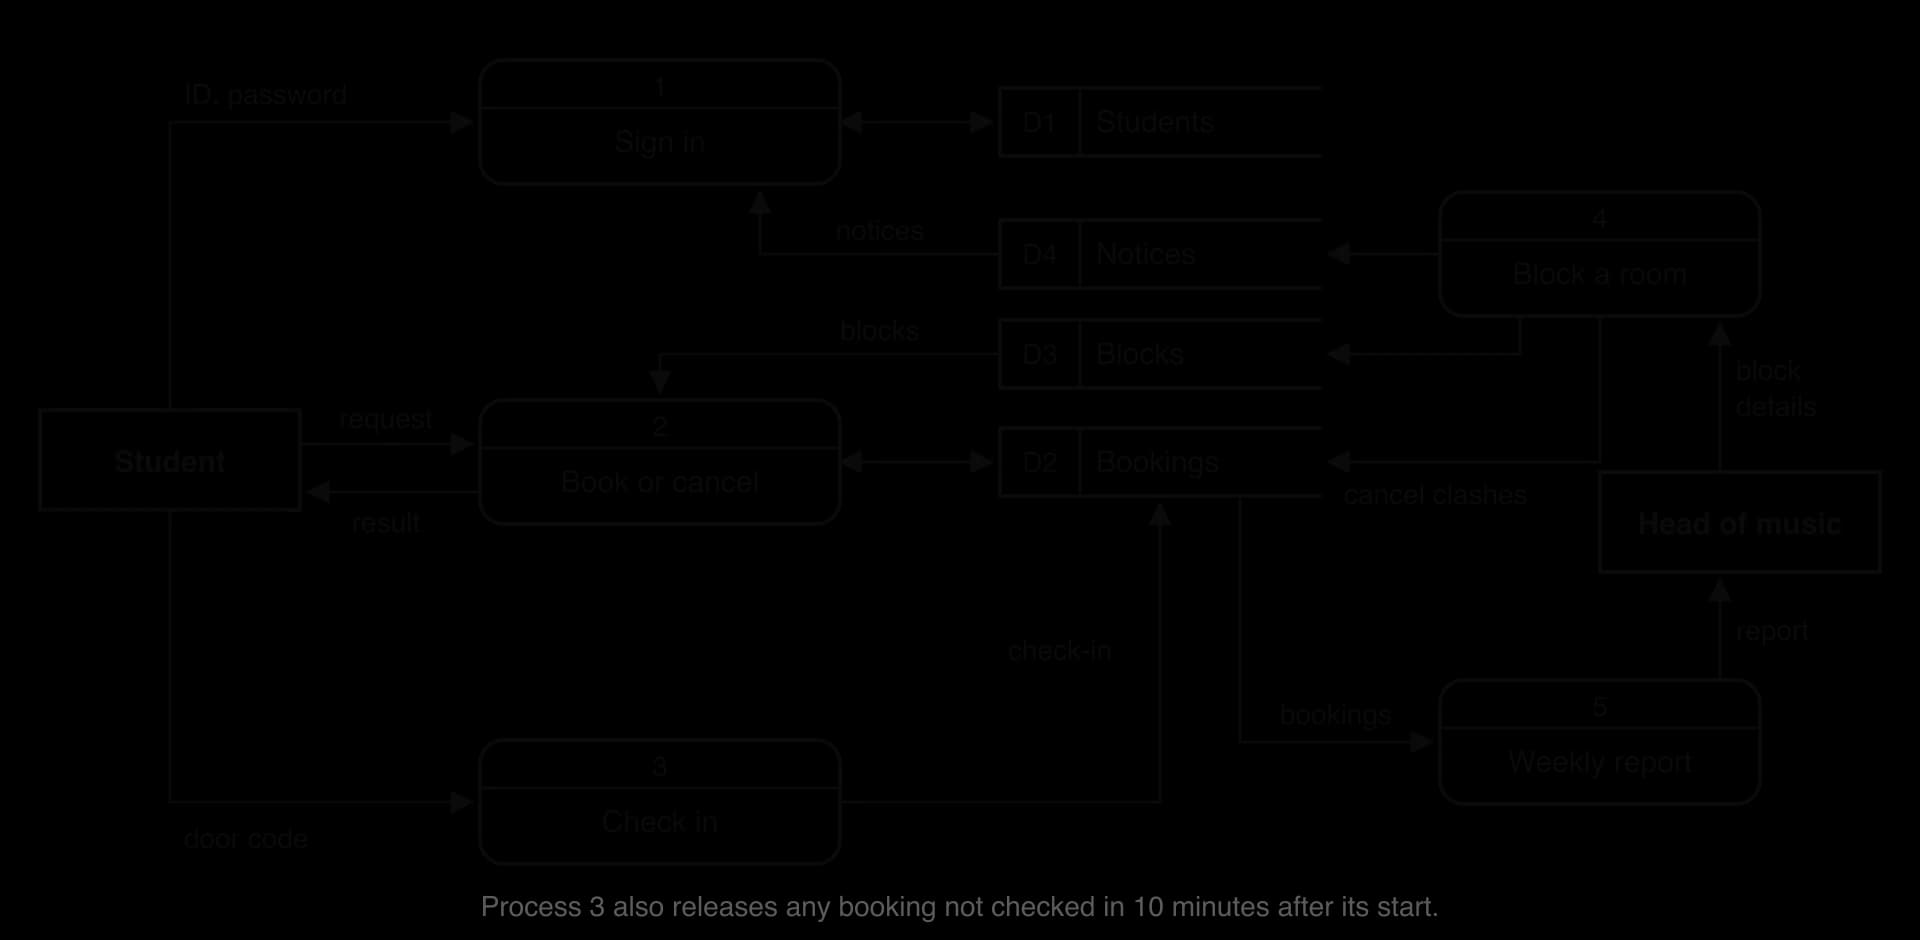
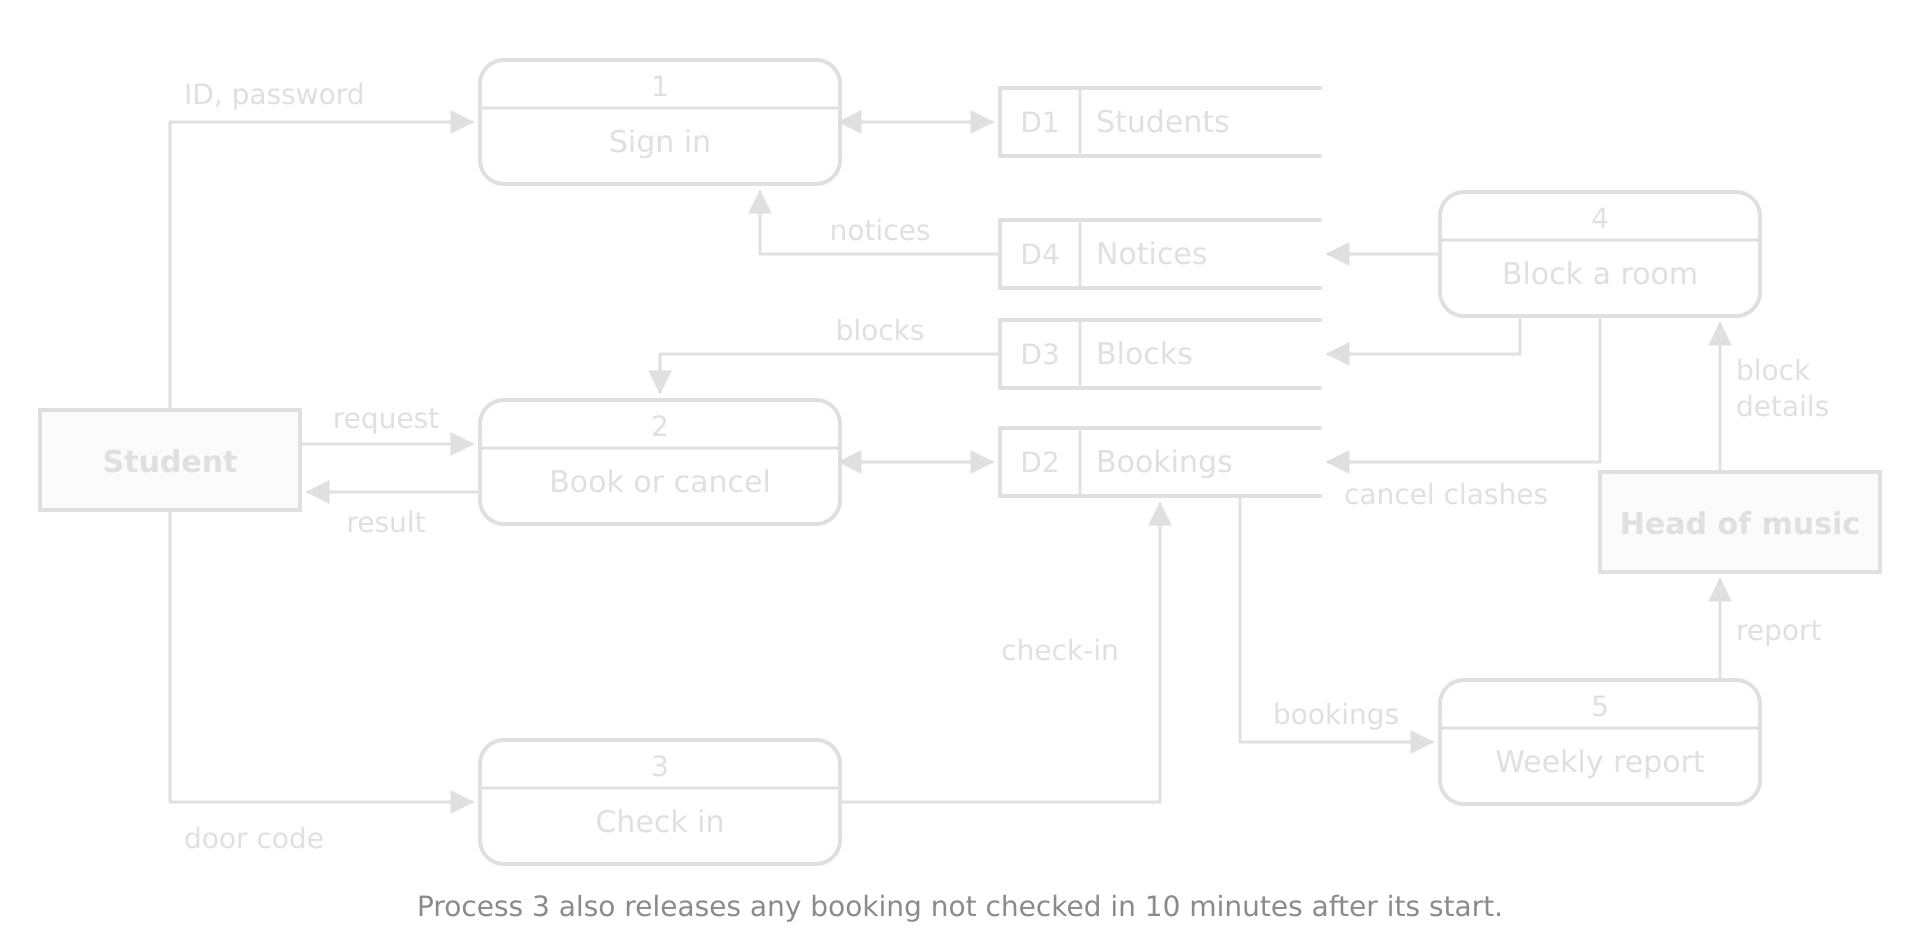
The booking system's DFD has two external entities (the student and the head of music), five numbered processes and four data stores. Each arrow is labelled with the data that travels along it.
Entity–relationship diagram
The data stores in the DFD become tables in the database. The ER diagram defines them precisely: each table's attributes, its primary key, its foreign keys and the relationships between tables, drawn in crow's foot notation as in subtopic A3.2, Database design.
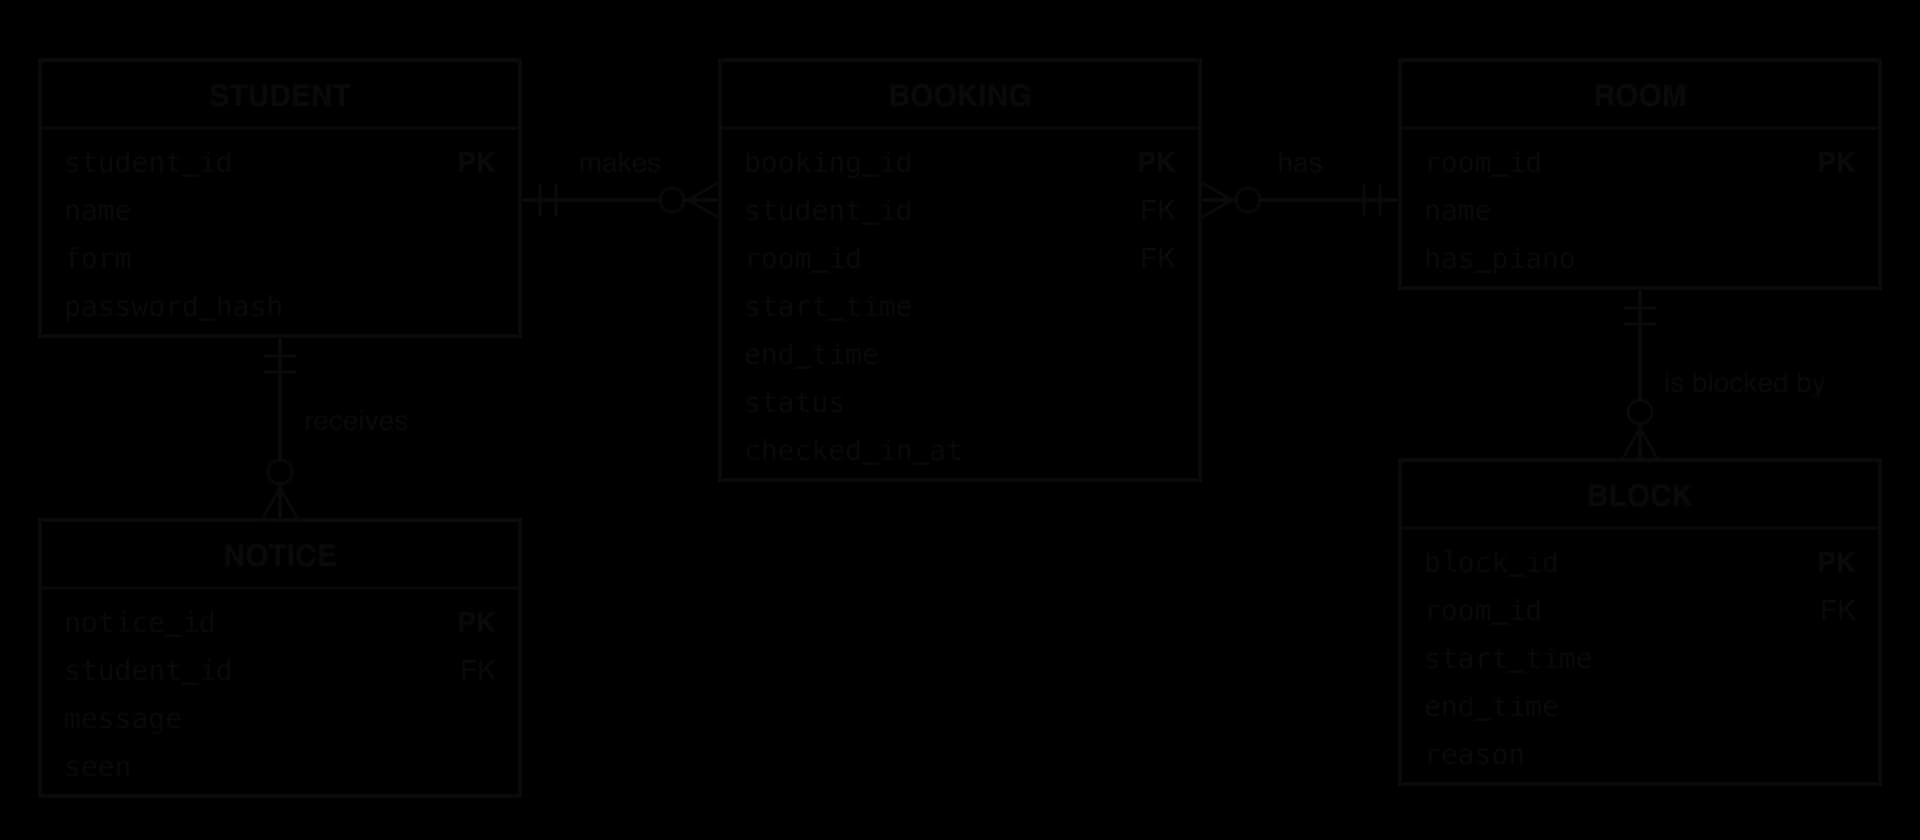
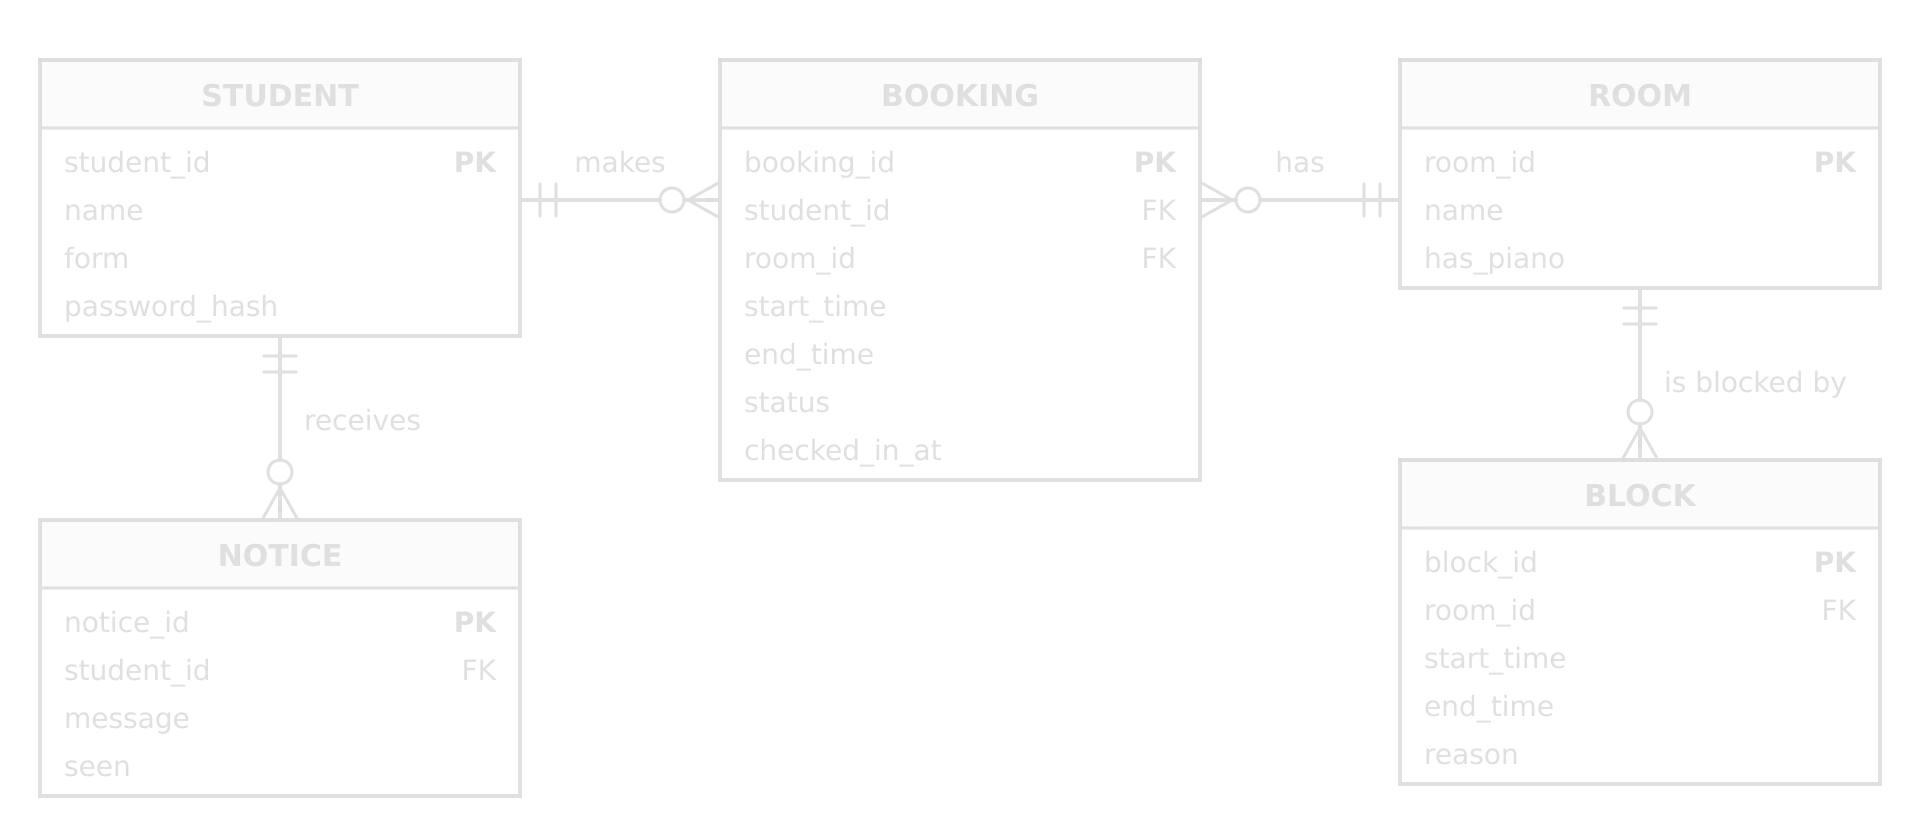
The status attribute is a design decision worth one sentence in the documentation: keeping released and cancelled bookings, instead of deleting them, lets the weekly report (SC6) count no-shows.
Wireframes
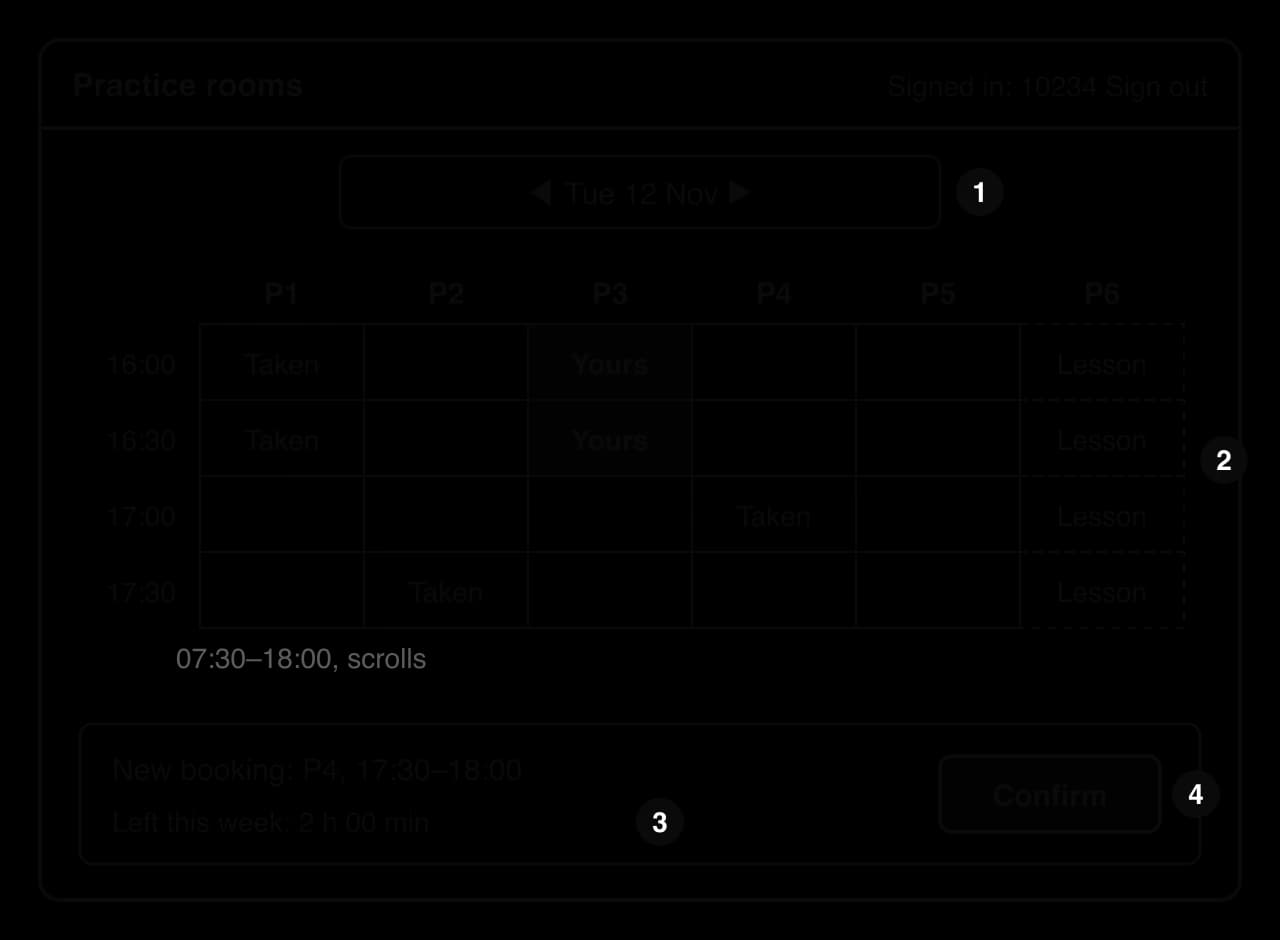
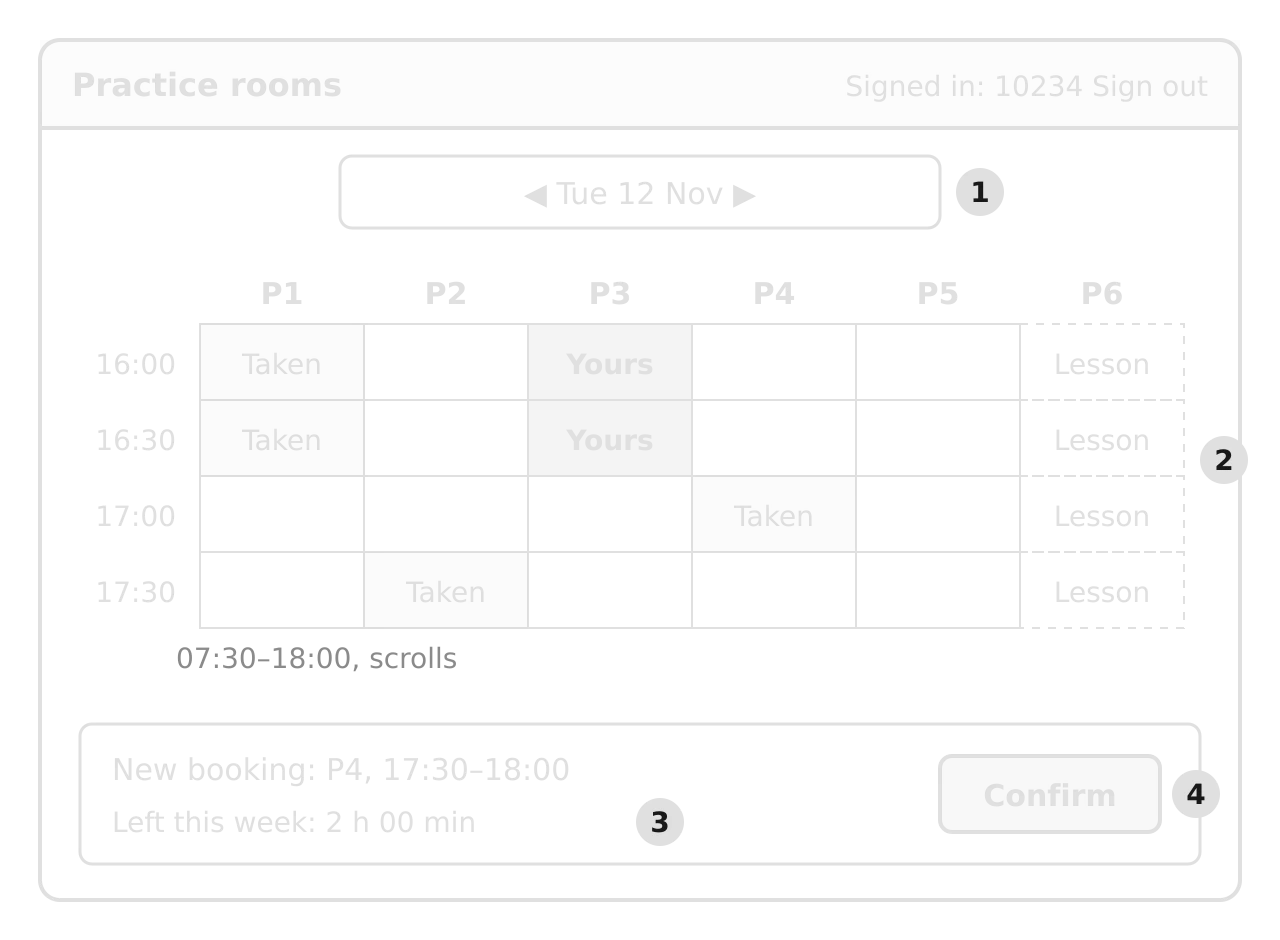
The system model must include the design of the user interface, and wireframes are the usual way to show it. One wireframe for each main screen is enough, with numbered notes linking parts of the screen to the success criteria they serve.
Algorithms for each component
Each component of the system model needs an algorithm. The IB names natural language (numbered steps in plain English), flowcharts and pseudocode as suitable forms. Choose the form that makes each algorithm clearest: a flowchart for logic with several decisions, numbered steps for a simple sequence, pseudocode for anything with loops and data structures.
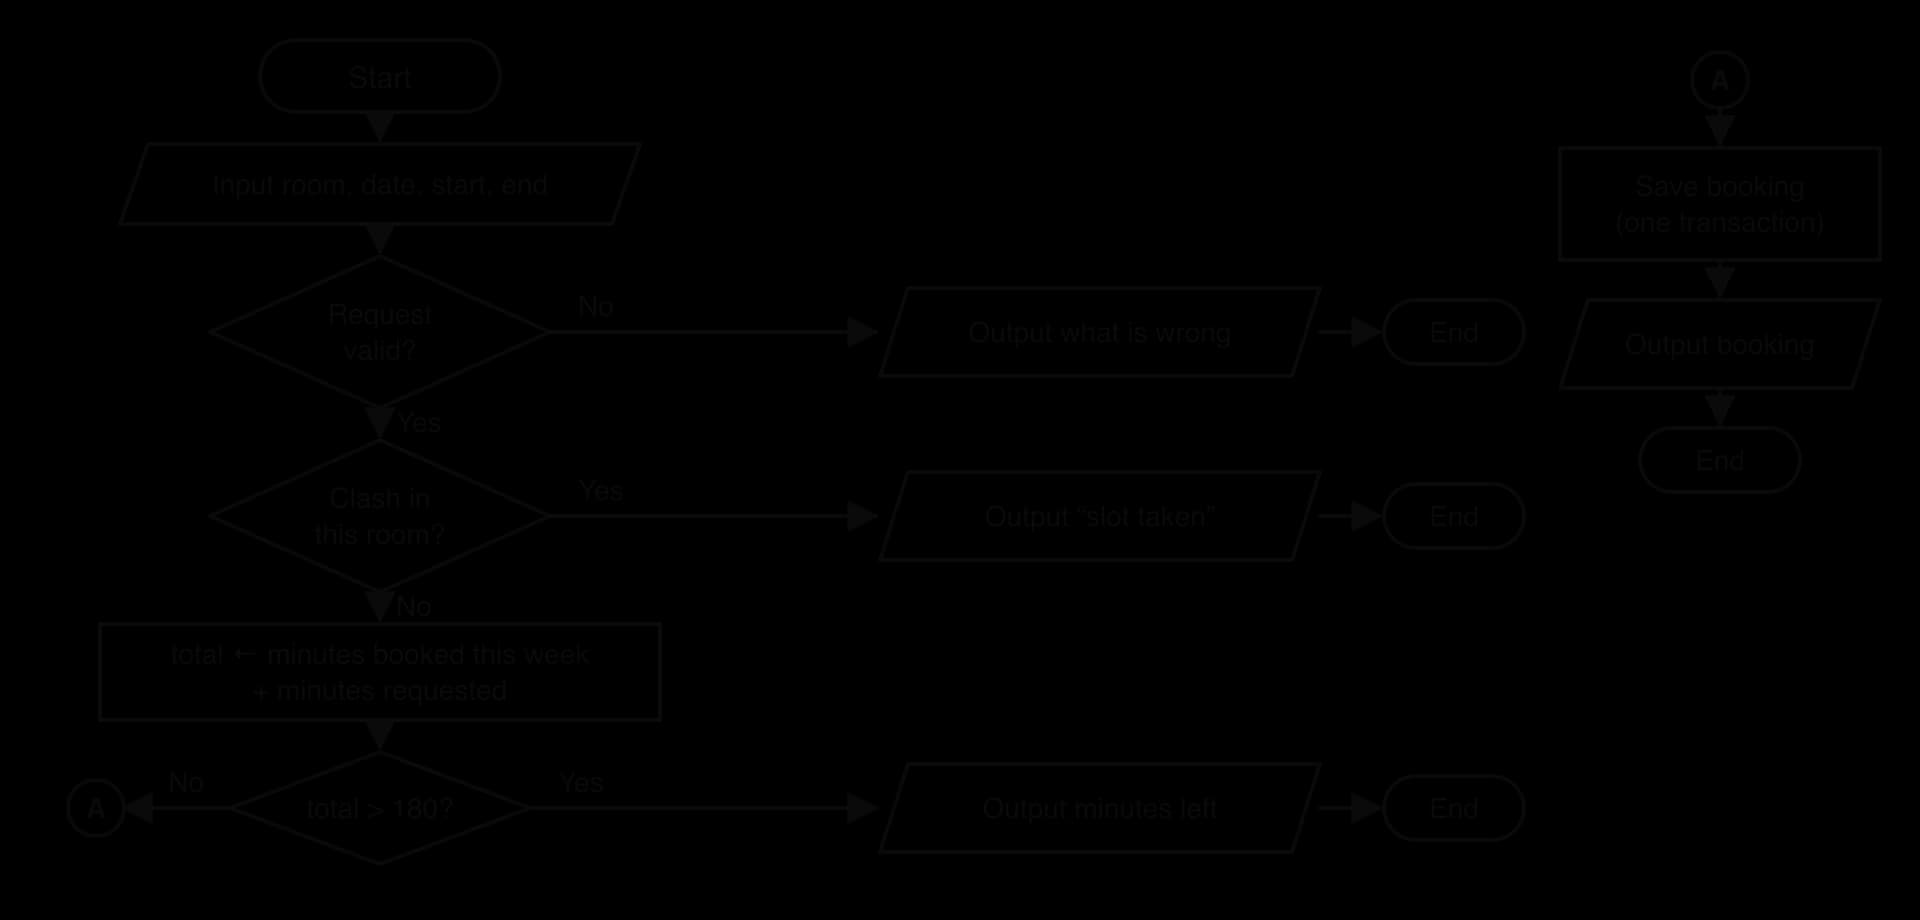
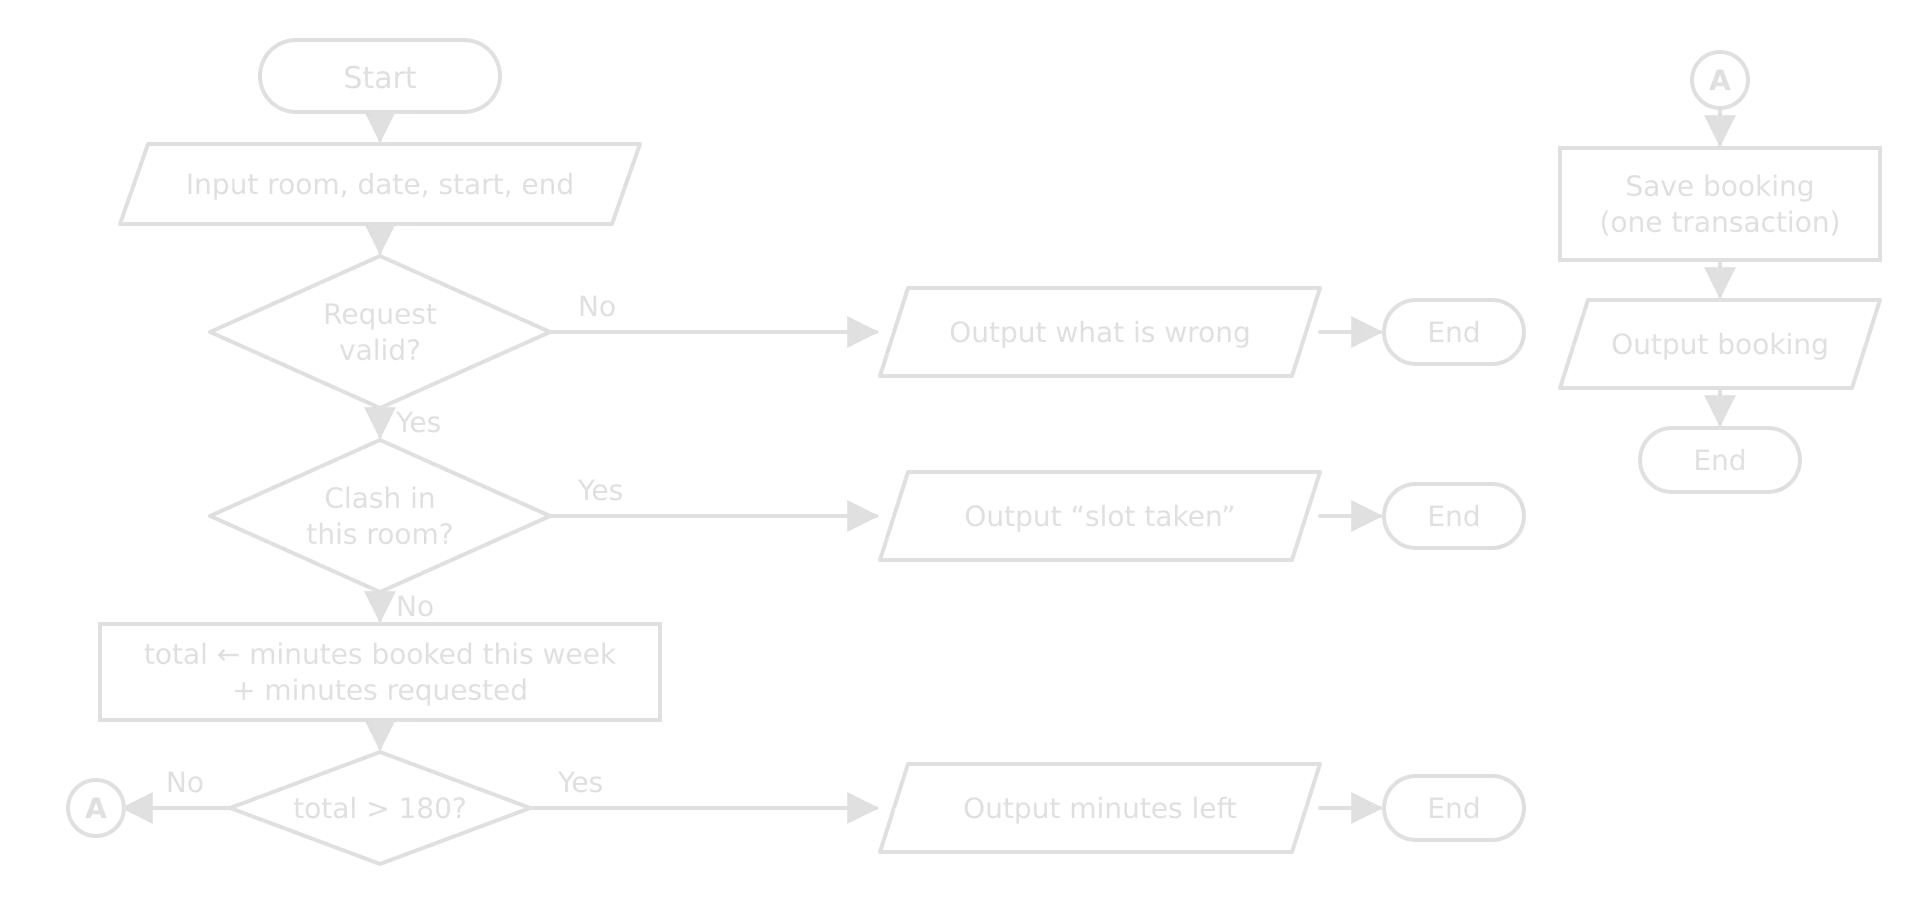
The make-booking algorithm has three checks before anything is saved, so a flowchart shows its decisions clearly. Each refusal ends with its own output, and the success path continues through connector A.
The clash test inside the flowchart's second decision is the most important algorithm in the product, and it is easy to get wrong, so it deserves its own pseudocode. Two time intervals overlap exactly when each one starts before the other ends.
Plain text
FUNCTION clashes(room, new_start, new_end)
    // Bookings that still hold the room, and blocks, for this room on this date
    FOR EACH item IN active bookings and blocks for room on the date of new_start
        IF new_start < item.end AND item.start < new_end THEN
            RETURN TRUE        // the two intervals overlap
        END IF
    END FOR
    RETURN FALSE
END FUNCTION

FUNCTION minutes_left(student, new_start)
    monday <- date of the Monday on or before new_start
    used <- 0
    FOR EACH booking OF student WITH status booked OR checked_in
            AND start >= monday 00:00 AND start < monday 00:00 + 7 days
        used <- used + length of booking in minutes
    END FOR
    RETURN 180 - used
END FUNCTION
The strict "less than" in the clash test is what allows back-to-back bookings, as SC2 requires. The table checks the condition against an existing booking from 10:00 to 10:30, which is also the start of a good test plan.
Requested slot |
|
| Clash? |
|---|---|---|---|
09:30–10:00 | 09:30 < 10:30: true | 10:00 < 10:00: false | No (ends as it starts) |
10:00–10:30 | true | true | Yes (identical) |
10:15–11:00 | 10:15 < 10:30: true | 10:00 < 11:00: true | Yes (partial overlap) |
10:30–11:00 | 10:30 < 10:30: false | true | No (starts as it ends) |
09:00–12:00 | true | true | Yes (contains it) |
Not every component needs this much detail. The table gives a suitable form for each of the booking system's components.
Component | Algorithm | Form |
|---|---|---|
1 Accounts | Sign in: find the student, compare the password hash, start a session | Numbered steps |
2 Availability | Build the day grid: 21 slots × 6 rooms, fill from bookings and blocks | Pseudocode |
3 Bookings | Make a booking (validate, clash test, weekly limit, save in one transaction); cancel | Flowchart and pseudocode |
4 Check-in | Check in with the door code; every minute, release bookings not checked in 10 minutes after their start | Pseudocode |
5 Admin | Block a room: save the block, cancel clashing bookings, add a notice for each affected student | Numbered steps |
6 Reports | For each room: hours booked, hours used, no-show rate = released ÷ (checked in + released) × 100 | Pseudocode |
The testing strategy
The testing strategy is a systematic plan for checking that the product works as intended and handles unexpected or incorrect input. The IB suggests showing it as a table of proposed test data and expected outcomes, and that table is usually called a test plan.
A strong test plan has four qualities. Every success criterion has at least one test. Each rule is tested with normal, boundary and erroneous data (subtopic B2.1, Programming fundamentals). Expected outcomes are exact ("refused with 'Slot taken'; no new row in BOOKING"), so that pass or fail needs no judgement. And at least one test checks efficiency, since Criterion D asks for testing of correctness, reliability and efficiency.
A weak and a strong Criterion C
Weak sample
System model. A screenshot of the finished booking page and a list: "The system has a database with a students table and a bookings table."
Algorithms. "When the user books a room, the program checks it is free and saves it."
Testing strategy.
Test | Expected |
|---|---|
Book a room | It works |
Log in | It works |
The weak sample's model is limited and has no design of its own (a screenshot is the product, not a model), no relationships, and no blocks, notices or check-ins. The algorithm is identified, not constructed: "checks it is free" hides the whole clash rule. The testing strategy covers at most one success criterion with no measurable outcome. Each part fits the 1–2 band.
Strong sample (about 130 words, plus diagrams and tables)
System model. The DFD (Figure C1) shows the five processes, four data stores and the data passed between them. The ER diagram (Figure C2) defines the five tables and their keys; a booking keeps its status (booked, checked_in, released, cancelled) so that the weekly report can count no-shows. The wireframe (Figure C3) shows the day view, with numbered links to SC1, SC2, SC3 and SC5.
Algorithms. One algorithm per component (Table C1). The make-booking flowchart (Figure C4) and the clash-test and weekly-limit pseudocode cover the rules in SC2, SC3 and SC7; the clash condition is checked against five cases in Table C2.
Testing strategy. Table C3 lists 17 tests covering all eight success criteria, with normal, boundary and erroneous data for each rule and a timed test of the day grid for SC8.
Test | SC | What is tested | Test data | Type | Expected outcome |
|---|---|---|---|---|---|
T1 | SC1 | Book a free slot | P2, Tue 16:00–16:30 | Normal | Saved; grid shows "Yours" |
T2 | SC1 | Last slot of the day | P2, Tue 17:30–18:00 | Boundary | Saved |
T3 | SC1, SC7 | Past closing time | P2, Tue 17:30–18:30 | Erroneous | Refused: "Outside opening hours" |
T4 | SC1 | Booking horizon | Exactly 7 days ahead; then 8 days | Boundary | 7 days saved; 8 days refused |
T5 | SC2 | Partial overlap | P1 10:15–11:00, existing 10:00–10:30 | Normal | Refused: "Slot taken" |
T6 | SC2 | Back-to-back | P1 10:30–11:00, existing 10:00–10:30 | Boundary | Saved |
T7 | SC2, SC5 | Booking during a lesson block | P6 16:00–16:30, block 16:00–18:00 | Normal | Refused: "Slot taken" |
T8 | SC3 | Reaching the limit | Student with 150 min books 30 min | Boundary | Saved; 0 minutes left |
T9 | SC3 | Over the limit | Student with 180 min books 30 min | Boundary | Refused: "0 minutes left this week" |
T10 | SC4 | Late check-in | Correct code at start + 10 min | Boundary | Checked in |
T11 | SC4 | No-show | No check-in; wait to start + 11 min | Normal | Status released; slot free |
T12 | SC4, SC7 | Wrong code | Code 0000 instead of today's | Erroneous | Refused; booking unchanged |
T13 | SC5 | Block with clashes | Block P3 Wed 12:00–14:00 with 2 bookings inside | Normal | Both cancelled; 2 notices |
T14 | SC6 | Report accuracy | Test week: 40 bookings, 30 checked in, 10 released | Normal | Matches hand calculation; no-show rate 25% |
T15 | SC7 | End before start | P4, 16:30–16:00 | Erroneous | Refused; BOOKING row count unchanged |
T16 | SC7 | Off the 30-minute grid | P4, 16:10–16:40 | Erroneous | Refused: "Slots start on the hour or half hour" |
T17 | SC8 | Grid load time | 2,000 bookings stored; load Tue grid 5 times | Efficiency | Every load under 2 s |
The strong sample constructs a complete model (data, processes, interface), constructs algorithms detailed enough to build from, and describes a testing strategy aligned with every success criterion, with boundaries chosen from the algorithms themselves (T6 tests the strict "less than"; T8 and T9 sit either side of 180 minutes). It fits the 5–6 band, and a third party could rebuild the product from it.
Checklist
- To do:
My decomposition diagram breaks the problem (not the documentation) into components and tasks.
- To do:
Every component is tagged with the success criteria it serves, and every success criterion appears at least once.
- To do:
My plan has dates and covers planning, design, development, testing and evaluation, with the draft deadline in it.
- To do:
I have chosen between a Gantt chart and an agile sprint plan, and my sprints deliver complete success criteria.
- To do:
I have recorded the libraries I will use and what I will write myself.
- To do:
My system model shows every component, how they connect and the data stored, using the right diagrams for my context.
- To do:
My system model includes wireframes of the main screens, drawn before building them.
- To do:
My algorithms are separate from the model, one per component, in a clear form (flowchart, pseudocode or steps).
- To do:
I have checked my key algorithm against boundary cases, as with the clash-test table.
- To do:
My test plan covers every success criterion, with normal, boundary and erroneous data and at least one efficiency test.
- To do:
Every expected outcome is exact enough to pass or fail without judgement.
- To do:
A classmate could rebuild my product from Criterion C alone.
Carry on with Computer Science in Augment
With a free account, Augment remembers where you stopped in the notes and which questions you have marked.