Conclusion and evaluation
How to write the Conclusion and Evaluation of the IB Biology IA: answer the research question from the data, compare with published science, and rank weaknesses by their impact.
- IB Biology
- Internal assessment
- SL and HL
Conclusion and Evaluation are the third and fourth criteria of the scientific investigation, worth 12 of the 24 marks between them. The conclusion answers the research question from the processed data and places the answer in its scientific context. The evaluation judges how far the method can be trusted: which weaknesses and limitations affected the results, how much, and what would be done to reduce them.
Both sections depend on the analysis. A conclusion can only be as strong as the processed data and uncertainties behind it, and an evaluation can only be specific if the data show where the method struggled. The examples continue the sample investigation of temperature and catalase activity in potato tuber (Solanum tuberosum), using the student's sample results from "Data analysis".
What the Conclusion criterion rewards
The descriptors ask whether the conclusion is relevant to the research question, how well it is supported by the analysis, and how well it is compared with accepted science.
Aspect | Band 1–2 | Band 3–4 | Band 5–6 |
|---|---|---|---|
The conclusion | Stated; relevant to the question but not supported by the analysis | Described; relevant but not fully consistent with the analysis | Justified; relevant and fully consistent with the analysis, including its uncertainties |
Scientific context | Compared only superficially with accepted science | Some relevant comparison with accepted science | Justified through relevant comparison with accepted scientific context |
"Fully consistent with the analysis" means that the conclusion claims no more than the data show. If the error bars of two levels overlap and a t-test finds no significant difference, a conclusion that names one of them as the optimum is not consistent with the analysis. "Accepted scientific context" means published theory and published values, from papers, textbooks or reliable databases, cited in the text.
Writing the conclusion
Answering the research question
The conclusion opens by answering the research question directly, using the processed data. It gives the trend in words, quotes the key values with units, and refers to the uncertainties and the results of any statistical test. It stays within the range of the independent variable that was tested.
Answer the question in one or two sentences: the direction and shape of the relationship.
Support it with processed data: means, percentage changes, the position of a maximum, the gradient or the test result.
State how certain it is: overlapping error bars, the size of the standard deviations, and whether differences are significant.
Explain it with theory: the biological mechanism that accounts for the trend.
Compare it with accepted science: does the result match published values and the expected pattern? If not, suggest a reason.
Say how far the hypothesis is supported, without claiming proof.
Using a curve of best fit to locate a value
Where the research question asks for a particular value (an optimum, an isotonic point, a threshold), a curve or line of best fit gives a better estimate than the single highest mean, because it uses all the data. The graph of the catalase means shows a quadratic curve of best fit through the seven points.
- Quadratic curve of best fit, R² = 0.95
The highest mean is at 40 °C, the curve of best fit has its maximum near 38 °C, and the t-tests show that 40 °C is significantly faster than 35 °C but not significantly different from 45 °C. All three point to an optimum in the range 35–45 °C, which is the conclusion the data support. A quadratic curve is only an approximation of an enzyme's temperature curve, which usually falls more steeply above the optimum than it rises below it, so its maximum is an estimate.
Comparing with accepted science
The comparison has two parts. The first is theory: does the shape of the results match the accepted model (for enzymes, the rise from increasing collision frequency and the fall from denaturation)? The second is published values: is the measured value similar to values reported by others for the same system? Where the result differs from published values, the difference is explained, for example by differences in the source of the enzyme, the substrate concentration or the time the enzyme spent at each temperature.
 YouTube
What the Evaluation criterion rewards
The evaluation is assessed on how specific the weaknesses and limitations are, how well their effect on the results is judged, and how realistic and relevant the improvements are.
Aspect | Band 1–2 | Band 3–4 | Band 5–6 |
|---|---|---|---|
Weaknesses and limitations | Generic ones stated ("human error", "more repeats") | Specific methodological weaknesses or limitations described | The relative impact of specific weaknesses or limitations on the results explained |
Improvements | Realistic improvements stated | Realistic improvements relevant to the weaknesses described | Realistic and relevant improvements explained |
"Relative impact" is the key phrase of the top band. It means judging which weaknesses mattered most to the conclusion and which mattered little, and saying in which direction each one pushed the results. A list of every possible problem, all treated as equally important, does not reach it.
Weaknesses and limitations
Types of error
A weakness is a problem with how the method was carried out that made the data less accurate or less precise. A limitation is a restriction on how far the conclusion can be applied, even if the method worked well: the range tested, the number of samples, the use of one tuber, or the fact that a laboratory extract may not behave like the enzyme inside living cells. Weaknesses usually cause one of two kinds of error.
Random errors come from natural variation in biological material, small differences in timing or reading a scale, and fluctuations in conditions. They show up as spread in the repeats, so their size can be measured with the standard deviation. They make a trend harder to see and make differences between levels less likely to be significant.
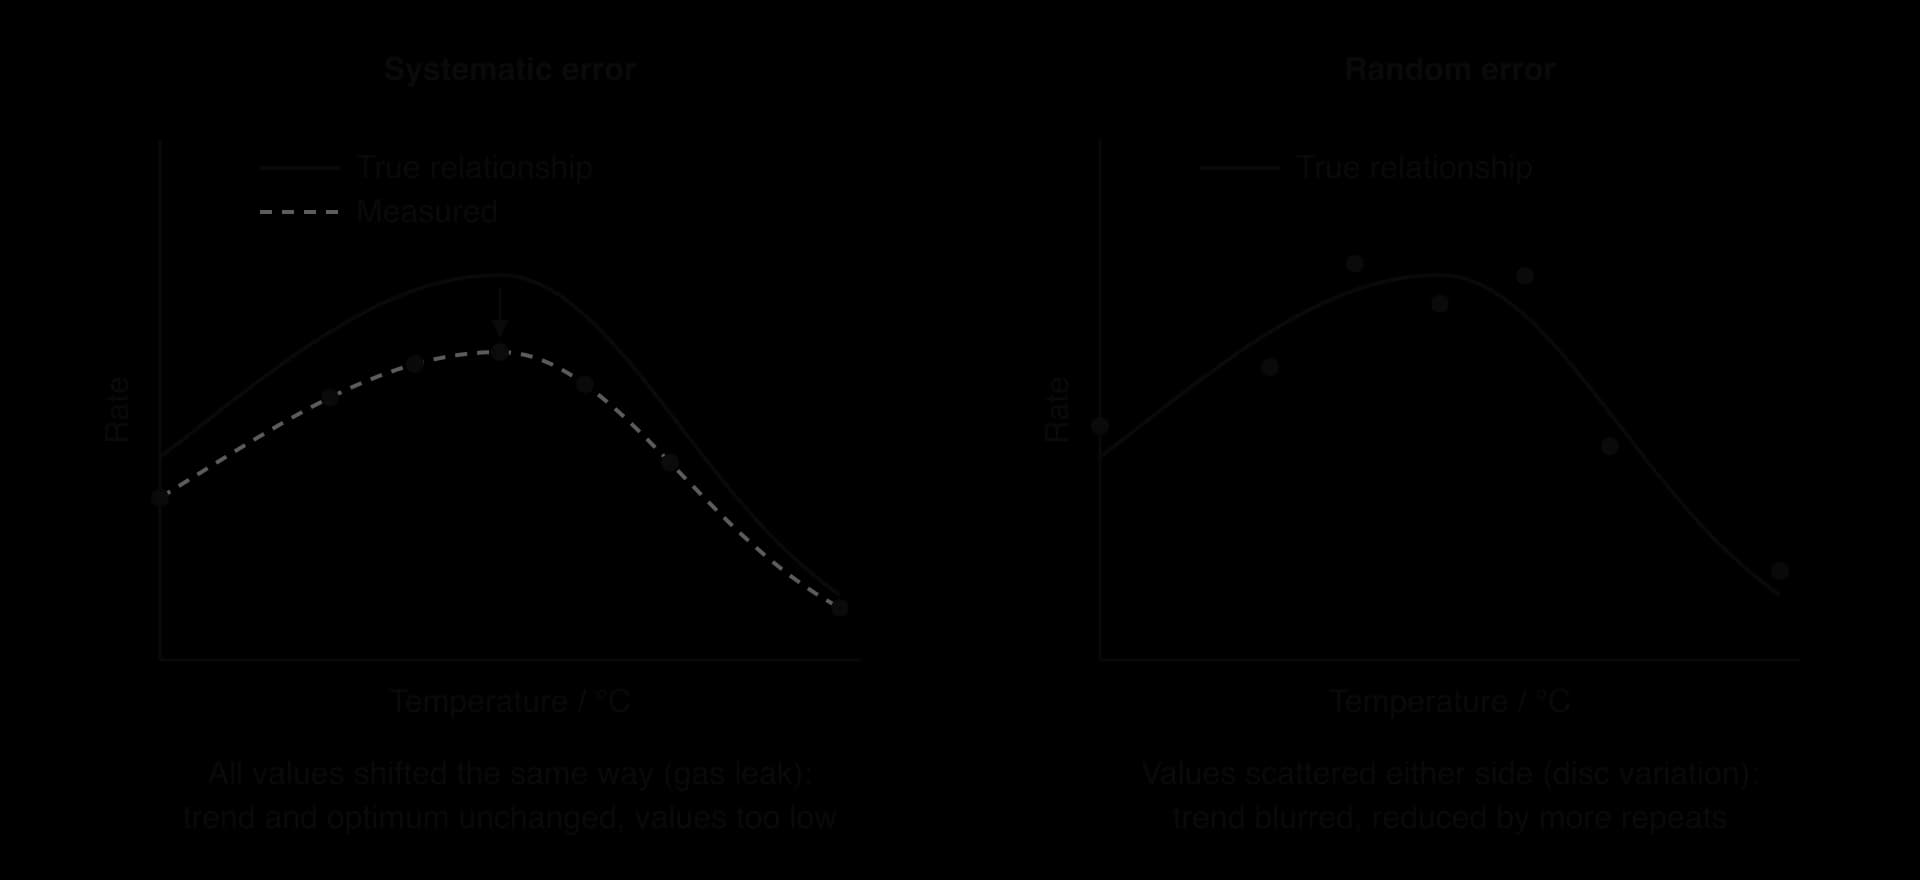
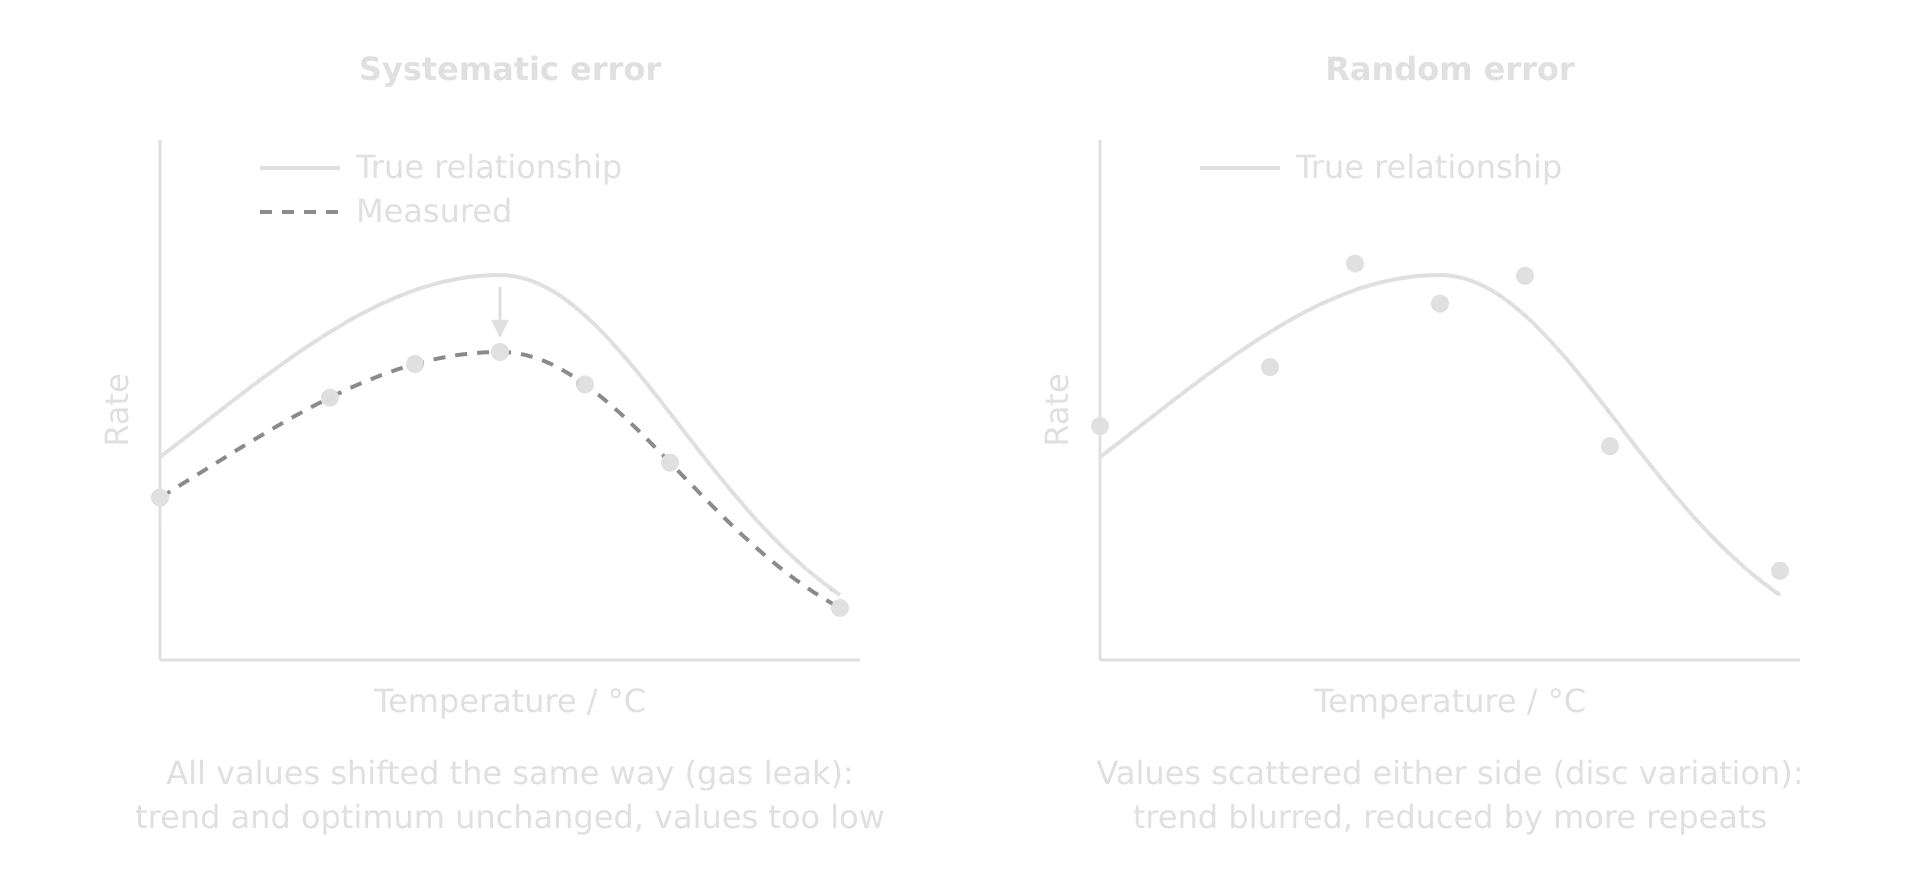
Systematic errors include a gas leak at the bung (every volume too low), a thermometer that reads 2 °C high (every temperature wrong in the same direction), or a balance that is not zeroed. Repeats do not show them, because every repeat is affected in the same way. Their effect on the conclusion depends on the research question: a leak that lowers every volume by a similar proportion leaves the shape of the curve and the position of the optimum unchanged, but would matter if the aim were to measure the true rate. This links to the meanings of accuracy (closeness to the true value) and precision (closeness of repeats to each other).
Validity and reliability
A method is valid when the dependent variable truly reflects the quantity in the research question and the controlled variables really are controlled. Measuring oxygen released in 60 s is a valid measure of the rate of catalase activity only if almost all the oxygen reaches the syringe and the temperature of the mixture is the set temperature. Reliability is about consistency: repeated measurements under the same conditions give similar results. A strong evaluation discusses both validity and reliability.
Judging the relative impact of weaknesses
For each weakness, the evaluation explains what it was, which data it affected and how (direction and size), and how much it matters to the conclusion. The table applies this to the catalase investigation, ranked from the greatest to the smallest impact on the conclusion about the optimum.
Weakness or limitation | Evidence and effect on the results | Impact on the conclusion | Improvement |
|---|---|---|---|
Variation in catalase between discs (random error) | SD rose from 0.57 at 20 °C to 1.68 cm³ min⁻¹ at 50 °C; error bars at 40 and 45 °C overlap | High: the main reason the optimum cannot be narrowed below 35–45 °C | Use a filtered potato extract (homogenised in buffer) so every trial has the same enzyme concentration; increase to 10 repeats |
Spacing of temperatures (limitation) | 5 °C steps around the optimum; the true optimum could lie anywhere between 35 and 45 °C | High: limits how precisely the optimum can be located | Repeat with 2 °C steps from 34 to 46 °C |
Denaturation during the 60 s collection at 50 and 60 °C (weakness) | The rate falls during the minute, so the volume is an average of a declining rate; may explain the large SD at 50 °C | Moderate: affects the shape above the optimum, not its position | Measure the initial rate over the first 15 s with a pressure sensor and data logger |
Oxygen lost before the bung is inserted and dissolved in the solution (systematic error) | Every volume slightly too low, more at high rates | Low: lowers all values in a similar proportion; the optimum is unchanged | Hold the discs in a small tube inside the sealed flask and tip them in after sealing |
One potato tuber (limitation) | Results apply to one tuber of one variety | Low for the trend; limits how far the result applies to potato catalase in general | Repeat with tubers of several varieties and ages |
This ranking is the core of a top-band evaluation. The two highest-impact weaknesses both limit how precisely the optimum can be located, which is the aim of the research question. The systematic loss of oxygen has little effect on the conclusion, because it affects all temperatures in the same way and so does not move the optimum.
Improvements and extensions
An improvement is a realistic change to the method that reduces a specific weakness. It is described precisely enough to carry out, and the evaluation explains how it would reduce the weakness. "Use better equipment" or "be more careful" are not improvements. "Measure oxygen with a pressure sensor connected to a data logger, so the initial rate over the first 15 s can be calculated from the gradient before significant denaturation occurs" is.
Improvements must be realistic for a school laboratory and must match a weakness that has been identified. An improvement with no matching weakness, or a weakness with no improvement, leaves the evaluation incomplete.
An extension is a further investigation that follows from the conclusion and widens it. Examples for the catalase investigation are measuring the effect of the time spent at 50 °C before adding substrate (to study the rate of denaturation), repeating the temperature series at a different pH, or comparing the optimum of catalase from potato with that from another tissue such as liver or yeast. Extensions are optional, and the descriptors reward improvements more than extensions, so they are kept short.
A final pre-submission checklist
The checklist covers the points that most often cost marks. Work through it with the final report, not the draft.
Research design
- To do:
The research question names the independent variable with its range, the dependent variable with how it is measured, and the organism by its scientific name.
- To do:
The background theory explains why the two variables should be related, with citations.
- To do:
Every controlled variable has its value, how it was controlled and why it matters.
- To do:
The method is in numbered steps, with every quantity and instrument uncertainty, and could be repeated by someone else.
- To do:
Range, increments and repeats are justified; preliminary trials are described.
- To do:
Safety, ethical and environmental issues are specific to the method.
Data analysis
- To do:
Raw data tables include all levels and repeats, with units and uncertainties in the headings and consistent decimal places.
- To do:
There is one sample calculation for each type of processing.
- To do:
Graphs have titles, labelled axes with units, error bars and a statement of what the error bars show.
- To do:
Any statistical test has its null hypothesis, test value, critical value or p-value and a correct interpretation.
Conclusion and evaluation
- To do:
The conclusion answers the research question with processed values and units, and claims no more than the uncertainties and statistics allow.
- To do:
The results are explained with theory and compared with cited published values.
- To do:
Weaknesses are specific, supported by the data, and ranked by their impact on the conclusion.
- To do:
Each weakness has a realistic, precisely described improvement.
The whole report
- To do:
The report is no longer than 3,000 words, with the word count stated.
- To do:
Every source, image, database and any AI tool used is cited; any collaboration is acknowledged.
- To do:
Every table and graph is numbered and referred to in the text.
- To do:
Nothing that earns marks is in an appendix.
Carry on with Biology in Augment
With a free account, Augment remembers where you stopped in the notes and which questions you have marked.