Writing, technology and referencing
Structure the report, write mathematics in correct notation, present graphs and tables properly, decide how much working to show, use technology well and reference every source in a consistent style.
- IB Mathematics: Applications and Interpretation
- Internal assessment
- SL and HL
Introduction
Your teacher and the moderator judge an exploration from the written report alone, with no chance to ask what you meant. Everything you understand therefore has to be visible in the writing: what you set out to do, why each step follows and what each result means. Clear writing earns marks under criteria A and B, and it is also the only way a reader can see the understanding that criterion E rewards.
The target reader is a classmate taking the same course. Such a reader knows the mathematics of the course but not your topic, your data or your decisions. Writing for that reader settles most questions of style: define what a classmate would not know, explain why you chose each method, and skip arithmetic any classmate could do in their head.
Structure
The parts of the report
There is no fixed template, but almost every strong exploration has the same parts in the same order, because that order lets an argument develop logically.
Part | What it contains | Rough share |
|---|---|---|
Title page | Title and number of pages | – |
Introduction | The aim, why it matters to you, the real situation in brief | 1–2 pages |
Background and data | Variables defined with units, data source or collection method, cleaning, assumptions | 2–3 pages |
Mathematical development | The methods, each justified, with results and interpretation after each | 8–12 pages |
Conclusion | The answer to the aim, how far it was achieved, limitations and their effect, next steps | 1–2 pages |
Bibliography | Every source, in one consistent style | Not counted |
Appendices (if needed) | Large raw data sets, extra graphs of the same kind | Not part of the argument |
The mathematical development is the heart of the report and takes most of its length. Background that the mathematics never uses (the history of a sport, a biography of a mathematician) makes the report longer without supporting any criterion, and it weakens conciseness under criterion A.
Headings and signposts
Use headings that say what each part does ("Fitting a quadratic model", "Testing the models on 2020 and 2025"), not "Part 2" or "Analysis". Open each section with a sentence that links it to the previous one and to the aim ("The residual plot showed that the linear model is the wrong shape, so a model whose rate of change grows with time is tried next"). Linking sentences of this kind make an exploration coherent, because the reader can see why each section exists.
Number figures and tables (Figure 1, Table 1) and give each a caption, so the text can refer to them precisely. A table of contents is optional; a short exploration rarely needs one.
First person and voice
Writing in the first person ("I chose", "I predicted") is normal in an exploration and often helps, because it makes your decisions visible, which is evidence of personal engagement. Use it for decisions and reflections, and keep the mathematics itself in a clear impersonal style ("Substituting gives ..."). Avoid chatty filler and dramatic language; a direct, plain style is easiest to follow.
Notation and terminology
Mathematical notation, not calculator notation
Criterion B expects correct mathematical notation throughout. Calculator and computer notation is acceptable only in output generated by software, such as a screenshot of a spreadsheet; anything you type yourself must use proper notation. An equation editor (built into every word processor) or LaTeX makes this straightforward.
Calculator or computer form | Mathematical notation |
|---|---|
| |
| |
| |
| or |
| |
| |
| |
| , with and defined |
The last row shows two subtler problems. The software form keeps every digit it printed, where the report states parameters to a chosen accuracy. Software also calls every variable and ; the report should use letters that suit the context, defined in words with units, and should use them consistently from start to finish.
Defining variables and terms
Define every variable the first time it appears, in a full sentence, with its unit: "Let be the height of the ball above the ground in metres and the time in seconds after it is released." Define technical terms that a classmate might not know, especially ones from outside the course or from the context ("A penalty zone is one of the six regions into which the goal mouth is divided in the data set"). Use one name for each idea; switching between "residual", "error" and "difference" for the same quantity confuses the reader.
Accuracy and rounding
State the accuracy you use and keep it consistent: for example, model parameters to 3 significant figures and money to the nearest cent. Carry full accuracy through calculations and round only the final value, as rounding in the middle of a calculation compounds errors. Give a final answer to a precision the data can support: a model fitted to data measured to the nearest minute cannot predict a time to the nearest hundredth of a second.
Graphs and tables done properly
Graphs
A graph in an exploration is evidence, so it must be readable without guesswork. Every graph needs a number and a caption, both axes labelled with the quantity and its unit, a sensible scale, and a key when it shows more than one data set or curve. The text must refer to it by what it shows and interpret it.
The graph of a hypothetical car's value shows these features: a defined model in the key, labelled axes with units, the data points distinguished from the model curve, and a caption saying what the reader should see.
- model: V = 24 000 × 0.85ᵗ
The figure is hypothetical, but the checklist applies to every real one. Graphs drawn in Desmos, GeoGebra or a spreadsheet should be exported at a resolution that stays sharp when printed, and gridlines should help reading values without cluttering the plot. A graph with no labels is the example the IB itself gives of level 1 communication.
Tables
Tables present repeated results compactly. Give each a number and a title, put units in the column headings rather than in every cell, align numbers by the decimal point, and round consistently. A large raw data set belongs in an appendix, with a short summary table (or the first few rows) in the body.
Feature | Weak table | Strong table |
|---|---|---|
Title | None | "Table 2. Residuals of the linear model, 1960–2015" |
Units | In every cell, or missing | Once, in the heading: "Residual (ppm)" |
Rounding | Mixed (2.1, 2.087, 2) | Consistent (2.09, 2.10, 2.00) |
Placement | Screenshot of a whole spreadsheet | Only the relevant columns, typed |
Reference in text | Not mentioned | "Table 2 shows the residuals changing sign twice ..." |
How much working to show
The rule is to show enough that a classmate could follow and check every step, and no more. In practice:
Every new method once in full. The first time you calculate a residual, an expected frequency, a derivative or a step of Euler's method, show the formula, the substitution and the result, with a sentence explaining why.
Repeats in a table. The other eleven residuals go in a table, produced by technology and labelled as such.
Derivations where they show understanding. Deriving a formula you use (the sum of a geometric series in a finance exploration, the volume function in an optimisation) is strong evidence for criterion E; quoting it with a citation is acceptable when the derivation adds nothing.
Skip trivial arithmetic. needs no line of its own.
Interpret every result. A number is followed by what it means in context and how reliable it is.
Using technology
Technology belongs in an exploration wherever it helps: fitting models to large data sets, drawing accurate graphs, solving equations that have no simple algebraic solution, running many cases, or simulating. A by-hand method is never required for its own sake, but neither is technology a substitute for explanation.
Name the tool and what it did. "The quadratic regression was found with a spreadsheet's polynomial trendline"; "the system was solved with the GDC's simultaneous-equation solver".
Show what was entered. The data, the function, the window, the settings.
Translate output into notation. A software result is restated in proper notation in the text.
Check it. Compare one output with a hand calculation, or with a second tool.
Screenshots sparingly. A screenshot can show what software produced, but a clear typed table or redrawn graph usually communicates better; never let a screenshot replace an explanation.
Popular tools each have strengths: a spreadsheet for data handling, repeated calculations and Euler's method; Desmos and GeoGebra for graphs, sliders and fitting curves; Python for large data sets and simulations; the GDC for quick checks and tests. Choose whatever suits the task, and cite software that did significant work.
Referencing
Citations
Cite a source wherever you use it: a fact, a quotation, a data set, a formula you did not derive, an image, a graph, a method or an idea taken from someone else. Direct quotations go in quotation marks with a citation; paraphrased ideas still need one. Formulae count as sources, so a formula taken from a textbook or website is cited where it first appears. Common knowledge in the course (the quadratic formula, the definition of a derivative) does not need a citation.
The bibliography
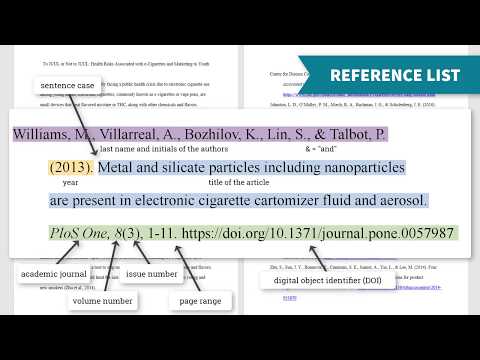
The IB does not prescribe a referencing style; it requires one used consistently. APA, MLA and Harvard are all common. Each source in the bibliography needs the author or organisation, the date, the title, the publisher or website, and for online sources the URL and the date accessed. A data set downloaded from an official body, written in APA style, looks like this:
NOAA Global Monitoring Laboratory. (2026). Mauna Loa CO₂ annual mean data [Data set]. Retrieved October 15, 2026, from https://gml.noaa.gov/webdata/ccgg/trends/co2/co2_annmean_mlo.txt
with the in-text citation "(NOAA Global Monitoring Laboratory, 2026)" wherever the data are used.
 YouTube
References are not assessed by any criterion, but missing references can lead to an academic integrity investigation, so the bibliography is never optional. Content produced by generative AI tools is cited like any other source, at the point of use and in the bibliography.
Drafting and revising
Few explorations are written in order from the first page to the last. Many students write the mathematical development first, while the work is fresh, then the conclusion, and the introduction last, when they know exactly what the report does. Writing the introduction last also helps make sure that the aim it states is the aim the report actually answers.
Careful revision improves criteria A and B more than any other stage of the writing. Reading the draft aloud shows sentences that do not follow; reading it as a stranger shows undefined symbols and missing steps. A classmate can comment on clarity (that kind of peer feedback is encouraged) but should not correct or rewrite your mathematics, and your teacher comments on one draft only, so the draft you hand in should already be revised once by you.
Revision pass | What to look for |
|---|---|
Argument | Does each section follow from the last and serve the aim? Is anything irrelevant? |
Mathematics | Is every method justified, every result checked and interpreted? |
Notation | Is every variable defined, with units, and used consistently? Any calculator syntax left? |
Figures and tables | Numbered, captioned, labelled, referred to in the text, placed in the body? |
Sources | Is every source cited where used and listed in the bibliography? |
Appendices
Appendices hold material that supports the report but is not needed to follow the argument: large raw data sets, the full output of a long simulation, extra graphs of the same kind as one in the body, survey questions, or code. Anything a reader needs in order to understand a step (a key graph, the table a conclusion depends on) goes in the body. The exploration should make sense, and reach its conclusion, without the reader opening the appendices, so moving a needed graph there to shorten the body weakens criterion A rather than helping it.
Summary
Write for a classmate who knows the course but not your topic: define, justify and interpret.
Use a logical structure (introduction with aim, data, mathematical development, conclusion, bibliography) with meaningful headings and linking sentences.
Use correct mathematical notation; calculator and computer syntax only inside software output.
Define every variable with its unit, use one symbol and one name per idea, and state a consistent rounding rule.
Number and caption every graph and table, label axes with units, refer to each in the text and interpret it.
Show each new method once in full, put repeats in a table, derive formulae where that shows understanding, and skip trivial arithmetic.
Use technology freely, but say what was entered, translate output into notation and check it.
Cite every source (including data, formulae, images and AI output) in the text and list each in a consistent bibliography; appendices hold only material the argument does not need.
Carry on with Maths AI in Augment
With a free account, Augment remembers where you stopped in the notes and which questions you have marked.