E.3 Tourism and sport at the international scale questions for IB Geography
85 questions on Tourism and sport at the international scale, written by Augment in the style of IB exam papers. Six of them are below in full, to answer on paper.
- IB Geography
- Part of E Leisure, tourism and sport
- SL and HL
Questions by paper and level
SL and HL questions are for students at either level. HL only questions cover what only HL students study.
| Paper | SL and HL | HL only | All |
|---|---|---|---|
| Paper 1 | 85 | 0 | 85 |
Counted on
Questions to try
Written by Augment in the style of IB exams, not past papers. Answer them on paper, then check each one against its markscheme with a free account.
To what extent has technological change been the main cause of changing leisure patterns in recent decades?
10 marks
Evaluate the usefulness of categorizing touristic activities by cost, duration and destination.
10 marks
Examine how the types of tourism that people take part in may change as a society becomes more economically developed.
10 marks
To what extent does rising national income explain recent changes in participation in tourism in different countries?
10 marks
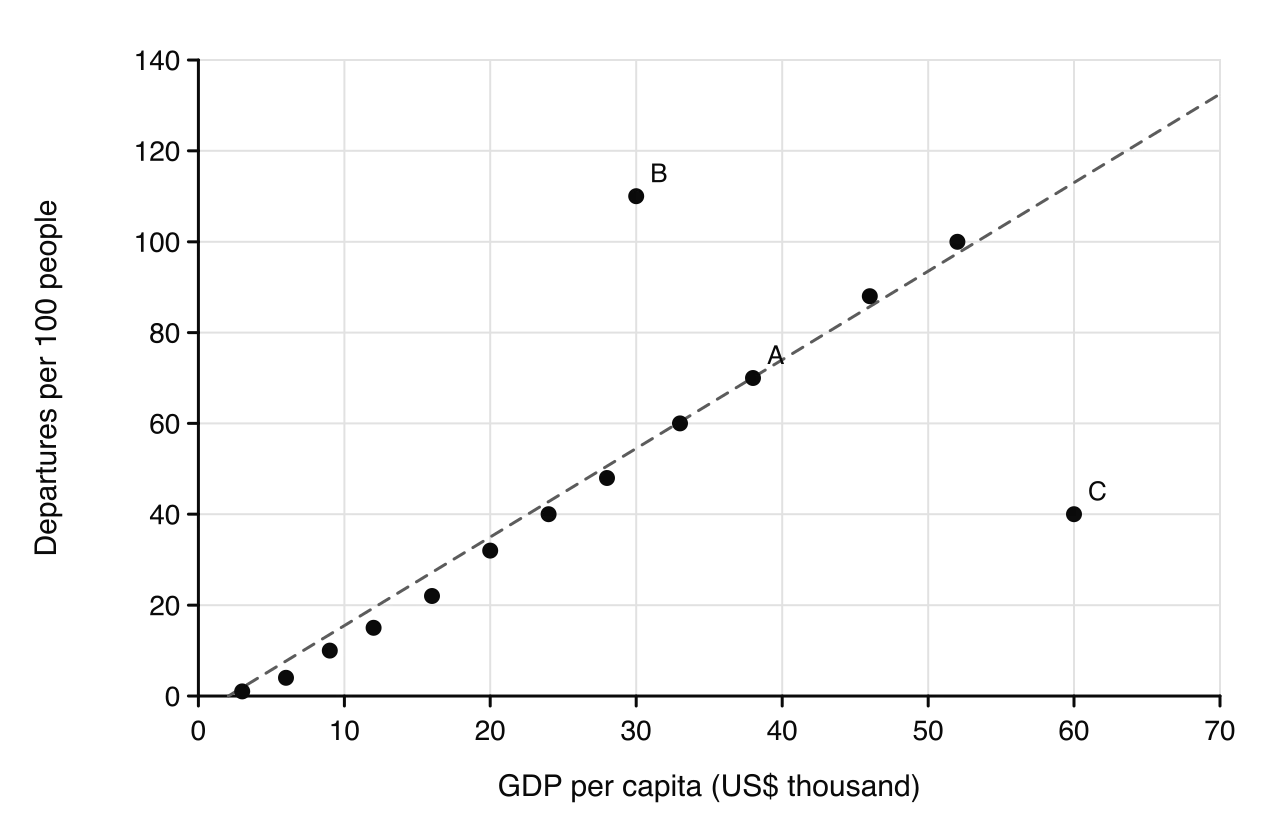
The scatter graph shows GDP per capita and the number of international tourist departures per 100 people for 14 countries. A best-fit line has been added.
- (a)(i)
State the number of international departures per 100 people for country A.
1 mark
- (a)(ii)
Estimate the GDP per capita of country B, in US$ thousand.
1 mark
- (b)
Outline one reason for the positive relationship between GDP per capita and international departures shown on the graph.
2 marks
- (c)(i)
Explain one possible reason why: country B has many more departures than its GDP per capita would suggest;
3 marks
- (c)(ii)
country C has many fewer departures than its GDP per capita would suggest.
3 marks
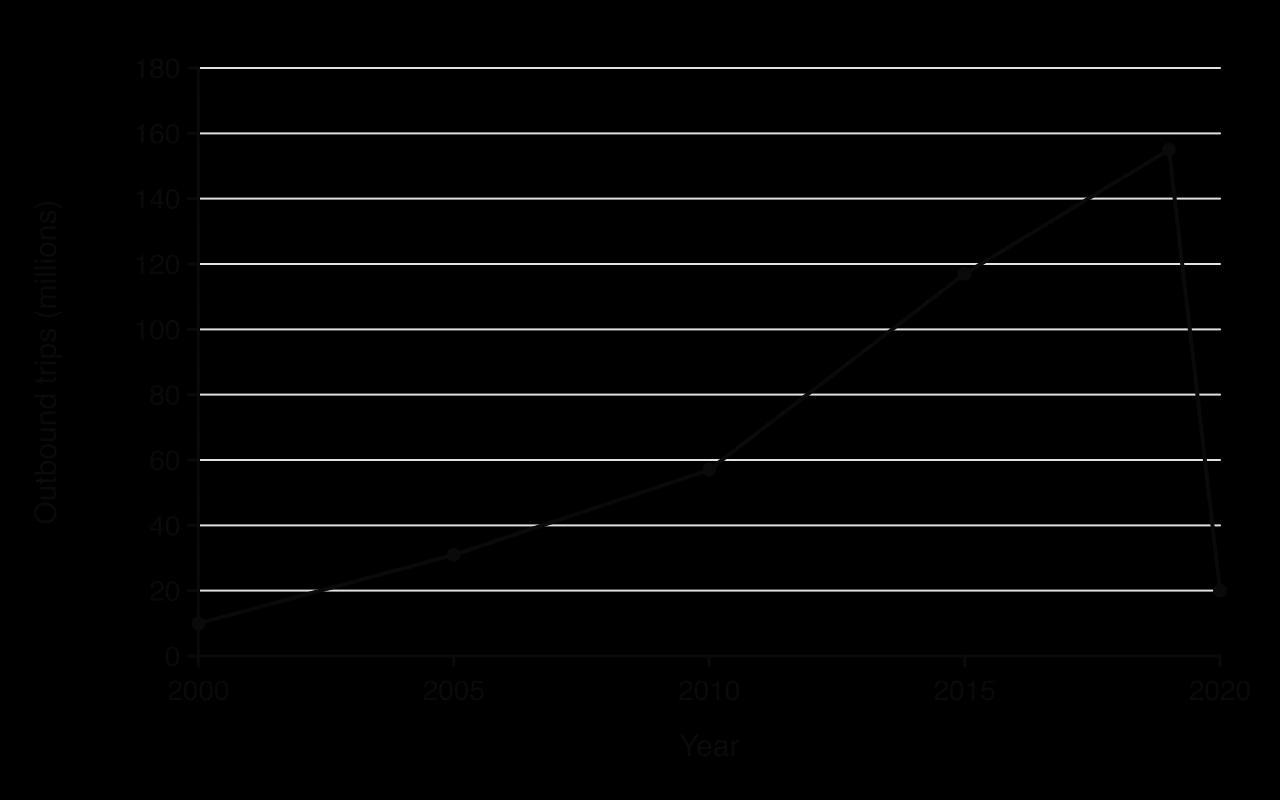
The graph shows the approximate number of outbound tourist trips made by residents of mainland China, 2000–2020. The figures include trips to Hong Kong and Macao.
- (a)(i)
State the number of outbound trips in 2010, in millions.
1 mark
- (a)(ii)
Estimate the increase in outbound trips between 2010 and 2019, in millions.
1 mark
- (b)
Outline one reason for the change in outbound trips between 2019 and 2020.
2 marks
- (c)
Explain two reasons why participation in international tourism has grown rapidly in emerging economies such as China. [3+3]
6 marks
Practice all 85 in Augment
Free with an account. Every question has its markscheme, and Augment keeps the ones you got wrong so you can come back to them.
The notes on E.3 Tourism and sport at the international scale
More questions in Leisure, tourism and sport
- E.1Changing leisure patterns
- E.2Tourism and sport at the local and national scale
- E.3Tourism and sport at the international scaleThis page
- E.4Managing tourism and sport for the future
Check your answers in Augment
A free account opens all 85 questions on Tourism and sport at the international scale with their markschemes, and keeps a record of what you have marked.