Notes on 8.2 Urban systems and urban planning
Learning objectives
Distinguish between urban and rural areas, and identify the biotic and abiotic components of an urban ecosystem.
Construct a systems diagram of an urban area, showing its inputs, outputs, storages, transfers and transformations.
Explain why the proportion of people living in urban areas is increasing, using push–pull factors and real data.
Distinguish between urbanisation, suburbanisation and deurbanisation, and outline the causes of urban sprawl.
Explain how the expansion of urban and suburban areas changes land, water, air and climate.
Outline the aims of urban planning and evaluate how far named plans have made cities more sustainable.
Describe the approaches of ecological urban planning, including urban ecology, urban farming, biophilic design, resilience planning and regenerative architecture.
Evaluate sustainable urban planning in a named city from different perspectives.
Explain how compactness, mixed land use and social mix make cities more sustainable and more just. (HL)
Discuss how circular economy and doughnut models are being applied to cities. (HL)
Describe how green and vernacular architecture reduce the environmental harm of buildings, using a named example. (HL)
Introduction
More than half of the world’s people now live in towns and cities, and the share is still rising. Cities cover only a small part of the land surface, yet they draw in food, water, energy and materials from huge areas around them and release most of the world’s waste, pollution and greenhouse gas emissions. How cities grow and how they are planned therefore matters for the environment far beyond their edges.
A city can be studied as a system, with inputs, outputs and storages like any natural ecosystem. Viewing it in this way shows where it wastes resources and where it could become more efficient, healthier and more resilient. Decisions about cities also reflect perspectives: some people see the solution in new technology and “smart” infrastructure, others in living more simply and closer to nature. Planning a city is a test of sustainability in practice, because it must balance housing, jobs, transport, health and the natural environment for millions of people at once.
Urban areas and rural areas
Settlements range from isolated farms to cities of tens of millions of people. Geographers divide them into urban areas and rural areas, although the dividing line is drawn differently in every country. What makes an area urban is a combination of high population density, continuous buildings and infrastructure such as roads, pipes and power lines, and the fact that most people work in industry and services rather than farming.
Rural areas are the countryside. Settlements are small and spread out, much of the land is farmland, forest or other open land, and a larger share of people work in agriculture, forestry or fishing. Many rural people now commute to urban jobs, and many urban people depend on rural land for food and water, so the two are closely linked.
Because each country uses its own definition, urban statistics are hard to compare. In Japan, for example, a municipality generally needs about 50,000 people to be designated a city, while other countries count much smaller settlements as urban. In 2025 the United Nations began to publish a second set of figures based on a common method, the Degree of Urbanisation, which classifies every square kilometre of land by population density using satellite data. Under this method Jakarta, a megacity of about 42 million people, is the world’s largest city, followed by Dhaka and Tokyo.
Sources: UN DESA, World Urbanization Prospects (2025), via Wikipedia, “Megacity” (2026).
Urban ecosystems
A city is not empty of nature. Parks, gardens, street trees, rivers, canals and even cracks in the pavement support plants, animals, fungi and microorganisms. Together with the non-living conditions of the city, they form an urban ecosystem: an ecosystem like any other, made of biotic and abiotic components that interact, but strongly shaped by people.
Component | Examples in a city | How the city changes it |
|---|---|---|
Biotic: plants | Street trees, parks, gardens, green roofs, weeds on wasteland | Many species are planted or introduced; native vegetation is cleared and fragmented |
Biotic: animals | Pigeons, foxes, rats, insects, birds of prey on tall buildings, fish in canals | Species that tolerate disturbance and use human food waste thrive; sensitive species disappear |
Biotic: people | Residents, workers and visitors | The dominant species: humans decide land use, inputs and outputs |
Abiotic: soil | Park soils, gardens, compacted ground under roads | Sealed under concrete, compacted, often contaminated with metals |
Abiotic: water | Rivers, canals, ponds, drains, groundwater | Rivers straightened or put in pipes; run-off faster; water often polluted |
Abiotic: air and climate | Air temperature, wind, humidity, air quality | Warmer (urban heat island), less windy at street level, more polluted |
Abiotic: topography | Hills, valleys, coasts, river terraces | Levelled, built on, reclaimed from the sea |
Urban ecosystems differ from natural ones in several ways. Almost all of their energy and food comes from outside rather than from photosynthesis within them, so they depend on large areas of farmland, forest and sea elsewhere. Their biodiversity is usually lower and dominated by a few tolerant species, although old parks, cemeteries and abandoned railway land can be surprisingly rich. Their abiotic conditions are also changed, most clearly their climate.
The urban heat island
Cities are warmer than the countryside around them, especially at night. Dark roofs and roads have a low albedo, so they absorb more sunlight. Concrete, brick and asphalt store this heat during the day and release it slowly after sunset. With fewer plants and less bare soil, less water evaporates or is transpired, so less energy is used up in evaporation and more warms the air. Tall buildings trap radiation between them and block cooling winds, and vehicles, air conditioners and factories add waste heat.
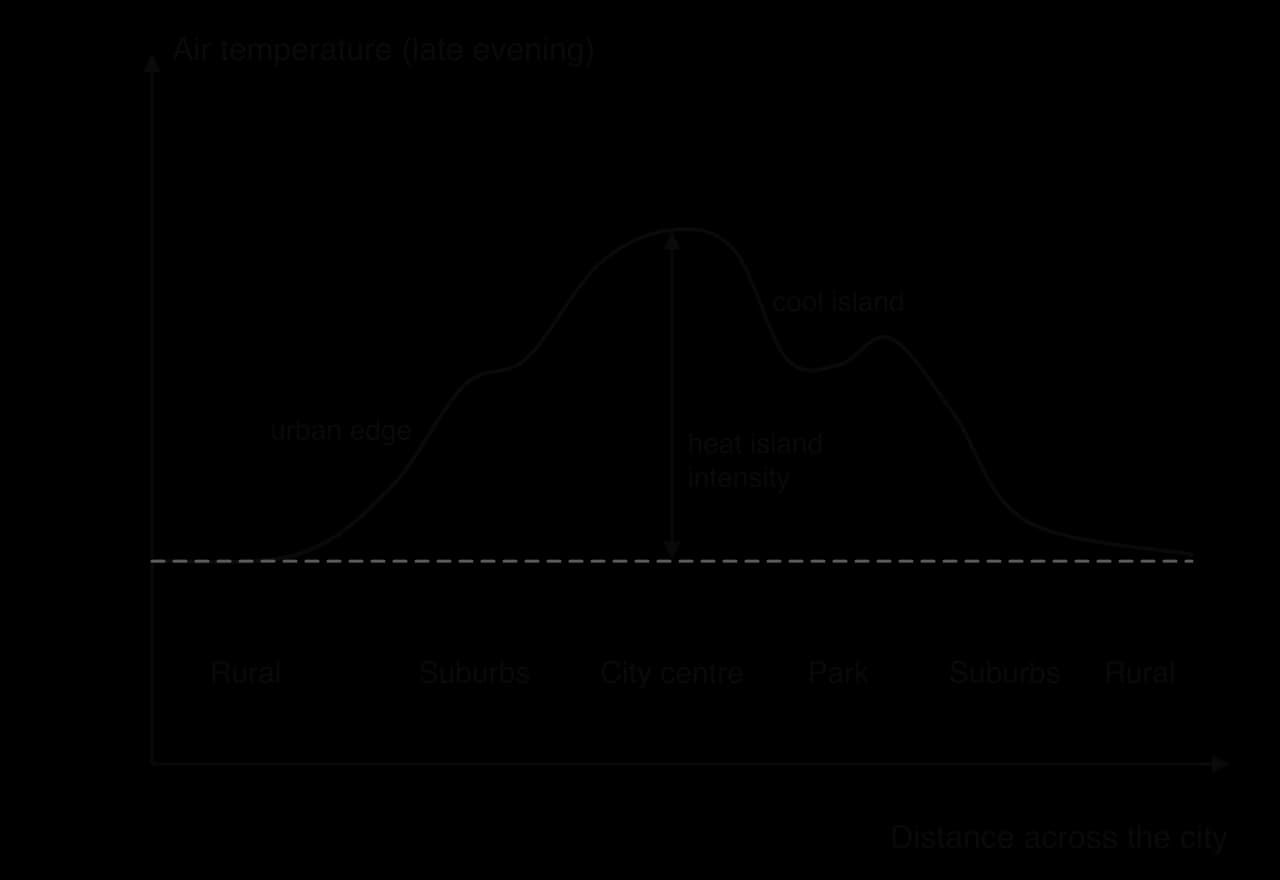
In the United States, urban areas are typically about 1–7 °F (0.6–3.9 °C) warmer than their surroundings by day and about 2–5 °F (1.1–2.8 °C) warmer at night. The extra heat raises demand for air conditioning, which releases more waste heat and, where electricity comes from fossil fuels, more greenhouse gases. It also increases the danger of heatwaves, especially for older people, because the city does not cool down at night. Hot roofs and roads also warm the rainwater that runs off them, which can harm fish in urban streams.
Sources: Wikipedia, “Urban heat island” (2026), citing the US Environmental Protection Agency.
The city as a system
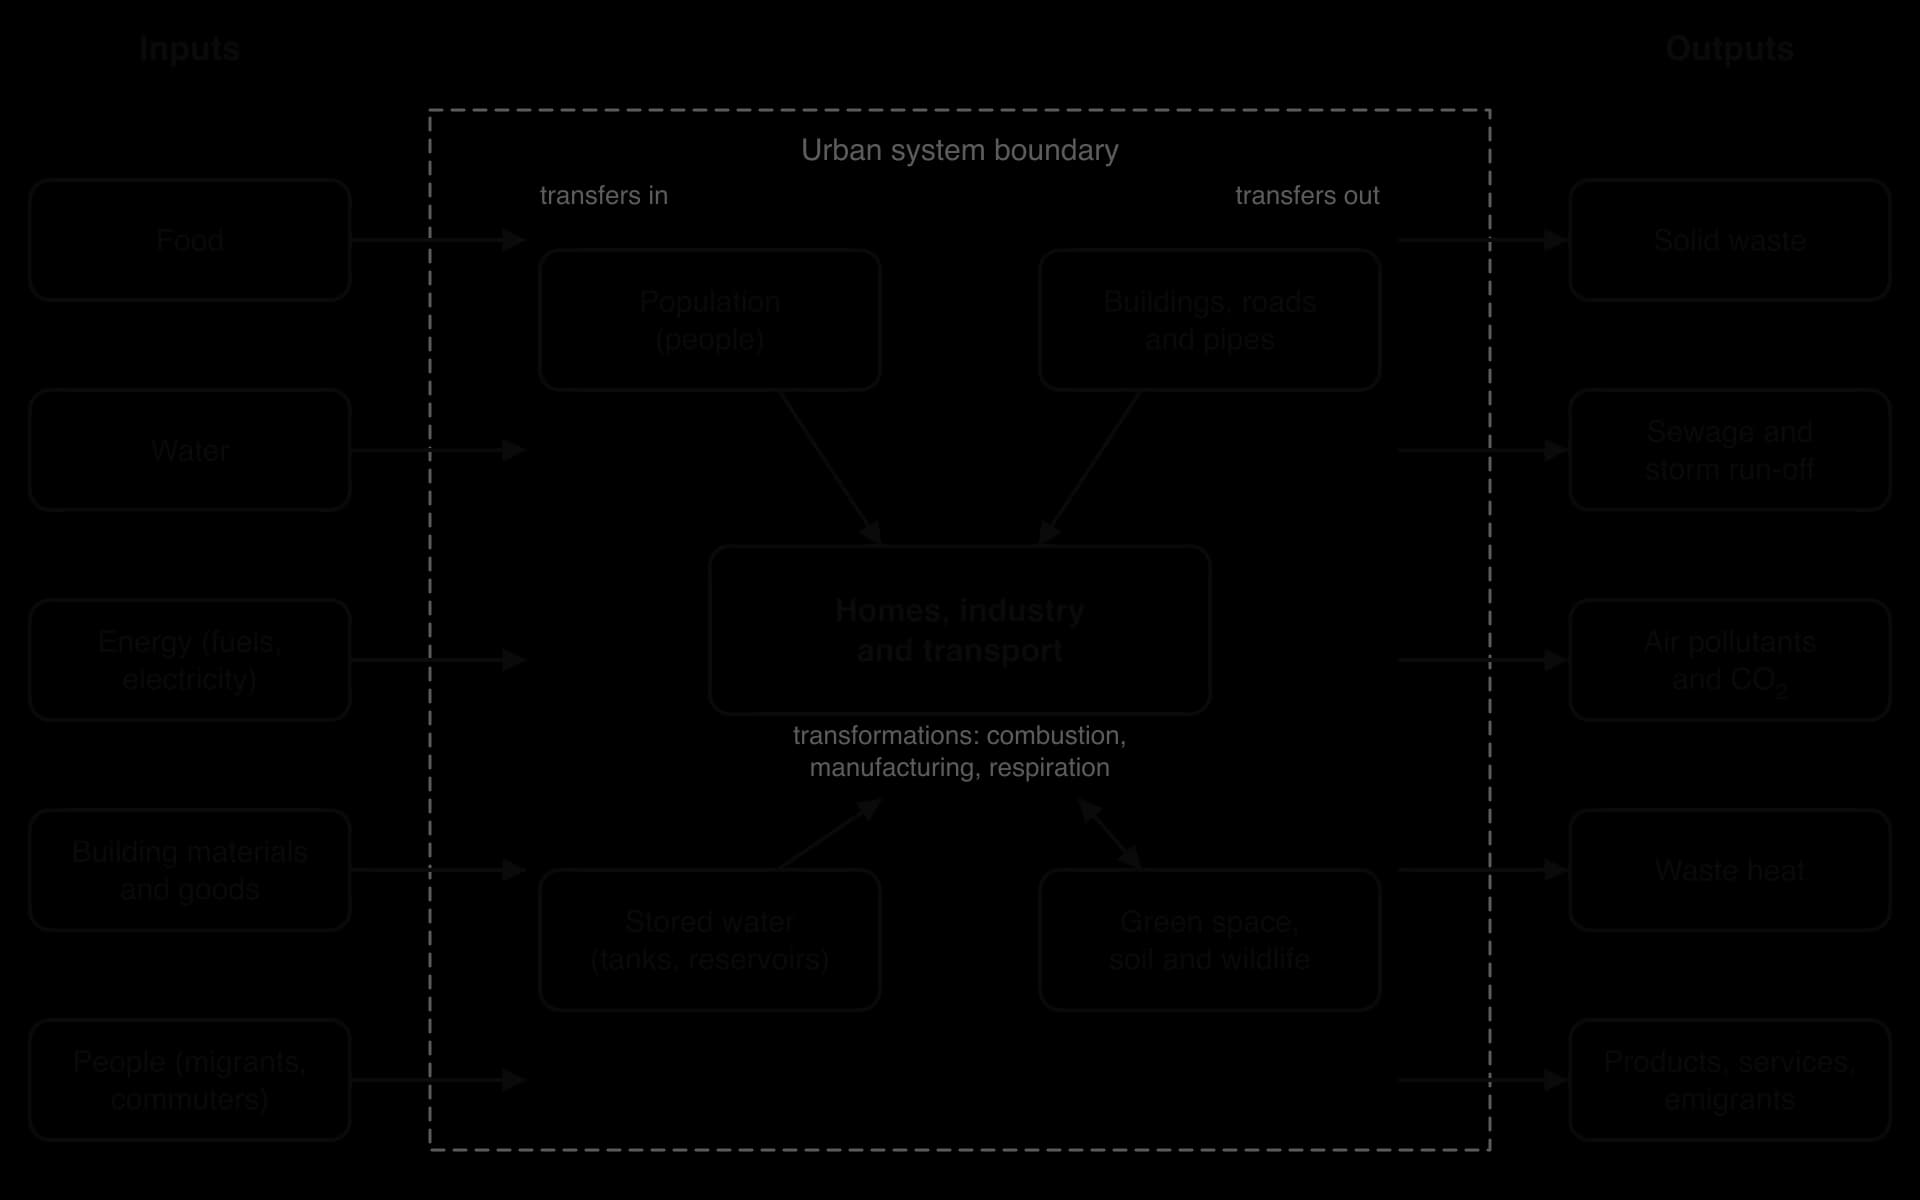
Like a lake or a forest, a city can be modelled as an urban system. It is an open system, exchanging both energy and matter with its surroundings across its boundary. Applying the conventions of a systems diagram, the storages go in boxes and the flows are arrows, each labelled with what moves. The difference from a natural ecosystem is the size and direction of the flows. A city imports almost everything it uses and exports almost all of it again as waste, heat and products.
Inputs, storages and outputs
Inputs: food, drinking water, energy (fuel and electricity), raw materials and manufactured goods, and people (migrants, commuters and tourists). Information and money also flow in.
Storages: the population itself; the materials locked in buildings, roads and pipes; water in tanks, reservoirs and the ground; carbon and nutrients in parks, soils and trees; and waste in landfills.
Outputs: solid waste, sewage and storm run-off, air pollutants and carbon dioxide, waste heat, manufactured goods and services, and people leaving the city.
Some flows are transfers: they move matter or energy from one place to another without changing it, such as water piped from a reservoir or food trucked into a market. Others are transformations: they change its chemical nature, state or form of energy. Burning petrol in a car transforms chemical energy into kinetic energy and heat and transforms carbon in the fuel into carbon dioxide; digesting food transforms it into body tissue, heat and sewage; manufacturing transforms raw materials into products.
Efficiency, sustainability and resilience of the urban system
Viewing the city as a system makes three questions easier to ask. The first is efficiency: how much useful output (housing, transport, services) a city delivers for each unit of energy, water and material it takes in. Dense cities with good public transport use less energy per person for travel than spread-out ones, and buildings that are well insulated need less energy for heating and cooling. Losses such as leaking water pipes, empty buildings and food thrown away are inefficiencies that can be measured and reduced.
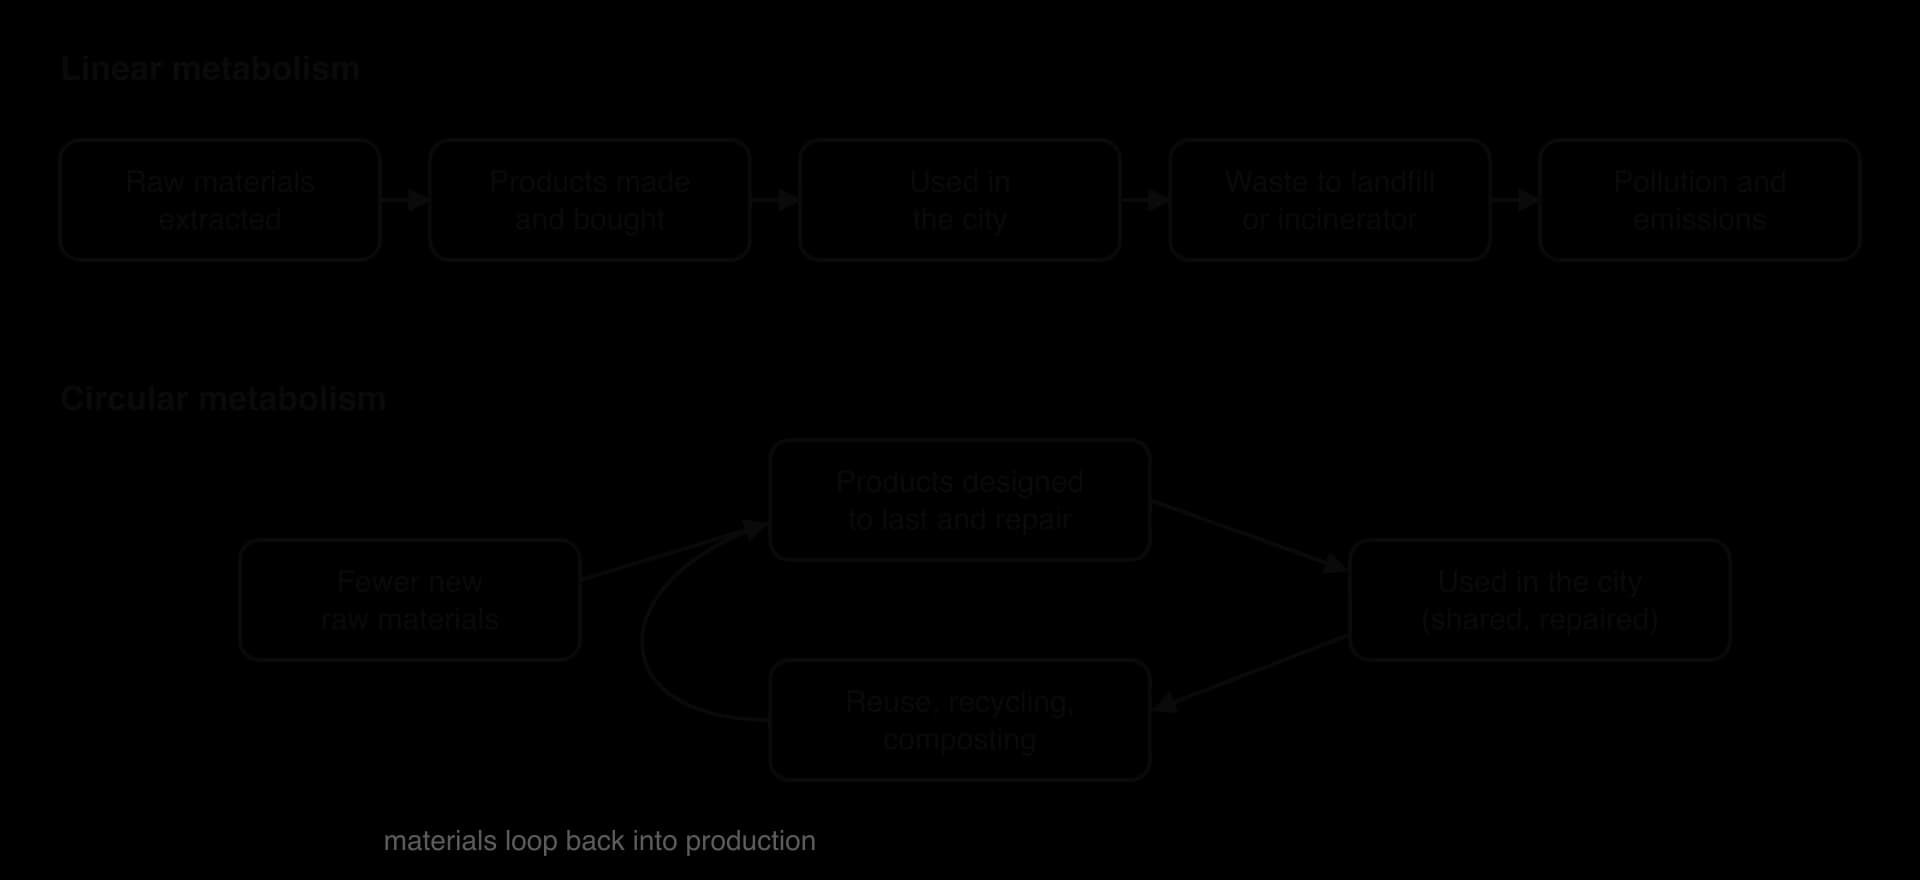
The second question is sustainability. Most cities work as part of a linear economy: resources come in, are used once and leave as waste. A city whose outputs become inputs again, where treated wastewater is reused, organic waste is composted and building materials are recycled, needs fewer new resources and produces less pollution. The city’s ecological footprint is usually many times larger than its own area, because the land that grows its food, absorbs its carbon dioxide and supplies its water lies far outside its boundary.
The third question is resilience. A city depends on long supply chains for food, water and energy, and a failure at one point (a drought, a flood, a power cut) can spread through the whole system. Resilience is greater where there is diversity and storage in the system: several water sources rather than one, local food production, distributed energy generation and green spaces that absorb floodwater.
Urbanisation
For most of human history almost everyone lived in the countryside. Urbanisation is the process that has reversed this. It has two sides: people move from rural to urban areas, and the land itself changes as fields and forests are replaced by buildings, roads and factories.
Urbanisation is measured as a proportion, not as the number of people in cities. If a country’s rural and urban populations both double, the number of city dwellers rises but the country has not urbanised at all. Urban populations also grow by natural increase (more births than deaths among people already living in cities), so a city can grow quickly even where the share of people living in cities is stable.
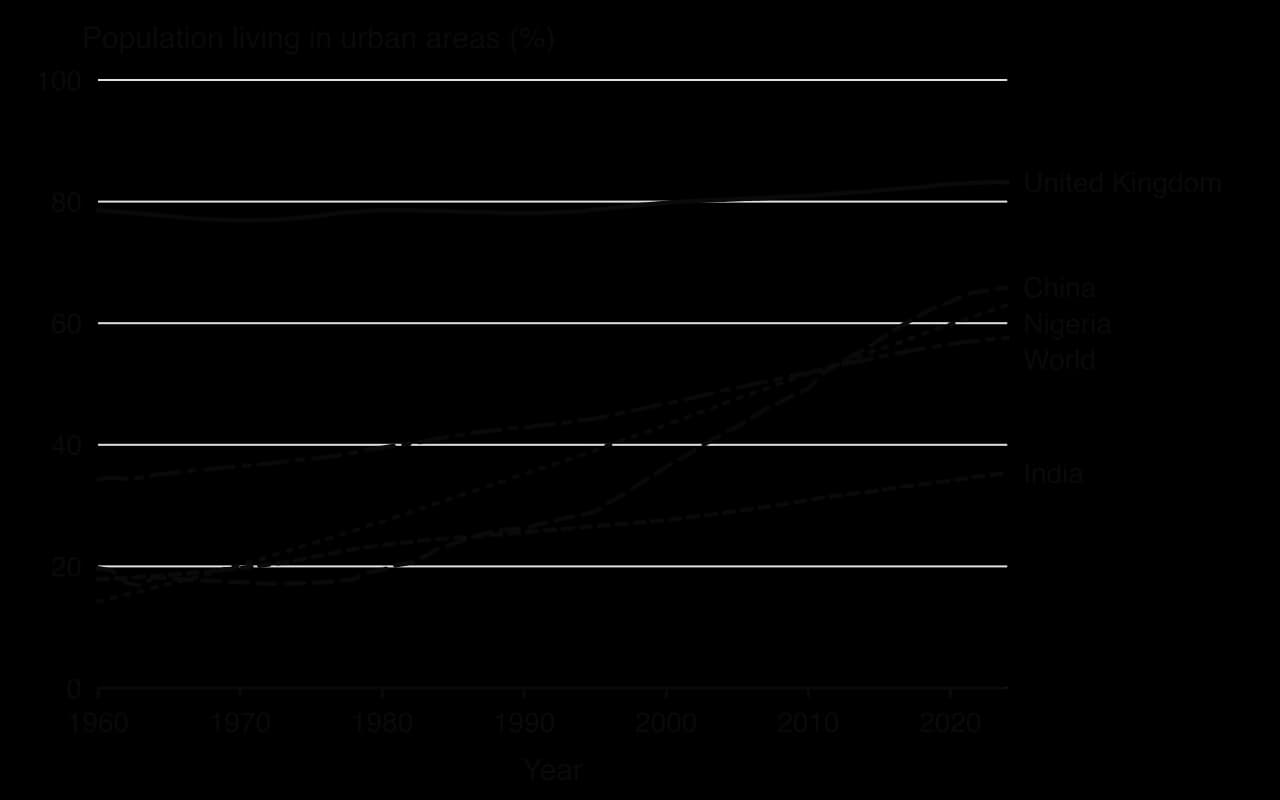
The world crossed the halfway mark around 2007. The share of the world’s population living in urban areas rose from 34.3% in 1960 to 57.6% in 2024 by national definitions. The pace has differed greatly between regions. In 1960 about 61% of people in high-income countries already lived in cities, compared with about 13% in low-income countries; by 2024 these figures were about 80% and 35%. Most urban growth is now in Asia and Africa.
Why people move to cities
Most urbanisation is driven by rural–urban migration: people moving from the countryside to towns and cities, usually within their own country. Migration decisions are explained with push–pull factors. Push factors are conditions that encourage people to leave a place; pull factors are real or perceived advantages that attract them to another.
Push factors (rural areas) | Pull factors (urban areas) | |
|---|---|---|
Economic | Few jobs outside farming; low and unreliable incomes; mechanisation reducing farm work; small farms divided between children | More and better-paid jobs in industry and services; informal work; higher wages |
Social | Poor access to secondary schools, hospitals and clean water; limited opportunities for young people and women | Schools, universities and hospitals; entertainment; greater personal freedom |
Environmental | Drought, soil degradation, floods, desertification and other effects of climate change | Perceived safety from rural hazards; piped water and electricity |
Political | Conflict, insecurity, land seizures | Government services, administration and investment concentrated in cities |
Many pull factors are perceived rather than real. New migrants often find only insecure, informal work and end up in overcrowded informal settlements without piped water or sanitation. The city still offers more opportunity on average, and money sent home by migrants (remittances) supports rural families, so migration continues.
Migration can be voluntary, when people choose to move for work, education or family, or forced, when they have little choice because of conflict, persecution, eviction or disasters. Floods, droughts and sea-level rise increasingly add an environmental push, which links urbanisation to climate change. Most rural–urban migration is internal, within one country, rather than international.
China shows how strongly policy shapes migration. Under the hukou household registration system, every citizen is registered as a resident of one place, and urban registration has long brought access to pensions, schools and health care that rural registration did not. Hundreds of millions of rural people moved to China’s cities from the 1980s onwards to work in factories and construction, often without urban registration and its benefits. Reforms announced in 2014 replaced the separate agricultural and non-agricultural categories with a single residence registration, although access to city services still varies.
 YouTube
Sources: UN DESA via Our World in Data (2025); Wikipedia, “Hukou” (2026).
Suburbanisation, sprawl and deurbanisation
As cities grow, they do not only become denser. Many people, especially wealthier families, move out from crowded inner areas to newer, lower-density housing at the edge of the city. This is suburbanisation. It is made possible by cars, commuter railways and roads, and it is driven by the wish for more space, gardens, quieter streets and cheaper land.
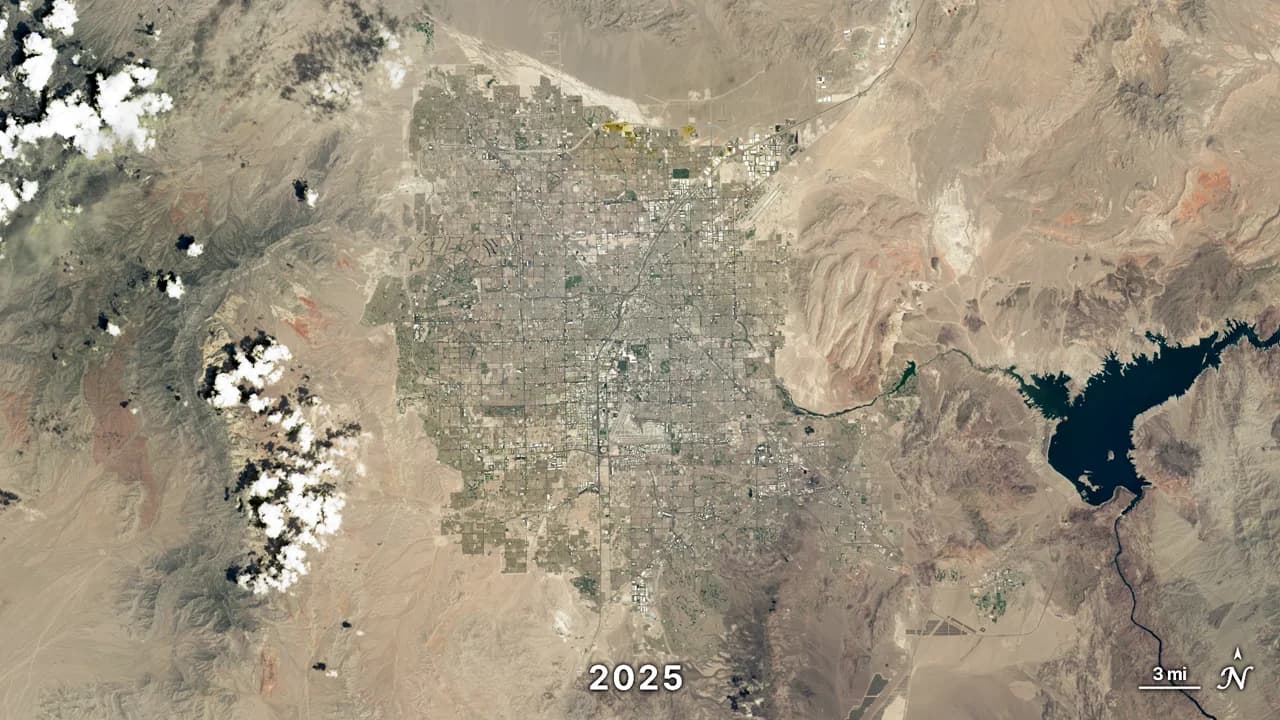
Because suburbs have fewer homes per hectare, each person uses much more land, and the city spreads outward into farmland and natural habitat. This uncontrolled outward growth is called urban sprawl. Sprawl is typical of many North American and Australian cities, where detached houses, shopping malls and office parks are separated and linked by roads, so that almost every journey needs a car.
Deurbanisation
In some places and periods the share of people living in cities falls. Deurbanisation occurs when people move from cities to small towns and rural areas. It happened in many high-income countries from the 1970s, when better transport and communications let people live in the countryside while working in cities or from home, and when old industrial cities lost their jobs.
Detroit in the United States is an extreme case of city-centre decline. Its population peaked at 1.85 million in 1950 and fell to 639,111 by 2020, a fall of about 65%, as the car industry lost jobs and residents moved to the suburbs and beyond. The city filed for bankruptcy in 2013, and since 2014 it has demolished more than 27,000 abandoned houses. Estimates show the population growing again in 2024 and 2025. Detroit’s decline was suburbanisation and deindustrialisation more than deurbanisation, because most people moved to the surrounding suburbs rather than to rural areas, which shows why the terms must be used carefully.
Sources: Wikipedia, “Detroit” (2026), citing the US Census Bureau.
How urban expansion changes the environment
When a city expands, the land underneath it changes from a semi-natural or farmed ecosystem to a largely sealed, built surface. This alters almost every flow and storage of the local environment.
Loss of land and habitat
Cities usually grow on the most fertile land, because settlements were first built on river plains and coasts where farming was best. Urban expansion therefore removes high-quality farmland, forests, wetlands and grasslands, causing habitat loss and habitat fragmentation. Roads and suburbs cut the remaining habitat into small patches, which isolates populations of animals and plants. Demand for building materials (sand, gravel, timber, limestone for cement) also changes land far beyond the city.
Changes to water flows and water quality
Roofs, roads and car parks are impermeable surfaces: rain cannot soak into them. Less water infiltrates the soil and recharges groundwater, and more becomes surface run-off that drains rapidly into gutters, pipes and rivers. As a result, river discharge rises sooner and higher after a storm, and urban areas are more prone to flash floods. Between storms, rivers may run lower because less groundwater feeds them.
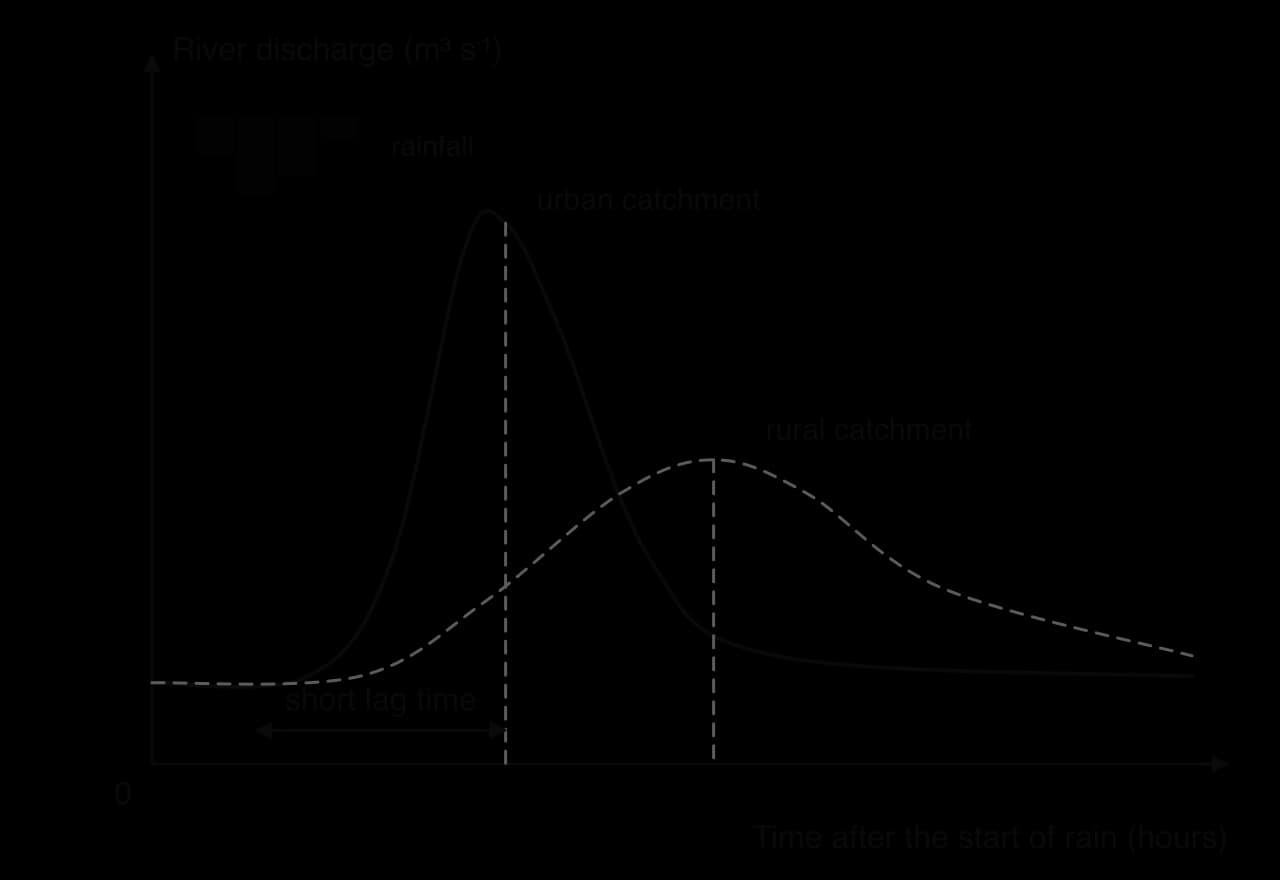
The storm hydrograph shows this change clearly. Water quality falls as well: run-off carries oil, metals from tyres and brakes, litter, animal waste and road salt into streams, and old sewers that carry both sewage and rainwater can overflow into rivers during heavy rain. Heated run-off from hot roofs and roads raises stream temperatures.
Pumping groundwater for a growing city can also make the land sink. Parts of Jakarta, Indonesia, have subsided as groundwater has been extracted from beneath the city, adding to the flood risk on its low coast. Overpopulation and land sinking were among the reasons given in 2019 for moving Indonesia’s capital to a new city, Nusantara, in East Kalimantan, for which a law was passed in 2022.
Changes to air and climate
Traffic, power generation, industry and the burning of waste and fuel concentrate air pollutants in cities, which are studied in detail under urban air pollution. Cities also create their own climate: the urban heat island raises temperatures, buildings reduce average wind speed but funnel strong gusts between tall blocks, and rainfall can increase downwind of large cities. Because cities use most of the world’s energy, urban growth is closely tied to global greenhouse gas emissions.
Part of the environment | Change caused by urban expansion | Example of an impact |
|---|---|---|
Land | Farmland, forest and wetland covered by buildings and roads | Loss of food production and of habitat; fragmentation of wildlife populations |
Water quantity | Less infiltration, more and faster run-off, groundwater pumping | Flash floods; lower river flow in dry periods; subsidence (Jakarta) |
Water quality | Polluted run-off and sewer overflows; warmer water | Toxic pulses after storms; eutrophication downstream; fish deaths |
Air | Emissions from traffic, industry, heating and power | Respiratory and heart disease; acid deposition; smog |
Climate | Low albedo, heat storage, waste heat, less evapotranspiration | Urban heat island; heat stress; higher energy demand for cooling |
Is urban living always worse for the environment?
Not necessarily. Per person, people in dense cities often use less land, less energy for heating (because flats share walls) and less fuel for transport than people in rural areas or sprawling suburbs. Concentrating people in cities can also leave more land for farming and nature elsewhere. The environmental cost of a city depends greatly on how it is built and run, which is why urban planning matters.
Urban planning
Cities that grow without a plan tend to develop serious problems: housing built on flood plains, factories next to homes, roads too narrow for traffic, and no space left for parks or schools. Urban planning is the process of deciding in advance how land and buildings in a city will be used, and where its infrastructure will go.
Planners divide land into zones (residential, commercial, industrial, green space), set rules on the height and density of buildings, plan transport networks, water supply and drainage, and reserve land for schools, hospitals and parks. Their decisions affect different stakeholders in different ways. A new motorway may help commuters and businesses but divide a neighbourhood and pollute the air of people living beside it; a new park may raise local house prices so that poorer tenants can no longer afford to live nearby.
Stakeholder | Typical needs and priorities |
|---|---|
Residents | Affordable, safe housing; clean air; parks; short, cheap journeys; schools and health care nearby |
Businesses and industry | Land, transport links for goods and workers, reliable energy and water, customers |
City government | Tax income, economic growth, public health, services that can be paid for, re-election |
Developers and landowners | Profit from building; permission to build at high density or on new land |
Environmental groups | Protection of green space, rivers and wildlife; lower emissions and pollution |
Future residents | A city that still works, and has resources, in 50 years’ time |
 YouTube
Planning for sustainability
Modern urban planning increasingly aims to make the whole urban system sustainable. This means meeting people’s needs for housing, work and services while reducing the city’s use of resources and its outputs of waste and pollution, and spreading the benefits fairly. The main features of a sustainable city are well established:
Quality, affordable housing close to jobs, so that people do not have to commute long distances.
Integrated public transport: buses, trams and trains linked by shared tickets and timetables, with safe walking and cycling routes.
Green spaces such as parks, river corridors and street trees, for health, wildlife, cooling and flood control.
Security, education and employment available in every neighbourhood.
Renewable energy and energy efficiency in buildings and infrastructure.
Reuse and recycling of waste, and the reuse of treated wastewater.
Community involvement in decisions, so that plans meet local needs.
Green buildings that use less energy and water and are built from low-impact materials.
Green space is one of the cheapest ways to improve several parts of the urban system at once, because the same park can cool the air, store floodwater, support wildlife and improve health. Buildings matter as much, because they use most of a city’s energy.
Named plans, old and new
Many of these ideas are not new. When Barcelona expanded beyond its medieval walls, the engineer Ildefons Cerdà designed the Eixample (“extension”), approved in 1859–1860. It is a grid of square blocks about 113 m across with cut-off (chamfered) corners and 20 m wide streets. Cerdà planned to build on only two sides of each block and leave a garden in the middle, so that every home would receive sunlight and fresh air, partly to reduce disease.
Under pressure from land speculation, the gardens were later built over and blocks were closed on all four sides, and the Eixample became one of the densest districts in Europe, which shows how plans can be undermined by economic interests.
Copenhagen, Denmark, is known for reducing car use. The city has about 350 km of cycle tracks separated from traffic by kerbs, a regional network of “cycle superhighways” begun in 2009, and a long-term strategy that set a target of 50% of trips to work and education by bicycle (from 35% in 2010). Cycling reduces emissions, noise and congestion and improves health. Copenhagen’s experience suggests that large numbers of people choose to cycle once cycling is safe, fast and convenient.
Forest City in Johor, Malaysia, is a more controversial example. Announced in 2006 and opened in 2016 by the Chinese developer Country Garden, it was marketed as a green “eco-city” on four artificial islands for 700,000 people. Land reclamation began in 2014 without the legally required detailed environmental impact assessment and split Malaysia’s largest seagrass meadow, next to a protected mangrove wetland.
By 2023 only about 8,000–9,000 people lived there, and it has been described as a ghost town. The project shows that a sustainable label on a plan does not make it sustainable: building on reclaimed coastal wetland for an absent population destroys natural capital without meeting any housing need.
Sources: Wikipedia, “Cerdà Plan”, “Cycling in Copenhagen” and “Forest City, Johor” (2026).
Ecological urban planning
Conventional planning treats a city mainly as a machine for living and working, with nature as decoration. Ecological urban planning goes further: it treats the urban system as an ecosystem and plans for the relationships between its biotic and abiotic components. Rivers, soils, vegetation, wildlife, climate and people are planned together, so that natural processes do useful work for the city, such as cooling the air, storing floodwater or cleaning wastewater.
Five main approaches are used. They overlap, and most cities combine several of them.
Urban ecology
Urban ecology as a planning approach protects and creates habitat within the city: parks, wildlife corridors along rivers and railways, ponds, canals, allotments and wild areas. Linking green spaces into networks lets animals and plants move between them, reducing the effects of fragmentation. Green spaces also cool the city, absorb rainwater and improve people’s physical and mental health.
Singapore aims to become a “City in Nature” by 2030 under its national Green Plan (2021), by expanding its network of nature parks, restoring nature to streets and buildings, and linking green spaces. The policy builds on decades of tree planting and on Gardens by the Bay, opened in 2012 on 105 hectares beside Marina Bay. Its eighteen “Supertrees”, 25–50 m tall, are vertical gardens that also carry solar panels, collect rainwater and act as air vents for the cooled glasshouses.
Urban farming
Urban farming produces food within the city: allotments and community gardens, rooftop and balcony gardens, beekeeping, city farms with animals, aquaculture in tanks, and indoor vertical farming. It shortens the distance food travels, uses organic waste as compost, turns unused land into productive green space, and can improve food security and diets in poor neighbourhoods. Its contribution to a city’s total food supply is small, and urban soils can be contaminated with lead and other metals, so it complements rather than replaces rural farming.
Biophilic design
People tend to feel calmer and healthier when they are in contact with nature. Biophilic design builds this contact into buildings and streets with living walls and roofs, indoor trees, water features, natural light and natural materials. A green roof is covered with soil and plants; a green wall (or living wall) has plants growing on a vertical surface. Both insulate the building, cool the surrounding air through evapotranspiration, hold back rainwater, trap dust and provide habitat for insects and birds.
Green roofs are the most common biophilic feature added to existing cities, because flat roofs are otherwise unused space.
The Bosco Verticale (“vertical forest”) in Milan, Italy, completed in 2014, is a well-known example: two residential towers whose balconies hold about 730 trees, 5,000 shrubs and 11,000 smaller plants of 94 species, equivalent to about one hectare of forest. The plants shade the flats, filter dust, reduce noise and support insects and birds. The plants need an irrigation system and regular specialist care, which adds to the cost of the flats, so buildings of this kind are hard to apply to affordable housing and their benefits may not reach most of the city.
Resilience planning
Resilience planning prepares the urban system to withstand and recover from shocks such as floods, heatwaves, storms, droughts and power failures, many of which are becoming more frequent with climate change. Examples include building homes on stilts in flood-prone areas, fail-safe electricity grids with local generation and storage, rain gardens and parks that flood safely, vertical farms that keep producing food when supply chains break, and several independent sources of water.
Resilience planning works with natural processes as well as engineering. Wetlands, mangroves and floodplain parks absorb water more cheaply than higher walls, and they keep working as conditions change.
Regenerative architecture
Most buildings only reduce harm: they use less energy or water than a conventional design. Regenerative architecture aims for buildings that give back more than they take: skins that scrub pollutants from the air, rainwater capture that recharges aquifers, and solar panels, wind turbines or biodigesters that export surplus energy to the grid. A regenerative building acts like a tree in the urban ecosystem, producing resources and cleaning its surroundings.
Approach | Main idea | Examples | Main benefit | Main limitation |
|---|---|---|---|---|
Urban ecology | Habitats and corridors in the city | Parks, canals, ponds, allotments | Biodiversity, cooling, health | Competes with housing for land |
Urban farming | Food produced in the city | Rooftop gardens, beehives, vertical farms | Short supply chains, community | Small share of food; soil contamination |
Biophilic design | Contact with nature in buildings | Green walls and roofs, Bosco Verticale | Wellbeing, insulation, cooling | Cost, maintenance, irrigation |
Resilience planning | Withstand and recover from shocks | Stilt houses, flood parks, local grids | Fewer losses in disasters | Expensive; benefits not seen until a disaster |
Regenerative architecture | Buildings that give back | Energy-positive buildings, rainwater recharge | Net gain for the environment | High cost; new and unproven at scale |
Perspectives on how cities should change
Different environmental value systems lead to different visions of the sustainable city. The table summarises how each broad perspective tends to view urban problems and their solutions.
Perspective | How it sees the city | Favoured solutions |
|---|---|---|
Technocentric | Problems are technical and can be solved by better technology and management | Smart grids, electric vehicles, sensors that manage traffic and energy, high-tech eco-districts |
Anthropocentric | The city exists for human wellbeing; nature is managed for people’s benefit | Planning, regulation and public investment in housing, transport and parks; cost–benefit decisions |
Ecocentric | Cities have outgrown their ecosystems; nature has value in itself | Smaller footprints, lower consumption, rewilding urban land, local food, community control |
In practice, successful cities combine these views. Copenhagen’s cycling relies on simple infrastructure and changes in behaviour more than on high technology, while Singapore relies heavily on technology and state planning to bring nature into a very dense city. Indigenous and traditional knowledge, such as building for local climates with local materials, adds a further perspective.
Case study: integrated transport and land-use planning in Curitiba, Brazil
Context
Curitiba is the capital of the state of Paraná in southern Brazil. Like most Brazilian cities, it grew very fast in the second half of the 20th century, as millions of people left the countryside: Brazil’s urban share rose from 44.7% in 1960 to 87.9% in 2024. Curitiba had about 430,000 people in the 1960s; by 2024 the municipality had about 1.83 million, and the wider metropolitan area of 29 municipalities about 3.6 million.
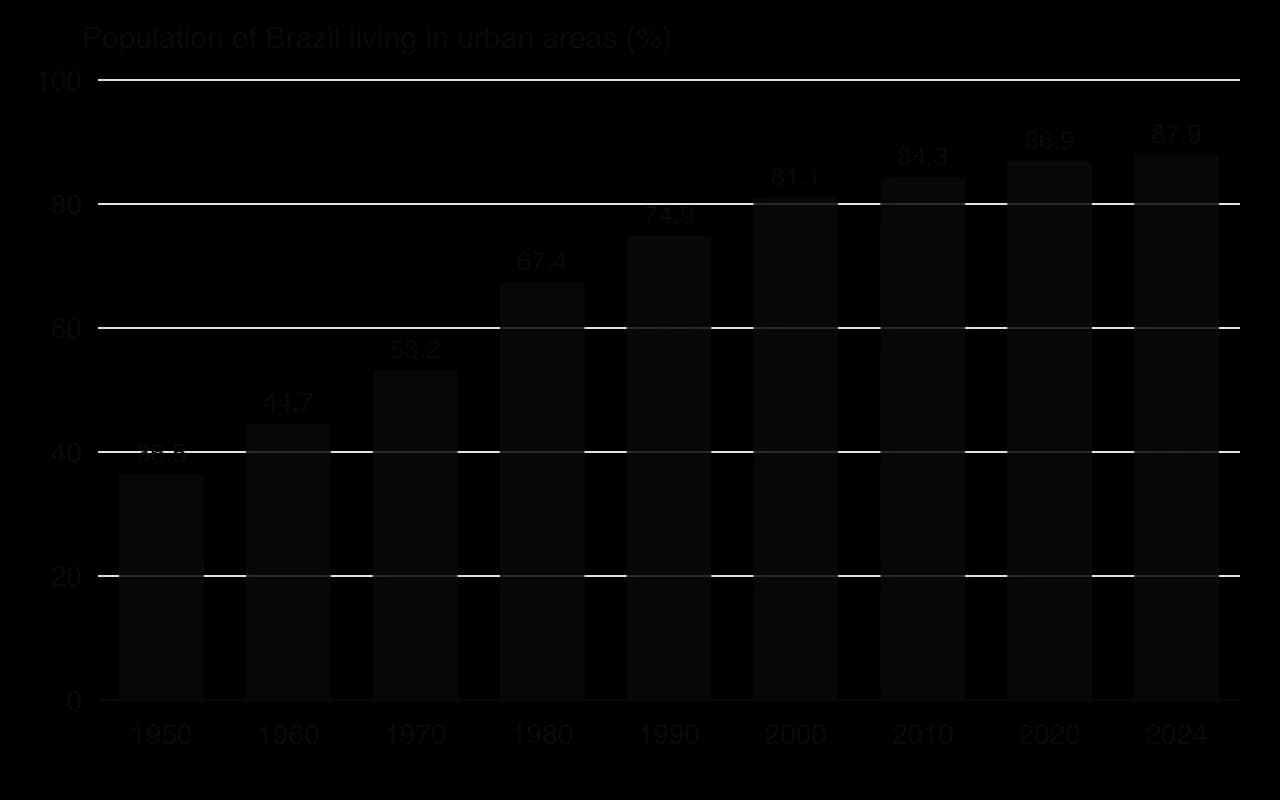
Rapid growth of this kind often produces congested roads, sprawling informal settlements and polluted rivers. Curitiba’s response, from the late 1960s onwards, was a master plan that linked land use, transport and green space, developed by a team of planners and architects led by Jaime Lerner, who later served three times as mayor, first in the early 1970s.
What was done
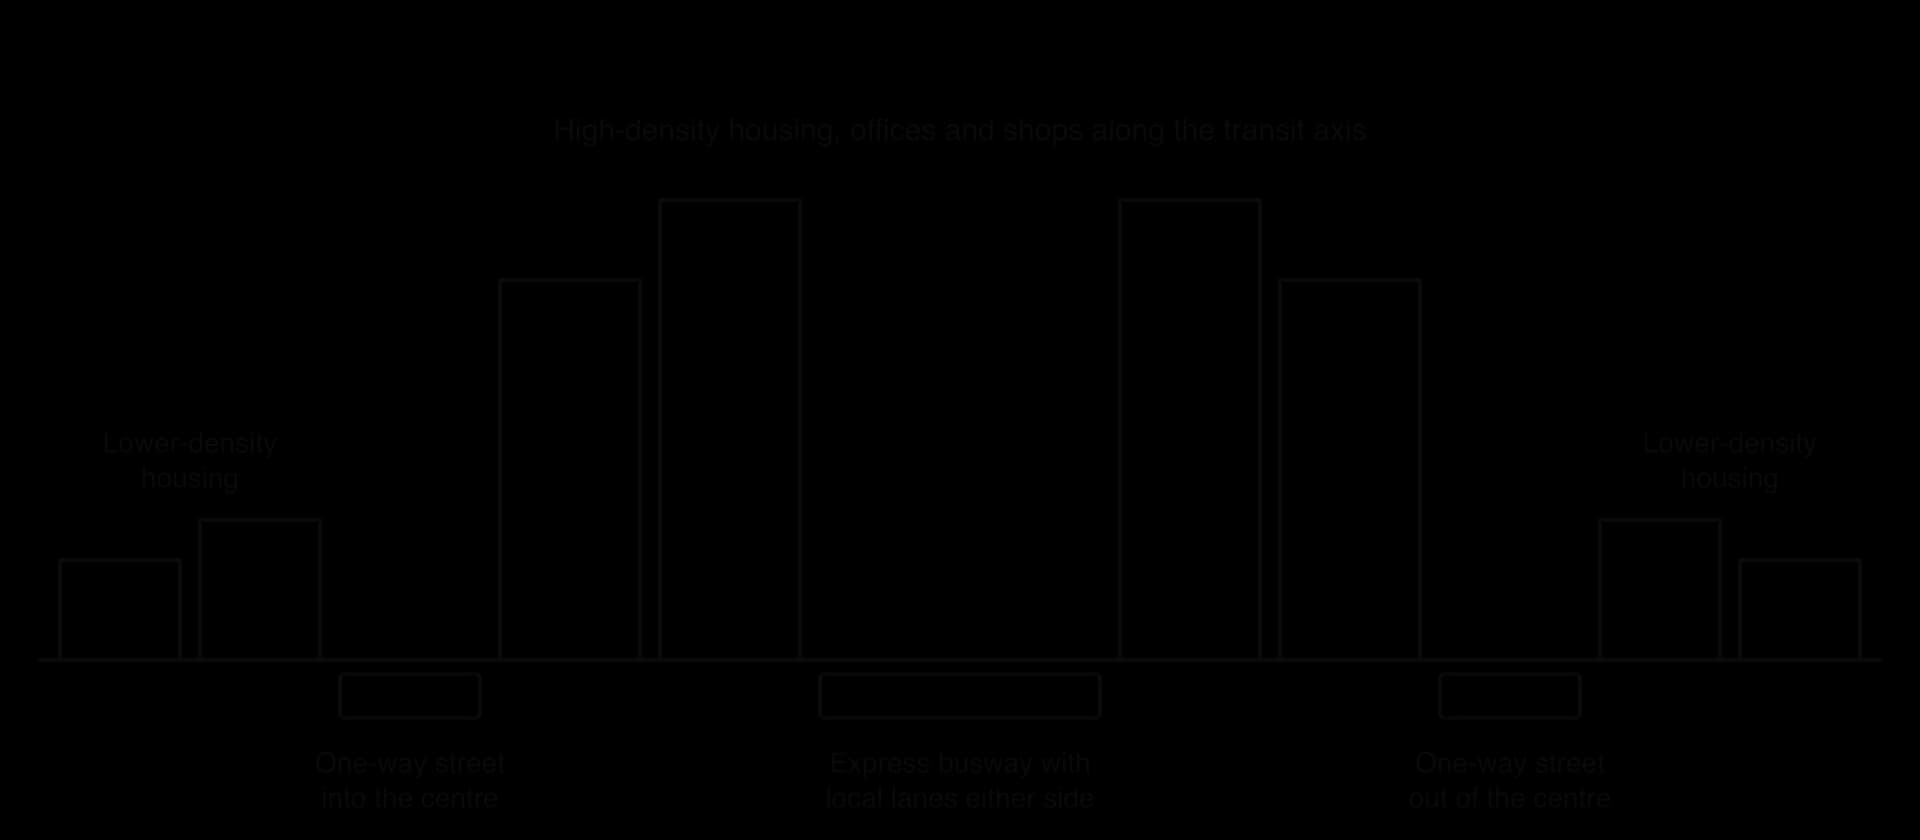
Instead of letting the city spread in every direction around one centre, the master plan (adopted in 1968) directed growth along five “structural axes” radiating from the centre in a star pattern. Each axis uses a trinary road system: a central road with dedicated lanes for express buses, flanked by local lanes, with one-way streets one block away on each side carrying cars into and out of the city. Zoning allows the tallest, densest buildings only along the axes and keeps lower-density housing further away, so that many people live and work within a short walk of a fast bus.
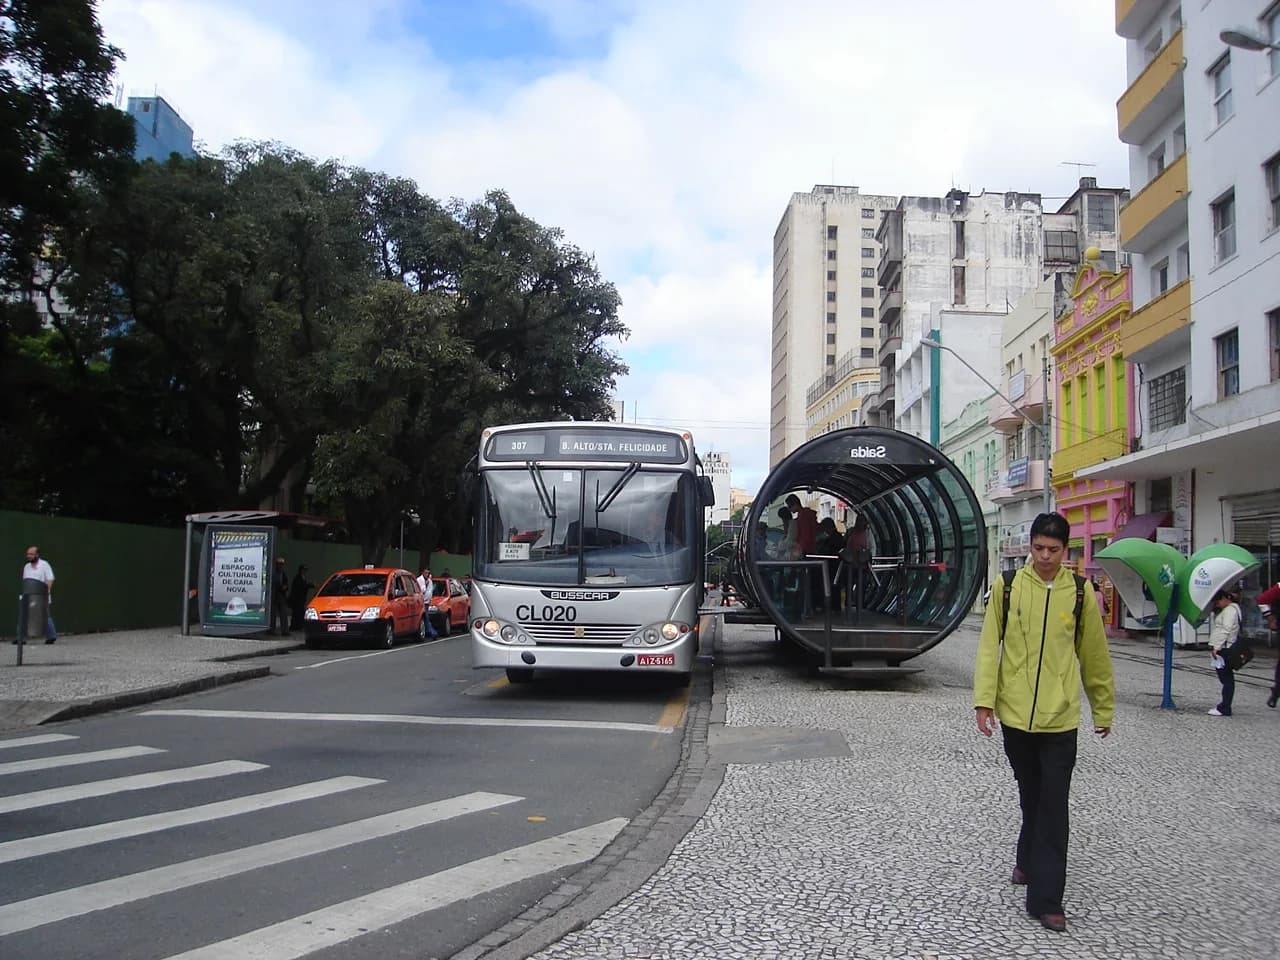
The bus network, the Rede Integrada de Transporte (Integrated Transport Network), began operating in 1974. It was one of the first bus rapid transit systems: buses run in their own lanes, passengers pay before boarding at raised tube-shaped stations and step level into long bi-articulated buses, so stops take seconds. From 1980 passengers could travel between any two points in the city for a single fare, which helped people living on the periphery. The system covers about 81 km and carries about 2.3 million passengers a day.
Green space and flood control were planned together. From the 1970s, instead of channelling rivers into concrete canals, the city created parks around them, with lakes that store floodwater after heavy rain, and protected river valleys from building. Curitiba now has about 51.5 m² of green space per inhabitant. A recycling programme exchanged household waste for bus tokens, giving residents a direct reward for sorting and collecting their rubbish.
Data
Indicator | Value |
|---|---|
Population of the municipality | About 430,000 (1960s); about 1.83 million (2024) |
Metropolitan area | About 3.6 million in 29 municipalities |
BRT network | Began 1974; single integrated fare from 1980; about 81 km |
BRT passengers | About 2.3 million a day |
Green space | About 51.5 m² per inhabitant |
Population in irregular (informal) settlements | About 163,300 people (2010); this population grew 12.4% from 2000 to 2010, faster than the city as a whole (10.3%) |
BRT ridership trend | Fell by about 14 million passenger journeys between 2008 and 2014 |
Sources: Wikipedia, “Curitiba” and “Rede Integrada de Transporte” (2026), citing IBGE and URBS; UN DESA via Our World in Data (2025).
Management and responses from different perspectives
The plan reflects an anthropocentric, planning-led view: the city government shaped land use and transport for public benefit, using low-cost technology (buses rather than a metro) that a middle-income city could afford. It also includes ecocentric elements in the protection of river valleys and the use of natural floodplains instead of engineering. The BRT model became one of Curitiba’s most influential exports: TransMilenio in Bogotá, Metropolitano in Lima, TransJakarta and many others were inspired by it.
Group | View of the plan |
|---|---|
City planners and politicians | International reputation and a model for other cities; awarded the Global Sustainable City Award in 2010 |
Residents along the axes | Fast public transport, services and parks within reach |
Low-income residents on the periphery and in neighbouring municipalities | Long journeys; routes do not cross the municipal boundary, so many pay two fares; housing near the axes is expensive |
Car owners and businesses | Congestion in the centre; the city has more cars per inhabitant than any other Brazilian state capital |
Environmental groups | Valued parks and flood control; concern about traffic emissions and the loss of bus passengers |
Evaluation
Curitiba shows that a middle-income city can plan for sustainability without great wealth. Linking density to transport reduced car dependence along the axes, the parks cut flood damage while adding habitat and recreation, and the BRT showed that buses could do the job of a metro for a fraction of the cost. The ideas spread worldwide, which is perhaps the plan’s greatest success.
The limits are equally clear. The plan covered the municipality, but most recent growth has been in the surrounding metropolitan municipalities, where planning is weaker and many poorer households live. Informal settlements still grew faster than the city in 2000–2010. Car ownership is high, the BRT is overcrowded at peak times, the fleet has been reduced and ridership fell between 2008 and 2014, and a metro has been planned because the bus system is reaching its capacity. A plan made in the 1960s and 1970s needs constant renewal as a city grows to several times its size.
What it shows
Curitiba shows the city working as a system: by linking the flows of people (transport), the use of land (zoning and density) and the flows of water (parks as flood storage), planners improved several parts of the system at once. It is an example of planning for sustainability and of early ecological urban planning, and also of the difficulty of making the benefits reach everyone in a fast-growing, unequal city. The compact corridors along the structural axes anticipate the HL principles of compactness and mixed land use.
Sources: Wikipedia, “Curitiba” and “Rede Integrada de Transporte” (2026).
Compact cities, mixed land use and social mix (HL only)
Ecological urban planners generally agree on three principles for the shape of a sustainable city. They concern how densely the city is built, how its land uses are arranged, and who lives where. Each one reduces the flows of energy and materials the urban system needs, and each one affects how fairly the city’s benefits are shared.
Urban compactness
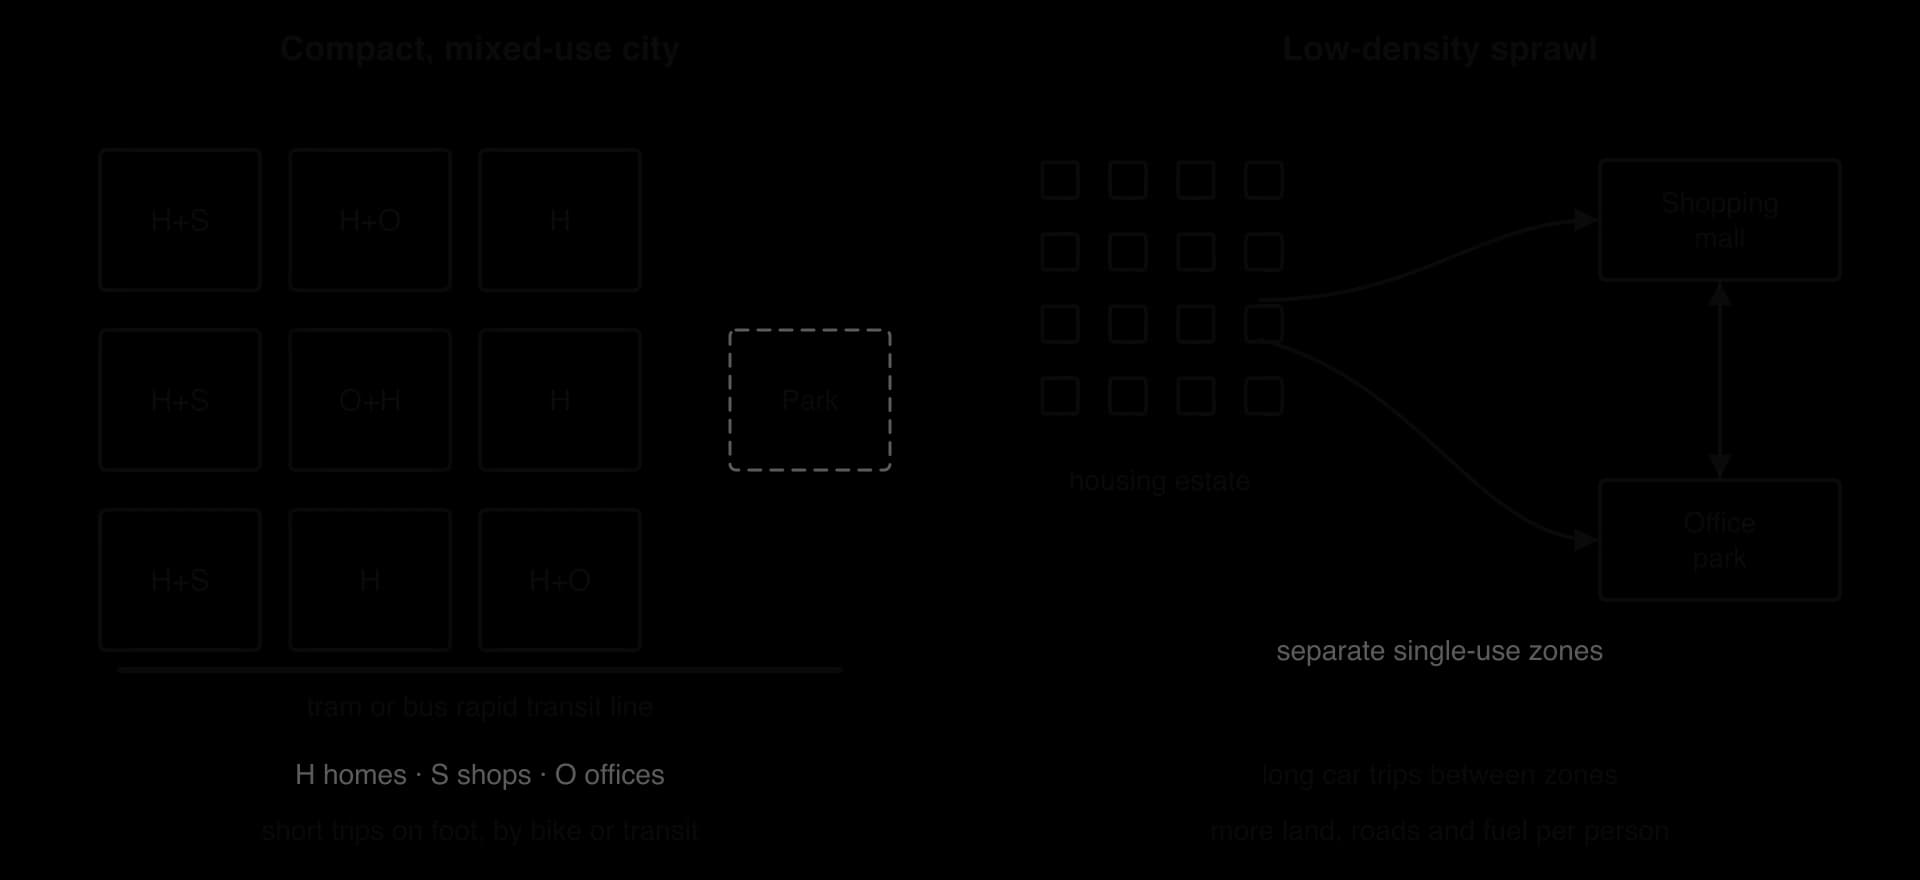
A compact city houses its population on a relatively small area, with buildings close together, so that it does not sprawl into the countryside. This does not mean skyscrapers everywhere; many of the most compact European city districts consist of five- to eight-storey blocks around courtyards.
Less sprawl: farmland, forests and wetlands outside the city are protected.
Less car dependency: shorter distances make walking and cycling practical, and enough people live near each stop to make frequent public transport affordable.
Lower energy use: flats and terraced houses share walls and lose less heat; shorter networks of roads, pipes and cables are needed for each person.
Better access: shops, schools, clinics and jobs are within reach of people who cannot drive, including children, older people and those on low incomes.
Mixed land use
Twentieth-century planning often separated land uses into zones: housing in one area, offices in another, shops in malls and factories in industrial estates. Separating dirty industry from homes protected health, but it also made people travel between zones for almost everything. Mixed land use puts homes, shops, offices, schools and leisure close together, often in the same building, with shops on the ground floor and flats above.
Social mix
Social mix means that people of different incomes, ages and backgrounds live in the same neighbourhoods, rather than the rich and the poor being separated into different districts. Mixed neighbourhoods tend to have better services for everyone, because wealthier residents press for good schools, parks and transport that poorer residents can also use. They also reduce the long commutes of low-paid workers who cannot afford to live near their jobs.
Vienna, Austria, is often cited as an example. During the period known as Red Vienna (1919–1934) the city built more than 60,000 municipal flats (Gemeindebauten), allocated by a points system that favoured families and less affluent residents, and it has continued to build social housing since. Its municipal estates stand in many districts, from Döbling and Ottakring to Floridsdorf and Brigittenau, so households with different incomes share the same parts of the city.
Sources: Wikipedia, “Vienna” and “Gemeindebau” (2026).
Environmental justice and access to green space
Green space, clean air and cool streets are not shared equally. In many cities, wealthier neighbourhoods have more trees and parks, while poorer neighbourhoods are hotter, more polluted and closer to motorways and industry. When a city adds a park or greens a district, house prices and rents often rise and poorer residents may be pushed out, a process called green gentrification. Fair access to green space is therefore a question of environmental justice: the fair distribution of environmental benefits and harms between groups of people.
Compactness and social mix support environmental justice when they are combined: a compact city with affordable housing in every district gives low-income residents the same short journeys, parks and services as wealthier ones. Without social mix, compactness can simply produce crowded, expensive centres that only the wealthy can afford.
Limitations and critiques of the compact city
Very high density can mean overcrowding, less private space, a stronger urban heat island and the loss of gardens and small green spaces to new building (“town cramming”). Air pollution exposure can be higher where many people live close to busy roads. Land prices in the most accessible areas rise, which can push poorer people to the edge. Most planners therefore aim for moderate density with plenty of green space, rather than maximum density.
A legal angle: zoning codes and planning law decide what can be built where, so laws requiring a share of affordable homes in every new development are a direct tool for social mix. An ethical angle: environmental justice asks whether the people who suffer most from heat and pollution have a fair say in planning decisions.
Circular and doughnut cities (HL only)
Most cities run a linear metabolism: resources enter, are used once and leave as waste and emissions. Two models from the study of sustainability are now being used to redesign whole cities. The circular economy keeps materials in use for as long as possible through design for durability, repair, reuse, remanufacturing and recycling, so that waste becomes a resource. Doughnut economics defines a safe and just space for humanity between a social foundation (the minimum everyone needs) and an ecological ceiling (the planetary boundaries that must not be crossed).
Amsterdam: a city doughnut and a circular strategy
In April 2020, as it planned its recovery from the COVID-19 pandemic, the City of Amsterdam in the Netherlands introduced the Amsterdam City Doughnut, developed with the economist Kate Raworth and her team, and adopted it as a framework for city policy. The “Amsterdam City Doughnut” scaled the global model down to the city: it asks what it would mean for the people of Amsterdam to thrive (housing, health, income), while respecting the health of the local environment and of the whole planet, including the environmental effects of the goods the city imports.
The city combined this with the Amsterdam Circular Strategy 2020–2025. Its long-term goals are to halve the use of new raw materials by 2030 and to become a fully circular economy by 2050. The strategy focuses on three value chains where the city has most influence:
Food and organic waste: shorter food chains, less food thrown away (a target of halving food waste at the consumption stage by 2030) and organic waste turned into compost and energy.
Consumer goods: repair, sharing and second-hand markets, and buying fewer new products, starting with the city government’s own purchasing.
The built environment: buildings designed so that their materials can be recovered, and reuse of materials from demolition.
Sources: Wikipedia, “Doughnut (economic model)” (2026); City of Amsterdam, Amsterdam Circular Strategy 2020–2025 (2020).
Evaluating circular and doughnut cities
Strengths | Limitations |
|---|---|
Considers the whole urban system, including the impacts of imported goods outside the city | Most materials and emissions are embedded in goods made elsewhere, which the city controls only indirectly |
Joins social goals (housing, income) and environmental goals in one framework | Critics argue the doughnut gives little concrete guidance for policy and has limited empirical testing |
Clear long-term targets (halve new raw materials by 2030) that can be monitored | Measuring material flows through a city is difficult, so progress is hard to verify |
Cities control land, procurement and waste services, so they can act faster than national governments | Recycling still uses energy, and materials degrade; a circular city still needs some new inputs |
An economic angle: circular strategies change what is profitable, for example through taxes on landfill or on raw materials, which correct a market that does not price the cost of waste. Each city’s strategy also reflects its values. Amsterdam’s approach combines anthropocentric goals (wellbeing for residents) with planetary limits, while a technocentric city might focus instead on recycling technology and smart waste systems.
Green architecture (HL only)
Buildings use large amounts of energy for heating, cooling and lighting, and making materials such as cement, steel and glass releases large amounts of carbon dioxide. Green architecture aims to minimise this harm over a building’s whole life: in the materials used, in construction, in operation and at demolition. It also protects the health of the people who use the building, through clean indoor air, daylight and comfortable temperatures.
Learning from vernacular architecture
Before electricity and air conditioning, builders in every climate developed ways of keeping buildings comfortable using local materials and natural processes. This vernacular architecture is a form of traditional knowledge, refined over centuries. Thick earth or stone walls absorb heat during hot days and release it at night; courtyards and narrow shaded streets create cool air; steep roofs shed snow; buildings on stilts stay above floods and catch breezes. Green architecture now combines these ideas with modern science and materials.
Wind towers
One of the most effective vernacular designs is the wind tower, known as a badgir in Iran and a barjeel in the Gulf, including the historic houses of Dubai. A tall tower rises above the roof with openings facing the wind.
Air entering the upwind opening is forced down the shaft into the rooms below, while warm indoor air rises and leaves through the openings on the sheltered side (the stack effect), so the tower ventilates the house even when the wind is light. Where the incoming air passes over a pool or an underground water channel (qanat), evaporation cools it further. The city of Yazd, on the dry Iranian plateau, has many wind towers, including some built over water reservoirs.
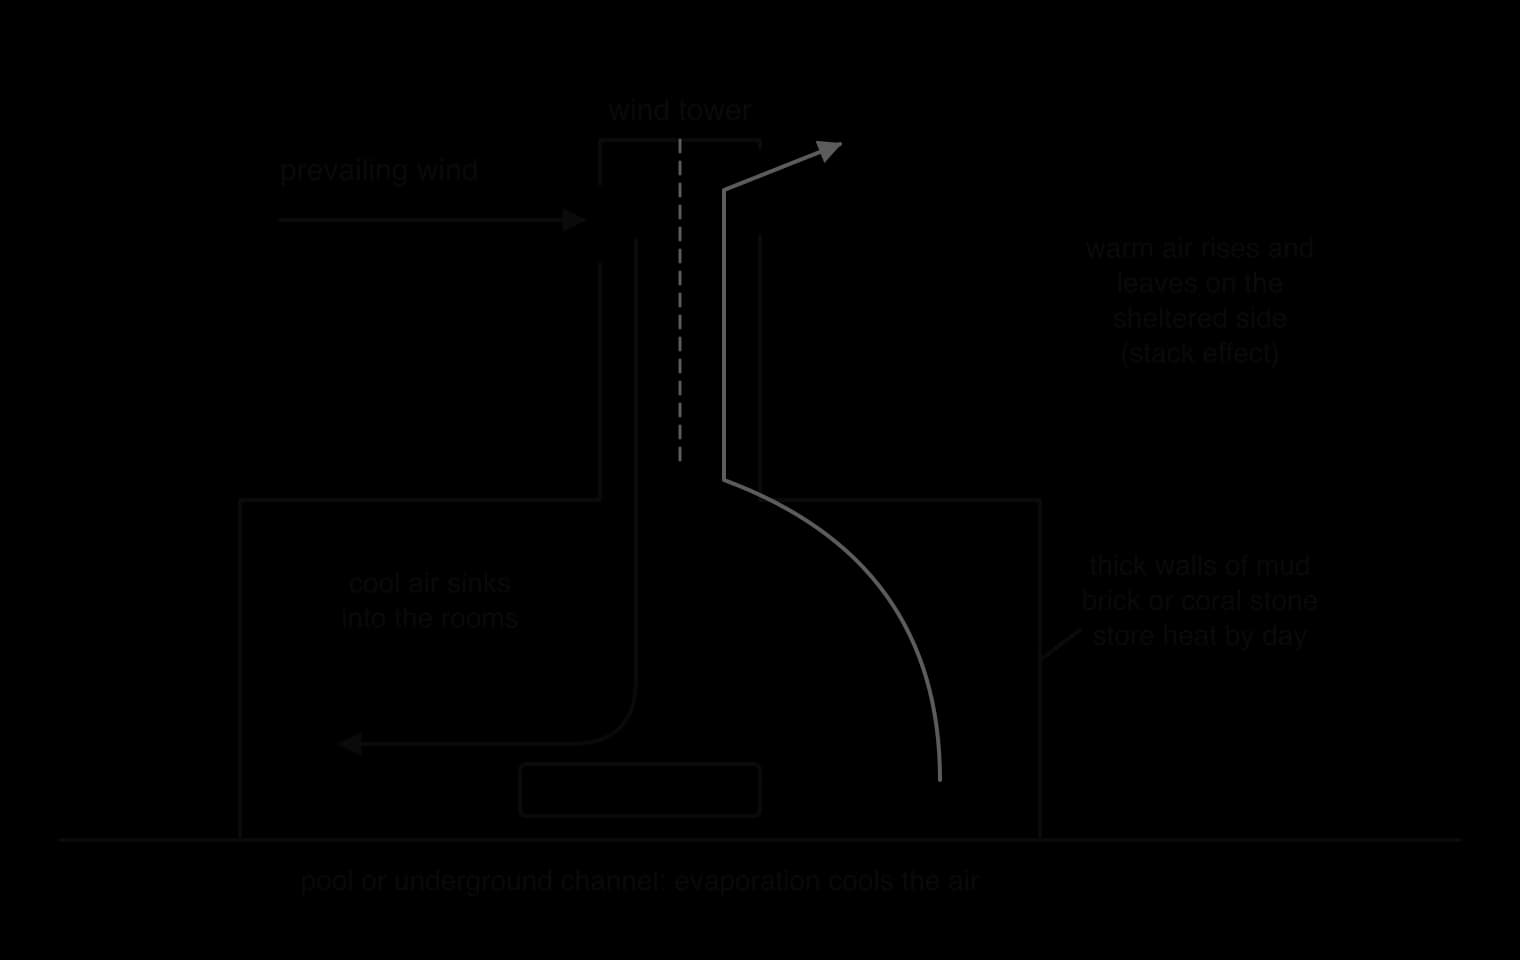
Studies cited in the literature report that wind towers can keep indoor air several degrees cooler than the outside, in some cases by 8–12 °C. Air conditioning is one of the fastest-growing uses of electricity in hot countries, so modern buildings that use wind towers and other passive cooling, alone or with fans, can greatly reduce energy use and emissions.
Bio-based materials and circular construction
Bio-based materials come from plants and animals and can store carbon. Straw-bale construction stacks compressed bales of straw, a by-product of grain farming, to form thick, highly insulating walls, which are then plastered to protect them from fire and moisture. The method began in the Nebraska Sandhills in the United States in the 1890s, where trees were scarce, and has been revived since the 1990s. A straw wall has roughly half the embodied energy of a conventional wall and more than 40% lower CO₂ emissions. Its main risk is rot if the straw gets wet, so it needs good design and building practice.
Circular construction applies the circular economy to buildings. Buildings are designed so they can be taken apart, with parts that can be reused, and materials from demolished buildings are recovered and used again. Other approaches build walls from waste materials, such as plastic bottles filled with sand or earth, or print house walls from concrete or earth with large 3D printers, which can reduce material waste and construction time, although the carbon footprint depends greatly on the material used.
Example | How it reduces harm | Limitations |
|---|---|---|
Wind towers (badgir, barjeel) | Passive cooling with no electricity; local materials | Works best in hot, dry climates with reliable wind; limited cooling on still, humid days |
Straw-bale houses | Uses farm by-products; excellent insulation; lower embodied energy and CO₂ | Risk of rot from moisture; thick walls take space; insurance can be hard to get |
Bottle and plastic construction | Turns waste into building material; cheap | Small scale; long-term durability and fire safety uncertain |
3D-printed houses | Less waste, fast construction, can use local earth | Often uses cement with high CO₂; new technology with limited evidence |
Sources: Wikipedia, “Windcatcher” and “Straw-bale construction” (2026).
Exam practice
Urban systems appear in Paper 1 resources about a named city, in Paper 2 Section A short-answer and data questions (systems diagrams, urbanisation data, push–pull factors, impacts of urban expansion) and in Section B essays on sustainable cities and urban planning. Questions often combine this content with water (run-off and flooding), air pollution, energy and waste.
Paper 2 Section A-style questions
Short questions on the urban system often ask for its components, so the systems diagram is worth knowing by heart.
Paper 1-style data question
The table gives information about two districts of a city (hypothetical data).
Indicator | District X (inner city) | District Y (outer suburb) |
|---|---|---|
Population | 90,000 | 90,000 |
Area (km²) | 6 | 30 |
Share of trips made by car (%) | 22 | 74 |
Green space per person (m²) | 8 | 45 |
Average summer night temperature (°C) | 24.5 | 21.0 |
Paper 2 Section B-style essay
HL question
Summary
An urban area is a densely built-up area with high population density; rural areas have low density and dispersed settlements. Definitions differ between countries.
Urban areas contain urban ecosystems with biotic and abiotic components that are heavily shaped by people, including the warmer urban heat island.
A city is an open system with inputs (food, water, energy, materials, people), storages and outputs (waste, sewage, pollutants, heat, products); most of its flows pass through once.
Urbanisation is the rising share of people in urban areas, driven mainly by internal rural–urban migration (push–pull factors) and natural increase; 57.6% of the world was urban in 2024.
Suburbanisation moves people to the city’s edge and causes urban sprawl; deurbanisation moves them out of urban areas altogether.
Urban expansion removes farmland and habitat, increases run-off and flooding, lowers water quality, and concentrates air pollution and heat.
Urban planning decides land use for all stakeholders; sustainable planning stresses public transport, green space, affordable housing, efficiency and waste reuse.
Ecological urban planning treats the city as an ecosystem through urban ecology, urban farming, biophilic design, resilience planning and regenerative architecture.
Curitiba linked land use, bus rapid transit and flood parks, but its growth beyond the plan and its informal settlements show the limits of planning.
Compactness, mixed land use and social mix reduce land and energy use and spread benefits fairly; access to green space is an environmental justice issue. (HL)
Cities such as Amsterdam use the circular economy and doughnut models to cut raw material use and balance social needs with planetary limits. (HL)
Green architecture combines vernacular design (wind towers), bio-based materials (straw bales) and circular construction to reduce buildings’ harm. (HL)
Self-check
- To do:
I can distinguish urban and rural areas and list the biotic and abiotic components of an urban ecosystem.
- To do:
I can explain the causes of the urban heat island.
- To do:
I can construct a labelled systems diagram of a city, identifying transfers and transformations.
- To do:
I can explain urbanisation using push–pull factors and describe trends from data.
- To do:
I can distinguish urbanisation, suburbanisation and deurbanisation, and explain urban sprawl.
- To do:
I can explain how urban expansion changes land, water, air and climate.
- To do:
I can outline the features of sustainable urban planning and evaluate a named plan.
- To do:
I can describe the five approaches of ecological urban planning with examples.
- To do:
I can evaluate Curitiba’s planning from different perspectives.
- To do:
I can explain how compactness, mixed land use and social mix support sustainability and environmental justice. (HL)
- To do:
I can discuss Amsterdam’s use of the doughnut and circular economy models. (HL)
- To do:
I can describe one example of green or vernacular architecture and evaluate it. (HL)