Notes on 8.1 Human populations
Learning objectives
Outline how births, deaths, immigration and emigration act as the inputs and outputs of a human population.
Calculate crude birth and death rates, migration rates, natural increase and doubling time from data.
Distinguish between crude birth rate, total fertility rate and replacement fertility, and explain why life expectancy is a model-based measure.
Describe the growth of the global population and explain why the UN gives three projection scenarios.
Construct and interpret age–sex pyramids in absolute numbers and percentages.
Explain the five stages of the demographic transition model and evaluate its use as a model.
Evaluate direct (pro-natalist, anti-natalist and migration) and indirect population policies, using named examples.
Discuss how rapid population growth increases stress on Earth’s systems, using projections, biocapacity and the doughnut model. (HL)
Calculate dependency ratios and explain population momentum. (HL)
Analyse the population patterns of two countries at different stages of the demographic transition over time. (HL)
Explain how climate change, drought and land degradation cause environmental migration, with named examples. (HL)
Introduction
The human population reached about 8.2 billion in 2024, more than three times its size in 1950. How fast it grows, where that growth happens and how old the people in each country are all shape the demand for food, water, energy and land, and therefore the pressure that human societies place on ecosystems.
Demography, the study of human populations, treats a population as an open system with inputs and outputs, so the same systems approach used in ecology applies to it. Population change is also a question of perspectives: governments, families and religious and cultural groups hold very different views on whether a population should grow, and those views shape policies. Whether a growing or shrinking population is compatible with sustainability depends on how much each person consumes as well as on how many people there are.
A human population as a system
A population is a group of individuals of the same species living in the same area at the same time. For humans, the area can be a village, a city, a country, a continent or the whole planet. Whatever the scale, the size of the population changes in only four ways: people are born, people die, people move in and people move out.
These four processes are the flows of the system. Births and immigration are inputs, because they add people to the storage. Deaths and emigration are outputs, because they remove people from it. The population itself is the storage, and its size at any moment is the result of all the past inputs and outputs.
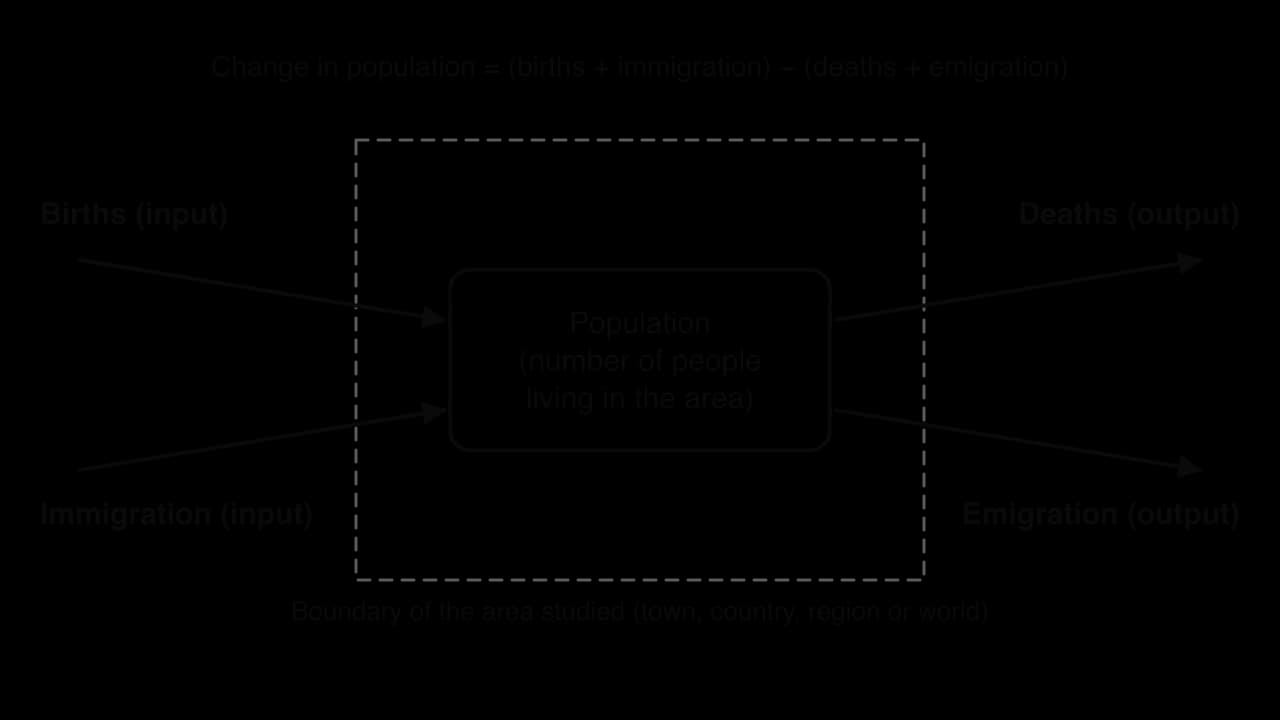
The boundary matters. For the world as a whole there is no immigration or emigration, so global change depends only on births and deaths. For a single country, and even more for a city, migration can be as important as births and deaths. Canada and the United Kingdom, for example, grow mainly because more people arrive than leave.
This is the human version of the balance between inputs and outputs that controls any storage. If inputs exceed outputs, the population grows; if outputs exceed inputs, it shrinks; if they are equal, it is in steady-state equilibrium, even though people are still being born, dying and moving.
Measuring births, deaths and migration
Raw numbers of births or deaths are hard to compare. India recorded far more births than Niger in 2023, yet Niger’s population grew much faster, because India’s population is more than fifty times larger. Demographers therefore express each flow as a rate: the number of events per 1,000 people per year. Because they use the whole population as the denominator, without allowing for its age or sex structure, these are called crude rates.
Crude birth rate and crude death rate
The two most widely used measures are the crude birth rate and the crude death rate.
The total population used is normally the mid-year population, because the population changes during the year. Rates can be calculated at any scale: the same formula works for a town of 20,000 people, a country of 1.4 billion or the whole world.
The crude death rate has a weakness. A country with many old people can have a higher CDR than a poorer country with a young population, even though people in the first country live much longer. Japan’s CDR in 2023 was 12.3 per 1,000, while Niger’s was 8.9, but life expectancy at birth was 84.7 years in Japan and 61.2 in Niger. The crude rate reflects the age structure of the population as much as its health.
Sources: UN World Population Prospects 2024.
Immigration and emigration rates
Emigration is measured in the same way, but from the point of view of the place people leave.
The immigration rate and emigration rate use the same structure as crude rates, so all four flows can be compared directly. The difference between them is net migration: positive when more people arrive than leave, negative when more leave than arrive.
Migration is harder to measure than births and deaths. Births and deaths are registered in most countries, but many people move without being counted, some move for a few months and then return, and borders between some countries are open. Migration figures are therefore often estimates with wide margins of error, particularly for low-income countries and for undocumented migration.
Natural increase and population growth
The difference between the birth rate and the death rate shows how fast a population grows from its own births and deaths, leaving migration aside. This difference, natural increase, is the main measure of growth used to compare countries and to follow a country through time.
Dividing by 10 converts a rate per 1,000 into a percentage (per 100). A country with a CBR of 30 and a CDR of 10 has a natural increase of 20 per 1,000, or 2.0% per year.
The population growth rate adds migration to natural increase. For the world as a whole the two are the same; for a country they can differ sharply. In 2023 Canada had a natural increase of only about 1 per 1,000 but net migration of about 11 per 1,000, so most of its growth of 1.2% came from immigrants. Japan had a natural decrease of about 6 per 1,000, partly offset by net immigration of 1.4 per 1,000, so its population fell by about 0.5%.
Sources: UN World Population Prospects 2024.
Fertility and life expectancy
The crude birth rate depends on how many women of childbearing age a population contains as well as on how many children each woman has. To measure the second of these directly, demographers use the total fertility rate.
The TFR is calculated from the birth rate of women in each age group in a single year, so it describes a hypothetical woman rather than any real one. Its great advantage is that it does not depend on the age structure of the population: a TFR of 2.0 means the same thing in an old country and a young one. In 2023 the TFR was 6.1 in Niger, 4.5 in Nigeria, 2.0 in India, 1.2 in Japan, 1.0 in China and 0.72 in South Korea, the lowest of any country.
Sources: UN World Population Prospects 2024.
Replacement fertility
A woman needs to have, on average, one daughter who survives to have children herself for each generation to replace the last. Because slightly more boys than girls are born and some girls die before they reach childbearing age, this requires a little more than two children per woman.
Replacement fertility is a long-run threshold. A country whose TFR falls below about 2.1 does not shrink at once: if it has many young adults, its population can keep growing for decades, an effect called population momentum. In 2023 the world TFR was 2.25, just above replacement, and about two-thirds of the world’s people lived in countries with fertility below replacement.
Sources: UN World Population Prospects 2024 (share of population calculated from its country estimates).
Life expectancy
Life expectancy at birth rose from about 46 years in 1950 to 73.2 years in 2023 for the world as a whole. In 2023 it was about 54 years in Nigeria, the lowest of any country, and nearly 85 in Japan. The main reason for the global rise is the fall in deaths of infants and young children, measured by the infant mortality rate: when many babies die in their first year, the average age at death is pulled down sharply, even though many adults live into their seventies.
Sources: UN World Population Prospects 2024.
Like the TFR, life expectancy is a model, not a forecast. It assumes that today’s death rates at each age will apply for a person’s whole life. In practice health care, diet and living conditions usually improve, so most babies born today will live longer than their life expectancy at birth suggests. A war, famine or pandemic can make the opposite true: global life expectancy fell by almost two years between 2019 and 2021 during the COVID-19 pandemic and then recovered.
Sources: UN World Population Prospects 2024; Our World in Data (2024).
Country (2023) | CBR (per 1,000) | CDR (per 1,000) | Natural increase (%) | TFR | Life expectancy (years) |
|---|---|---|---|---|---|
Niger | 41.9 | 8.9 | 3.3 | 6.06 | 61.2 |
Nigeria | 33.0 | 11.7 | 2.1 | 4.48 | 54.5 |
Bangladesh | 20.4 | 5.0 | 1.5 | 2.16 | 74.7 |
India | 16.1 | 6.6 | 1.0 | 1.98 | 72.0 |
World | 16.3 | 7.6 | 0.9 | 2.25 | 73.2 |
Canada | 9.1 | 7.9 | 0.1 | 1.35 | 82.6 |
China | 6.3 | 8.2 | −0.2 | 1.00 | 78.0 |
Japan | 6.0 | 12.3 | −0.6 | 1.21 | 84.7 |
Sources: UN World Population Prospects 2024 (2023 estimates).
The table shows the range of demographic situations in the world today. Niger and Nigeria combine high birth rates with falling death rates, so they grow fast. China and Japan have birth rates below their death rates and are shrinking. Bangladesh has a TFR close to replacement but still has a natural increase of 1.5% a year, because its population is young and its death rate is very low.
Doubling time and the rule of 70
A population growing at a constant percentage rate grows exponentially, like money earning compound interest: each year’s growth is added to the base on which the next year’s growth is calculated. One way to make a growth rate meaningful is to ask how long the population would take to double if the rate stayed the same.
Doubling time is estimated with the rule of 70, a shortcut that comes from the mathematics of exponential growth (the natural logarithm of 2 is about 0.69, which is rounded to 0.70 and multiplied by 100 because the growth rate is in per cent).
The rule of 70 shows why small differences in growth rates matter. At 1% a year a population doubles in 70 years; at 2% in 35 years; at 3.5% in only 20 years. In 2023 the world’s population was growing by about 0.9% a year, which gives a doubling time of about 80 years, but the growth rate itself is falling, so the world population is unlikely ever to double again.
Why the rule of 70 works
A population growing at a constant rate per year (as a decimal) follows . It has doubled when
The growth of the global population
For most of human history the population grew extremely slowly, because high birth rates were almost cancelled out by high death rates from famine, disease and war. The world population is estimated to have passed 1 billion only around 1800. Since then, and above all since 1950, it has followed a curve of rapid growth that ecologists recognise as close to a J-curve.
Milestone | Year reached (approximately) | Years taken to add the last billion |
|---|---|---|
1 billion | about 1800 | all of earlier human history |
2.5 billion | 1950 | — |
4 billion | 1974 | — |
5 billion | 1987 | 13 |
6 billion | 1999 | 12 |
7 billion | 2011 | 12 |
8 billion | 2022 | 11 |
Sources: UN Population Division (milestones as marked by the UN at the time); Our World in Data (2024).
Later revisions of the estimates move some of these dates by about a year: the UN marked the 7 billion milestone in October 2011, but its 2024 estimates place it in 2010.
The speed of growth peaked in the 1960s. The global growth rate reached its highest value, about 2.3% a year, in 1963, which corresponds to a doubling time of only about 30 years. The number of people added each year kept rising for longer, because a smaller percentage of a larger population can still be a large number: it peaked at about 94 million in 1990. By 2024 the growth rate had fallen to about 0.9% a year, adding about 70 million people.
Sources: UN World Population Prospects 2024.
The cause of the rapid growth was a fall in death rates that came before a fall in birth rates. Better food supply, clean water, sanitation, vaccination and antibiotics cut deaths, especially among children, while families went on having many children for a generation or more. In ecological terms, humans removed many of the limiting factors that hold other populations near their carrying capacity. Whether there is a human carrying capacity, and what it might be, is much harder to judge, because technology, trade and consumption change the amount of resources each person uses.
Projecting the future population
Governments and international organisations need to know how many people there will be in order to plan schools, hospitals, pensions, housing, food supply and infrastructure. The most widely used population projections are the United Nations’ World Population Prospects, revised regularly (in 2019, 2022 and 2024). The 2024 revision covers every country from 1950 to 2100.
How a projection is made
A projection starts from the present population, split by age and sex. Each year, every age group moves up by a year; some people die, according to assumed death rates at each age; women of childbearing age have babies, according to assumed fertility at each age; and migrants are added or removed. Repeating this year after year to 2100 gives the projected population and its pyramid for every future year. This method, called the cohort-component method, is reliable for the near future because most of the people who will be alive in 2040 have already been born.
The uncertainty grows with time, and the main source of it is future fertility. Small differences in how many children women have now become large differences in the number of mothers a generation later, and in the number of their children after that. For this reason the UN publishes several variants that differ only in their assumptions about fertility.
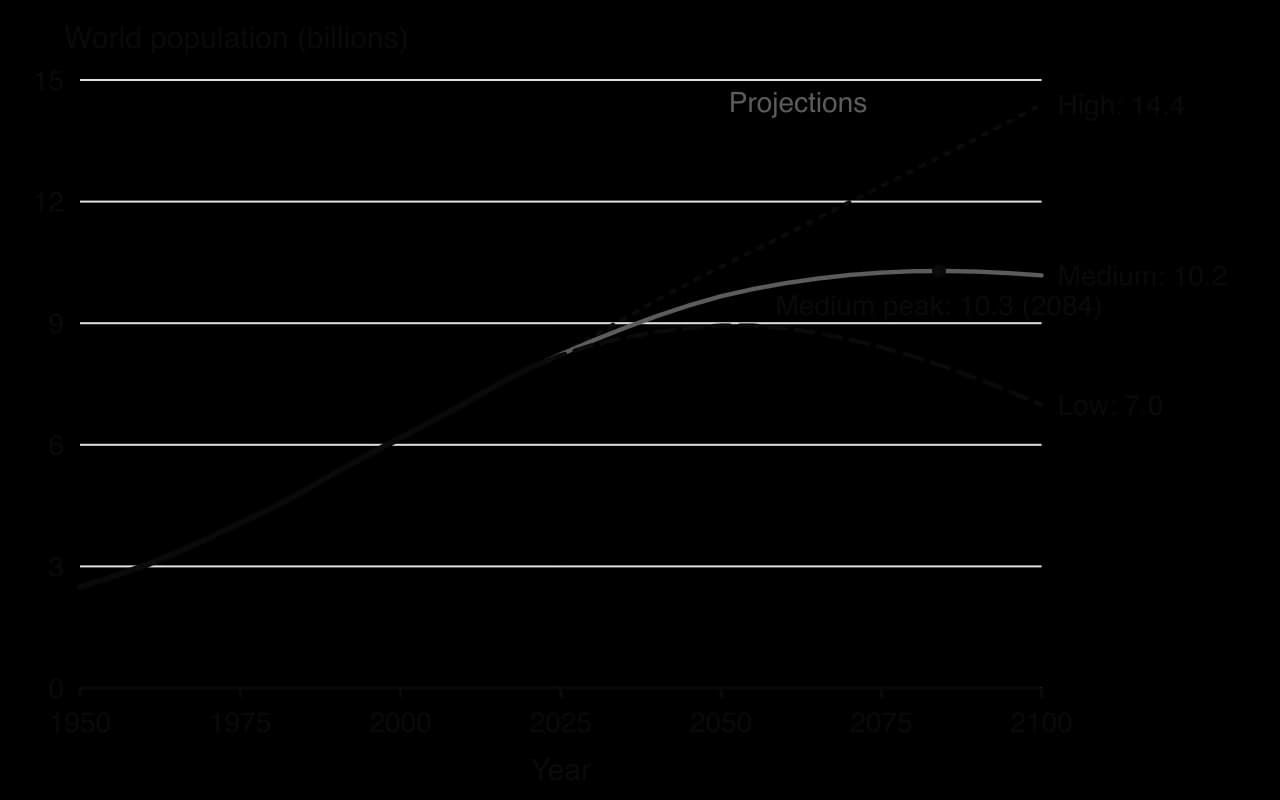
UN variant (2024) | Fertility assumption | World population in 2050 | World population in 2100 |
|---|---|---|---|
High | Half a child per woman above the medium variant (fully from 2034) | 10.4 billion | 14.4 billion, still rising |
Medium | Fertility in high-fertility countries keeps falling; very low fertility recovers slightly (world TFR 2.10 in 2050, 1.84 in 2100) | 9.7 billion | 10.2 billion, after a peak of 10.3 billion in 2084 |
Low | Half a child per woman below the medium variant (fully from 2034) | 8.9 billion (peak about 2052) | 7.0 billion, falling |
Sources: UN World Population Prospects 2024.
The medium variant is the one usually quoted. It projects that the world population will rise from 8.2 billion in 2024 to about 9.7 billion in 2050 and peak at about 10.3 billion in the mid-2080s, before declining slightly to 10.2 billion by 2100. The UN also gives a probability range: in its statistical model there is a 95% chance that the population in 2100 will be between about 9.0 and 11.4 billion.
Sources: UN World Population Prospects 2024.
Why projections change
Projections are revised as new data arrive, and recent revisions have moved downwards. The 2019 revision projected 10.9 billion in 2100 and continued growth; the 2022 revision was the first to project a peak this century; the 2024 revision brought the peak forward to 2084 and lowered it. The main reason is that fertility has fallen faster than expected in many countries, including China and parts of Africa.
Sources: Our World in Data, “Peak global population and other key findings from the 2024 UN World Population Prospects” (2024).
Other research groups reach different results because they model fertility differently. The Wittgenstein Centre and the Institute for Health Metrics and Evaluation link fertility to how many years girls spend in school and to access to contraception. Their central scenarios give lower peaks, around 9.4–9.7 billion in the 2060s or 2070s, and falling populations by 2100. The disagreement is less about the next 25 years than about how fast fertility will fall in sub-Saharan Africa, where most future growth is projected to happen.
Sources: Wikipedia, “Human population projections” (read 2026), citing Vollset et al., _The Lancet (2020), and the Wittgenstein Centre._
Strengths of UN projections | Limitations |
|---|---|
Based on census, survey and registration data for every country, with a transparent method | Data are poor in some countries, especially on births, deaths and migration |
Near-term projections (to about 2040) are reliable, because most of those people are already alive | Fertility far in the future cannot be known; small changes compound over generations |
Several variants and probability ranges make the uncertainty visible | Wars, pandemics, famines and policy changes cannot be predicted |
Updated regularly as new data arrive | Migration is hard to project and can dominate change in individual countries |
 YouTube
Age–sex pyramids
Two countries with the same population can be very different places to live if one is mostly children and the other mostly retired people. The structure of a population by age and sex is shown with an age–sex pyramid, one of the most useful models in demography.
How a pyramid is drawn
Age groups, normally of five years (0–4, 5–9, 10–14 … up to 85+ or 100+), are stacked vertically with the youngest at the bottom.
Males are shown to the left of a central axis and females to the right, by convention.
The length of each bar shows either the absolute number of people in that group (for example millions) or the percentage of the total population.
Both sides use the same scale, which is marked on the horizontal axis and increases outwards from the centre.
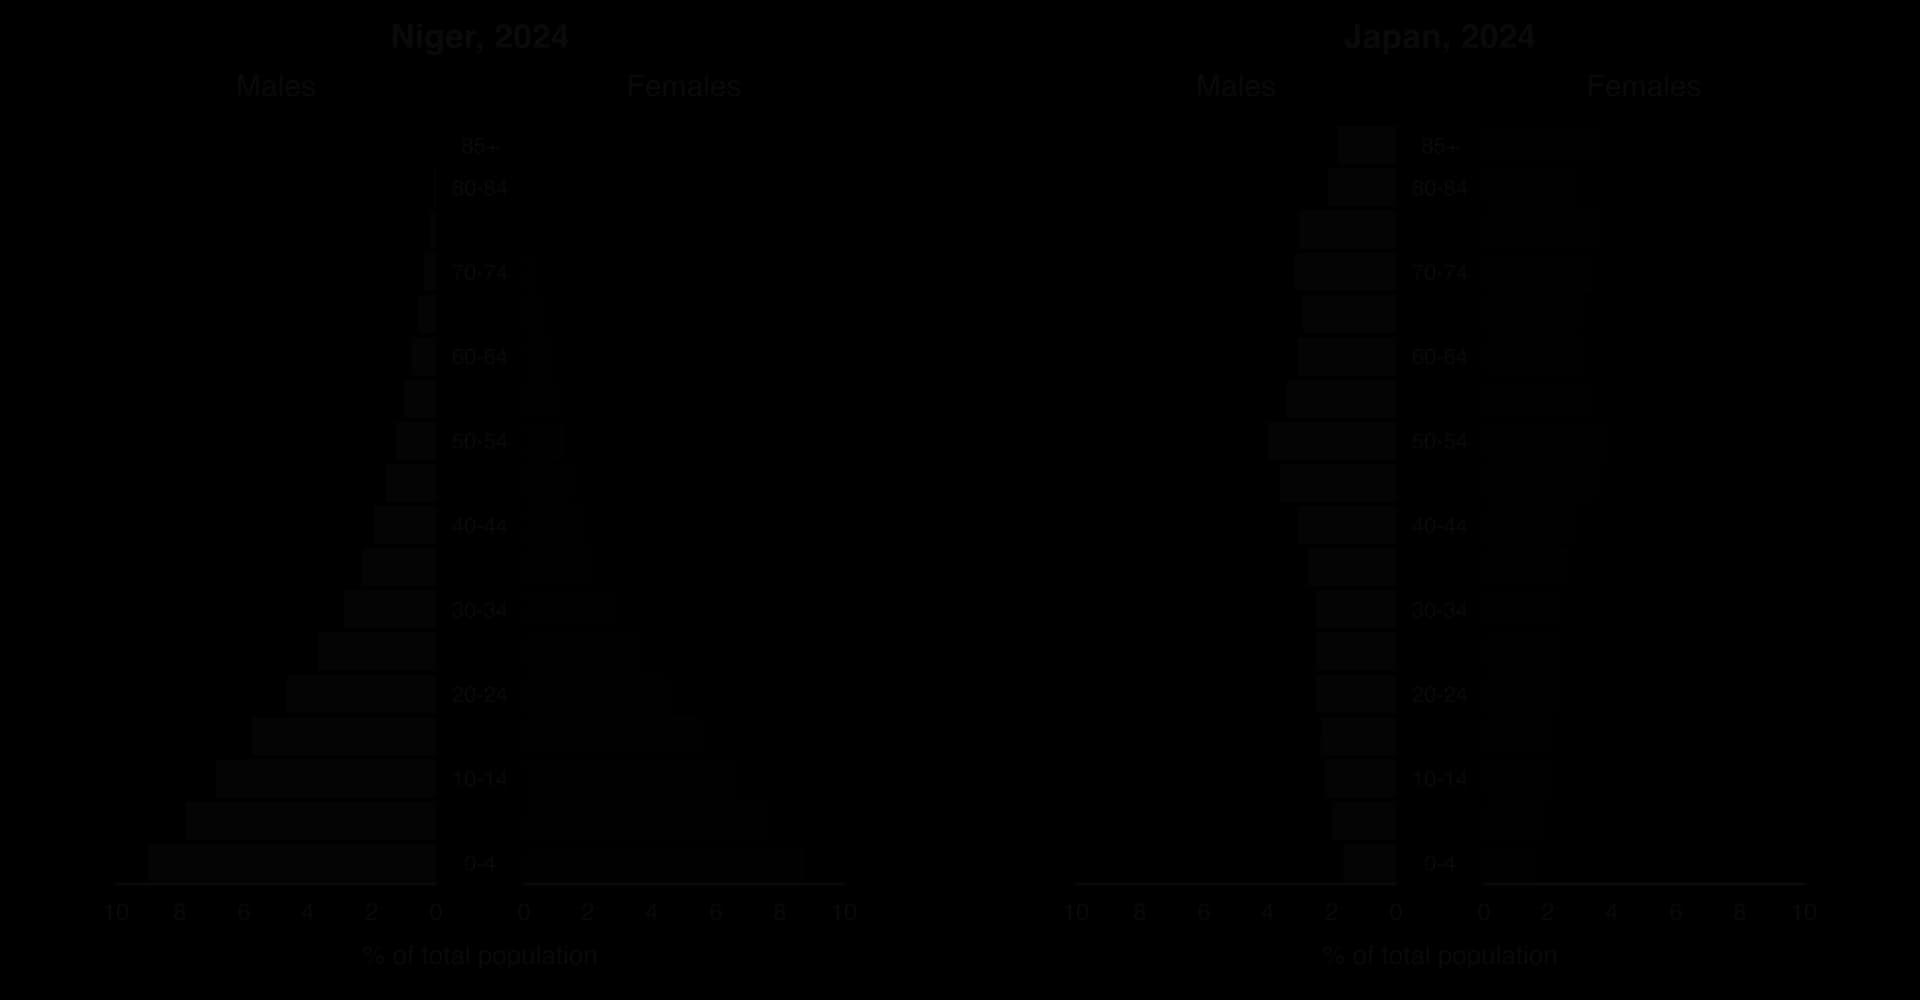
The choice between numbers and percentages depends on the purpose. Absolute numbers show the actual size of each group, which matters for planning: how many school places, how many pensions. Percentages make the shapes of countries with very different populations comparable, which is how Niger (about 27 million people) and Japan (about 124 million) can be set side by side.
Reading a pyramid
Each feature of a pyramid has a demographic cause. A wide base means many births and a high fertility rate. Bars that shrink quickly upwards mean that many people die before old age, so death rates are high, especially among the young. A narrow base under a wider middle means births have fallen, and a wide top means many people survive to old age.
Feature | What it shows | Example |
|---|---|---|
Wide base, steep sides | High birth rate, high fertility; young population; many deaths at every age | Niger: 47% of people under 15 in 2024 |
Base narrower than the bars above it | Birth rate has fallen recently | Japan, China, South Korea |
Wide top | Low death rates and long life expectancy; an ageing population | Japan: 30% aged 65 or over in 2024 |
Wider female bars at old ages | Women live longer than men on average | Almost every country |
A bulge in one age group | A past baby boom, or immigration of young adults | Gulf states (male migrant workers aged 20–40) |
A notch (indent) in one age group | A past fall in births, or deaths in a war or famine | China’s smaller cohort born around 1959–1961 |
More males than females among children | A high sex ratio at birth, from sex-selective practices | China and India in the 2000s |
Sources: UN World Population Prospects 2024.
Pyramids also look forward. The children in the base of Niger’s pyramid will be the parents of the next generation, so a wide base today guarantees many births in twenty years’ time. The large groups in their fifties in Japan’s pyramid will be retired within fifteen years, so the share of older people will rise further even if nothing else changes. This is why pyramids are used to plan schools, jobs, health care and pensions.
 YouTube
The demographic transition model
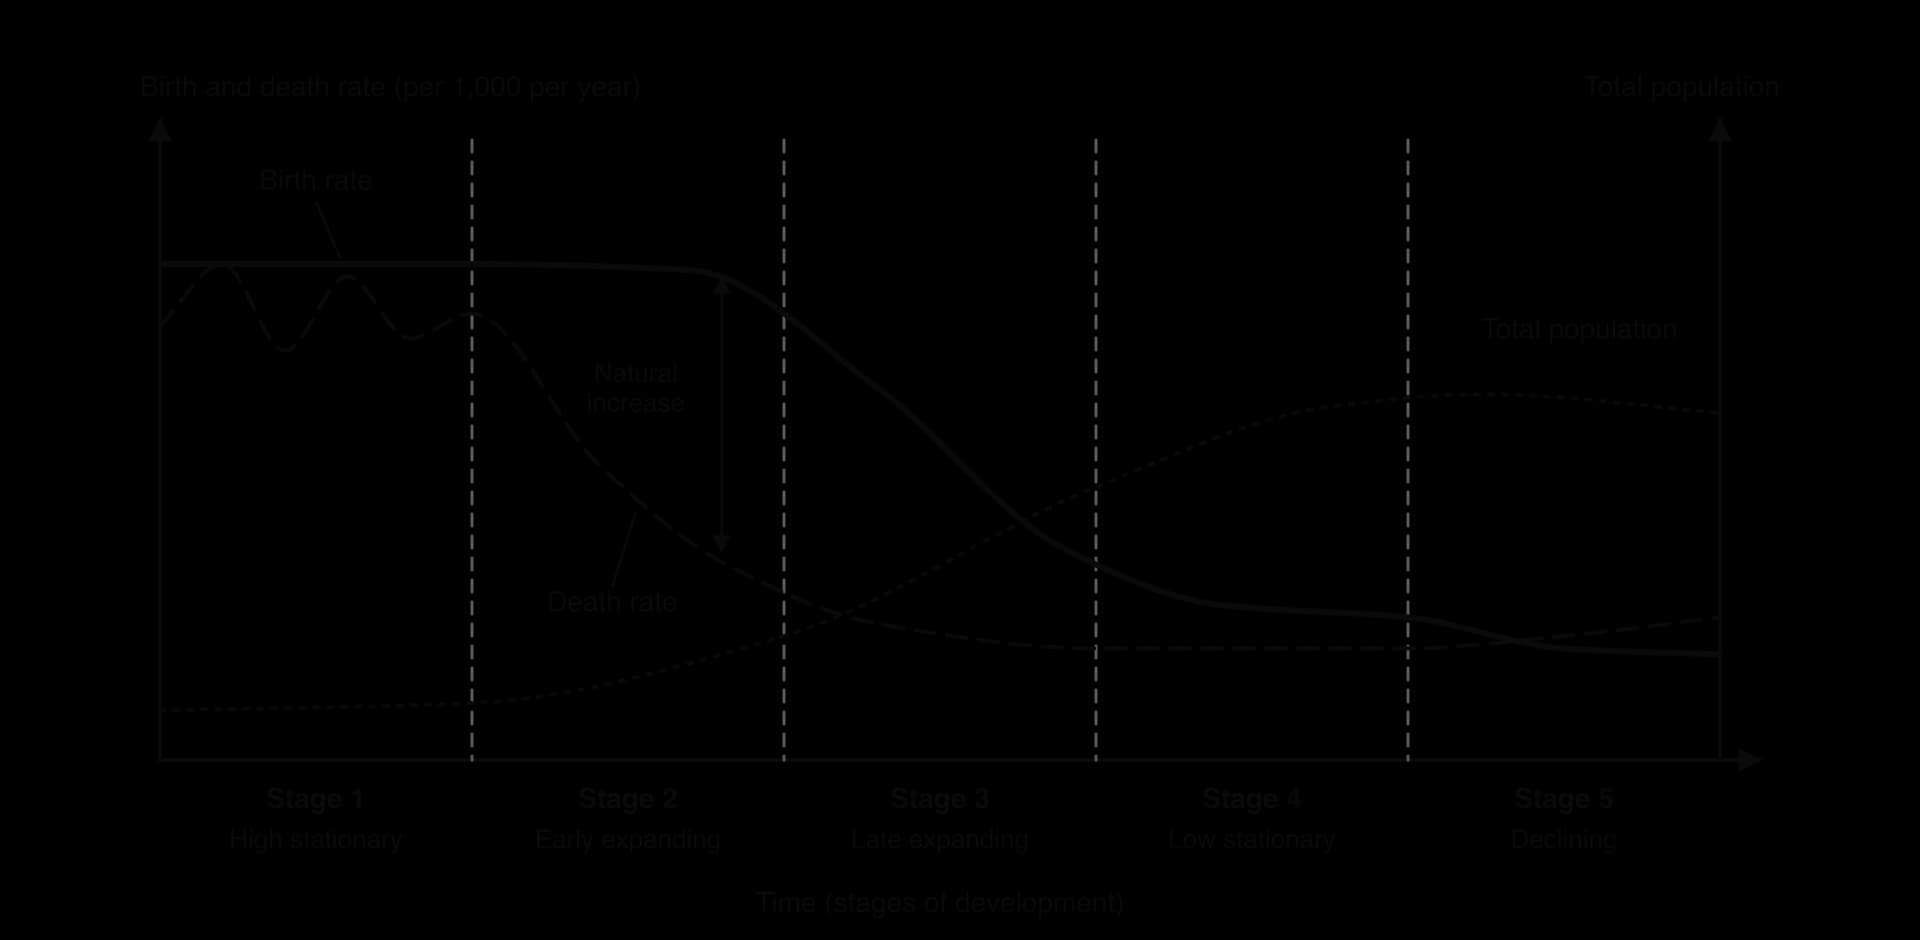
Every country that is now rich once had high birth rates and high death rates, and every one of them now has low birth and death rates. The change between these two states is called the demographic transition. The demographic transition model (DTM) describes it as a sequence of stages linked to economic and social development.
The model grew out of the work of the American demographer Warren Thompson around 1930 and was developed by Frank Notestein in the 1940s, using the history of England, other western European countries and North America. Like every model, it simplifies reality: it describes a typical pathway and is not a prediction of what any particular country will do.
Stage 1: high stationary
Birth rates and death rates are both high, typically 35–50 per 1,000, so natural increase is small and the population grows slowly or not at all. Death rates fluctuate from year to year with harvests, epidemics and wars. Children are needed to work on the land and to support parents in old age, and many die young, so families have many children. No country is in stage 1 today, although a few isolated communities may be close to it.
Stage 2: early expanding
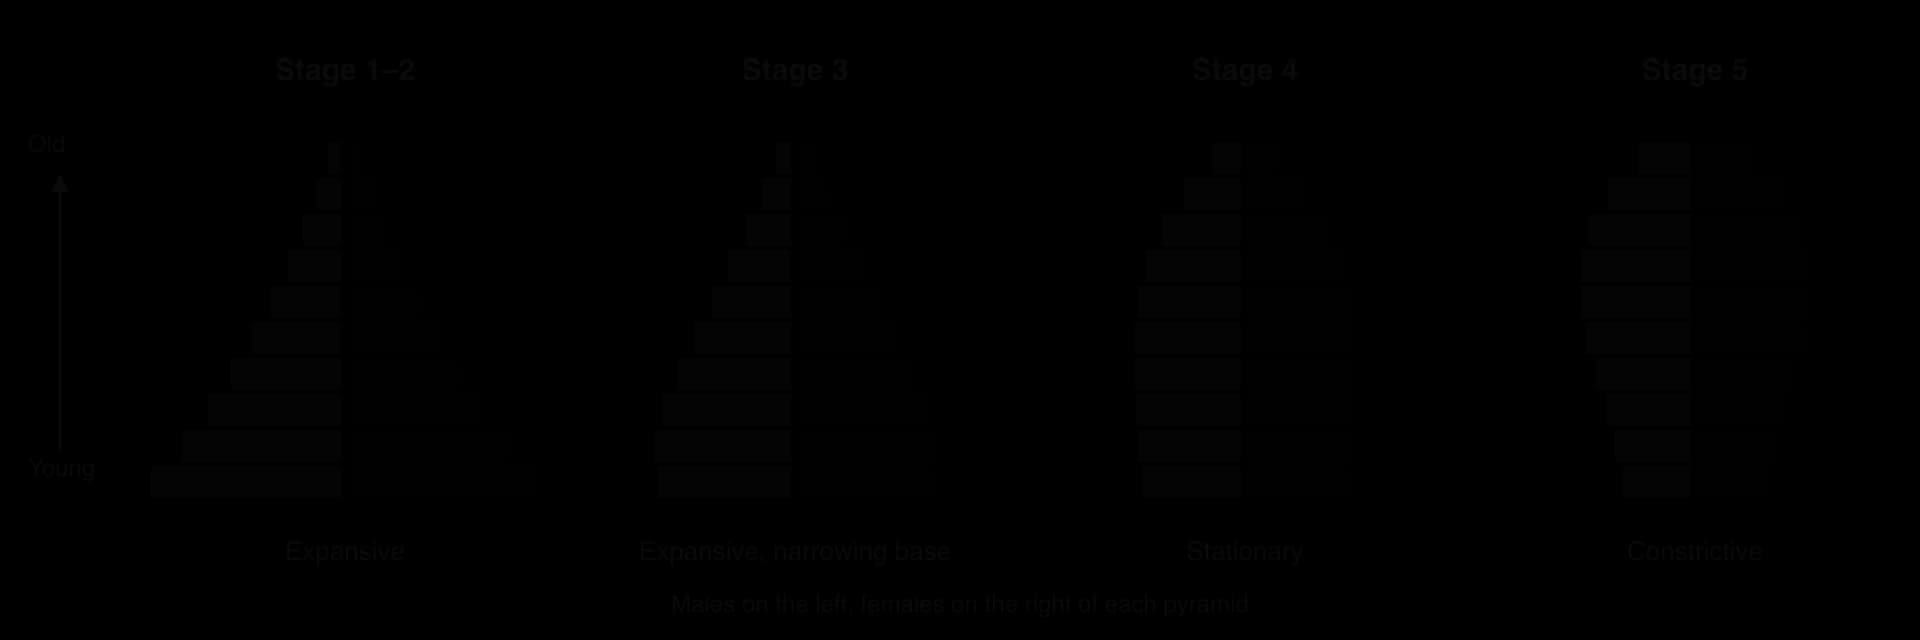
The death rate falls steeply while the birth rate stays high. The causes are improvements in food supply and storage, clean water and sanitation, vaccination, basic medical care and, later, antibiotics. These changes reduce deaths among infants and children most of all. Because the birth rate has not yet fallen, natural increase rises sharply and the population grows rapidly. The pyramid is expansive, with a very wide base.
Stage 3: late expanding
The birth rate starts to fall, while the death rate continues to fall more slowly. Natural increase is still high at first but begins to shrink. Several changes lower fertility together. When most children survive, parents no longer need many births to be sure of some surviving children. As people move to cities and schooling becomes compulsory, children cost more to raise and earn less, so large families become a burden rather than an asset.
The education and paid employment of women are among the strongest influences. Women who stay in school longer tend to marry and have their first child later, know more about contraception, and have more choice over family size. Access to family planning makes it possible to act on these choices.
Stage 4: low stationary
Birth rates and death rates are both low, typically 8–15 per 1,000, so natural increase is close to zero and the population is roughly stable. Birth rates may fluctuate with economic conditions and social trends, as in the baby boom in many high-income countries after the Second World War. The pyramid has nearly straight sides, and the population is ageing.
Stage 5: declining
The original model had four stages; a fifth was added when many countries’ birth rates fell below their death rates. Fertility settles well below replacement, the population ages, and as more people reach old age the crude death rate rises slightly. Natural increase becomes negative and, without immigration, the population shrinks. Japan, Italy, China and South Korea are in this stage.
Some demographers argue that stage 5 is not the end. In a few high-income countries fertility has recovered a little from very low levels, and the UN medium variant assumes a small rise in very-low-fertility countries. Whether this will happen is one of the main uncertainties in long-term projections.
Stage | Birth rate | Death rate | Natural increase | Pyramid | Examples today |
|---|---|---|---|---|---|
1 High stationary | High | High, fluctuating | Very low | Expansive, very steep sides | None (some isolated groups) |
2 Early expanding | High | Falling rapidly | High and rising | Expansive, wide base | Niger, Chad (late stage 2 to early stage 3) |
3 Late expanding | Falling | Falling more slowly, low | High but falling | Expansive, base narrowing | Nigeria, Kenya, Bangladesh |
4 Low stationary | Low, fluctuating | Low | Close to zero | Stationary (straight sides) | United States, France, United Kingdom |
5 Declining | Very low | Low, rising slowly | Negative | Constrictive (narrow base) | Japan, Italy, China, South Korea |
Sources: Stage assignments based on UN World Population Prospects 2024 data for 2023.
The transition seen in world data
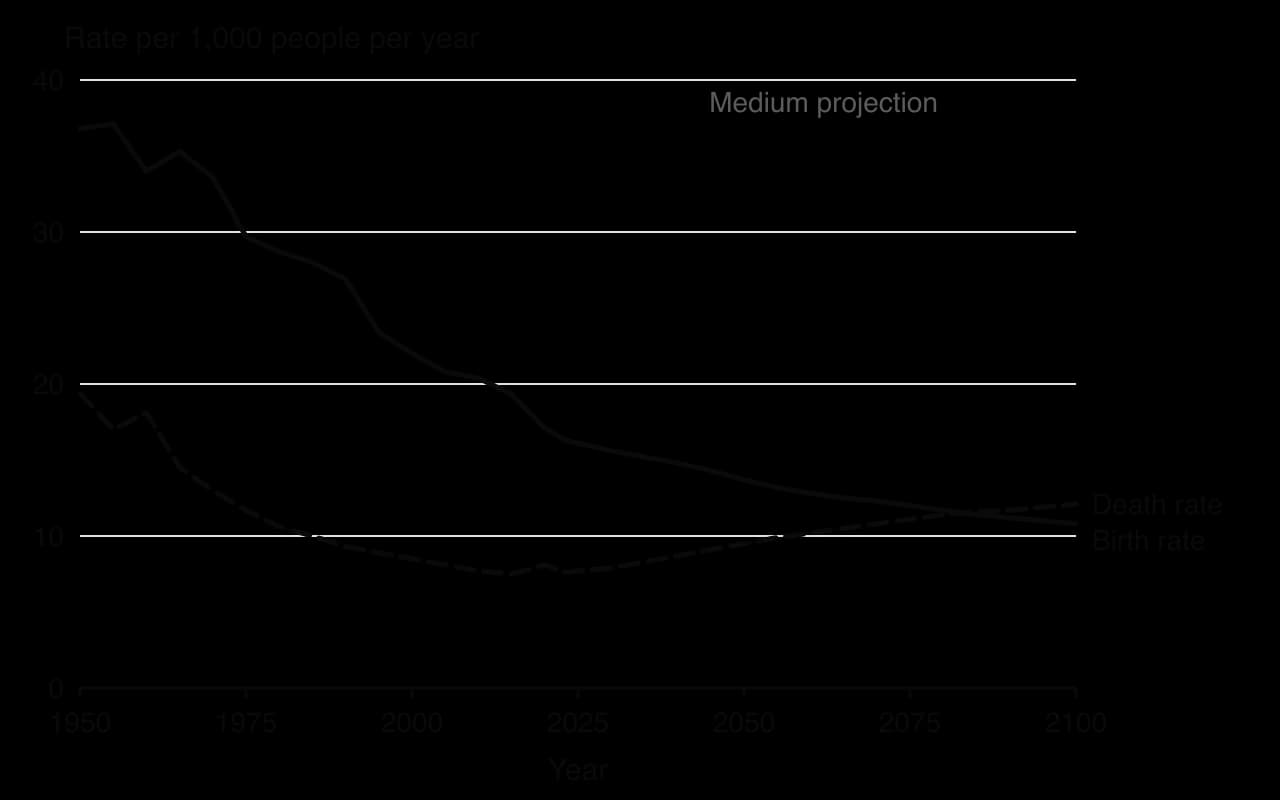
The world as a whole is passing through the later part of the transition. Its birth rate has fallen from about 37 per 1,000 in 1950 to 16 in 2023, while the death rate fell from about 19 to below 8. Because the world population is getting older, the UN projects that the death rate will now rise slowly, and that the two lines will cross around 2084, the year of peak population in the medium variant.
Sources: UN World Population Prospects 2024.
Evaluating the demographic transition model
The DTM is one of the most widely used models in population studies, and evaluating it is a standard part of applying it. Its strengths come from its simplicity and from how well it describes many countries; its limitations come from the assumptions built into it.
Strengths | Limitations |
|---|---|
Describes the broad pattern of change seen in almost every country since 1800: death rates fall first, birth rates follow | Based on the experience of western Europe and North America, where the transition took more than a century; the social and economic conditions there do not apply everywhere |
Links demographic change to causes (health, food, education, the role of women, urbanisation), so it explains as well as describes | Assumes that development and industrialisation cause the transition; fertility has fallen fast in some poor countries (Bangladesh) and stayed high in some richer ones |
Allows countries to be compared and their future challenges anticipated (school places in stage 2, pensions in stage 5) | Ignores migration, which dominates population change in many countries today |
Easy to relate to age–sex pyramids, which are measurable | Has no timescale: South Korea went from a TFR of 4.3 in 1971 to below replacement by about 1984, far faster than England |
Has proved flexible: stage 5 was added when evidence showed natural decrease | Cannot show the effect of government policy (China), war, epidemics or economic collapse, which can raise death rates or change birth rates suddenly |
Sources: UN World Population Prospects 2024 (South Korea’s fertility); Wikipedia, “Demographic transition” (read 2026).
The model also says nothing about whether the end state is desirable. From one perspective, low fertility and a stable population in stage 4 are the goal, because they ease pressure on resources. From another, the shrinking workforce and growing number of retired people in stage 5 threaten economic growth, pensions and care. These different views explain why some governments try to lower their birth rates while others spend heavily trying to raise them.
Managing population: direct policies
Governments have tried to change the size and growth of their populations for centuries. Some want fewer births, to ease pressure on food, jobs and public services; others want more, to avoid a shrinking workforce, to support pensions or for reasons of national identity and power. A population policy can act on any of the system’s flows: births, deaths, immigration or emigration.
Direct policies target the flows themselves: they encourage or discourage births, or control who may enter or leave the country. They are described by their aim: anti-natalist policies lower the birth rate and pro-natalist policies raise it.
Pro-natalist policies have the opposite aim and are usually adopted when fertility has fallen well below replacement and the population is ageing.
Which policy a government chooses, and how far it goes, depends on cultural, religious, economic, social and political factors. A government with an authoritarian political system can enforce limits that a democracy could not. Religious teaching can make contraception, abortion or sterilisation unacceptable, or, as in Iran in 1989, can be reinterpreted to support them. Economic worries, such as unemployment among young people or the cost of pensions, often drive the change from one policy to the other.
Anti-natalist policies
The best-known anti-natalist policy is China’s one-child policy (1980–2015), the extended case study. Other countries used softer measures. Singapore’s “Stop at Two” campaign of the 1970s combined advertising with penalties for third and later children, such as lower priority for public housing and school places; the government reversed it in 1987.
Sources: Wikipedia, “Population planning in Singapore” (read 2026).
Iran shows how quickly direct policy can change course. After the 1979 revolution the government closed family planning clinics and encouraged large families, and the population doubled from 27 million in 1968 to 55 million in 1988. In 1989 it reversed this policy: the Ministry of Health supplied free contraceptives, mobile teams offered free vasectomies and tubal ligations in remote parts of the country, couples had to attend birth control classes before they could marry, and religious leaders stated that Islam supported smaller families. The TFR fell from 6.2 in 1985 to 2.0 in 2000, one of the fastest falls ever recorded.
Sources: Wikipedia, “Family planning in Iran” (read 2026); UN World Population Prospects 2024.
Pro-natalist policies
Romania’s Decree 770, signed by the communist government of Nicolae Ceaușescu in October 1966, is one of the best-known examples of a coercive pro-natalist policy. Abortion was made illegal except for women over 45, women who already had four children, or on medical grounds or after rape, and contraceptives were withdrawn from sale. The aim was to raise the population from 20 million to 30 million.
Sources: Wikipedia, “Decree 770” (read 2026); UN World Population Prospects 2024.
Most pro-natalist policies today use incentives rather than coercion. Hungary introduced a package in 2019 that includes a lifetime exemption from income tax for mothers of four or more children, subsidised housing loans and more childcare places. Hungary’s TFR rose from 1.25 in 2011 to 1.61 in 2021 but fell back to 1.49 in 2023, still well below replacement. South Korea has spent heavily on child benefits and childcare, yet its TFR fell to 0.72 in 2023. High housing and education costs, long working hours and the difficulty of combining a career with children, especially for women, appear to matter more than cash payments.
Sources: Wikipedia, “Natalism” (read 2026); UN World Population Prospects 2024.
Migration policies
Governments also manage population through migration. Countries with low fertility and ageing populations often use immigration to keep their workforce from shrinking. Canada sets an annual target for new permanent residents in its Immigration Levels Plan; the 2025–2027 plan set targets of 395,000 in 2025, 380,000 in 2026 and 365,000 in 2027, reduced from earlier plans for 500,000 a year after concern about pressure on housing. Canada uses a points-based system, introduced in 1967, that favours people with skills, education and knowledge of English or French.
Sources: Wikipedia, “Immigration to Canada” (read 2026).
Other migration policies aim to limit immigration, to bring back emigrants, or to manage emigration of workers whose remittances support families at home. Migration policies raise their own ethical and political questions: who may enter, on what grounds, and how the rights of migrants and of the receiving population are balanced.
Policy | Type | Main measures | Outcome |
|---|---|---|---|
China, one-child policy (1980–2015) | Anti-natalist, coercive | Birth limits, fines, IUDs and sterilisation | TFR already falling; ageing, high sex ratio at birth (extended case study) |
Singapore, “Stop at Two” (1970s) | Anti-natalist, incentives and penalties | Penalties for third and later children | Reversed in 1987 when fertility fell below replacement |
Iran (from 1989) | Anti-natalist, voluntary | Free contraception, sterilisation, premarital classes, religious support | TFR 6.2 (1985) to 2.0 (2000); policy reversed after 2012 |
Romania, Decree 770 (1966–1989) | Pro-natalist, coercive | Abortion and contraception banned | Births doubled in 1967, then fell back; many maternal deaths |
Hungary (from 2019) | Pro-natalist, incentives | Tax exemptions, housing loans, childcare | Small rise in TFR, then a fall; still below replacement |
Canada, Immigration Levels Plan | Migration | Annual targets for permanent residents; points system | Most population growth comes from immigration |
Sources: UN World Population Prospects 2024; Wikipedia articles on each policy (read 2026).
Managing population: indirect policies
Many of the largest falls in fertility have happened without any policy aimed directly at births. Social and economic policies that improve people’s lives change the decisions families make, and so change birth rates, death rates and migration indirectly.
Education, especially of girls. Girls who stay in school marry later, have their first child later, earn more and have more say in decisions about family size.
Gender equality and women’s employment. Paid work outside the home raises the cost of time spent raising children and gives women more independence.
Public health. Lower infant and child mortality reduces the number of births parents feel they need; maternal health services bring women into contact with family planning.
Welfare and pensions. When the state supports people in old age, parents no longer depend on many children for security.
Economic development and urbanisation. Higher incomes, urban housing and the cost of education make large families expensive.
Indirect policies can also raise birth rates or slow population decline: affordable housing, paid parental leave for both parents and flexible working all make it easier to have children, and better health care for older people lowers death rates. Many of these measures are part of the Sustainable Development Goals, especially SDG 3 (good health), SDG 4 (quality education) and SDG 5 (gender equality).
Kerala, India
Kerala, a state in south-western India, has long had much lower birth rates than most of India despite relatively low incomes. Its governments invested early in schools, health care and land reform. Kerala had the highest literacy rate in India in the 2011 census (about 94%), almost all births take place in hospitals, its infant mortality rate was 7 per 1,000 in 2018, far below the rate for India as a whole, and its life expectancy is the highest of any Indian state. Kerala’s fertility is below replacement level.
Sources: Wikipedia, “Kerala model” and “Demographics of Kerala” (read 2026).
Kerala shows that a fall in fertility does not have to wait for high incomes, because education, health and the status of women can drive it. Critics point out that Kerala also depends heavily on money sent home by migrants working in the Gulf states, and that its model has not produced many jobs at home, so it is not simply “development without growth”.
Bangladesh
Bangladesh’s TFR fell from 6.8 in 1971 to 2.2 in 2023, while incomes were still low. In 1976 the government declared rapid population growth the country’s most serious problem and built a national family planning programme, with community health workers visiting women at home and non-governmental organisations providing contraception in rural areas. In recent national surveys about 62% of married women aged 15–49 used contraception. Rising girls’ school enrolment and the employment of millions of women in the garment industry supported the fall.
Sources: UN World Population Prospects 2024; Wikipedia, “Family planning in Bangladesh” (read 2026).
The link with education is visible in Bangladesh’s own survey data. Women with no education or incomplete primary schooling had a TFR of 2.6, against 2.2 for women with secondary education or higher. The difference is smaller than in many countries, because the family planning programme reached women at every level of education.
Sources: Wikipedia, “Family planning in Bangladesh” (read 2026), citing the Bangladesh Demographic and Health Survey.
Perspectives on population and its management
Views about population depend on environmental value systems and on wider beliefs about rights, the economy and the role of the state. The same data on population growth can lead to very different conclusions.
Perspective | View of population growth | Typical policy preference |
|---|---|---|
Technocentrism | People are a resource; innovation in farming, energy and recycling can support a larger population, as the Green Revolution did | Invest in technology and development; little need to limit births |
Ecocentrism | Human numbers multiplied by consumption already exceed what ecosystems can sustain; growth harms other species | Lower birth rates through education and voluntary family planning, together with lower consumption |
Anthropocentrism (managerial) | Population is a resource to be managed for human welfare and economic growth | Policies chosen for their economic effect: anti-natalist when growth is fast, pro-natalist or immigration when the workforce shrinks |
Rights-based view | Decisions about children belong to individuals and couples | Rejects coercion; supports voluntary family planning, education and health care |
Who wins and who loses differs between policies. Coercive policies such as China’s one-child policy or Romania’s Decree 770 placed the heaviest costs on women, through forced procedures, unsafe abortions and the loss of choice. Indirect policies spread their benefits more widely, because education and health care improve lives whether or not they change fertility. Many countries and international organisations now treat voluntary choice as a principle, so that population goals are pursued through rights rather than against them.
Case study: China’s population policies, from one child to three
Context
China was the world’s most populous country from before 1950 until 2023, when India overtook it. Its population grew from about 544 million in 1950 to 983 million in 1980. Under Mao Zedong, falling death rates and very high fertility (a TFR of 7.5 in 1963, after the famine years of 1959–1961) produced rapid growth, and by the 1970s the government saw population growth as the main obstacle to feeding the country and modernising its economy.
Viewed as a system, China’s population is almost closed to migration: net migration has been close to zero for decades, so its size has been controlled by births and deaths alone. That made the birth rate the obvious lever for a government that wanted to change the growth rate.
Sources: UN World Population Prospects 2024; Wikipedia, “One-child policy” (read 2026).
What happened
Population control in China came in four phases, moving from persuasion to coercion and then, decades later, to encouragement.
1973–1979: “later, longer, fewer” (wan xi shao). A national campaign urged later marriage, longer gaps between births and fewer children. Contraception was widely distributed, and the IUD became the most common method. The TFR fell from 6.1 in 1970 to 2.7 in 1979, most of the fall that is often credited to the later policy.
1980–2015: the one-child policy. Formally implemented on 18 September 1980 and written into the constitution in 1982, it limited most urban Han Chinese couples to one child. Enforcement relied on fines (the “social child-raising fee”, which in some provinces was three to six times a household’s annual income), loss of jobs and benefits, and the refusal of household registration (hukou) to unauthorised children, which shut them out of state schools and health care. Between 1980 and 2014, 324 million women received IUDs and 108 million were sterilised, and in some places local officials forced women to have abortions.
Exceptions. By 2007 only about 36% of the population faced a strict one-child limit; 53% (mostly rural families) could have a second child if the first was a girl, and ethnic minorities were usually allowed two or more.
2016–present: pro-natalism. A universal two-child policy began on 1 January 2016, a three-child policy on 31 May 2021, and all limits were lifted on 26 July 2021. Since then the government has offered incentives, including a national childcare subsidy of 3,600 yuan a year for each child under three, announced in July 2025.
Sources: Wikipedia, “One-child policy”, “Three-child policy” and “Demographics of China” (read 2026).
Data
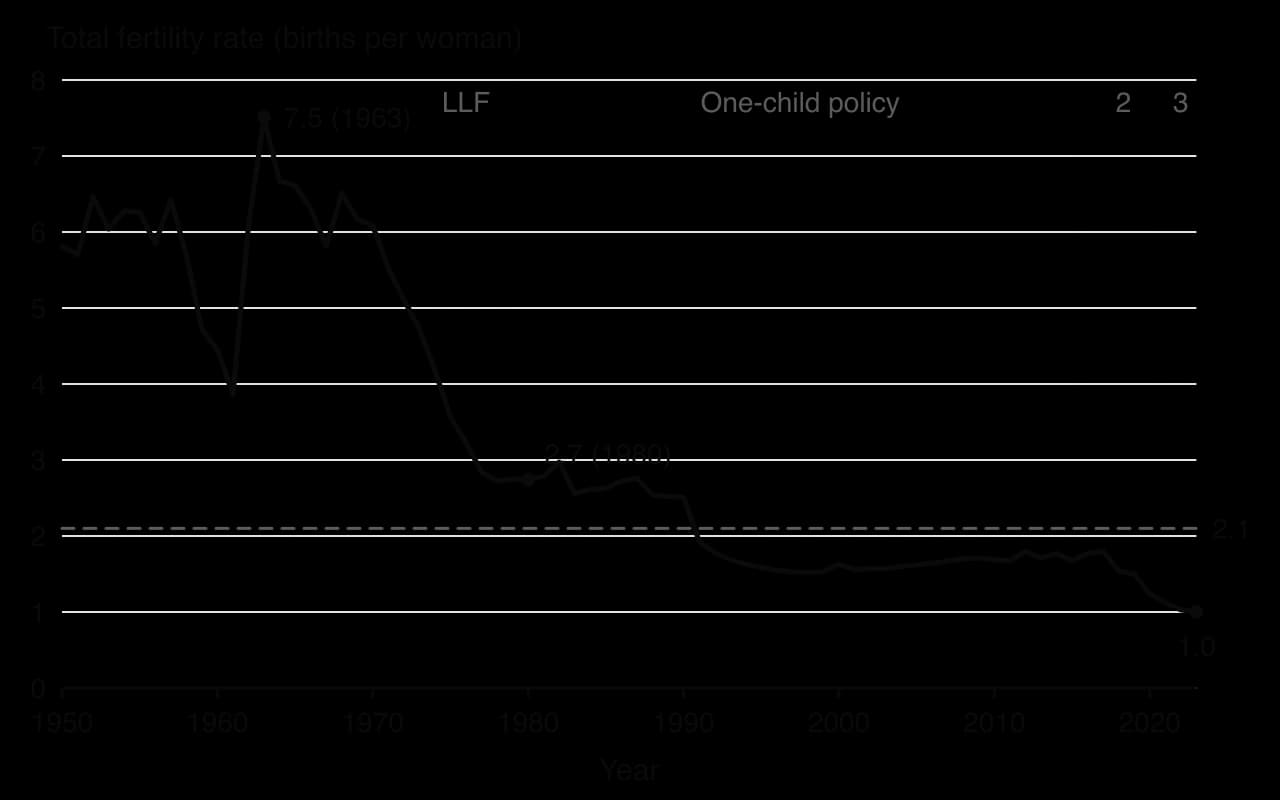
The population kept growing for forty years after 1980, from 983 million to a peak of about 1,426 million in 2021, even though fertility was below replacement from the early 1990s. This continued growth happened because the large generations born in the 1960s and early 1970s were having children of their own, an effect of population momentum. China’s population began to fall in 2022. In 2025 there were 7.92 million births and 11.31 million deaths, and the population fell by 3.39 million.
Sources: UN World Population Prospects 2024; Wikipedia, “Demographics of China” (read 2026), citing China’s National Bureau of Statistics.

Indicator | 1980 | 2023 | 2050 (projection) |
|---|---|---|---|
Population (millions) | 983 | 1,423 | 1,260 |
Total fertility rate | 2.74 | 1.00 | 1.18 |
Life expectancy (years) | 64.2 | 78.0 | 83.4 |
Median age (years) | 20.9 | 39.1 | 52.1 |
Aged 65 and over (%) | 4.4 | 14.3 (14.7 in 2024) | 30.9 |
Sex ratio at birth (boys per 100 girls) | 107 | 111 | 106 |
Sources: UN World Population Prospects 2024 (medium variant for 2050).
The sex ratio at birth, which is about 103–107 boys per 100 girls in most populations, rose to about 117–118 in the mid-2000s. A strong preference for sons, combined with a limit on the number of children and the spread of ultrasound scanning, led to sex-selective abortion and the under-registration or abandonment of girls. As a result, men outnumber women in the generations born since the 1980s, and many men, especially in poor rural areas, find it hard to marry.
Management and responses
The government responded to the consequences of its own earlier policy. As the working-age population started to shrink and the number of retired people grew, it relaxed the limits from 2013 and abolished them in 2021. It began raising the retirement age from January 2025, and has added longer maternity leave, cash payments for second and third children in some regions and, since 2025, the national childcare subsidy.
The response so far has had little effect on births. Births rose briefly in 2016 and 2017 when the two-child policy began, as couples who had been waiting had a second child, and then fell every year to 2023. The high cost of housing and education in cities, long working hours and a generation of only children who grew up expecting small families all work against the incentives.
Sources: Wikipedia, “One-child policy” and “Demographics of China” (read 2026); UN World Population Prospects 2024.
Evaluation
Judging the policy depends on what it is compared with and from which perspective. The government claimed that it prevented about 400 million births. Many demographers dispute this, because most of the fall in fertility happened in the 1970s and similar falls occurred without coercion in countries at a similar stage of development. Thailand, the Indian state of Kerala and South Korea, whose TFR fell from 4.3 in 1971 to below replacement by 1984, are often cited.
Stakeholder or perspective | View of the one-child policy |
|---|---|
Central government planners (1980) | Necessary to raise income per person, feed the population and modernise; growth was seen as a threat to development |
Rural families | A burden: sons were needed for farm work and old-age support, so many families resisted, paid fines or hid births |
Women | Bore most of the cost: forced IUD insertion, sterilisation and abortion in some areas, and pressure to have a son |
Human rights organisations | A violation of reproductive rights; Amnesty International argued that the two-child policy did not end coercion either |
Demographers | Fertility was already falling; the policy accelerated a trend but caused lasting imbalances in age and sex structure |
Ecocentric view | Slower growth reduced the pressure on land, water and ecosystems, but China’s environmental impact grew anyway because consumption per person rose rapidly |
Sources: Wikipedia, “One-child policy” (read 2026).
In terms of sustainability, the policy achieved a short-term demographic aim at a high social cost. It left China with a rapidly ageing population, fewer workers to support each retired person and a family structure in which one adult child may have to care for two parents and four grandparents. The later pro-natalist measures show how hard it is to raise fertility once small families have become normal.
What it shows
China’s experience shows that direct anti-natalist policy can lower birth rates faster than indirect policy alone, but that much of the change would probably have happened through development, education and voluntary family planning. It also shows how decisions about births echo through a population pyramid for decades: the narrow cohorts born after 1980 are now the parents of a new, even smaller generation. Finally, it shows that a country can move from anti-natalist to pro-natalist policy within a single generation, and that raising fertility has proved much harder than lowering it.
Sources: UN World Population Prospects 2024; Wikipedia, “One-child policy”, “Three-child policy” and “Demographics of China” (read 2026).
Population growth and stress on Earth’s systems (HL only)
Projections for the next 50 and 100 years
In the UN medium variant the world population rises from 8.2 billion in 2024 to about 10.2 billion fifty years later, in 2074, and is close to its peak of 10.3 billion. The UN projections end in 2100, about 75 years ahead, when the medium variant gives 10.2 billion and slow decline. Beyond 2100 there are no official projections, so statements about the population a full century from now depend on extending the same assumptions.
UN variant (2024) | 2024 | 2074 (50 years) | 2100 (end of projections) |
|---|---|---|---|
High | 8.2 billion | 12.3 billion | 14.4 billion, rising |
Medium | 8.2 billion | 10.2 billion | 10.2 billion, falling slowly |
Low | 8.2 billion | 8.4 billion | 7.0 billion, falling |
Sources: UN World Population Prospects 2024.
Almost all of the projected growth is in Africa. In the medium variant Africa’s population rises from 1.5 billion in 2024 to 2.6 billion in 2054 and 3.8 billion in 2100, while Asia’s peaks in the 2050s and Europe’s is already falling. By 2100 more than a third of the world’s people would be African.
Sources: UN World Population Prospects 2024.
Several factors could move the actual path towards the high or the low variant:
The speed of fertility decline in sub-Saharan Africa, where the TFR was 4.3 in 2024. Each tenth of a child per woman there makes a difference of tens of millions of people by 2100.
Girls’ education and women’s employment, which are the strongest predictors of lower fertility; groups that model them explicitly project lower peaks.
Access to contraception, especially where many women who want to avoid pregnancy are not using a modern method.
Government policy, both anti-natalist and pro-natalist, and the effect of economic conditions such as housing costs on fertility in low-fertility countries.
Mortality: pandemics, conflict and the health effects of climate change could raise death rates, while medical advances could extend life further.
Migration moves people between countries but does not change the world total, so it matters for national projections far more than for the global one.
Population, consumption and impact
The pressure a population places on Earth’s systems depends on how many people there are, how much each person consumes, and how damaging the technology is that produces what they consume. This idea is summarised in a simple model, I = PAT, which came out of a debate around 1970 between the ecologists Paul Ehrlich and John Holdren and the biologist Barry Commoner.
The model is useful because it shows three separate levers: fewer people, lower consumption per person or cleaner technology. Its limitations are that the three factors are not independent (rising affluence lowers fertility and pays for cleaner technology), that it treats impact as a single number, and that it hides inequality within and between countries. Critics have argued that it has been used to blame population growth in poor countries for impacts that are mostly caused by consumption in rich ones.
Sources: Wikipedia, “I = PAT” (read 2026).
Biocapacity disparity
The ecological footprint of a population is the area of biologically productive land and water needed to provide what it consumes and absorb its waste; biocapacity is the productive area actually available. Both are measured in global hectares. When population grows, the same biocapacity is shared among more people, so biocapacity per person falls even if total biocapacity stays the same.
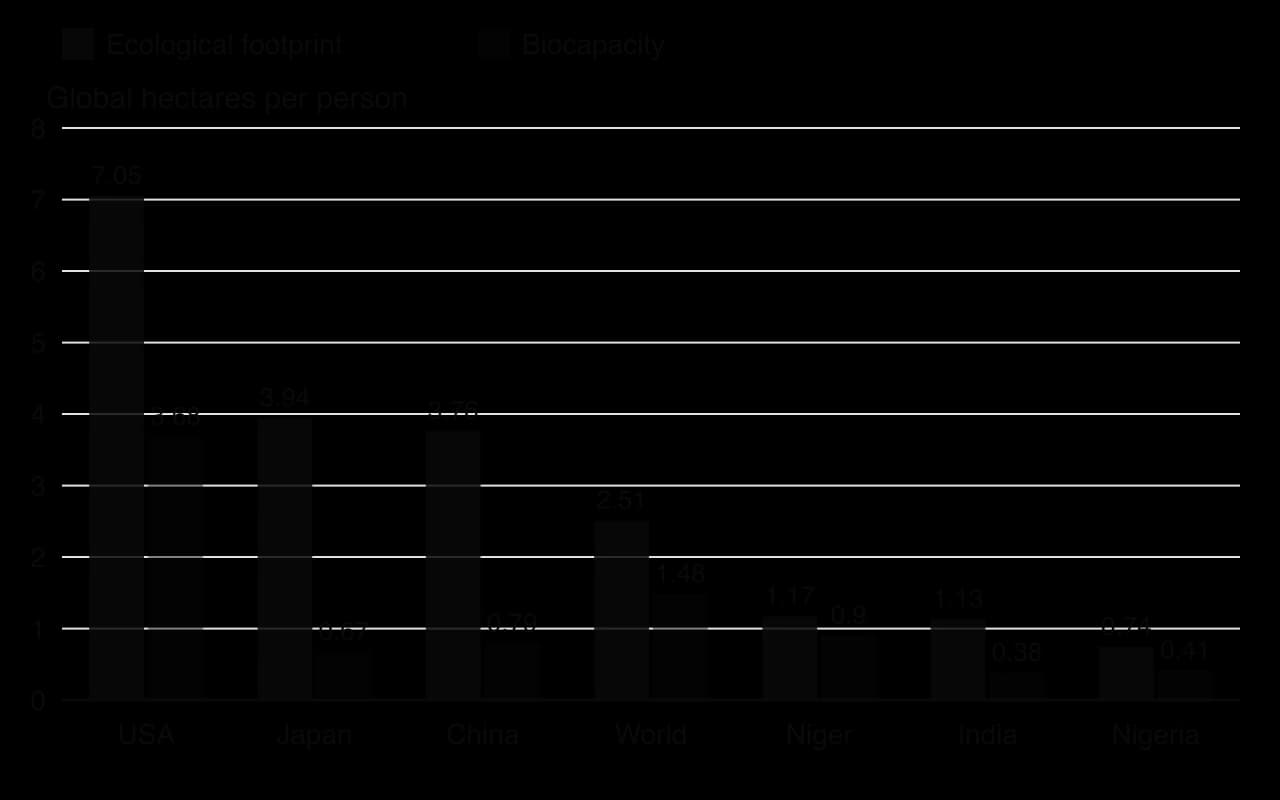
The figure shows a large disparity. The world’s average footprint of 2.51 gha per person is about 1.7 times its biocapacity of 1.48 gha per person, so humanity as a whole is in ecological overshoot. The average person in the United States has a footprint more than nine times that of the average person in Nigeria. Japan’s population is shrinking, but each Japanese person uses almost six times the biocapacity available per person in Japan, so the country depends on imports of food, timber and energy produced elsewhere.
Sources: Global Footprint Network and York University, National Footprint and Biocapacity Accounts 2025 edition, via Wikipedia, “List of countries by ecological footprint” (read 2026).
Population growth therefore increases stress on Earth’s systems in two ways. In low-income countries, rapid growth divides limited local biocapacity among more people, increasing pressure on soils, water, forests and fisheries; Nigeria’s biocapacity per person is only 0.41 gha. Globally, every additional person adds to total demand, and that addition is largest where consumption per person is highest, which is mainly in high-income countries with slow or negative population growth.
Population and the doughnut model
Doughnut economics combines a social foundation of twelve basic needs (food, water, health, education, housing, energy and others) with an ecological ceiling made of the nine planetary boundaries. A population lives in the safe and just space when everyone’s needs are met without crossing any boundary.
Population growth makes this harder in both directions. More people must be lifted above the social foundation, which requires more food, energy, housing and infrastructure, and so more pressure on the ecological ceiling, of which seven boundaries had already been crossed by 2025. A study published in 2018 that applied the doughnut to about 150 countries found that none met the basic needs of its citizens while keeping its resource use within a globally sustainable level. Countries with low footprints tended to fall short of the social foundation; countries that met it overshot the ecological ceiling.
Sources: Wikipedia, “Doughnut (economic model)” (read 2026), citing O’Neill et al., _Nature Sustainability (2018)._
Perspective | Argument about population and Earth’s systems |
|---|---|
Neo-Malthusian (often ecocentric) | Growth in numbers pushes humanity beyond the planet’s biocapacity; slowing population growth is essential, alongside lower consumption |
Technocentric (in the tradition of Ester Boserup) | Population pressure stimulates innovation, as farming intensified in the past; technology can raise biocapacity and lower impact per person |
Environmental justice | Most of the impact comes from the consumption of the richest people; blaming population growth in poor countries shifts responsibility away from those who cause most of the damage |
Development-focused | Education, health and gender equality lower fertility and improve lives at the same time, so they meet both the social foundation and the ecological goal |
Dependency ratio and population momentum (HL only)
The dependency ratio
People of working age produce most of the goods and services and pay most of the taxes that support children and older people. The balance between these groups is summarised by the dependency ratio.
The ratio can be split into a youth dependency ratio (children only) and an old-age dependency ratio (people 65 and over only). It tends to be high when fertility is very high, because of the many children, and when fertility has been very low for a long time, because of the many older people. It is lowest in the middle of the demographic transition, when fertility has fallen but the large generations born earlier are still of working age.
The dependency ratio has limitations as a measure. Many people aged 15–19 are still in education, many adults of working age have no paid job, and many people over 65 keep working; in low-income countries children often work as well. The ratio uses age as a stand-in for economic dependence, which is why some governments raise the retirement age to change who counts as dependent.
The demographic dividend
When fertility falls, a country spends some decades with a low dependency ratio: there are fewer children to support, and the large generations born earlier are of working age, while the number of older people is still small. This opportunity is called the demographic dividend. China’s dependency ratio fell from 68 in 1980 to 44 in 2024; the UN projects that it will rise again to 69 by 2050 as those workers retire.
Sources: Calculated from UN World Population Prospects 2024.
The dividend is only potential: it pays off if the extra workers are educated, healthy and employed. Countries such as Nigeria, whose fertility is now falling, could gain one in the coming decades, but only if jobs are created fast enough for the young people entering working age.
Population momentum
A falling TFR does not stop population growth at once. If a population is young, the number of women of childbearing age keeps increasing for decades, because the children already born are still moving up the pyramid. Even if each woman has fewer children, more women having children can mean more births in total.
The UN tests this with an “instant replacement” scenario, in which fertility in every country jumps to exactly replacement level in 2024 and stays there. Even then, the world population would grow from 8.2 billion to about 10.8 billion by 2100, more than in the medium variant, because the large generation of young people alive today would still have children. Most of the growth still to come is therefore already built into today’s age structure.
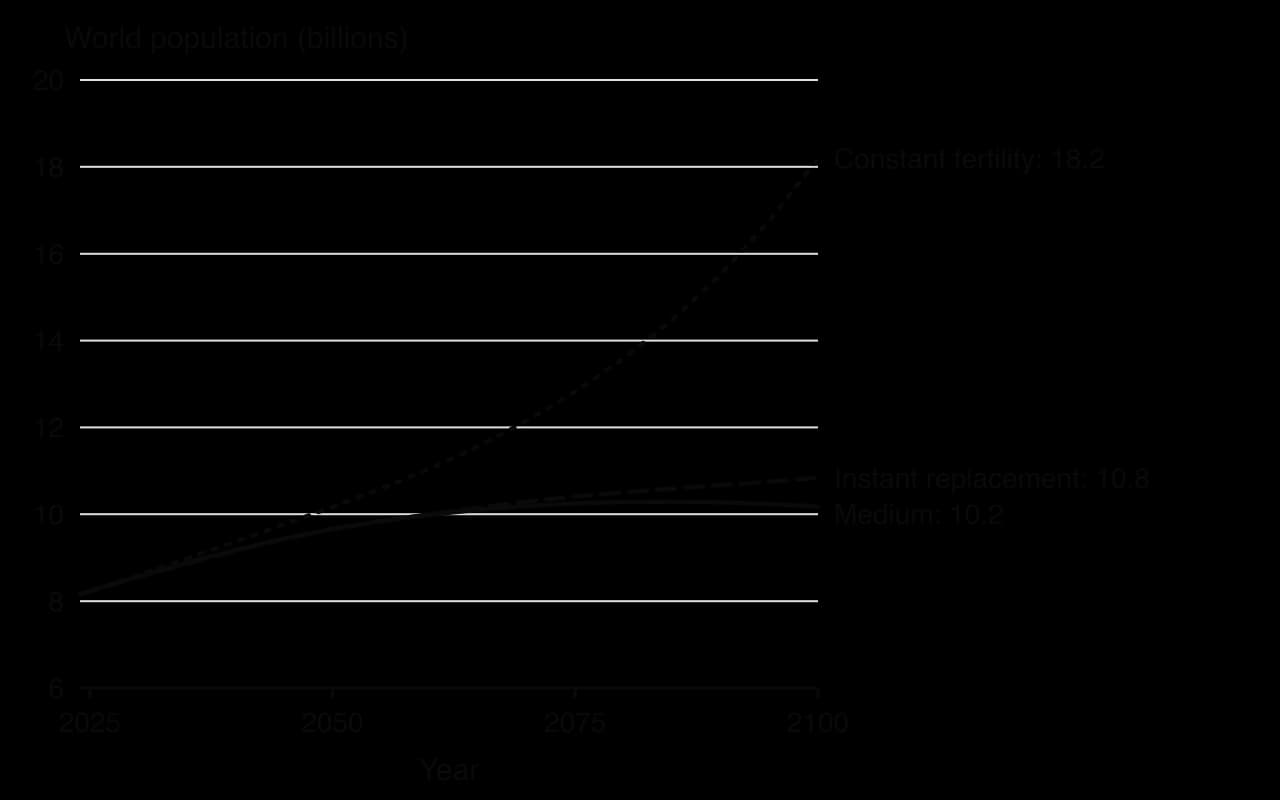
China’s population, which grew by about 270 million in the thirty years after its fertility fell below replacement around 1991, is the clearest recent example. Momentum also works in reverse: in a country with a narrow base, such as Japan, there are few young women, so the number of births keeps falling even if fertility rises slightly, and decline continues for decades.
Sources: UN World Population Prospects 2024.
Two countries at different stages of the demographic transition (HL only)
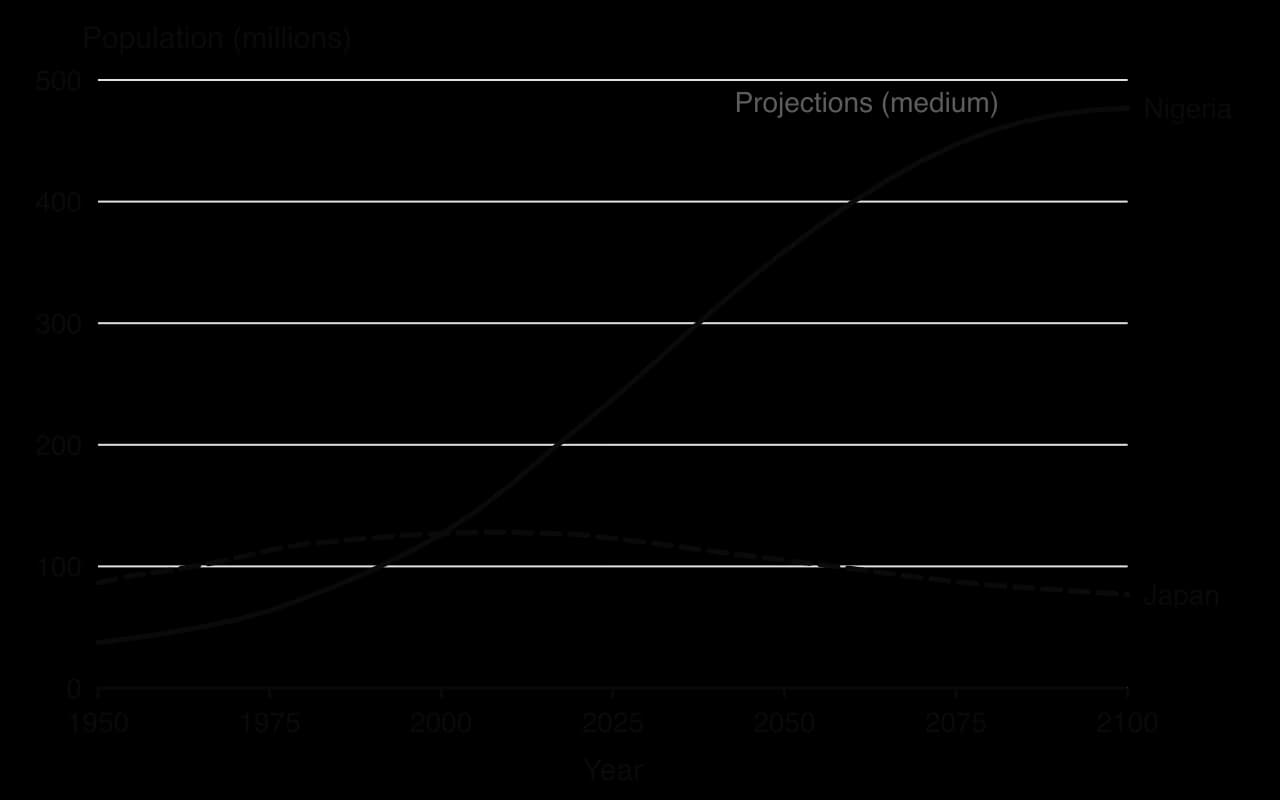
Nigeria and Japan illustrate the two ends of the demographic transition. Nigeria, Africa’s most populous country, is in stage 3 with high fertility; Japan, one of the oldest populations in the world, is in stage 5.
Indicator | Nigeria 1994 | Nigeria 2024 | Nigeria 2054 | Japan 1994 | Japan 2024 | Japan 2054 |
|---|---|---|---|---|---|---|
Population (millions) | 108 | 233 | 376 | 125 | 124 | 102 |
Crude birth rate (per 1,000) | 44.0 | 32.5 | 21.3 | 9.6 | 6.1 | 6.7 |
Crude death rate (per 1,000) | 18.7 | 11.6 | 10.5 | 7.2 | 12.4 | 14.5 |
Total fertility rate | 6.32 | 4.38 | 2.54 | 1.47 | 1.22 | 1.36 |
Life expectancy (years) | 45.7 | 54.6 | 59.1 | 79.8 | 84.9 | 88.9 |
Infant mortality (per 1,000 births) | 117 | 68 | 53 | 4.4 | 1.7 | 0.8 |
Median age (years) | 16.4 |
Sources: UN World Population Prospects 2024 (medium variant for 2054; dependency ratios calculated from its age data).
Nigeria: why the population is young and growing
Historical and health factors. Death rates have fallen since the mid-twentieth century with vaccination, better water supply and treatment of diseases such as malaria, but infant mortality and maternal mortality remain among the highest in the world, so life expectancy was still only about 55 years in 2024.
Cultural and religious factors. Large families are widely valued, children bring status and support in old age, and in many communities early marriage is common.
Economic and social factors. Most rural households depend on farming and the informal economy, where children contribute labour; female secondary school enrolment was only about 47% in 2023, and use of modern contraception is low.
Political factors. Health and family planning services are unevenly provided across a large federal country, and insecurity in parts of the north has disrupted schooling and health care.
Fertility is falling, from 6.3 in 1994 to 4.4 in 2024, and the UN projects 2.5 by 2054. Even so, because 41% of the population is under 15, momentum means the population is projected to grow by more than 140 million over the next 30 years. The dependency ratio is projected to fall, which offers Nigeria a potential demographic dividend if education and employment keep pace.
Sources: UN World Population Prospects 2024; World Bank, World Development Indicators (female secondary enrolment, 2023).
Japan: why the population is old and shrinking
Historical factors. Japan’s transition happened early and fast: its TFR fell from 3.6 in 1950 to about 1.5 by 1990, and it has stayed below replacement for decades.
Economic and social factors. High housing and education costs, long working hours, insecure employment for young adults and the difficulty of combining paid work with childcare, especially for women, discourage marriage and children; most births in Japan occur within marriage, so later and fewer marriages mean fewer births.
Health factors. Very low infant mortality, a healthy diet and universal health care give Japan one of the highest life expectancies in the world, about 85 years, so a large share of the population survives to old age.
Political and cultural factors. Immigration has historically been very limited, so it has not offset natural decrease as it has in Canada or the United Kingdom; net migration was only about 1.4 per 1,000 in 2023.
Japan’s population peaked around 2010 at about 128 million. With a narrow pyramid base, the number of births will keep falling even if fertility rises a little, so the population is projected to fall to about 102 million by 2054, when more than a third of the population will be 65 or over and the dependency ratio will be close to 100.
Sources: UN World Population Prospects 2024.
Environmental migration (HL only)
People have always moved away from places that became unsafe or unable to support them. Climate change, drought and land degradation are making such movements, known as environmental migration, more frequent, and their number is likely to grow as sea level rises and dry regions become drier.
The causes are divided by how fast they act. A sudden-onset event strikes within hours or days and forces people to flee at once, often temporarily. A slow-onset event wears away the basis of people’s livelihoods over years or decades, so that families decide to leave one by one, often permanently.
Type | Examples of events | Typical pattern of migration |
|---|---|---|
Sudden-onset | Floods, tropical cyclones and storm surges, flash droughts, forest fires | Sudden mass displacement, mostly within the country; many return to rebuild, but repeated events can make return impossible |
Slow-onset | Desertification, sea-level rise, saltwater intrusion into soils and groundwater, glacier retreat, long-term drought | Gradual, often permanent migration, frequently of young adults first; often from rural areas to cities |
Environmental migration is rarely caused by the environment alone. Poverty, dependence on rain-fed farming, insecure land tenure, conflict and the lack of public support after a disaster decide who has to move and who can stay. The poorest people may be unable to move at all, because migration costs money.
Sudden onset: repeated cyclones in Mozambique
In March 2019 Cyclone Idai made landfall near the port city of Beira in Mozambique. Strong winds and extreme rainfall flooded large areas of the Sofala province, and the storm and floods killed more than 1,500 people across Mozambique, Zimbabwe and Malawi. The Red Cross estimated that about 400,000 people were displaced in Mozambique, many into crowded evacuation centres. Six weeks later, in April 2019, Cyclone Kenneth struck northern Mozambique near Pemba, the most intense cyclone ever recorded making landfall in the country; it was only the second time in Mozambique’s recorded history that two storms of such intensity had made landfall in one season.
Sources: Wikipedia, “Cyclone Idai” and “Cyclone Kenneth” (read 2026), citing the IFRC and Météo-France.
The two cyclones show how repeated sudden-onset events can turn temporary displacement into longer-term migration: families who had lost homes, crops and livestock to Idai had little left to recover with. Mozambique is one of the world’s lowest-income countries and contributes very little to global greenhouse gas emissions, which makes its losses a question of climate justice.
Slow onset: sea-level rise and Tuvalu
Tuvalu is a Pacific island nation of about 10,000 people living on 26 km² of low coral atolls, with an average height of less than 2 m above sea level. Rising sea level, storm overwash and saltwater getting into the freshwater lens beneath the islands threaten housing, drinking water and the growing of food crops. Tuvalu’s population is already falling because of emigration: net migration was about −29 per 1,000 in 2024.
Sources: Wikipedia, “Climate change in Tuvalu” (read 2026); UN World Population Prospects 2024.
Two agreements give Tuvaluans legal routes to migrate. Under New Zealand’s Pacific Access Category, announced in 2001, up to 75 Tuvaluans a year can be granted residence by ballot, if the main applicant has a job offer. The Falepili Union treaty between Tuvalu and Australia, signed on 9 November 2023 and in force since 28 August 2024, offers permanent residence to up to 280 Tuvaluans a year, as a pathway designed for climate-related mobility. Both routes allow planned migration with dignity rather than displacement after a disaster.
Sources: Wikipedia, “Australia–Tuvalu relations” and “Tuvalu” (read 2026).
From a legal perspective, the Falepili Union is one of the first treaties to link migration explicitly to climate change; the international refugee convention does not cover people who move for environmental reasons. From an ethical perspective, it raises questions about who should bear the costs of climate change and about the survival of a nation and its culture if its people leave. Some Tuvaluan politicians criticised the security provisions of the treaty as a limit on Tuvalu’s sovereignty.
Slow onset: drought and land degradation in the Sahel
In the Sahel, the semi-arid belt south of the Sahara, recurrent drought and land degradation reduce the yields of rain-fed crops and pasture. Seasonal and circular migration, in which young men move to cities or coastal countries during the dry season and return for the rains, is a long-established way of spreading risk. Longer or more frequent droughts can turn this into permanent migration, and the arrival of migrants and herders in new areas can increase competition for land and water.
Sources: World Bank, World Development Indicators, SE.SEC.ENRR.FE (2023); UN World Population Prospects 2024.
Exam practice
Human populations appear in all parts of the assessment. Paper 2 Section A often asks for definitions of demographic terms, calculations of natural increase, doubling time and (at HL) dependency ratios, and short explanations of the stages of the demographic transition or of a named policy. Paper 1 resource booklets often include population data, an age–sex pyramid or a population graph for an unfamiliar place. Section B essays use population policies, the DTM and the link between population and environmental stress as the basis for extended evaluation.
Paper 2 Section A-style questions
Paper 1-style data question
The resource below describes an invented country, Kalinda, in a style similar to a Paper 1 resource booklet. All data are hypothetical.
Indicator (Kalinda) | 1995 | 2025 | 2055 (projection) |
|---|---|---|---|
Population (millions) | 12.0 | 21.5 | 29.0 |
Crude birth rate (per 1,000) | 42 | 28 | 17 |
Crude death rate (per 1,000) | 16 | 8 | 8 |
Total fertility rate | 6.4 | 3.5 | 2.1 |
Population aged 0–14 (millions) | 5.6 | 8.2 | 7.0 |
Population aged 15–64 (millions) | 6.0 | 12.5 | 19.6 |
Population aged 65+ (millions) | 0.4 | 0.8 | 2.4 |
Female secondary school enrolment (%) | 18 | 64 | — |
Paper 2 Section B-style essay
Summary
Births and immigration are the inputs to a human population; deaths and emigration are the outputs; at the global scale only births and deaths matter.
Crude birth and death rates and migration rates are expressed per 1,000 people per year; natural increase is CBR − CDR (per 1,000), or (CBR − CDR) ÷ 10 as a percentage, and excludes migration.
The total fertility rate measures births per woman; replacement fertility is about 2.1; life expectancy is a model based on current death rates.
Doubling time = 70 ÷ growth rate (%), valid only if the growth rate stays constant.
The world population grew from 2.5 billion in 1950 to 8.2 billion in 2024; the UN medium variant projects a peak of 10.3 billion in 2084, with low and high variants of 7.0 and 14.4 billion in 2100, reflecting uncertainty about future fertility.
Age–sex pyramids show the structure of a population; their shapes (expansive, stationary, constrictive) reflect birth and death rates and predict future needs.
The demographic transition model describes five stages: death rates fall first, then birth rates; it is based on European experience and does not predict timing, migration or policy effects.
Direct policies target births or migration (China’s one-child policy, Romania’s Decree 770, Canada’s immigration plan); indirect policies such as education, gender equality and health (Kerala, Bangladesh) change fertility more slowly but more lastingly.
Rapid population growth increases stress on Earth’s systems, but impact also depends on consumption and technology; footprints far exceed biocapacity in high-consuming countries. (HL)
Dependency ratio = (0–14 + 65+) ÷ 15–64 × 100; population momentum keeps young populations growing after fertility falls. (HL)
Nigeria (stage 3) and Japan (stage 5) show how historical, cultural, economic, social and political factors produce opposite population trends. (HL)
Sudden-onset (Cyclones Idai and Kenneth, Mozambique) and slow-onset (sea-level rise in Tuvalu, drought in the Sahel) events cause environmental migration. (HL)
Self-check
- To do:
I can outline births, deaths, immigration and emigration as the inputs and outputs of a population system.
- To do:
I can calculate crude birth and death rates, migration rates, natural increase and doubling time from data.
- To do:
I can distinguish between crude birth rate, total fertility rate and replacement fertility, and explain what life expectancy measures.
- To do:
I can describe global population growth and explain why the UN publishes three projection scenarios.
- To do:
I can construct an age–sex pyramid from data and interpret its shape.
- To do:
I can explain the five stages of the demographic transition model and evaluate it as a model.
- To do:
I can evaluate direct and indirect population policies using named examples, including China’s one-child policy.
- To do:
I can discuss how population growth, consumption and biocapacity together determine stress on Earth’s systems. (HL)
- To do:
I can calculate a dependency ratio and explain population momentum. (HL)
- To do:
I can compare two countries at different stages of the demographic transition over time. (HL)
- To do:
I can explain environmental migration with sudden-onset and slow-onset examples. (HL)