Notes on 8.3 Urban air pollution
Learning objectives
Outline the main urban air pollutants (nitrogen oxides, sulfur dioxide, carbon monoxide and particulate matter) and distinguish PM2.5 from PM10.
Distinguish between natural and anthropogenic sources of primary pollutants, and between primary and secondary pollutants.
Explain why most urban air pollutants come directly or indirectly from the combustion of fossil fuels.
Design an investigation that uses lichens as indicator species of local air pollution.
Evaluate strategies for reducing urban air pollution, using the three-level pollution management model.
Explain the chemistry of acid rain formation, and distinguish wet from dry deposition.
Describe the effects of acid deposition on soils, vegetation, fresh water, buildings and human health.
Evaluate strategies for managing acid deposition, with named examples and data.
Explain how photochemical smog forms and why its pollutants vary through the day. (HL)
Explain how temperature inversions, topography and weather intensify smog. (HL)
Outline the direct and indirect impacts of tropospheric ozone and discuss who bears the costs of urban air pollution. (HL)
Introduction
Air pollution is the largest environmental risk to human health. The World Health Organization estimates that outdoor air pollution caused about 4.2 million premature deaths in 2019, and that 99% of the world’s population lived in places where air quality did not meet its guidelines. Most of this exposure is in towns and cities, where traffic, industry, power generation and the burning of fuel and waste are concentrated close to where people live.
The atmosphere above a city can be treated as a system: pollutants are inputs, they are stored and mixed in the air, they are transformed by chemical reactions, and they are removed by wind, rain and settling onto surfaces. How polluted the air becomes depends on the balance between these inputs and outputs, which in turn depends on human choices about energy and transport, on environmental justice (who lives near the sources) and on local weather and landforms.
What urban air pollution is
Clean air is mostly nitrogen and oxygen, with small amounts of argon, carbon dioxide and water vapour. Urban air pollution is the addition of other gases and particles to this mixture, mainly by human activities, in amounts large enough to harm people, other organisms or materials. Like any pollution, it occurs when pollutants are added faster than the atmosphere can disperse or remove them.
Four pollutants are present in almost every city and are measured by air-quality monitoring networks worldwide.
Nitrogen oxides
Nitrogen oxides, written NOₓ, are mainly nitrogen monoxide (NO) and nitrogen dioxide (NO₂). They form whenever fuel burns at high temperature (combustion), because the heat makes nitrogen and oxygen from the air itself combine. Road traffic, especially diesel vehicles, and power stations are the largest urban sources. NO₂ irritates the airways and worsens asthma, and NOₓ go on to form acid deposition, nitrate particles and ozone.
Sulfur dioxide
Sulfur dioxide (SO₂) is released when fuels that contain sulfur are burned, especially coal and heavy fuel oil, and when sulfide ores are smelted. Volcanoes are a natural source. It irritates the eyes, nose and lungs, and it is the main cause of acid deposition. Where cities have stopped burning coal, SO₂ concentrations have fallen sharply.
Carbon monoxide
Carbon monoxide (CO) forms when fuel burns with too little oxygen (incomplete combustion), as in petrol engines, poorly maintained stoves and the burning of wood or waste. It binds to haemoglobin in red blood cells more strongly than oxygen does, reducing the oxygen the blood can carry. At high concentrations indoors it can kill; at street level it adds to heart and lung problems.
Complete and incomplete combustion
When a fuel such as methane burns in plenty of oxygen, combustion is complete and the products are carbon dioxide and water: CH₄ + 2O₂ → CO₂ + 2H₂O. With too little oxygen, some carbon ends up as carbon monoxide or as unburned carbon (soot), for example 2CH₄ + 3O₂ → 2CO + 4H₂O. Engines, stoves and fires that are cold, poorly tuned or short of air therefore produce more CO and particulates.
Particulate matter: PM10 and PM2.5
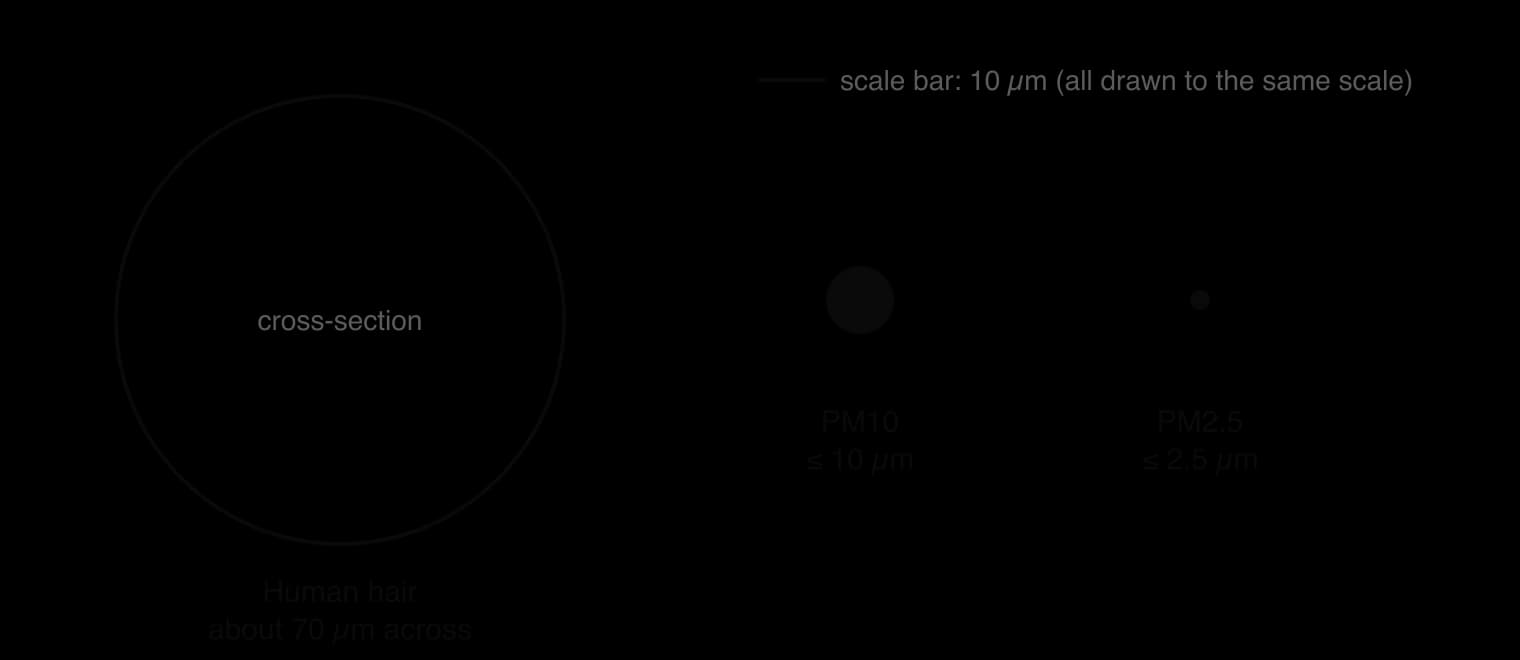
Particulate matter (PM) is the mixture of tiny solid particles and liquid droplets suspended in the air: soot from engines and fires, dust from roads and building sites, ash, pollen, sea salt, and particles formed in the air from gases. Particulates are classified by their diameter, measured in micrometres (µm; 1 µm is one thousandth of a millimetre).
PM10 includes coarse dust and pollen. Most of it is trapped in the nose, throat and larger airways. PM2.5 is the fine fraction, made mainly by combustion and by chemical reactions in the air. These particles are small enough to travel deep into the lungs, to the bronchioles and air sacs (alveoli), and some of the finest pass into the bloodstream and reach the heart and brain. PM2.5 is therefore the most harmful air pollutant to health, linked to heart disease, stroke, lung disease and lung cancer.
Pollutant | Main urban sources | Main effects |
|---|---|---|
Nitrogen oxides (NOₓ) | Road vehicles (especially diesel), power stations, industry | Airway irritation and asthma; acid deposition; forms ozone and nitrate particles |
Sulfur dioxide (SO₂) | Burning coal and oil in power stations, industry, ships and homes | Eye and lung irritation; acid deposition; forms sulfate particles |
Carbon monoxide (CO) | Petrol vehicles, stoves and fires with poor combustion | Reduces oxygen carried by the blood; heart strain; poisoning indoors |
PM10 and PM2.5 | Vehicle exhausts, tyre and brake wear, road and construction dust, burning of fuel, biomass and waste | Heart and lung disease, stroke, lung cancer; haze; soiling of buildings |
Measuring air quality
Monitoring stations measure the concentration of each pollutant, usually in micrograms per cubic metre of air (µg m⁻³) or parts per billion (ppb). To communicate the results to the public, many countries combine them into an air quality index (AQI). Each pollutant is converted to a sub-index on a common scale, and the worst one sets the overall value. In the United States the scale runs from 0 to 500: 0–50 is “good”, 151–200 “unhealthy” and over 300 “hazardous”. India’s national index uses eight pollutants and classes values of 401–500 as “severe”.
The World Health Organization’s 2021 guidelines set an annual average of 5 µg m⁻³ for PM2.5 and 15 µg m⁻³ for PM10, half the 2005 values, because new evidence showed harm at lower concentrations than previously thought. Very few places meet them.
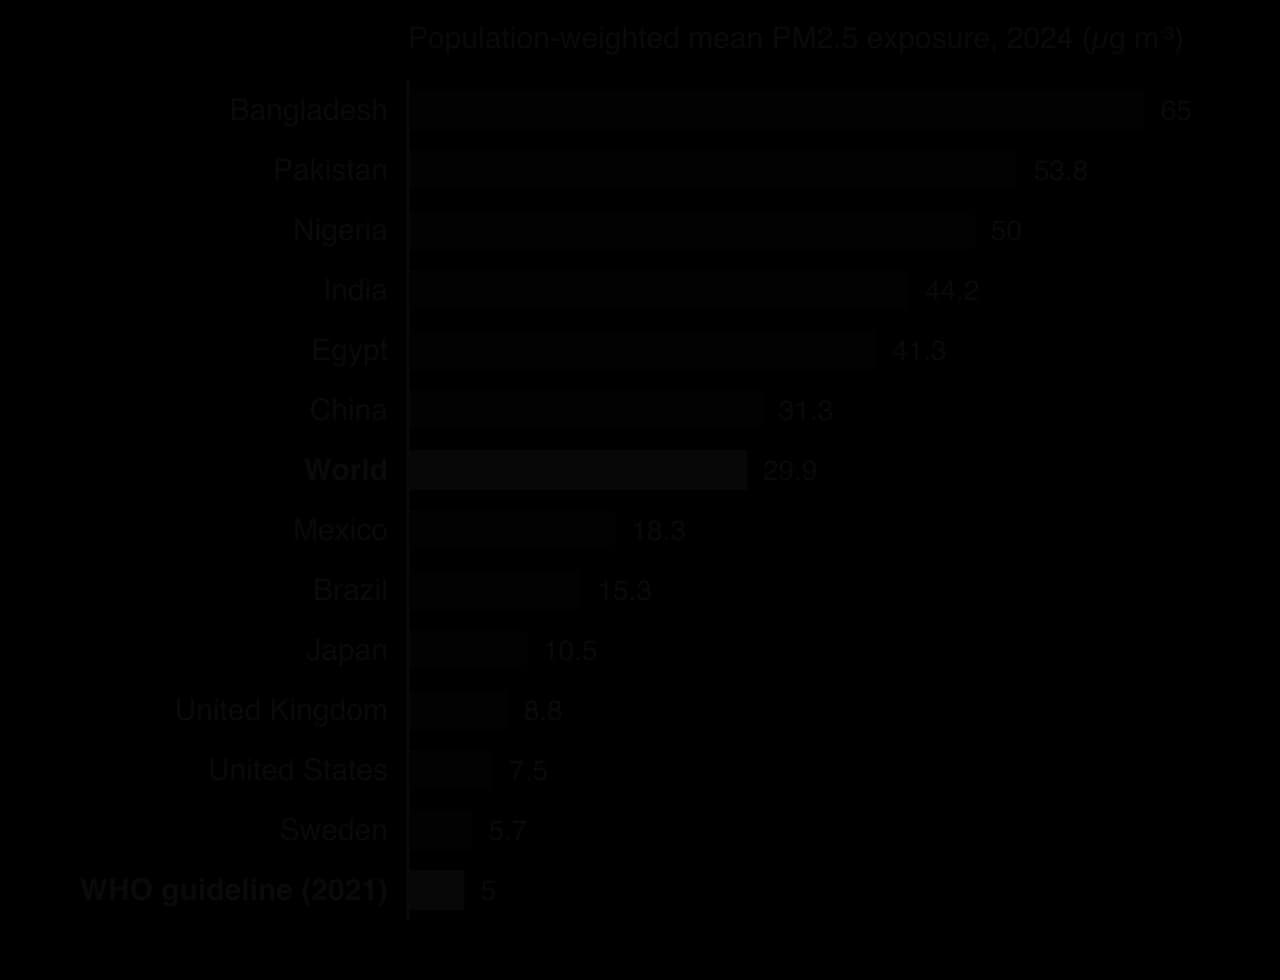
Sources: WHO, “Ambient (outdoor) air quality and health” (2024); US EPA, “Particulate matter (PM) basics” (2025); Wikipedia, “Air quality index” and “Particulate matter” (2026).
Sources of primary pollutants
A primary pollutant is harmful in the form in which it is released: it is directly active at the point of emission. Soot from a diesel exhaust, SO₂ from a power station chimney and carbon monoxide from a car are primary pollutants. Their sources can be natural or anthropogenic (caused by people).
Natural sources | Anthropogenic sources |
|---|---|
Forest and grassland fires started by lightning | Burning fossil fuels for electricity, heating, industry and transport |
Dust storms (for example, Saharan dust carried across the Atlantic and Mediterranean) | Burning crop residues and forests to clear land for farming |
Volcanic eruptions (SO₂, ash) | Burning biomass (wood, dung, charcoal) for cooking and heating |
Sea spray (salt particles), pollen and gases from vegetation | Dust from construction, roads and mining; open burning of waste |
By mass, most particulate matter in the global atmosphere comes from natural sources such as dust, sea salt and volcanoes. In cities, however, anthropogenic sources dominate, and the particles they produce (especially combustion soot) are smaller and more toxic. Natural and human sources also interact: deforestation and drought make wildfires and dust storms more likely, and some fires classed as wildfires are started by people clearing land.
Delhi, India, has some of the most polluted air of any large city, especially from November to February. Its sources are many: vehicles, road and construction dust, industry and power stations, the burning of waste and of wood and dung for heating, and smoke from crop residues burned on farms in Punjab and Haryana after the rice harvest, carried towards the city by north-westerly winds. Cold, still winter air traps the pollution near the ground. On 7 November 2016, PM2.5 reached 999 µg m⁻³ (the maximum the monitors could record), and the city’s AQI regularly exceeds 400 on the worst days.
Sources: Wikipedia, “Air pollution in Delhi” (2026).
Lichens as indicators of air pollution
Measuring pollutants directly needs expensive instruments. A cheaper way to compare air quality between places is to use indicator species, organisms whose presence, absence or abundance reflects an environmental condition. Lichens, partnerships between a fungus and an alga or cyanobacterium, are good indicators of air pollution. They have no roots and absorb water and minerals directly from rain and dust, so they also absorb pollutants from the air, and many species are sensitive to sulfur dioxide.
Lichens grow in three main forms. Crusty (crustose) lichens grow flat on bark or stone and are the most tolerant of pollution. Leafy (foliose) lichens are more sensitive, and shrubby or hairy (fruticose) lichens are the most sensitive. In heavily polluted air there may be no lichens at all; in clean air shrubby, hairy and leafy lichens become abundant.
Fossil fuels, primary pollutants and secondary pollutants
Most common urban air pollutants come directly or indirectly from the combustion of fossil fuels. Burning coal, oil and natural gas releases carbon monoxide, sulfur dioxide, nitrogen oxides and particulates directly: these are primary pollutants. Some of them then react in the air to form new pollutants. A secondary pollutant is not emitted at all; it is formed in the atmosphere when primary pollutants react with each other or with natural components of the air, often driven by sunlight.
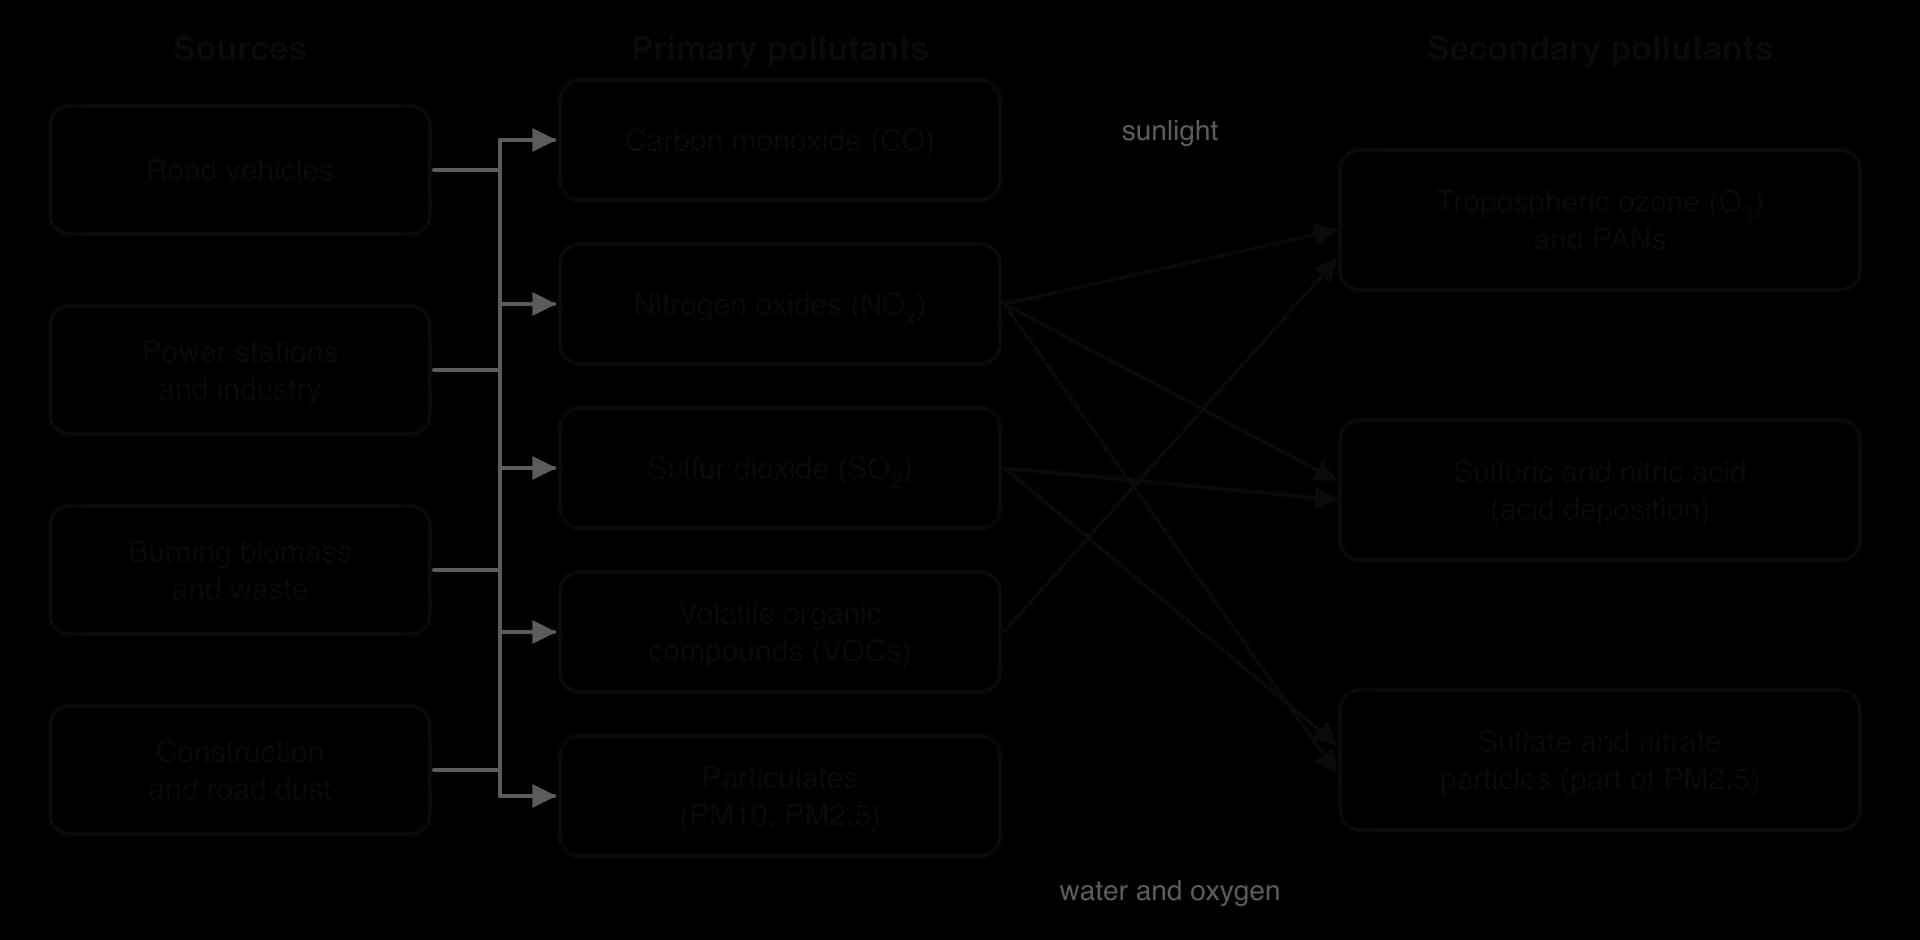
The most important secondary pollutant in cities is tropospheric ozone (O₃), also called ground-level ozone. It forms when sunlight drives reactions between nitrogen oxides and volatile organic compounds such as unburned fuel and solvents. Sulfuric and nitric acids, and the sulfate and nitrate particles that make up much of PM2.5 in many regions, are also secondary pollutants, formed from SO₂ and NOₓ.
Primary pollutant | Secondary pollutant | |
|---|---|---|
How it enters the air | Emitted directly from a source | Forms in the air from reactions between other substances |
Examples | CO, SO₂, NO, soot and dust (PM) | Tropospheric O₃, H₂SO₄, HNO₃, sulfate and nitrate particles |
Where concentrations are highest | Close to the source (busy roads, chimneys) | Often downwind of sources, hours later, because reactions take time |
How to reduce it | Control the source directly | Control the primary pollutants that form it |
Reducing urban air pollution
Air pollution can be managed with the same three-level pollution management model used for every kind of pollution: level 1 changes the human activity that produces the pollutant, level 2 controls the release of the pollutant into the environment, and level 3 cleans up the pollutant or treats its effects once it is released. Level 1 prevents the problem and is usually the most effective in the long run; level 3 deals only with damage already done.
Cities use a wide range of strategies. Most target road traffic, because it is the largest source of NOₓ, CO and fine particles at street level, and because people breathe vehicle exhaust at close range.
Changing how people travel (level 1)
Better public transport: frequent, affordable buses, trams and metros carry many people per vehicle, so emissions per passenger are much lower than by car. Electric buses and trains remove exhaust from the street entirely.
Cycling and walking infrastructure: separated cycle lanes, bike-share schemes and safe pavements replace short car trips with zero-emission ones.
Limiting car use: congestion charges, parking limits and driving restrictions on certain days reduce the number of vehicles.
Pedestrianised centres: streets closed to traffic have much lower concentrations of NO₂ and particulates.
Cleaner energy: replacing coal and wood burning in homes and power stations with gas, electricity from renewable sources or district heating.
Controlling emissions at the source (level 2)
Where vehicles and chimneys remain, technology can reduce what they release. Since 1993 every new petrol car sold in the European Union has had to carry a catalytic converter (the United States required them from the 1975 model year). Inside the exhaust, a honeycomb coated with platinum, palladium and rhodium speeds up reactions that convert the three most harmful gases into less harmful ones:
A three-way catalytic converter also oxidises unburned hydrocarbons to carbon dioxide and water. Converters only work well once they are hot (about 400 °C), so most of a car’s pollution on a short trip is released in the first few minutes; they need unleaded fuel, because lead poisons the catalyst; and they do not reduce carbon dioxide. Diesel vehicles need additional filters to trap particles and systems to reduce NOₓ.
Other level 2 measures include emission standards for new vehicles (the European “Euro” standards), regular emissions testing, cleaner fuels with less sulfur, dust suppression on building sites, and low emission zones that keep the most polluting vehicles out of city centres.
London’s Ultra Low Emission Zone (ULEZ) began in central London on 8 April 2019, was extended to the inner ring roads in October 2021 and to all 32 London boroughs on 29 August 2023. Petrol cars must meet the Euro 4 standard and diesel cars Euro 6, or pay £12.50 a day.
A 2025 report by Transport for London and the Greater London Authority estimated that NO₂ in 2024 was 27% lower across London, and 54% lower in central London, than it would have been without the zone. The scheme was controversial: many outer-London residents opposed the expansion, and critics argued that the charge falls hardest on poorer people who own older cars, while the mayor argued that pollution itself hits the poorest communities hardest.
Sources: Wikipedia, “Ultra Low Emission Zone” and “Catalytic converter” (2026).
Removing pollutants and reducing exposure (level 3)
Trees, hedges and green walls can act as natural screens, trapping some particles on their leaves and shading streets. Their effect on pollution across a whole city is modest, and dense trees in narrow streets can even trap exhaust at ground level, so they work best as barriers between roads and footpaths, playgrounds or schools.
Other level 3 responses reduce people’s exposure rather than the pollution itself: air-quality alerts that warn vulnerable people to stay indoors, closing schools during severe episodes, air purifiers and health care for those affected. Delhi’s large outdoor “smog towers”, built to filter city air, treat only the air close to them, and one was reported out of action because of its high running costs.
Two cities that cut pollution
London’s Great Smog of December 1952 shows how severe coal-based pollution once was in today’s high-income cities. For five days a cold, windless high-pressure system trapped smoke and sulfur dioxide from coal fires and power stations beneath a temperature inversion. Government estimates at the time put the death toll at about 4,000; later research suggests 10,000–12,000. Parliament passed the Clean Air Act 1956, which created smoke control areas and offered households money to replace open coal fires with gas, electric or smokeless fuel. This sulfurous smog of soot and sulfuric acid is different from the photochemical smog of sunny, car-filled cities.
Beijing, China, has shown how fast air quality can improve with strong national policy. After severe smog in January 2013, when PM2.5 at some monitors approached 1,000 µg m⁻³, China adopted the Air Pollution Prevention and Control Action Plan (September 2013), which aimed to cut PM2.5 in Beijing by 25% by 2017. Beijing reduced coal’s share of its energy from 24% in 2012 to 10% in 2017, shut its four large coal-fired power stations from 2014 onwards and replaced them with gas-fired generation, closed or moved polluting factories, mills and smelters, and tightened vehicle standards.
Annual average PM2.5 fell to about 30 µg m⁻³ by 2022, and days of heavy pollution fell from 58 in 2013 to 2 in 2024.
Sources: Wikipedia, “Great Smog of London”, “Air pollution in China” and “Beijing” (2026).
Comparing strategies
Strategy | Level | Strengths | Limitations |
|---|---|---|---|
Public transport, cycling and walking | 1 | Cuts many pollutants and CO₂ at once; health benefits; serves people without cars | Expensive to build; slow to change habits; needs density to be viable |
Phasing out coal (Beijing, London) | 1 | Large, rapid falls in SO₂ and PM | Cost of new heating systems; may shift pollution to where electricity is made |
Catalytic converters and emission standards | 2 | Large cuts in CO, NOₓ and hydrocarbons per vehicle | Gains offset by more vehicles; no CO₂ reduction; cold starts; testing can be cheated |
Low emission zones (London ULEZ) | 1 and 2 | Measured falls in NO₂; speeds up fleet renewal | Costs fall on owners of older vehicles; may move traffic elsewhere |
Driving restrictions (Mexico City, Delhi) | 1 | Quick to introduce in emergencies | Easily evaded by buying second cars; little long-term effect |
Trees, green walls and screens | 3 | Local shelter for paths and schools; cooling and wellbeing | Small effect on city-wide concentrations |
Alerts, masks, purifiers, health care | 3 | Protect vulnerable people during episodes | Do not reduce emissions; unequal access |
Perspectives on managing urban air pollution
Perspective | Typical view | Preferred strategies |
|---|---|---|
Technocentric | Cleaner technology can solve the problem without changing lifestyles | Electric vehicles, catalytic converters, filters, smart traffic management |
Anthropocentric | Governments should regulate and price pollution to protect public health | Emission standards, low emission zones, congestion charges, public transport investment |
Ecocentric | The problem lies in high consumption and car-based cities | Less driving and consumption, compact walkable cities, local living, green space |
Each perspective tends to see different winners and losers. Charging older vehicles protects children breathing roadside air but costs low-income drivers and small businesses; promoting electric cars cuts exhaust but not tyre and brake dust, and benefits those who can afford new cars. Successful policies usually combine regulation with alternatives that everyone can use, such as cheap and frequent public transport.
Acid deposition
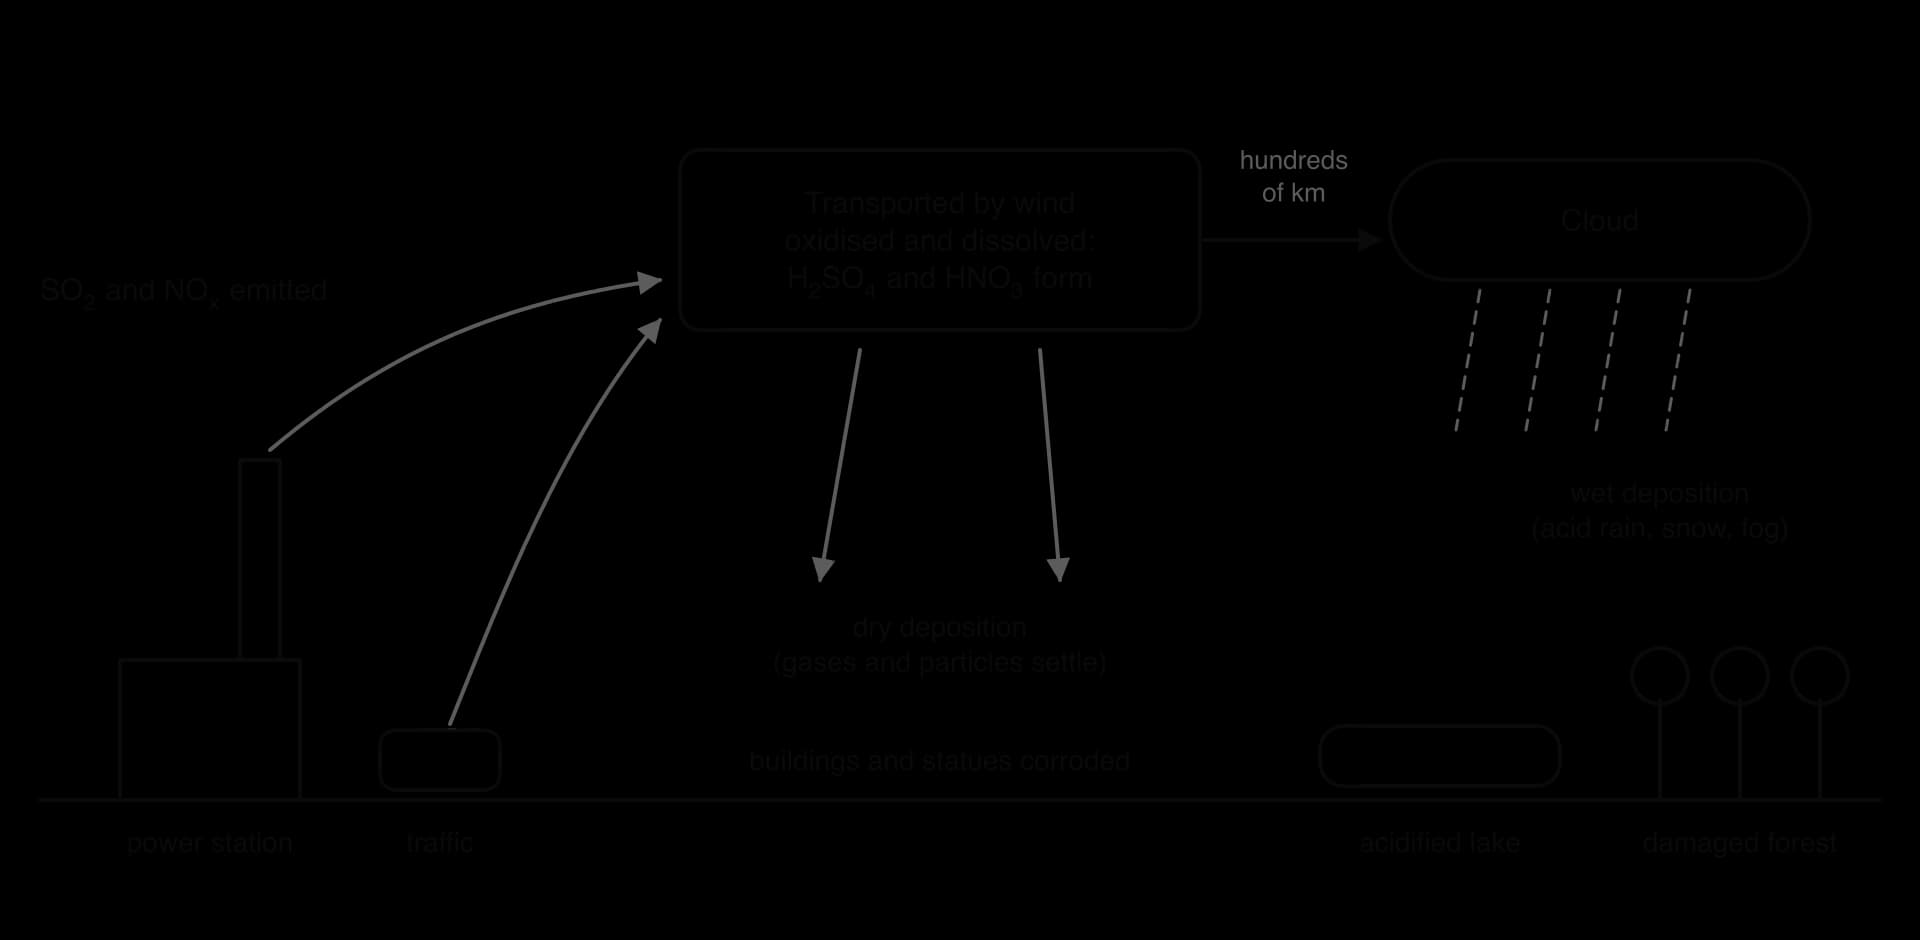
Rain is naturally slightly acidic. Carbon dioxide from the air dissolves in raindrops to form weak carbonic acid, which gives unpolluted rain a pH of about 5.6. When sulfur dioxide and nitrogen oxides are added to the air, they react with water and oxygen to form much stronger acids, sulfuric acid and nitric acid, and the rain becomes more acidic. This acid rain commonly has a pH of about 4.2–4.4.
Acids also reach the ground without rain. Gases and acidic particles settle directly onto leaves, soil, water and buildings, where they react with moisture to form acids. The general term for both routes is acid deposition. Dry deposition can account for a large share of the total, especially in dry regions and close to the source.
The chemistry of acid rain formation
Sulfuric acid forms in two steps. Sulfur dioxide is first oxidised to sulfur trioxide, which then dissolves in water. Some SO₂ also dissolves directly to form the weaker sulfurous acid.
Nitric acid forms from nitrogen dioxide, which itself forms from the nitrogen monoxide released by combustion. Nitrogen dioxide reacts with oxygen and water to give nitric acid.
These reactions take hours to days, during which winds can carry the gases hundreds of kilometres. Acid deposition is therefore a regional and transboundary problem: emissions from one country fall as acid rain in another. In the 1960s and 1970s, scientists traced the acidification of lakes in Norway and Sweden to emissions from Britain, Germany and central Europe, which led to the first international agreements on air pollution.
The effects of acid deposition
Acid deposition affects soils, vegetation, fresh water, buildings and people. Its impact depends not only on how much acid falls but also on how well the receiving environment can neutralise it. Soils and lakes on limestone or chalk contain calcium carbonate, which neutralises acid (they have a high buffering capacity). Soils and lakes on granite and other hard, acidic rocks, as in much of Scandinavia, Scotland and the Canadian Shield, cannot, so they are the most sensitive.
Terrestrial ecosystems
In acidic soil, hydrogen ions replace the calcium, magnesium and potassium ions held on clay and humus, and these nutrients are washed out of the soil by leaching. Plants then suffer nutrient deficiencies. At the same time, acid releases aluminium from soil minerals in a soluble form, which is toxic to plant roots and to soil organisms; this is called aluminium solubilisation. Acid mist and rain also damage leaves and needles directly, stripping their waxy coating and removing calcium, so trees lose their resistance to frost, drought, insects and disease.
In the “Black Triangle”, the mountainous border region of the Czech Republic, Germany and Poland, power stations and industry burned cheap local lignite (brown coal). Their sulfur dioxide and nitrogen oxides caused acid deposition that largely destroyed the forests of the Jizera Mountains by the 1980s. High-altitude forests are especially exposed because they spend long periods in acidic cloud and fog.
Freshwater ecosystems
Lakes and streams receive acid both from rain and from run-off draining through acidified soils, which also carries dissolved aluminium. As the pH falls, aquatic life declines in a predictable order. Most fish eggs fail to hatch below about pH 5, and below about pH 4 adult fish die. Aluminium damages the gills of fish so that they cannot regulate salts or take in oxygen, and mucus builds up on the gills.
Snails, crayfish, mussels and other invertebrates with calcium carbonate shells or exoskeletons cannot build them in acid water, and the loss of these species affects the fish and birds that feed on them. Acidified lakes often look very clear, because so little lives in them.
Buildings and materials
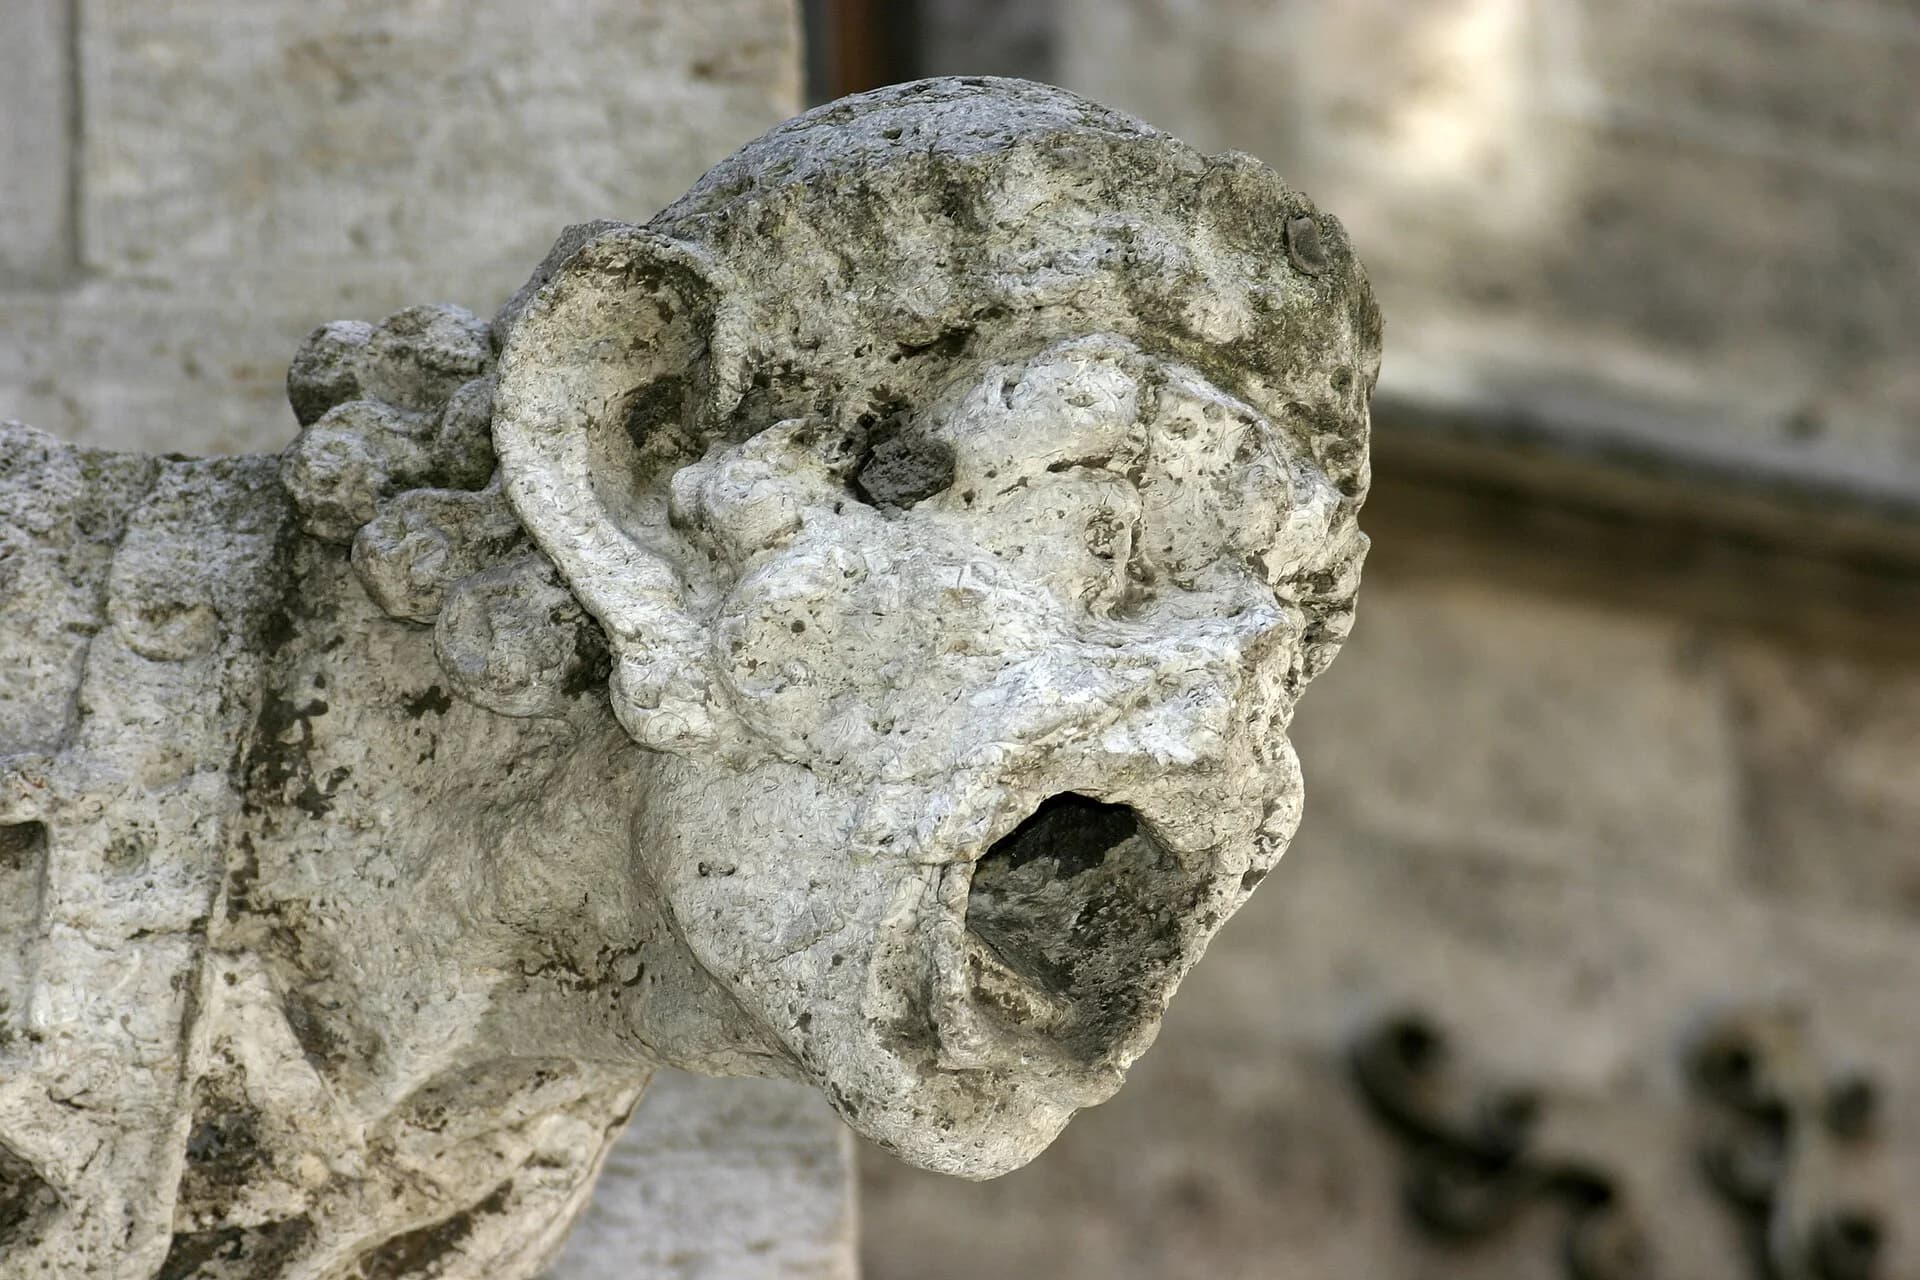
Acid deposition corrodes marble and limestone, which are both forms of calcium carbonate. The acid converts the stone into calcium sulfate (gypsum), which is more soluble and flakes off, so statues and carvings gradually lose their detail.
Acids also corrode steel in bridges and railways, damage paint, and weather historic buildings and monuments, adding large costs to maintenance.
Human health
The SO₂ and NO₂ gases irritate the airways. More importantly, the same reactions that make acid rain produce fine sulfate and nitrate particles, which form part of PM2.5 and are breathed deep into the lungs. Acid water can also dissolve metals such as aluminium, lead and copper from soils and old pipes into drinking water.
Part of the environment | Effect of acid deposition | Mechanism |
|---|---|---|
Soils | Loss of nutrients; toxic aluminium | H⁺ displaces Ca²⁺, Mg²⁺ and K⁺, which are leached; aluminium solubilised |
Forests and crops | Damaged leaves and needles; dieback | Waxy coating stripped; nutrient deficiency; aluminium toxicity in roots |
Lakes and rivers | Fish and invertebrates die | Low pH stops eggs hatching; aluminium damages gills; shells cannot form |
Buildings | Stone and metal corroded | CaCO₃ converted to gypsum, which flakes off; steel and paint attacked |
People | Respiratory illness | SO₂ and NO₂ irritate airways; sulfate and nitrate particles add to PM2.5 |
Sources: US EPA, “What is acid rain?” (2025); Wikipedia, “Acid rain” (2026).
Managing acid deposition
Applying the three-level pollution management model to acid deposition shows a clear order of effectiveness. The cheapest and most lasting solutions stop sulfur and nitrogen oxides being produced; the least effective treat acidified lakes and soils after the damage is done.
Level | Strategy | Examples |
|---|---|---|
1: change the human activity | Use less energy and switch from coal and oil to renewable energy, nuclear power or natural gas; cut vehicle use | Coal power phased out in the UK (Ratcliffe-on-Soar, the last coal-fired power station, closed on 30 September 2024); public transport |
2: control the release | Remove sulfur from fuel before burning; fit scrubbers to chimneys and catalytic converters to vehicles; cap total emissions | Flue-gas desulfurisation; US Acid Rain Program (1990); EU emission limits |
3: clean up and restore | Add lime (crushed limestone) to lakes and soils to neutralise acid; treat illness | Lake liming in Sweden (since 1976) |
Controlling releases: scrubbers and caps
A scrubber (flue-gas desulfurisation unit) removes sulfur dioxide from the gases leaving a power station chimney. In a wet scrubber, the flue gas passes through a spray of lime or limestone slurry; the calcium compounds react with SO₂ to form calcium sulfate (gypsum), which can be sold for building materials such as plasterboard. A typical scrubber on a coal-fired power station removes 95% or more of the SO₂. Scrubbers are expensive to build and run, use limestone (which must be quarried) and release some carbon dioxide in the reaction.
In the United States, Title IV of the Clean Air Act Amendments of 1990 created the Acid Rain Program. It set a national cap on SO₂ emissions from power stations, aiming to cut them by about 10 million tons (close to 50%), and let companies buy and sell permits to emit within the cap, an approach known as cap and trade, a form of emissions trading. Phase I began in 1995 with 110 of the largest power plants; Phase II covered most plants from 2000.
Companies that could cut emissions cheaply (by fitting scrubbers or switching to low-sulfur coal) sold their spare permits to others, so the target was met at a much lower cost than predicted.
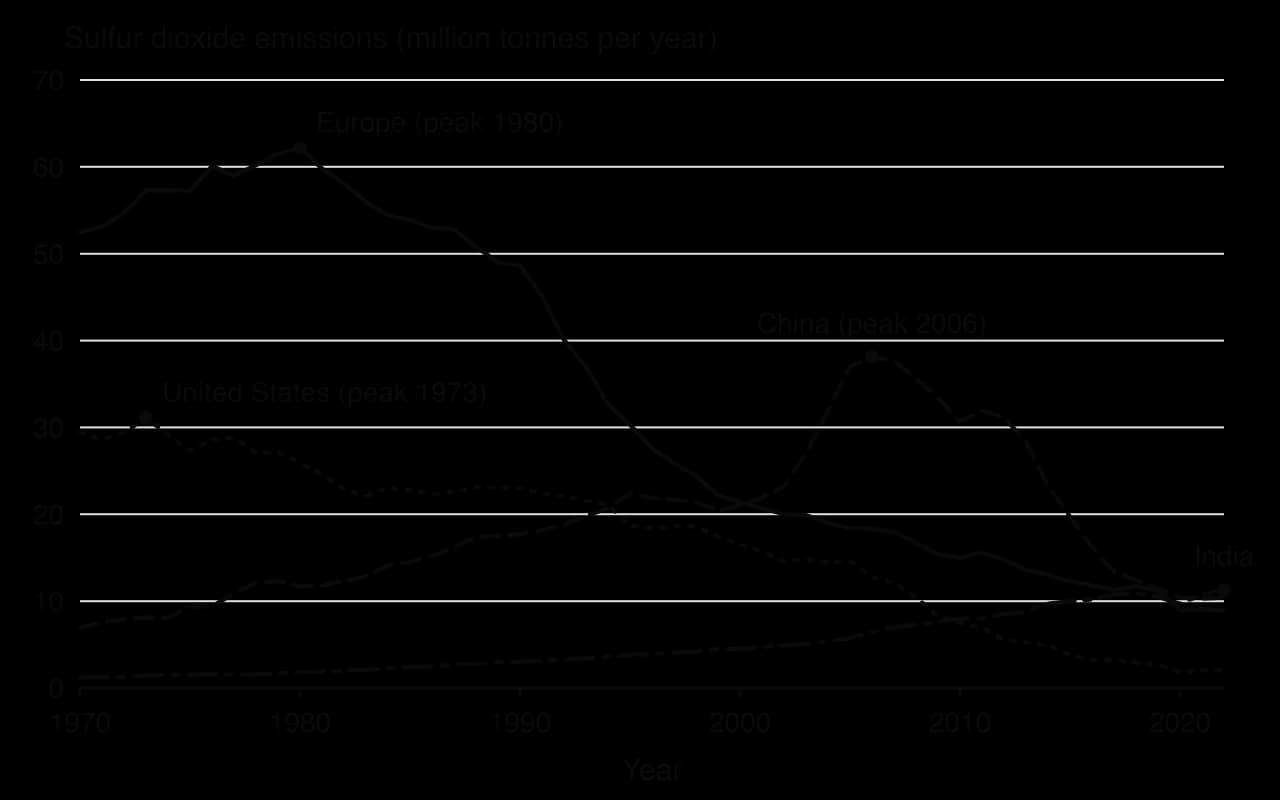
In Europe, the 1979 Convention on Long-Range Transboundary Air Pollution, agreed under the UN Economic Commission for Europe, was the first legally binding international agreement to tackle air pollution across a whole region. Its 1985 Helsinki Protocol committed countries to cut sulfur emissions, a 1988 protocol added NOₓ, and the 1999 Gothenburg Protocol covers acidification, eutrophication and ground-level ozone together. Europe’s SO₂ emissions fell by about 82% between 1990 and 2022.
Restoring damaged systems: liming
Liming means adding powdered limestone (calcium carbonate) or lime to acidified lakes, rivers or soils, often from boats, lorries or helicopters. The carbonate neutralises the acid, raises the pH and reduces the amount of toxic aluminium in solution, so fish and invertebrates can return. Sweden began liming acidified lakes and rivers in 1976, and by the 1990s nearly 8,000 surface waters were being limed. Liming is a level 3 strategy: it treats the symptoms, it must be repeated regularly for as long as acid keeps arriving, and it is impractical over whole regions of forest and wilderness. As acid deposition has fallen, Sweden now limes fewer waters than before.
 YouTube
Sources: Wikipedia, “Acid rain”, “Acid Rain Program” and “Convention on Long-Range Transboundary Air Pollution” (2026); Hoesly et al. (2024), CEDS, via Our World in Data; Swedish University of Agricultural Sciences, IKEU liming programme (2025).
Case study: air pollution in Mexico City and its management
Context
Mexico City lies in the Valley of Mexico, a high basin on the Trans-Mexican Volcanic Belt. The city centre is at about 2,240 m above sea level, the valley floor at about 2,200 m, and the surrounding mountains and volcanoes rise above 5,000 m. The basin has no natural outlet for its rivers, and on calm days it has little outlet for its air either. The 2020 census counted about 9.2 million people in the city itself and about 21.8 million in Greater Mexico City.
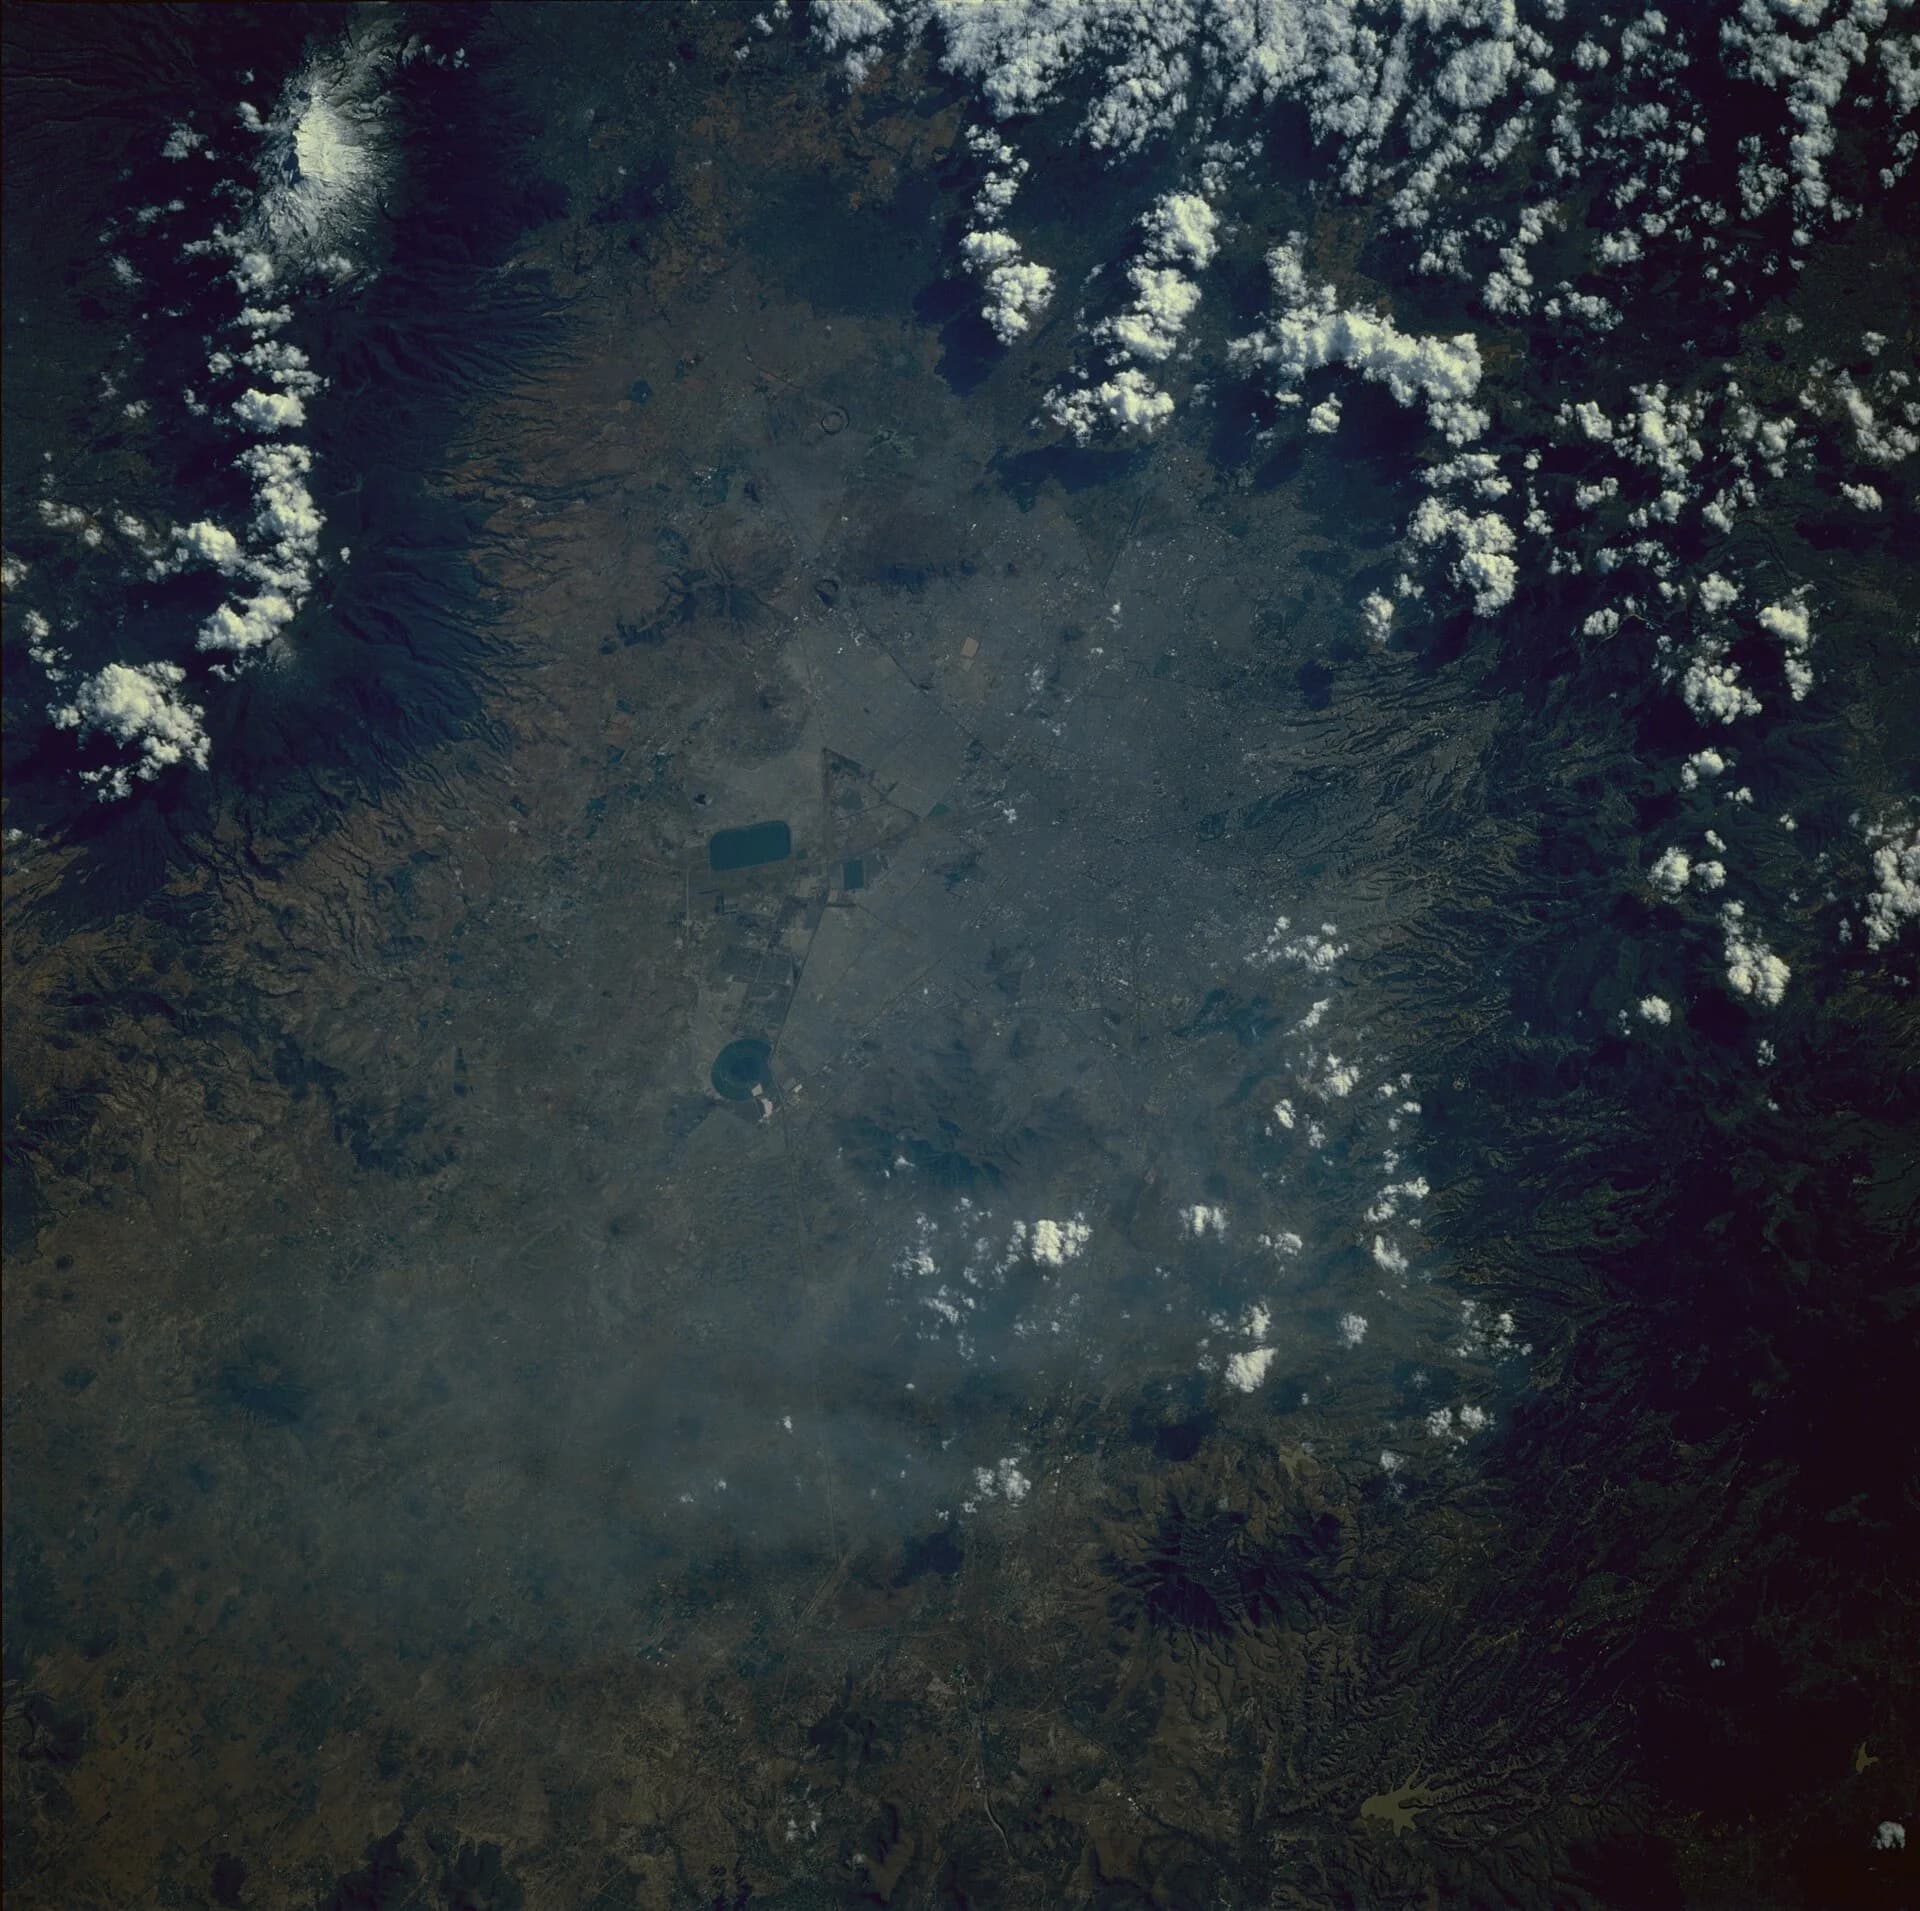
Three features of this system make it unusually prone to pollution. The mountains block winds that would carry pollutants away. Its tropical latitude and high altitude give it strong sunshine all year, which drives the chemical reactions that form ozone. At this altitude each litre of air also contains less oxygen than at sea level, so fuel burns less completely in engines and produces more carbon monoxide and hydrocarbons.
What happened
Rapid industrial growth and a booming vehicle fleet made Mexico City one of the most polluted cities in the world by the late 1980s. Cars and light trucks rose from 124 to 267 per 1,000 residents between 1980 and 2010, and the vehicle fleet roughly doubled between 1992 and 2012. Leaded petrol, old vehicles without catalytic converters, a large oil refinery and thousands of factories added lead, carbon monoxide, sulfur dioxide, nitrogen oxides, hydrocarbons and particulates to the basin air. In 1992 the United Nations named Mexico City the most polluted city on the planet.
The most persistent problem has been ozone, a secondary pollutant formed in the strong sunshine from vehicle emissions. Historically, ozone exceeded the air-quality standard on more than 90% of days, and on 40–50 days a year it peaked above 300 parts per billion, about three times the standard. Particulate matter remains a serious problem as well.
Data
Indicator | Value |
|---|---|
Altitude of the city | About 2,240 m, in a mountain basin |
Population (2020 census) | About 9.2 million (city); about 21.8 million (Greater Mexico City) |
Cars and light trucks per 1,000 residents | 124 (1980); 267 (2010) |
Days with ozone above the standard (historically) | More than 90% of days |
Days rated poor because of ozone | 37% (2015); 35% (2016); 35% (2017) |
SO₂ and NO₂ by 2014 | About a third of their 1992 levels |
PM2.5 in the May 2019 emergency | 150–160 µg m⁻³ (WHO annual guideline: 5 µg m⁻³) |
Premature deaths from PM2.5 in the city | About 6,700 a year |
Average PM2.5 exposure, Mexico as a whole (2024) | 18.3 µg m⁻³ |
Sources: Wikipedia, “Air pollution in Mexico City” and “Mexico City” (2026); SatPM via Our World in Data (2026).
Management and responses
The city and federal governments responded with a series of programmes that act at all three levels of the pollution management model.
Hoy No Circula (“Today it does not drive”), 1989: each car is banned from driving on one weekday, depending on the last digit of its number plate, which at first took about a fifth of cars off the road each weekday. Since 2008 older, more polluting cars are also restricted on some Saturdays, while new and clean cars are exempt (level 1).
The Comprehensive Programme Against Air Pollution (PICCA), 1990: removed lead from petrol and required catalytic converters on new cars (level 2).
Closure of the Azcapotzalco oil refinery, 1991: in March 1991 the federal government ordered the state oil company Pemex to close its large refinery inside the city, which had been fined for excessive pollution (level 1).
ProAire programmes from 1995 (now ProAire IV): cleaner fuels, twice-yearly vehicle emission inspections, controls on industry and reformulated petrol and diesel (level 2).
Public transport and cycling: the Metrobús bus rapid transit system, whose first line opened in June 2005 and replaced 372 older buses and minibuses with 212 articulated buses, cutting journey times along the corridor by up to half; and the Ecobici bike-share scheme (level 1).
Environmental contingencies: when ozone or PM2.5 reaches dangerous levels, as in April–May 2016 and May 2019, the city restricts more vehicles, cuts industrial activity, changes school hours or closes schools, and advises people to stay indoors (level 3).
Evaluation
Some measures worked well. Removing lead from petrol and requiring catalytic converters cut lead and carbon monoxide dramatically, and by 2014 sulfur dioxide and nitrogen dioxide were about a third of their 1992 levels. Ozone once exceeded the standard on more than 90% of days; in 2015–2017 it made the air poor on about 35–37% of days (the two measures are not identical, but both show improvement). Metrobús showed that bus rapid transit could carry very large numbers of people quickly and cleanly.
Hoy No Circula is the classic example of a policy that people found ways around. Carbon monoxide fell at first, but many households then bought a second car, often an older, more polluting one, so they could drive every day. A 2008 study found no evidence that the restrictions had improved air quality, and the number of vehicles in circulation rose. The rule also falls unevenly: wealthier households can afford a second car or a new exempt one, while poorer drivers with old cars lose a day of travel.
Mexico City is still the most ozone-polluted part of the country, PM2.5 exceeds Mexico’s own standards, and PM2.5 is linked to about 6,700 premature deaths a year. Children, older people and those with existing lung disease are most at risk. The city shows that level 2 technical controls on fuels and vehicles can achieve large, measurable gains, but that continued growth in the number of vehicles offsets them unless level 1 changes, such as public transport that people prefer to driving, reduce the activity itself.
Group | Perspective on the measures |
|---|---|
City and federal governments | Must protect health without harming economic growth; prefer technical controls and emergency powers |
Car owners | Driving bans are inconvenient; wealthier owners avoid them by buying second or newer cars |
Low-income residents and workers | Depend on public transport and are hit by bans on older vehicles; often live and work near busy roads and industry |
Health researchers and doctors | PM2.5 and ozone still cause thousands of deaths a year; want stricter standards closer to WHO guidelines |
Fuel suppliers and industry | Bear the costs of cleaner fuels and emission controls |
What it shows
Mexico City shows that urban air pollution depends on the interaction of human inputs (vehicles, industry, fuel quality) with the physical system that receives them (a basin, high altitude and intense sunshine). It shows primary pollutants from fossil-fuel combustion being transformed into the secondary pollutant ozone, and how management at levels 1, 2 and 3 can be compared using data. It also shows that policies are judged by how people respond to them, and that their costs and benefits fall unevenly.
Sources: Wikipedia, “Air pollution in Mexico City”, “Hoy No Circula”, “Road space rationing” and “Mexico City Metrobús” (2026); Oil & Gas Journal (1991).
Photochemical smog (HL only)
“Smog” was first used for the mixture of smoke and fog that filled coal-burning cities such as London. A different kind of smog appears in sunny cities with heavy traffic, such as Los Angeles, Mexico City, Santiago and many Asian cities: a brownish haze that is worst on hot, still afternoons. This photochemical smog is not emitted by any chimney or exhaust. It is a mixture of secondary pollutants formed when sunlight acts on primary pollutants from vehicles and industry.
The primary pollutants: NOₓ and VOCs
Two groups of primary pollutants are needed. Nitrogen oxides come mainly from vehicle exhausts and power stations. Volatile organic compounds (VOCs) are carbon-based chemicals that evaporate easily: unburned fuel from exhausts and petrol stations, solvents in paints, glues and cleaning products, and some natural emissions from vegetation.
How sunlight makes ozone
The key step is the splitting of nitrogen dioxide by sunlight (photolysis). Ultraviolet light breaks an NO₂ molecule into nitrogen monoxide and a single, very reactive oxygen atom. The oxygen atom immediately joins an oxygen molecule to form ozone.
In clean air, ozone does not build up, because it reacts with the NO that was just produced and turns back into NO₂ and oxygen. The cycle is balanced, and ozone stays at a low background level.
VOCs break this balance. In sunlight they are broken down into reactive fragments (radicals) that convert NO back into NO₂ without using up ozone. With NO removed by another route, the ozone is not destroyed, and each cycle of photolysis adds more. Ozone therefore accumulates through the sunny part of the day. The same VOC fragments also combine with NO₂ to form peroxyacyl nitrates (PANs), the second main component of photochemical smog, along with irritant aldehydes such as formaldehyde.
PANs are stable in cold air, so they can carry nitrogen oxides long distances away from cities before breaking down in warmer air and releasing NO₂, which then forms ozone in rural areas. This is one reason why ozone concentrations are often higher in the countryside downwind of a city than in the city centre, where fresh NO from traffic removes ozone.
The daily cycle of smog
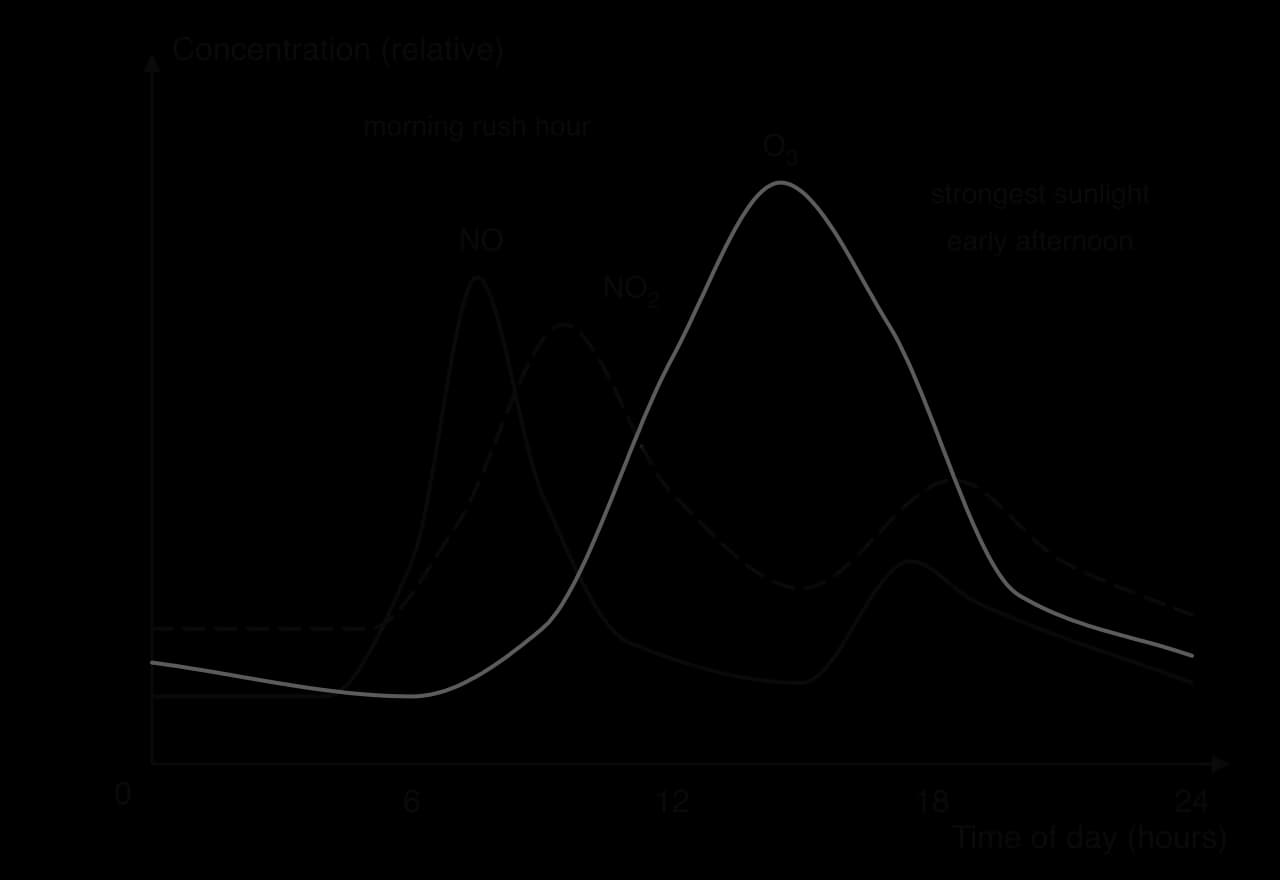
Concentrations of the smog ingredients follow a typical pattern on a sunny day. NO rises sharply during the morning rush hour as traffic emits it. Over the next few hours it is oxidised to NO₂, so NO₂ peaks later in the morning. As sunlight grows stronger, NO₂ is split and ozone builds up, peaking in the early to mid afternoon. In the evening, sunlight fades, ozone formation stops, and fresh NO from the evening rush hour reacts with the remaining ozone, so ozone falls overnight.
Photochemical smog and sulfurous smog compared
Feature | Sulfurous (“London-type”) smog | Photochemical (“Los Angeles-type”) smog |
|---|---|---|
Main primary pollutants | Smoke (soot) and SO₂ from burning coal | NOₓ and VOCs, mainly from vehicles |
Main harmful components | Soot particles, SO₂ and sulfuric acid droplets | Tropospheric ozone, PANs, aldehydes, fine particles |
Conditions | Cold, damp, still winter weather; fog | Warm, sunny, dry, still weather; strong sunlight |
Time of worst pollution | Winter, mornings and nights | Summer, early to mid afternoon |
Classic example | London, December 1952 | Los Angeles from the 1940s; Mexico City |
In Los Angeles, a sudden, severe smog on 26 July 1943 alarmed residents. In the late 1940s and early 1950s the chemist Arie Haagen-Smit identified ozone in Los Angeles smog and showed that it formed from nitrogen oxides and hydrocarbons from vehicles and refineries in sunlight. This led to strict controls on vehicle and industrial emissions in California. Between 1962 and 2012, VOC concentrations in Los Angeles fell by a factor of about 50, and nitrogen oxides and ozone by 70–80%, even though the population and number of vehicles grew.
Sources: Wikipedia, “Photochemical smog” and “Peroxyacetyl nitrate” (2026).
Weather, landforms and temperature inversions (HL only)
The same emissions can produce clean air on one day and dangerous smog on another. The difference is the weather and the shape of the land, which control how fast pollutants are diluted and how quickly they react. Three factors intensify photochemical smog:
Abundant insolation: strong sunshine drives photolysis of NO₂ and the formation of ozone. Smog is worst in summer, at low latitudes and at high altitude.
Reduced wind: still air does not carry pollutants away, so emissions accumulate where they are released. High-pressure systems, with sinking air and light winds, are the usual cause.
Temperature inversions: a layer of warm air above cooler air prevents pollutants rising and mixing into the atmosphere above.
How temperature inversions form
Normally, air temperature falls with height in the lowest part of the atmosphere, because the ground is heated by the Sun and warms the air above it. Air near the ground, warmed and polluted, is less dense than the cooler air above, so it rises, carrying pollutants upwards where they mix into a deep layer and are diluted. A temperature inversion reverses this pattern: for some distance above the ground, temperature increases with height. Cool, dense air near the surface lies beneath warmer, lighter air and cannot rise through it, so the warm layer acts like a lid.

Inversions form in several ways:
Radiation inversions: on clear, calm nights the ground loses heat rapidly by radiation, and the air in contact with it cools. Cold air ends up beneath warmer air. These inversions are common in winter and usually break up when the Sun warms the ground the next morning, unless the sunshine is weak.
Subsidence inversions: in a high-pressure system, air sinks over a wide area and warms as it is compressed. A layer of warm, sinking air forms above cooler surface air. These can persist for days, as over Los Angeles, where air sinking in the subtropical high-pressure belt overlies cool air drawn in from the Pacific Ocean.
Valley and basin inversions: at night, cold, dense air drains down slopes and collects in valley floors and basins, beneath warmer air on the slopes above.
Topography makes inversions worse. Cities in valleys and basins surrounded by mountains, such as Mexico City, Los Angeles, Santiago and Almaty, are enclosed on several sides, so even light winds cannot flush the air out horizontally, and cold air collects in them at night. High buildings in dense city centres have a similar effect at street level, creating “street canyons” where traffic emissions are trapped between tall walls. When an inversion, still air and strong sunshine coincide over a basin full of traffic, the result is a severe photochemical smog episode.
 YouTube
Impacts of tropospheric ozone and their costs (HL only)
Ozone is a powerful oxidising agent: it reacts readily with many substances, including the molecules of living cells, rubber and dyes. Its direct impacts are therefore both biological and physical.
Direct biological impacts
Plants: ozone enters leaves through their stomata and damages cell membranes and the waxy cuticle, causing visible spots and bleaching and reducing photosynthesis and growth. Crops such as wheat and soybeans give lower yields, and forest trees grow more slowly and become more vulnerable to drought, pests and disease. A 2012 Canadian assessment estimated smog damage to selected crops in Ontario alone at about $201 million a year.
Humans and other mammals: ozone and PANs irritate the eyes, nose and throat and cause coughing and chest discomfort. Ozone reduces lung function, inflames the airways and triggers asthma attacks, and repeated exposure increases susceptibility to respiratory infections. Hospital admissions and deaths from respiratory disease rise on high-ozone days. Children, older people and people with asthma or other lung disease are most at risk.
Direct physical impacts
Ozone attacks the chemical double bonds in natural rubber and some synthetic rubbers, causing cracks that grow over time. Tyres, seals, hoses and electrical insulation therefore deteriorate faster in polluted air unless they are made from ozone-resistant materials. Ozone also fades some dyes and weakens fibres in fabrics, paints and plastics, adding to maintenance and replacement costs.
Is tropospheric ozone also a greenhouse gas?
Yes. Tropospheric ozone is a greenhouse gas: it absorbs infrared radiation and, by its effect on radiative forcing, is the third most important greenhouse gas after carbon dioxide and methane. Its concentration has risen since the industrial revolution. Reducing NOₓ and VOC emissions therefore helps the climate as well as health.
Indirect impacts: social and economic costs
Ill health from air pollution has wider effects on societies and economies. People who are ill need treatment, which increases the burden on hospitals and health budgets. Workers who are ill, or who look after sick children, lose days of work, so economic output falls. Children miss school, and long-term exposure reduces life expectancy. Crops, forests and materials damaged by ozone also impose costs.
Estimates of the death toll vary with the method used: the World Bank puts deaths from outdoor PM2.5 at more than 5.7 million a year, higher than the WHO’s figure of 4.2 million for 2019, and estimates the economic costs at close to 5% of global GDP.
These costs fall unequally. The WHO estimates that 89% of the premature deaths from outdoor air pollution occur in low- and middle-income countries.
Within cities, poorer communities are often more exposed: housing near main roads, industrial zones, waste sites and ports is cheaper, outdoor workers such as street vendors, traffic police and construction workers breathe polluted air all day, and households that burn wood, dung or waste for cooking add indoor pollution. Poorer people also have less access to health care, air purifiers or the option of moving away. Those who suffer most are often those who drive least and emit least, which makes urban air pollution a question of environmental justice.
Group | Why exposure or harm is greater |
|---|---|
Low-income residents | Housing near busy roads, industry and waste sites; less access to health care |
Outdoor workers | Long hours outside at street level, often during peak traffic |
Children | Breathe more air for their body size; developing lungs; time outdoors |
Older people and those with lung or heart disease | Less able to cope with additional stress on lungs and heart |
People in low- and middle-income countries | Higher pollution levels and weaker regulation and health systems |
The HL lenses add further angles. Legally, clean air acts and emission standards (the UK Clean Air Act 1956, the US Clean Air Act, the EU’s air quality limits) turn air quality into an enforceable right or duty. Economically, air pollution is an externality: drivers and industries do not pay the health costs they impose on others, which justifies charges such as London’s ULEZ under the polluter-pays principle. Ethically, it raises questions of justice when the costs fall on people who did not create the pollution and have little say in decisions about it.
Sources: WHO (2024); World Bank, “Pollution” (2025); Wikipedia, “Tropospheric ozone”, “Ozone cracking” and “Photochemical smog” (2026).
Exam practice
Questions on urban air pollution range from short definitions and explanations (primary and secondary pollutants, PM2.5 and PM10, the chemistry of acid rain), data questions (air-quality data, emission trends, pH), Paper 1 resources about a named city, and essays on managing pollution with the three-level model. HL questions add photochemical smog, inversions and the costs of ozone.
Paper 2 Section A-style questions
Questions on acid deposition often combine chemistry with its effects on a named part of the environment.
Paper 1-style data question
The table shows annual mean concentrations at a monitoring station in a city centre (hypothetical data).
Year | SO₂ (µg m⁻³) | NO₂ (µg m⁻³) | PM2.5 (µg m⁻³) |
|---|---|---|---|
2005 | 42 | 58 | 61 |
2010 | 25 | 55 | 52 |
2015 | 11 | 49 | 40 |
2020 | 6 | 41 | 33 |
Paper 2 Section B-style essay
HL questions
Inversions are best explained with a labelled sketch of temperature against height.
Summary
Urban air pollution comes from human inputs to the atmosphere, mainly NOₓ, SO₂, CO and particulate matter; PM10 is ≤ 10 µm and PM2.5 ≤ 2.5 µm, and PM2.5 is the most harmful.
Primary pollutants are harmful as emitted; their sources are natural (fires, dust, volcanoes) and anthropogenic (fossil fuels, biomass and crop burning, construction dust).
Most urban pollutants come directly or indirectly from fossil-fuel combustion; tropospheric ozone is a secondary pollutant formed from NOₓ and VOCs in sunlight.
Lichens are indicator species of air pollution: shrubby and leafy forms disappear first, crusty forms are most tolerant.
Strategies range from public transport, cycling and fuel switching (level 1) through catalytic converters and low emission zones (level 2) to screens, alerts and health care (level 3).
SO₂ and NOₓ react with water and oxygen to form sulfuric and nitric acid, reaching the ground as wet or dry acid deposition, often far from the source.
Acid deposition leaches soil nutrients, releases toxic aluminium, damages forests, kills fish and invertebrates, corrodes limestone and steel, and adds to PM2.5.
Acid deposition is managed by fuel switching, scrubbers, catalytic converters and emission caps, and by liming lakes; between 1990 and 2022 SO₂ emissions fell by about 82% in Europe and 91% in the US.
Mexico City shows a basin city where technical controls cut lead, CO and SO₂ greatly but driving bans were evaded and ozone and PM2.5 remain high.
Photochemical smog forms when sunlight splits NO₂ and VOCs prevent ozone being removed, producing ozone and PANs that peak in the afternoon. (HL)
Strong sunshine, light winds and temperature inversions, especially in basins and valleys, intensify smog by trapping pollutants near the ground. (HL)
Tropospheric ozone damages plants, eyes, lungs, rubber and fabrics; its indirect costs in health care and lost work fall most heavily on poorer communities. (HL)
Self-check
- To do:
I can name the main urban air pollutants and distinguish PM2.5 from PM10.
- To do:
I can distinguish natural and anthropogenic sources, and primary and secondary pollutants, with examples.
- To do:
I can explain why most urban air pollutants come from fossil-fuel combustion.
- To do:
I can plan an investigation using lichens as indicator species.
- To do:
I can evaluate strategies to reduce urban air pollution at three levels, with named examples.
- To do:
I can write the equations for the formation of sulfuric and nitric acid and distinguish wet and dry deposition.
- To do:
I can describe the effects of acid deposition on soils, forests, lakes, buildings and health.
- To do:
I can evaluate the management of acid deposition using data.
- To do:
I can use Mexico City to evaluate the management of urban air pollution.
- To do:
I can explain how photochemical smog forms and interpret a diurnal pollutant graph. (HL)
- To do:
I can explain how temperature inversions form and intensify smog. (HL)
- To do:
I can outline the direct and indirect impacts of tropospheric ozone and who bears them. (HL)