12 Data analysis and interpretation
How psychologists represent, summarise and interpret quantitative and qualitative data, how the four subtopics fit together, and how the topic is studied at SL and assessed at HL.
- IB Psychology
- HL only
What 12 covers
From the subject guide: what you need to know and be able to do.
HL extension, examined in paper 3: reading graphs and tables, statistics and thematic analysis. SL students study it but are not examined on it.
4 subtopics in Data analysis and interpretation
Each one has its own page once something is published for it.
- 12.1Tables, graphs and distributionsnotes
- 12.2Descriptive statisticsnotes
- 12.3Inferential statisticsnotes
- 12.4Thematic analysisnotes
Key terms introduced here
Each is in the Psychology glossary, with every other term in the subject.
- Data analysis
The process of organising, summarising, displaying and interpreting research data, with tables, graphs, statistics or thematic analysis, to find patterns and judge what conclusions the data supports.
An overview of 12 Data analysis and interpretation
Data analysis and interpretation is about what happens after research data has been collected: how numbers are displayed and summarised, how researchers decide whether a pattern is more than chance, and how patterns of meaning are drawn out of interviews and other texts. It turns the raw results of studies into evidence that can support, weaken or qualify a claim about behaviour.
Every other part of the course relies on these skills. Each study of conformity, memory, attachment or depression ends in a table, a graph, a set of statistics or a list of themes, and evaluating that study means judging whether the conclusion follows from them.
Questions the topic answers
How should data be represented so that it shows the pattern honestly, given the design of the study and the type of data collected?
What is a typical score, how much do scores vary, and how large is a difference or a relationship?
How likely is it that a difference or correlation found in a sample is due to chance, and what does “statistically significant” really mean?
How can recurring patterns of meaning be found in interviews, focus groups and other texts in a systematic and credible way?
How far do the data, taken together, support a particular claim, and what limits that support?
The subtopics
Subtopic | What it covers |
|---|---|
12.1 Tables, graphs and distributions | Frequency tables, bar graphs, histograms, line graphs, scatterplots and box-and-whisker plots; normal, skewed and bimodal distributions; outliers; what limits the interpretation of a graph (truncated axes, missing spread, measures that do not match a claim). |
12.2 Descriptive statistics | The mean, median and mode; the range, interquartile range and standard deviation; percentages and proportions; the correlation coefficient and r²; analysing a source and stating a conclusion linked to its findings. |
12.3 Inferential statistics | Null and alternative hypotheses, p-values and significance levels, type I and type II errors, statistical power, statistical versus practical significance, and why many published findings have failed to replicate. |
12.4 Thematic analysis | The stages of thematic analysis used to find patterns of meaning in textual data and group them into themes relevant to the research aim, with the credibility, bias and transferability of qualitative findings. |
How the subtopics connect
The four subtopics follow the two kinds of data that research produces. Quantitative data is first displayed (12.1), then summarised (12.2), and then tested to judge whether the pattern is likely to be real (12.3). Qualitative data is analysed by coding and grouping meanings into themes (12.4). Both routes end in the same place: a judgement about how well the evidence supports a conclusion.
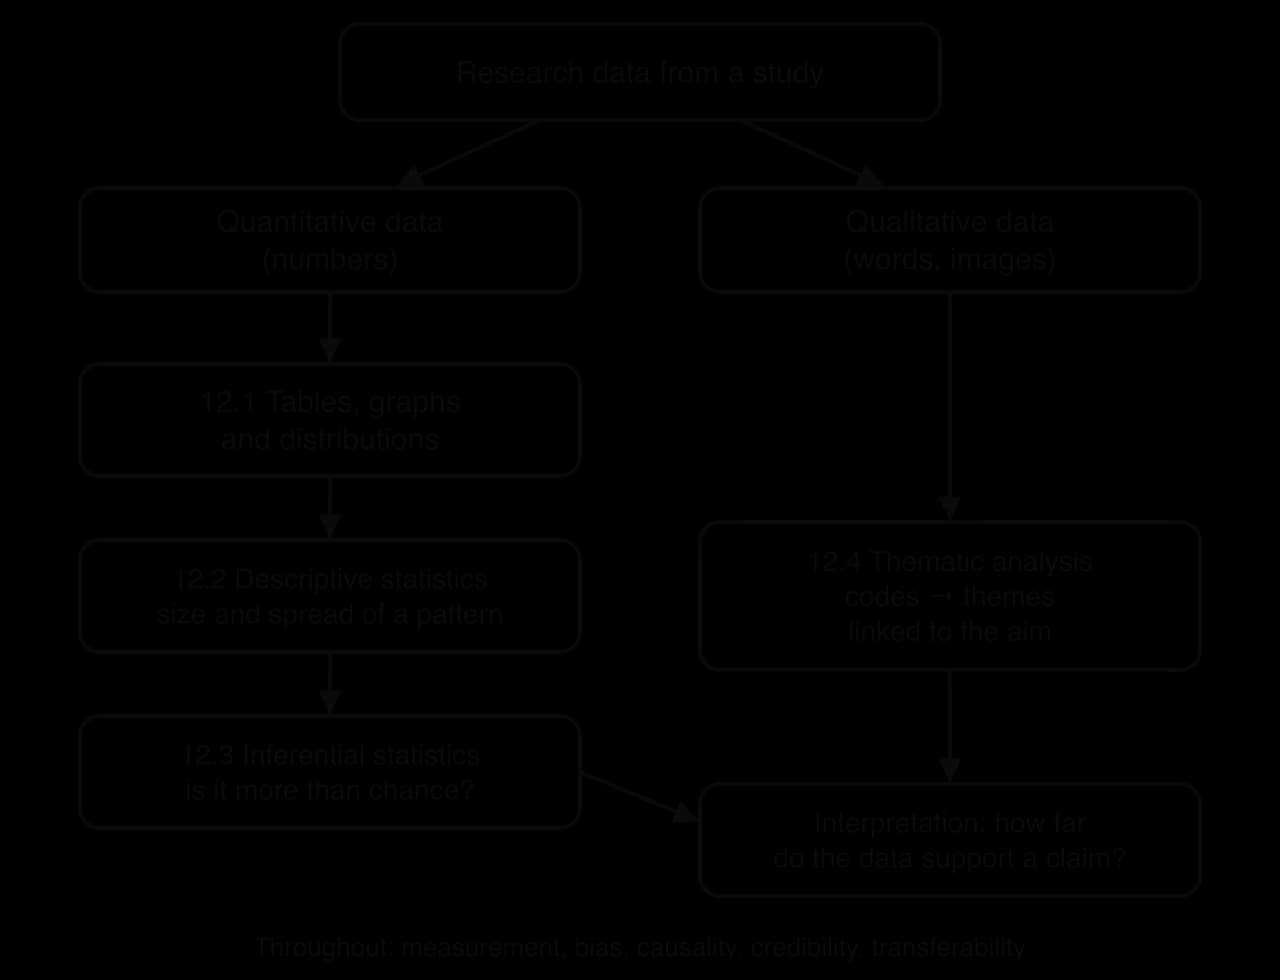
The routes also meet in practice. A mixed-methods study may report a bar graph of questionnaire means alongside themes from interviews, and qualitative codes can be counted and displayed in a frequency table. Reading a source well usually means using several subtopics at once: checking a graph’s axes (12.1), comparing means and standard deviations (12.2), reading a p-value (12.3) and asking how themes were produced (12.4).
Links to the concepts and the rest of the course
Data analysis is where the six concepts become practical questions about evidence. Measurement asks what a graph or statistic actually captured; bias asks which choices of display, analysis and reporting shaped the result; causality asks whether the design allows a causal reading. Perspective appears when averages for whole groups hide the experiences of individuals and cultures, responsibility when sensitive findings are presented to the public, and change when trends over time are interpreted.
Part of the course | How it connects to data analysis |
|---|---|
Research methodology | Research methods, sampling techniques and research considerations decide what data a study produces and what can be concluded from it. Credibility, generalisability and transferability are judged partly from the analysis. |
Class practicals | Each practical produces data: experiments and questionnaires usually quantitative, interviews and observations often qualitative, so each practical is a chance to display, summarise and interpret real data. |
Approaches and contexts | Every study used as evidence in the biological, cognitive and sociocultural approaches, and in the four contexts, reports its results through these tools. |
Culture, motivation and technology | The other HL extensions supply the claims that data is used to test, such as whether technology use harms well-being or whether culture shapes help-seeking, and each has its own research challenges. |
How SL and HL differ
Data analysis and interpretation is part of the HL extension. The syllabus states that SL students study it as well, because the same tools are needed to understand any research study, to evaluate the unseen study in Paper 2 and to plan the data collection in the internal assessment. However, it is assessed only at HL, so SL students are never examined directly on topic 12.
HL students study the topic in depth, alongside the culture, motivation and technology extensions, and are assessed on it in Paper 3. HL students should know the research methodology terms of topic 5 thoroughly, because Paper 3 sources draw on them, and they should be able to interpret both quantitative and qualitative data from experimental and non-experimental studies.
Assessment
Topic 12 is assessed in Paper 3 (HL only). The paper presents a resource booklet of several sources, quantitative and qualitative, built around a claim about the role of culture, motivation or technology in one of the four contexts. The data may be real or created for the examination. Its four questions map directly onto the subtopics:
Question | What it asks | Main subtopics |
|---|---|---|
Question 1 (3 marks) | Explain one issue that limits the interpretation of the data in a source. | 12.1, 12.2 |
Question 2 (6 marks) | Analyse the findings of a source and state a conclusion linked to the claim. | 12.2, 12.3 |
Question 3 (6 marks) | Discuss how a qualitative researcher could improve credibility or avoid bias, or to what extent findings are transferable. | 12.4 |
Question 4 (15 marks) | Use at least three sources and own knowledge to discuss the extent to which the claim is valid. | All four, with the HL extension |
The related terms of this topic, such as bar graph, box-and-whisker plot, distribution, histogram, outlier, scatterplot, descriptive and inferential statistics, correlation coefficient and thematic analysis, may appear in the wording of Paper 3 questions. Students interpret and analyse given results; they are not asked to carry out long calculations.
Carry on with 12 in Augment
With a free account, Augment remembers where you stopped and what you have practiced.