Notes on 12.4 Thematic analysis
Learning objectives
Explain what thematic analysis is and how it differs from content analysis and from quantitative analysis.
Describe the six phases of thematic analysis proposed by Braun and Clarke.
Explain the difference between codes and themes, inductive and deductive coding, and semantic and latent themes.
Apply thematic analysis to a short qualitative extract, from initial codes to named themes.
Discuss how researchers can improve the credibility of qualitative findings and avoid bias.
Discuss the extent to which qualitative findings are transferable to other populations or contexts.
Evaluate thematic analysis with reference to bias, measurement and perspective.
Introduction
Thematic analysis is a method for finding, organising and interpreting patterns of meaning in qualitative data, such as interview transcripts, focus-group discussions or written answers. It is the most widely used way of analysing what people say about their experiences, from how adolescents talk about social media to how families make sense of a diagnosis.
Thematic analysis is the qualitative counterpart of inferential statistics: both are ways of turning raw data into a conclusion that answers a research question. Because the analyst’s judgement shapes every step, thematic analysis raises questions of bias and perspective, and judging its quality needs criteria such as credibility and transferability rather than statistical significance.
Qualitative data and why it needs its own method of analysis
Qualitative data are non-numerical: words, images or observations that describe what people think, feel and do. They come mainly from semi-structured interviews, focus groups, open questions in questionnaires, diaries and written documents. Such data are rich, but also bulky: a single one-hour interview produces a transcript of perhaps 8,000–10,000 words, and a study of fifteen interviews can produce well over 100,000.
Quantitative data can be summarised by a mean and tested with a p-value. Qualitative data cannot be averaged, so a different procedure is needed to reduce them to something that answers the research question while keeping the meaning that made them worth collecting. Without a systematic method, a researcher might simply pick the quotations that fit what they already believed, a form of confirmation bias.
Thematic analysis became the standard approach in psychology after Virginia Braun and Victoria Clarke published “Using thematic analysis in psychology” in 2006. They argued that many researchers already used something like it without describing what they did, and they set out a clear, flexible procedure in six phases. The paper became one of the most cited articles in the social sciences.
A key strength of the method is that it is not tied to one theory. It can be used to describe participants’ experiences in their own terms, to test how an existing theory applies, or to examine the social ideas that shape how people talk. This flexibility makes it accessible to new researchers, but it also means that researchers must state which version they used and why.
Thematic analysis compared with related methods
Several other methods analyse qualitative data, and their names are easily confused. Content analysis usually converts qualitative material into numbers by counting how often categories occur, for example how many newspaper articles about mental illness use the word “dangerous”. Thematic analysis is interested in meaning rather than frequency: a theme can be important even if few participants express it, if it says something central about the research question.
Inductive content analysis sits between the two. Like thematic analysis, it builds categories from the data rather than deciding them in advance: the researcher reads the material, codes it openly, groups the codes and abstracts them into broader categories. It is often reported with counts of how many participants or extracts fall into each category, which brings it closer to content analysis.
Method | Main aim | Where categories come from | Typical output |
|---|---|---|---|
Content analysis | Describe how often features occur | Usually a coding scheme decided in advance | Frequencies and percentages of categories |
Inductive content analysis | Describe and organise the content of the data | Developed from the data | Categories and subcategories, often with counts |
Thematic analysis | Identify and interpret patterns of meaning | From the data, a theory, or both | A small number of themes with extracts and interpretation |
Grounded theory | Build a new theory explaining a process | From the data, with sampling guided by the emerging theory | A theoretical model of the process |
Grounded theory, developed by Barney Glaser and Anselm Strauss in 1967, is a fully inductive approach whose aim is to generate theory. Data collection and analysis alternate: early interviews are coded, the emerging ideas decide whom to interview next, and the process continues until new data add nothing new. Thematic analysis borrows many of its coding techniques but does not have to produce a theory, which makes it easier to use with an existing data set.
 YouTube
Codes and themes: the building blocks
Thematic analysis works with two units. A code is a short label attached to a segment of data that captures one feature relevant to the research question. A theme is a larger pattern of shared meaning built from several codes.
A single sentence can carry several codes. If a student says, “I can’t sleep because I’m counting how many days are left”, it could be coded as “sleep disrupted”, “counting the days” and “anticipating the deadline”. Codes are written to be meaningful on their own, so that an analyst can later collect every extract with the same code without rereading the transcript.
A theme is not simply a topic. “Sleep” is a topic: it names an area that participants talked about. “Revision as a threat to rest” is a theme: it says what participants’ comments about sleep have in common and why that matters. Braun and Clarke call themes of the first kind “topic summaries” and regard them as underdeveloped, because they describe what was discussed without interpreting it.
Inductive and deductive coding
Researchers can approach coding from two directions. In inductive coding, codes come from the data: the analyst reads without a fixed framework and labels whatever seems meaningful, often using participants’ own words. In deductive coding, codes come from an existing theory or earlier research: the analyst looks for features that the theory predicts, such as the components of social identity theory or the stages of a model of stress. These correspond to the wider distinction between deductive and inductive approaches to research.
In practice most analyses combine the two. A researcher studying how refugees experience a new school might code inductively at first, then notice that the codes fit Berry’s model of acculturation and use its categories to organise the themes. What matters is that the researcher reports which approach was used, because an inductive analysis claims to stay close to participants’ meanings, while a deductive one claims to test or apply a theory.
Semantic and latent themes
The second choice is the level at which meaning is coded. Semantic themes stay at the surface: they summarise what participants explicitly said. Latent themes go beneath the surface to identify the assumptions, ideas or social discourses that shape what was said.
A latent theme often captures something participants would not say directly. If several students describe their revision only in terms of hours worked and grades predicted, a semantic theme might be “Long hours of revision”. A latent theme might be “Worth measured by output”, interpreting a shared assumption that their value depends on productivity. Latent analysis is more insightful, but it depends more on the researcher’s interpretation and therefore on their perspective.
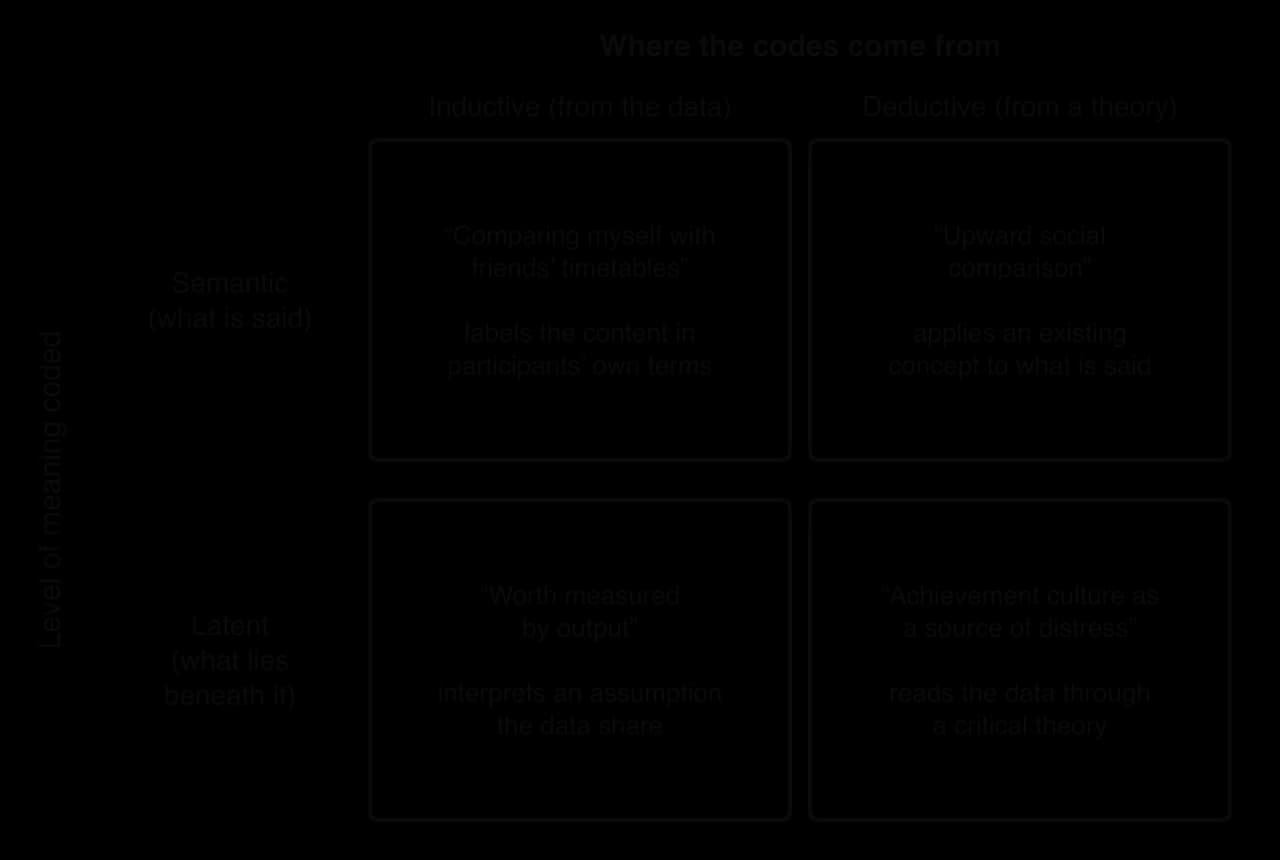
The grid shows that both dimensions describe the analyst’s choices, not the data. Moving from the top row to the bottom row adds interpretation; moving from left to right adds theory. The further an analysis moves from the top-left cell, the more its credibility depends on the researcher showing clearly how the interpretation was reached.
Braun and Clarke’s six phases
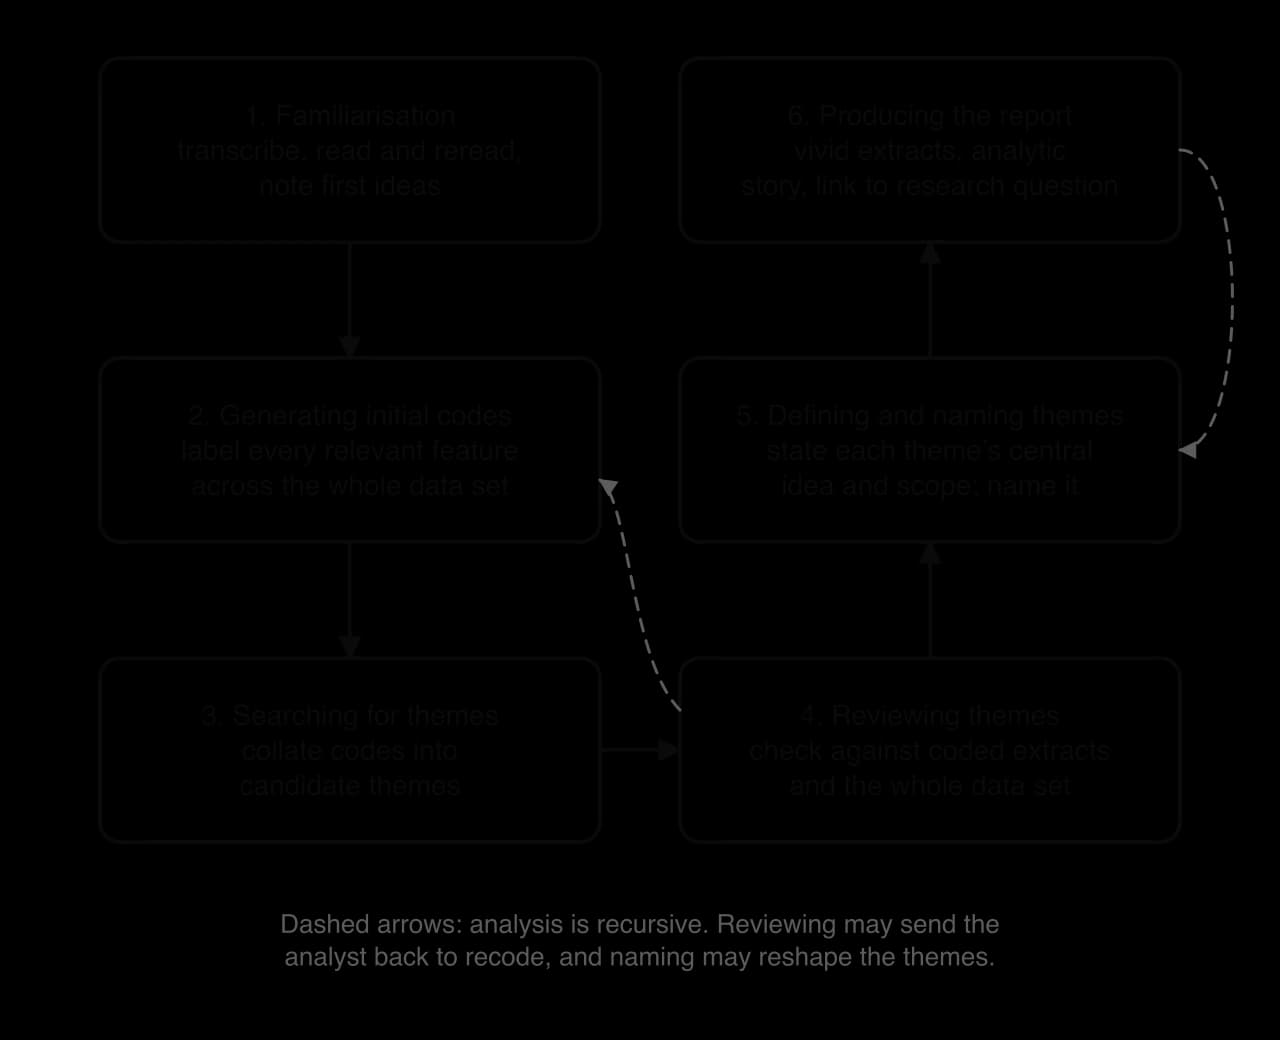
Braun and Clarke (2006) described thematic analysis as six phases. The phases are not a rigid recipe: an analyst moves back and forth between them, and Braun and Clarke stress that analysis is recursive rather than linear. They do, however, give a clear sequence that makes the analysis systematic and allows a reader to see how the conclusions were reached.
Phase 1: familiarisation with the data
The analyst becomes immersed in the data. If the data are recordings, this starts with transcription, which is itself an act of interpretation: the transcriber decides how to record pauses, laughter and overlapping speech. The analyst then reads and rereads the whole data set actively, noting initial ideas, surprising points and possible patterns in the margins or in a separate document. No coding is done yet; the aim is to know the data well before breaking it into pieces.
Phase 2: generating initial codes
Working systematically through the entire data set, the analyst attaches codes to every segment that might be relevant to the research question. Coding should be inclusive: it is better to code too much than too little, and an extract can carry several codes. At the end of this phase the analyst collates all the extracts for each code, so that, for example, every comment coded “comparing with peers” can be read together.
Phase 3: searching for themes
The analyst sorts the codes into candidate themes, looking for codes that share a central idea. Some codes become themes on their own; others become subthemes; some do not fit anywhere and are put in a temporary “miscellaneous” group. A thematic map, a diagram of candidate themes and the codes under each, helps the analyst to see how the pieces relate. In their later work Braun and Clarke renamed this phase “generating initial themes”, to stress that themes are built by the analyst rather than lying in the data waiting to be found.
Phase 4: reviewing themes
Candidate themes are checked at two levels. First, against the coded extracts: do all the extracts collected under a theme fit together, or does the theme need splitting? Second, against the whole data set: does the set of themes give a fair account of the data, and has anything important been missed? Themes may be merged, split, redefined or discarded at this stage, and the analyst may return to phase 2 to recode material in the light of the revised themes.
Phase 5: defining and naming themes
Each theme is given a clear definition: what its central idea is, what it includes and what it excludes, and how it relates to the other themes and to the research question. Braun and Clarke suggest that an analyst should be able to describe the scope and content of each theme in a couple of sentences. The theme is then given a concise, informative name, often using a short phrase from the data that captures it.
Phase 6: producing the report
The final phase turns the analysis into a written account. A good report tells a coherent story about the data, theme by theme, using vivid extracts as evidence. The extracts illustrate, but the analysis must go beyond them, explaining what each extract shows and how it answers the research question. Writing is part of the analysis, so themes are often refined at this stage.
Phase | What the analyst does | Typical product |
|---|---|---|
1. Familiarisation | Transcribes, reads and rereads, notes first ideas | Transcripts and notes |
2. Generating initial codes | Codes every relevant segment across the whole data set | A list of codes with their collated extracts |
3. Searching for themes | Groups codes into candidate themes and subthemes | An initial thematic map |
4. Reviewing themes | Checks themes against extracts and the whole data set; merges, splits or drops them | A revised thematic map |
5. Defining and naming themes | Writes a definition of each theme’s central idea and scope; names it | Theme definitions and names |
6. Producing the report | Selects vivid extracts; writes the analytic story linked to the research question | The written findings |
Reflexive thematic analysis and other versions
Since 2006 thematic analysis has developed into several versions that differ in how they treat coding. In coding reliability approaches, researchers agree a fixed codebook, two or more coders apply it independently, and their agreement is measured, for example with Cohen’s kappa, as a form of inter-rater reliability. These approaches treat good coding as accurate coding, and they are closer to the logic of quantitative research.
Braun and Clarke (2019) renamed their own approach reflexive thematic analysis to make its assumptions explicit. In their view, themes are generated by the researcher’s active interpretation, not discovered in the data, and the researcher’s subjectivity is a resource to be acknowledged rather than an error to be removed. Measuring agreement between coders makes little sense on this view, because two thoughtful analysts may legitimately see different things. Quality comes instead from depth of engagement, transparency and reflexivity: the researcher’s ongoing reflection on how their own position shaped the analysis.
Sources: Braun, V. & Clarke, V. (2006). Using thematic analysis in psychology. _Qualitative Research in Psychology, 3(2), 77–101. Braun, V. & Clarke, V. (2019). Reflecting on reflexive thematic analysis. Qualitative Research in Sport, Exercise and Health, 11(4), 589–597._
 YouTube
A worked example: from transcript to themes
The phases are easiest to understand by following them through a small data set. The extracts are invented for teaching and much shorter than a real study, which would use full transcripts from perhaps 10–20 participants. The research question is: How do students in their final year of school experience revising for their school-leaving tests? Three 17–18-year-olds at an international school were interviewed with a semi-structured interview schedule.
Honestly the worst bit is the comparing. Everyone posts their revision timetables in the group chat and I look at mine and think, I’m already behind. Then I can’t sleep because I’m doing the maths of how many days are left. My mum says I should just do my best, but my best doesn’t feel like enough when everyone else seems to be doing ten hours.
— Participant A, aged 17 (invented extract)
The second participant describes revision in a different way, as something that is manageable as long as it is organised.
I’m fine as long as I’ve got a plan. I make a list every night and tick things off, and that’s what keeps me sane. When I don’t know what to do next, that’s when it gets bad. My older brother did these tests, so he tells me what actually comes up, which helps.
— Participant B, aged 18 (invented extract)
The third participant’s family moved to the country for a parent’s job, which shapes how she talks about support.
My parents moved here for my dad’s work and they don’t really know how the system works, so I kind of have to figure it all out myself. I feel like if I don’t get the grades it’s like… all of that was for nothing. I don’t really talk about it with friends; everyone’s stressed already. I go running at night, that’s my only switch-off.
— Participant C, aged 17 (invented extract)
Coding in the example is deliberately inclusive. “Running as switch-off” appears only once, but it is coded anyway, because at this stage the analyst cannot yet tell which codes will matter. Phases 3 and 4 decide that.
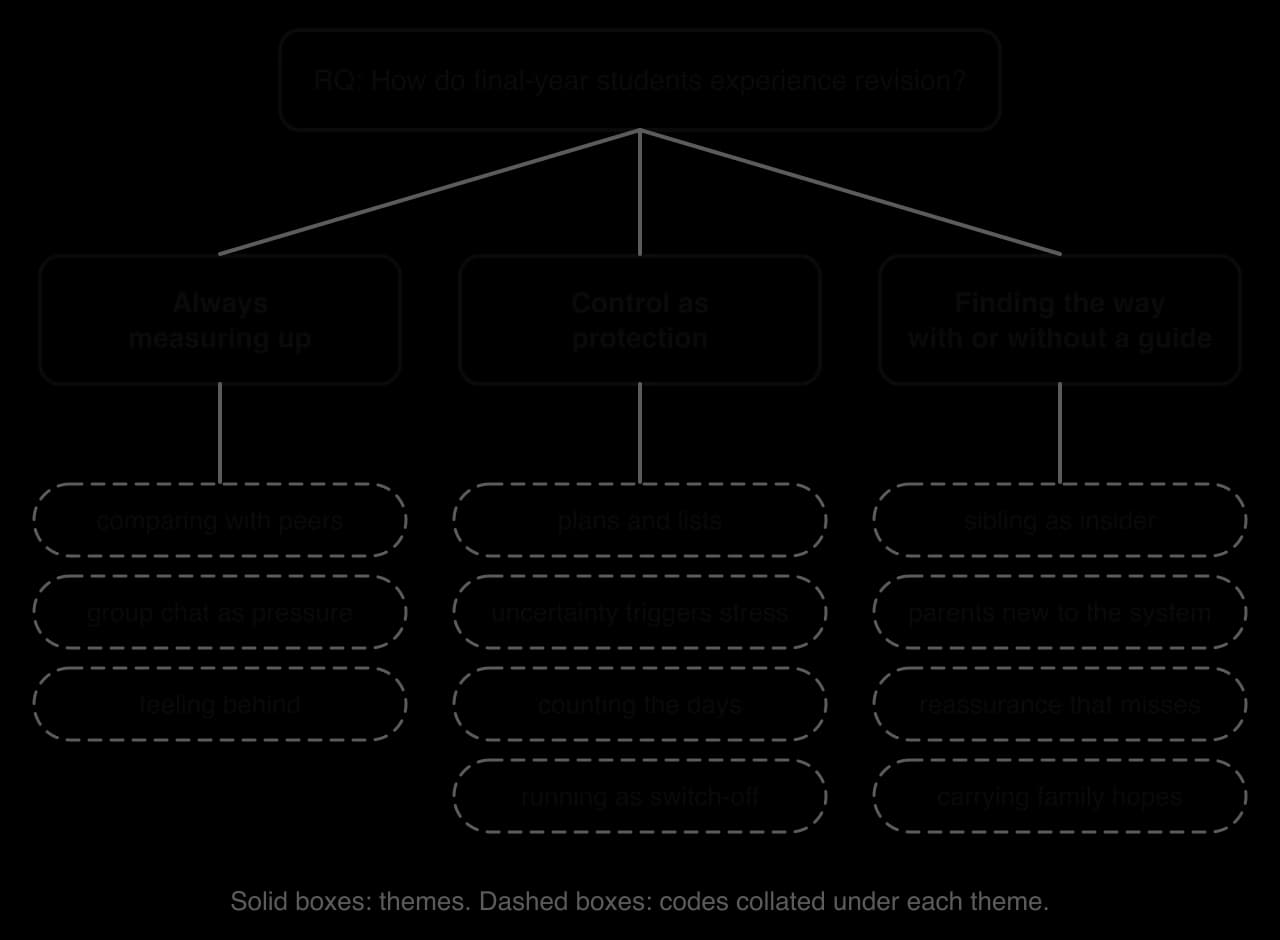
The map shows the result of review rather than the first attempt. Two features are typical of good practice: no theme rests on a single extract, and every code has a clear home. In so small a data set, however, “Always measuring up” still draws on only one participant, and it would need support from further interviews before it could be reported as a theme. In a real study, codes that fit nowhere would be kept in a list and mentioned if they were relevant, rather than silently dropped.
The report extract shows the two jobs of phase 6. The quotations are evidence, but the sentences around them do the analysis: they compare participants, interpret what the extracts share and link the theme back to the research question. A report made only of quotations, or of claims with no quotations, would be weaker.
Judging qualitative research: credibility, bias and transferability
Quantitative research is judged by reliability, internal validity and generalisability. Qualitative research uses parallel criteria suited to its aims, often grouped under the heading of trustworthiness. The three that matter most for thematic analysis are credibility (does the analysis represent participants’ experiences truthfully?), bias (how far did the researcher or the participants distort the findings?) and transferability (to what other people and settings might the findings apply?).
Credibility
Credibility is the extent to which qualitative findings give a true picture of the phenomenon studied and of participants’ perspectives. It is the qualitative counterpart of internal validity. A credible thematic analysis is one where a reader can see that the themes come from the data, that they represent what participants meant, and that alternative interpretations were considered. Researchers improve credibility in several ways.
Triangulation: comparing findings across different sources of data (interviews and observations), different researchers, different methods or different theories. If several sources point to the same theme, confidence in it increases.
Member checking: returning transcripts, themes or a summary of the findings to participants and asking whether they recognise their experience in them.
Reflexivity: the researcher keeps a reflexive journal recording their assumptions, reactions and decisions, and reports how their own background might have shaped the analysis.
Thick description: reporting the context, the participants and enough extracts in detail that readers can judge whether the interpretation is justified.
An audit trail: keeping records of every analytic decision (raw codes, earlier thematic maps, notes on why themes were merged or dropped) so that another researcher could follow how the conclusions were reached.
Negative case analysis: actively looking for extracts that do not fit a theme and either revising the theme or explaining the exception.
Prolonged engagement and data saturation: collecting data until new interviews no longer produce new codes or themes, so that the themes are not based on a few unusual participants.
These strategies work by making the interpretation more open to checking. None of them guarantees credibility. Member checking, for example, can be limited because participants may not recognise a latent theme that the researcher has interpreted from what they said, even if it is a fair interpretation.
Bias in thematic analysis
Bias enters a thematic analysis from two directions. Researcher bias arises when the researcher’s expectations, values or relationship with participants shape the data or the analysis: through leading questions, through selective attention to extracts that fit a favoured idea (confirmation bias in coding), or through choosing quotations that support a conclusion while ignoring those that do not. Participant bias arises when what participants say is shaped by the research situation: social desirability bias, wanting to please the interviewer, or, in a focus group, conforming to what others in the group have said.
Researchers reduce bias by designing open, non-leading interview questions, by using more than one analyst and discussing disagreements (researcher triangulation), by reflexivity about their own position, by negative case analysis and by keeping an audit trail. Participant bias is reduced by building rapport, guaranteeing confidentiality, using an interviewer who is not in a position of authority over participants, and, where group pressure is a risk, combining focus groups with individual interviews.
Transferability
Transferability is the extent to which qualitative findings can be applied to other contexts, settings or groups. It replaces generalisability, which depends on representative samples and statistics. Qualitative studies usually use small purposive samples chosen because they can speak to the research question, not because they represent a population, so findings cannot be generalised statistically.
Transferability is judged by the reader rather than claimed by the researcher. The researcher’s task is to provide thick description of the participants, the setting, the time and the methods, so that someone working in another context can decide how similar their situation is. A study of revision stress in an international school in one city could transfer reasonably to similar schools elsewhere, less well to state schools in rural areas, and perhaps not at all to a country with a very different school culture. Findings transfer more readily when similar themes appear in studies of different groups.
Research consideration | Question it asks | Ways to strengthen it |
|---|---|---|
Credibility | Do the themes truthfully represent participants’ experiences? | Triangulation, member checking, reflexivity, thick description, audit trail, negative case analysis, saturation |
Avoiding bias | Did the researcher or the research situation distort what was said or how it was interpreted? | Open questions, independent interviewer, more than one coder, reflexive journal, individual interviews alongside focus groups |
Transferability | To what other people and settings might the findings apply? | Thick description of sample and setting, purposive or maximum-variation sampling, comparison with studies of other groups |
Key study: O’Reilly et al. (2018), adolescents’ views of social media and mental health
Aim
Michelle O’Reilly and colleagues at the University of Leicester aimed to find out how adolescents themselves see social media in relation to mental health and well-being. Most research on the topic measured screen time and symptoms; few studies had asked young people what they thought. Their research question was: “What do adolescents think of social media and its relevance to mental health and emotional wellbeing?”
Method
The study used a qualitative design from a social constructionist perspective, which treats young people’s accounts as shaped by the wider social and media discussions around them. Six focus groups were held over three months in 2016 with 54 adolescents aged 11–18, recruited from schools in Leicester and London that were chosen to include a broad range of socioeconomic and ethnic backgrounds. Focus groups were used because they suit sensitive topics and young participants and allow participants to respond to each other’s views.
Questions were kept broad so that discussion could be led by the participants. Students were asked what they understood by mental health, how they used social media and which platforms they preferred, and whether social media could be used to promote mental well-being. Sampling continued until no new themes emerged within or across groups, a form of data saturation. The University of Leicester’s ethics committee approved the study, adolescents gave written consent, and parents also consented for those under 16.
Transcripts were analysed with thematic analysis following Braun and Clarke (2006), chosen for its data-driven focus. Three members of the research team coded the data independently, and their coding frames were then compared and combined into a final version, which the authors presented as a way of ensuring agreement between coders.
Results
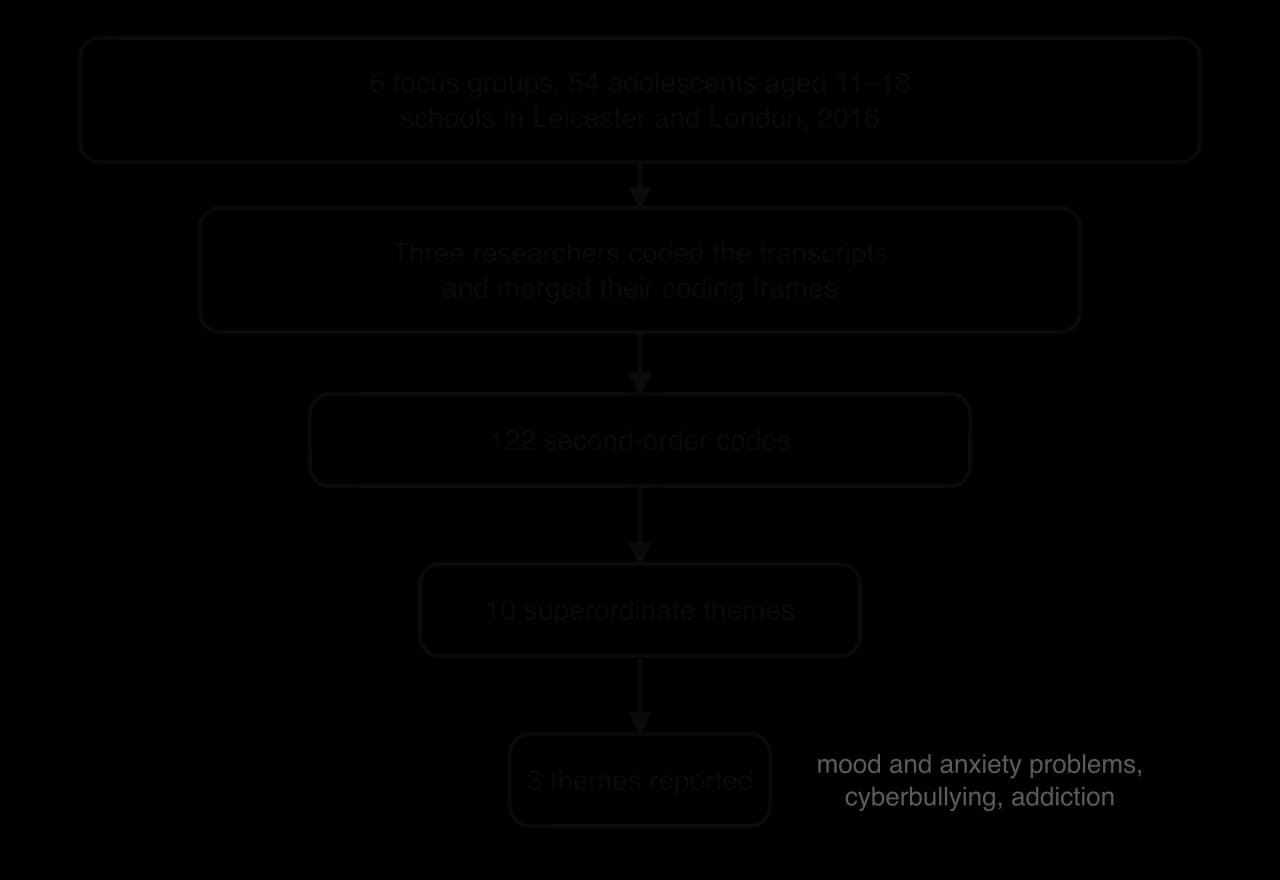
The funnel shows how much interpretation lies between the data and the published findings: the reader sees three themes out of ten. The authors explained that they chose these three because they captured participants’ broad views of social media in relation to mental health. Across all groups, participants described social media as “dangerous” for adolescent mental health, although they were heavy users themselves.
Social media can cause stress, depression, low self-esteem and suicidal ideation. Participants said that other people’s negative posts lower young people’s mood and that edited (“photo-shopped”) images teach them to have low self-esteem.
Social media opens people to bullying and trolling. Cyberbullying was seen as a major risk that follows young people beyond school, and as hard to report.
Social media is addictive. Participants described others who “can’t survive without a phone” and called social media “like an online drug”; when they spoke about themselves, the main problem they reported was lost sleep from checking messages at night.
Some people can get addicted and feel like they have to stay on that website or social media.
— Participant aged 13–14, London, in O’Reilly et al. (2018)
A striking feature, which the authors analysed at a latent level, was that participants mostly spoke about risks to “some people” or adolescents in general rather than about their own experience. These third-person accounts suggested that young people were repeating the dominant public discussion, which the authors described as a moral panic about social media, rather than reporting harms they had experienced themselves.
Conclusions
The authors concluded that adolescents perceive social media as a threat to mental well-being, through mood and anxiety problems, cyberbullying and addiction, but that their views appeared to be shaped by wider media discourse more than by personal experience. They argued that young people should be involved in designing programmes that help them use social media safely, rather than being told only that it is dangerous.
Evaluation
Credibility
Several features support credibility: a clear research question, a recognised method of analysis, three independent coders, sampling to saturation and many verbatim extracts that let readers judge the interpretation. Credibility is limited by the absence of member checking and of triangulation with other data, such as participants’ actual social media use or well-being scores, which could have tested whether the perceived harms matched experienced ones. Reporting only 3 of 10 themes also means readers cannot see how the remaining seven might qualify the picture.
Bias
Focus groups make participant bias likely: once one student described social media as dangerous, others may have conformed, and adolescents may have given the answer they expected adults wanted. The study’s framing, a project about mental health and social media run by adult researchers in schools, may itself have invited negative views; the published title, “Is social media bad for mental health and wellbeing?”, shows the framing. The authors’ own latent interpretation, that students were repeating a moral panic, partly addresses this, but individual interviews or anonymous written responses would have tested it.
Transferability
The sample came from two English cities with diverse populations, which supports transfer to other urban UK schools. Transfer to rural areas, to other countries with different platforms and patterns of use, or to adolescents with diagnosed mental health problems is less certain, and the data were collected in 2016, before platforms such as TikTok became widespread. The authors give the ages, cities and setting but little detail about each group’s composition, which makes the reader’s judgement of transferability harder.
Sources: O’Reilly, M., Dogra, N., Whiteman, N., Hughes, J., Eruyar, S. & Reilly, P. (2018). Is social media bad for mental health and wellbeing? Exploring the perspectives of adolescents. _Clinical Child Psychology and Psychiatry, 23(4), 601–613._
Evaluating thematic analysis
Thematic analysis is popular because it is flexible and accessible, but the same qualities draw criticism. Its value depends heavily on how well a particular study was done and reported, so evaluation should focus on the specific analysis as well as on the method in general.
Concept | Strengths | Limitations |
|---|---|---|
Perspective | Captures participants’ own meanings and experiences; well suited to an emic approach and to groups whose views are rarely heard. | The researcher’s theoretical position shapes the themes; different analysts may produce different themes from the same data. |
Measurement | Gives rich, detailed data about experiences that questionnaires cannot capture; can identify new constructs worth measuring. | Themes cannot be counted reliably or tested statistically; small samples mean prevalence is unknown. |
Bias | Reflexivity, audit trails and multiple coders make bias visible and open to checking. | Selective quotation and confirmation bias in coding are hard for readers to detect, especially when only some themes are reported. |
Causality | Can suggest mechanisms (why or how something happens) that later quantitative research can test. | Cannot establish cause and effect; accounts of causes are participants’ perceptions. |
Change | Findings can inform interventions that fit people’s real concerns, as O’Reilly et al. argued for social media education. | Findings tied to one time and setting may date quickly, as platforms and norms change. |
Responsibility | Gives participants a voice; member checking treats them as partners in the research. | Rich personal data raise confidentiality risks, especially in small communities where extracts may identify people. |
Strengths
Thematic analysis gives access to how people make sense of their experience, in their own words, which is essential in areas such as mental health, culture and identity, where questionnaires may impose the researcher’s categories. Because it is not tied to a single theory, it can be used inductively to explore a new area or deductively to examine how an existing theory applies. Its clear phases make it learnable and allow readers to see how an analysis was conducted.
Qualitative methods also fit research approaches that place participants’ own meanings at the centre, such as Indigenous psychologies. Researchers working with Indigenous communities have argued that research should be shaped by the community’s own concepts and priorities rather than by categories imported from outside, and open-ended interviews analysed thematically can support that aim when the community is involved in interpreting the data.
Limitations
The flexibility of thematic analysis can lead to analyses that are vague or poorly justified. Braun and Clarke themselves criticised studies that present topic summaries as themes, that confuse different versions of the method, or that claim themes “emerged” from the data as if the researcher played no part. Because the analysis rests on interpretation, two analysts may reach different themes, and readers must rely on the researcher’s transparency to judge the result.
Thematic analysis is also time-consuming: transcribing and coding even a small data set can take weeks, which limits sample size. Its findings describe how a particular group of people saw something at a particular time, so they complement rather than replace quantitative evidence. In mixed-methods research the two are often combined: a thematic analysis identifies what matters to participants, and a questionnaire then measures how common those views are in a larger, more representative sample.
Exam practice
Thematic analysis appears mainly in Paper 3, Question 3, which is always about a qualitative source and always takes one of three forms: how the researcher could improve credibility, how the researcher could avoid bias, or to what extent the findings are transferable to other populations or contexts. Each is worth 6 marks, and the top band needs detailed understanding with explicit reference to the source. The other questions may also draw on qualitative sources, for example when a source reports themes alongside numbers.
The practice items use one invented source booklet. Claim: technology use has a negative effect on the mental health of adolescents.
Source 4. A researcher who is also the school counsellor at a private girls’ school in Singapore ran two focus groups (n = 7 and n = 8) with students aged 14–15 who had come to her for help with stress. She asked: “How does being online make your stress worse?” She coded the transcripts herself using Braun and Clarke’s phases and reported two themes: “never offline” (constant notifications and pressure to reply) and “the highlight reel” (comparing one’s life with others’ edited posts). She concluded that technology use is a major cause of adolescent stress.
Source 5. A table shows how many of the 15 participants in Source 4 contributed to each theme: “never offline” 12, “the highlight reel” 9, “staying connected with friends abroad” 4, “learning and creativity” 3. Only the first two were reported in the conclusion.
The plan earns credit because every point names a detail of the source (one coder, the counsellor’s role, the omitted themes) and a specific strategy. The same source supports the other two forms of Question 3.
For the transferability form, the focus moves from how the data were produced to whom the findings might apply, and the answer should reach a judgement on “to what extent”.
Summary
Thematic analysis identifies, analyses and reports patterns of meaning (themes) in qualitative data such as interview and focus-group transcripts.
Codes label single features of the data; themes are patterns of shared meaning built from codes, organised around a central idea rather than a topic.
Coding can be inductive (from the data) or deductive (from a theory), and themes can be semantic (what was said) or latent (the assumptions beneath it).
Braun and Clarke’s six phases are familiarisation, generating initial codes, searching for themes, reviewing themes, defining and naming themes, and producing the report; the process is recursive.
Reflexive thematic analysis treats themes as the researcher’s interpretation and values reflexivity; coding reliability versions use a codebook and agreement between coders.
Credibility is improved by triangulation, member checking, reflexivity, thick description, an audit trail and negative case analysis.
Bias comes from the researcher (leading questions, selective coding) and from participants (social desirability, conformity in focus groups), and can be reduced but not removed.
Transferability is judged by the reader from a thick description of the sample and setting; it replaces statistical generalisability.
O’Reilly et al. (2018) used focus groups and thematic analysis with 54 adolescents and found three themes presenting social media as a threat to mental health, voiced mostly about other people.
Self-check
- To do:
I can explain what thematic analysis is and how it differs from content analysis and quantitative analysis.
- To do:
I can describe Braun and Clarke’s six phases of thematic analysis in order.
- To do:
I can explain the difference between codes and themes, inductive and deductive coding, and semantic and latent themes.
- To do:
I can apply thematic analysis to a short extract, from initial codes to a named theme with a definition.
- To do:
I can discuss how a researcher could improve the credibility of qualitative findings and avoid bias, with reference to a source.
- To do:
I can discuss the extent to which qualitative findings are transferable to other populations or contexts.
- To do:
I can evaluate thematic analysis with reference to bias, measurement and perspective.