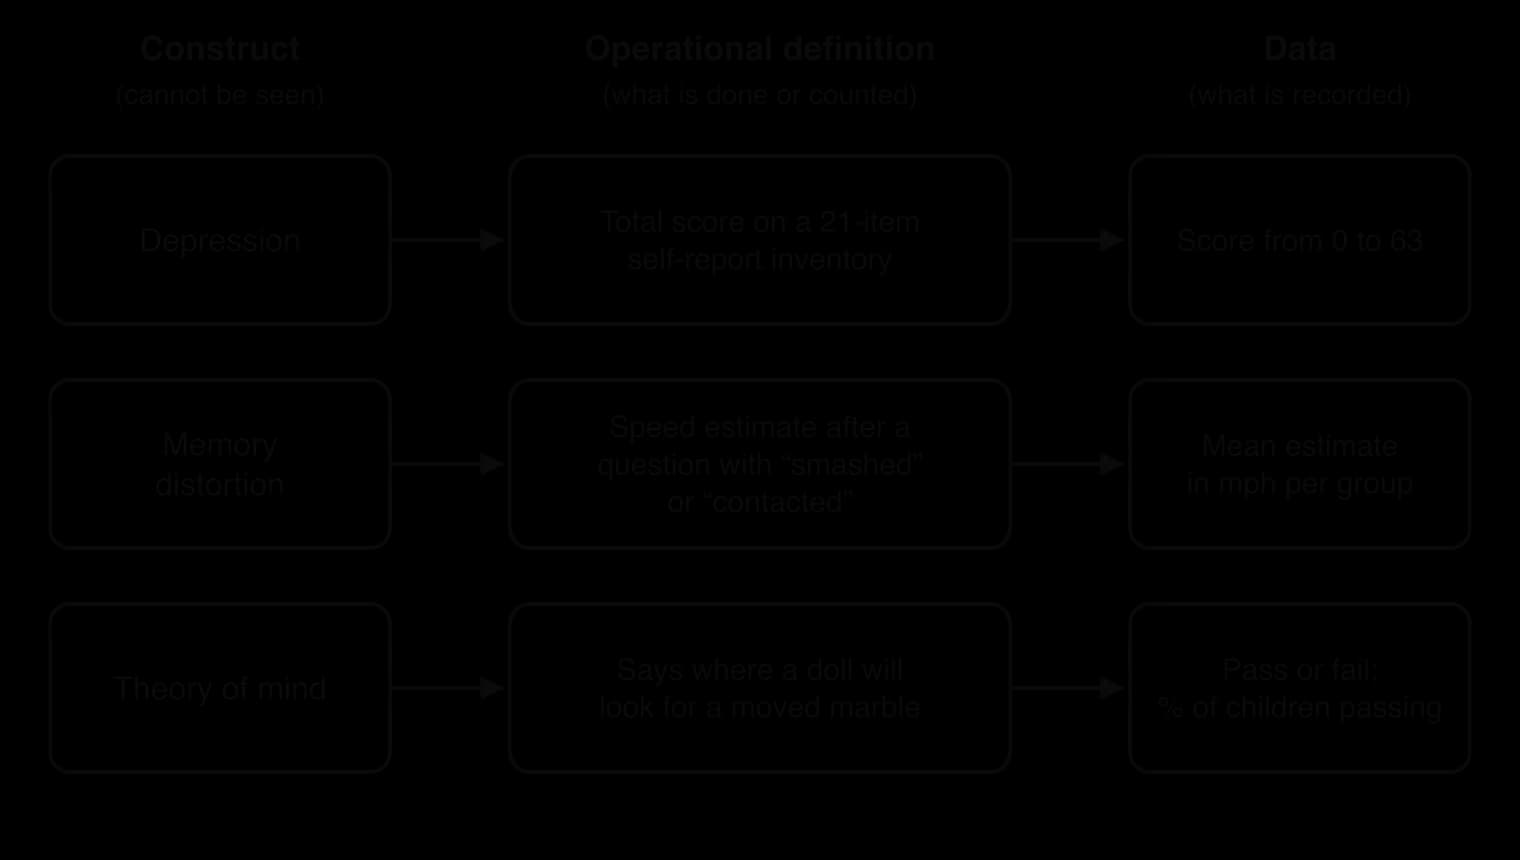
Explain how psychologists turn unobservable constructs into data, judge the reliability and validity of measures, choose types of data and designs, avoid statistical errors, and evaluate measurement across approaches and contexts.
Each is in the Psychology glossary, with every other term in the subject.
Evidence based on personal stories or isolated observations rather than systematic data collection, which makes it vivid but unrepresentative and open to bias.
A difference between age groups caused by the different historical conditions each generation grew up in, rather than by age or development itself.
An abstract psychological concept, such as intelligence, anxiety or attachment, that cannot be observed directly and has to be inferred from behaviour, self-report or physiological measures.
The extent to which a measure truly reflects the theoretical construct it is meant to measure, shown when it relates to other measures and behaviour as the theory predicts.
A research technique that systematically codes written, spoken or visual material into categories, which are then counted (quantitative) or interpreted for meaning (qualitative).
A type of validity showing the extent to which scores on a measure agree with, or predict, an outside criterion such as behaviour, diagnosis or a later outcome.
A research design that compares different groups, such as different age groups, at a single point in time, showing differences between groups rather than change within individuals.
A distinction between measures that record the behaviour of interest itself and measures that infer a construct or process from something else, such as brain activity from blood oxygen.
Data gathered systematically through observation, measurement or experiment, using procedures that others can check and repeat.
A computer-based reaction-time task that infers the strength of automatic associations between concepts, such as social groups and good or bad, from how quickly people sort words and images.
The extent to which two or more independent observers or coders give the same ratings of the same behaviour or material, usually checked by correlating their scores or calculating agreement.
A type of reliability showing the extent to which the items of a scale measure the same construct, so that scores on the items rise and fall together.
A research design that measures the same participants repeatedly over an extended period, so that change within individuals and the order of events can be studied.
A concept referring to how psychologists represent behaviour and mental processes as data, by choosing methods and operationalising variables so that the results are reliable, valid and credible.
A research strategy that combines quantitative and qualitative data in one study, so that each kind of data compensates for the limitations of the other.
The process of stating exactly how a variable will be manipulated or measured in observable terms, so that a construct becomes measurable and the procedure can be repeated by others.
Research that records exposures or experiences as they happen and then follows participants forward in time to measure later outcomes, avoiding reliance on memory.
Non-numerical data, such as words, images or observed meanings from interviews, open questions or field notes, analysed for themes and meanings.
Numerical data, such as scores, counts, times or ratings, that can be summarised with descriptive statistics and analysed with inferential statistics.
The consistency of a measure: the extent to which it gives the same results on repeated occasions (test–retest), across observers (inter-rater) or across its items (internal consistency).
Research that looks back in time, usually by asking participants to recall past experiences or by using existing records, after the outcome of interest has occurred.
Data in which participants describe their own thoughts, feelings, experiences or behaviour, usually through questionnaires, interviews or diaries.
The use of more than one method, data source, researcher or theory to study the same question, so that conclusions do not depend on a single measure; agreement increases credibility.
A false positive: concluding that an effect or relationship exists, by rejecting the null hypothesis, when in reality there is none.
A false negative: failing to detect an effect or relationship that really exists, by retaining the null hypothesis when it is false; more likely with small samples and unreliable measures.
The extent to which a measure or study captures what it claims to capture. Types include face, content, construct and criterion validity for measures, and internal and external validity for studies.
Any characteristic or factor that can change or differ between people, situations or times and can be manipulated or measured, such as reaction time, anxiety score or hours of sleep.
Explain how constructs are operationalised as measurable variables, and the trade-offs this involves.
Compare and contrast quantitative, qualitative, self-reported, anecdotal and empirical data, and explain when each is useful.
Explain the main types of reliability and validity, and apply them to a measure or a study.
Explain why brain imaging, twin studies and physiological measures are indirect measures of psychological processes.
Compare and contrast longitudinal and cross-sectional designs, and prospective and retrospective research, as ways of measuring over time.
Explain type I and type II errors and how sample size and measurement quality affect them.
Describe how triangulation and content analysis are used to improve and extend measurement.
Evaluate the Implicit Association Test with reference to reliability, validity and responsibility.
Measurement is the concept that asks how psychologists turn behaviour and mental processes, most of which cannot be seen, into data that can be recorded, compared and tested. Every claim in psychology rests on a measure, so the quality of the measure sets a limit on how far any conclusion can be trusted.
Measurement links closely to the other concepts. A poor measure can create bias, hide or invent a causality relationship, or make a change appear where none exists, and each approach measures behaviour in its own way: brain scans and hormone levels, reaction times and recall scores, surveys and observations of groups.
With a free account, Augment remembers where you stopped and what you have practiced.
Scope: A concept, used as a lens across the whole course. Its related terms (choice of research method, constructs and operationalisation, types of data, statistical significance and type I and type II errors, brain imaging, content analysis, prospective and retrospective research, longitudinal and cross-sectional designs) are tools for analysis, and concept-based questions on measurement can be set in any context or about any study.
Length can be measured with a ruler that everyone agrees on, but psychology has no equivalent instrument for anxiety, intelligence or love. These exist as ideas in a theory, and psychologists can only measure something that stands in for them: an answer on a questionnaire, a reaction time, a pattern of brain activity or a behaviour counted by an observer. Measurement is therefore always a matter of judgement about what counts as evidence of the thing being studied.
The guiding question for the concept is how complex psychological ideas can be expressed in terms of observable, measurable behaviour. Answering it involves several decisions: which method to use, how to define each variable, what kind of data to collect, how to check that the data are consistent and meaningful, and how to analyse them without drawing false conclusions.
What a researcher measures reflects what they believe a construct is. A biological researcher may measure depression through cortisol levels or brain activity, a cognitive researcher through negative thoughts recorded in a questionnaire, and a cross-cultural researcher by asking how people in a community describe their distress in their own words. The same word, “depression”, refers to different data in each case, and the conclusions are only as wide as the measure allows.
Measures can be direct or indirect. Counting how often a child hits another child in a playground records the behaviour itself, so it is relatively direct. Inferring the role of a neurotransmitter from changes in blood flow on a brain scan, or inferring an attitude from how fast someone presses a key, involves several steps of reasoning between the data and the conclusion. Each step is an assumption that can be wrong, so indirect measures need especially careful checking.
Evidence in psychology comes in three broad kinds. Anecdotal data are personal stories and isolated observations, such as a parent’s report that a child became anxious after starting to use social media. They are vivid and can suggest questions, but they are not collected systematically, cannot be checked and are easily shaped by what the person expects to see.
Empirical data are collected systematically through observation, measurement or experiment, by procedures that others can repeat and check. Self-reported data are a particular kind of empirical data in which participants describe their own thoughts, feelings or behaviour, usually in questionnaires, interviews or diaries. Self-report is the only direct route to private experience, but it depends on memory, honesty, insight into oneself and the wish to make a good impression.
Most of what psychology studies are constructs: ideas such as intelligence, self-esteem, attachment, stress or memory that cannot be observed directly. A construct is useful because it explains and predicts behaviour, but it has to be inferred from something that can be observed.
In research, a construct becomes a variable: something that can take different values and can be manipulated or measured. In an experiment the independent variable is manipulated and the dependent variable is measured; in a correlational study two or more variables are measured and compared. A variable only becomes usable once it is defined in observable terms.
Operationalisation is the bridge from theory to data. A hypothesis such as “leading questions distort memory” cannot be tested until “distort memory” is pinned down. Loftus and Palmer (1974) operationalised memory distortion as the speed students estimated for a filmed car crash after being asked how fast the cars were going when they “smashed” into or “contacted” each other. Participants who heard “smashed” gave a mean estimate of 40.8 mph, against 31.8 mph for “contacted”, which turned an abstract idea into a number that could be compared between groups.
 YouTube
A tight, narrow operational definition makes a measure easy to score consistently and to repeat, which supports reliability and statistical testing. The cost is that it may capture only a thin slice of the construct. A speed estimate is a precise number, but distorted memory for a real accident involves emotion, confidence and detail that a single estimate leaves out.
A broad operational definition, such as asking eyewitnesses to describe a real event in their own words, captures more of the construct but is harder to score and compare, and leaves more room for the researcher’s interpretation. Researchers choose a point between these extremes according to their aim, and evaluation often comes down to whether the choice suited the conclusion drawn.
Tighter operationalisation | Broader operationalisation |
|---|---|
Easier to score, repeat and compare; higher reliability | Captures more of the construct; closer to real life |
Supports statistics and causal testing | Harder to standardise; more room for interpretation |
Risk: measures a thin slice of the construct | Risk: different researchers measure different things |
Memory as words recalled from a list in two minutes | Memory as how people recount a real event in an interview |
Measures produce two broad kinds of data, and the choice between them shapes what a study can conclude. Quantitative data are numerical: scores, counts, times and ratings. Qualitative data are non-numerical: words, images and meanings, such as interview transcripts, open answers or field notes.
Quantitative data allow precise comparison and statistical testing, and they suit experiments, structured questionnaires and correlational studies. Qualitative data capture what experiences mean to participants, in their own terms, and suit interviews, focus groups and case studies, especially when a topic is new or poorly understood.
Quantitative data | Qualitative data | |
|---|---|---|
Typical methods | Experiments, structured questionnaires, correlational studies, structured observation | Semi-structured interviews, focus groups, naturalistic observation, case studies |
Strengths | Precise, comparable and replicable; supports statistical testing and causal claims | Rich and detailed; captures meaning and the participant’s own perspective |
Limitations | Can strip away meaning and context; fixed answers may not fit participants’ views | Hard to replicate; analysis depends on the researcher’s interpretation; small samples |
Quality judged by | Reliability, validity and statistical significance | Credibility, transferability and reflexivity |
Many studies use mixed methods, combining both kinds of data so that each compensates for the other. A researcher studying adjustment to university might use a questionnaire to measure loneliness in 300 students and then interview 12 of them to understand what loneliness means in their daily lives. The questionnaire data show how common and how strong loneliness is, and the interviews help to explain why students experience it.
Content analysis turns written, spoken or visual material into data. The researcher defines coding categories in advance or from the material, codes each item, and then either counts how often each category appears (quantitative content analysis) or interprets what the material means (qualitative content analysis). It can be used on newspaper articles, advertisements, social media posts, diaries, interview transcripts or children’s drawings.
Its main strength is that it measures material that already exists, so the people who produced it are not affected by being studied. Its main weakness is that the categories reflect the researcher’s assumptions about what matters. For this reason, coders are trained with written definitions of each category, and two or more coders code the same material independently so that inter-rater reliability can be checked. Thematic analysis is a related qualitative technique that identifies patterns of meaning across a data set.
Two questions decide whether a measure is any good. The first is whether it is consistent: whether it gives the same result when the same thing is measured again, by another person, or with other items that are meant to measure the same thing. This is reliability.
Type of reliability | What it checks | How it is tested | Example |
|---|---|---|---|
Test–retest | Stability over time | The same people complete the same measure twice; the two sets of scores are correlated | A depression questionnaire completed one week apart should give similar scores if mood has not changed |
Inter-rater (inter-observer) | Agreement between people scoring the same behaviour or material | Two or more trained observers code independently; their scores are compared | Two observers counting aggressive acts in the same playground video |
Internal consistency | Whether the items of a scale measure the same construct | Correlations between items, often summarised as Cronbach’s alpha | Items on an anxiety scale should rise and fall together |
The revised Beck Depression Inventory, the BDI-II, shows what a reliable self-report measure looks like. It has 21 items, each scored 0–3, giving a total from 0 to 63. Its internal consistency is high (Cronbach’s alpha of about .9 in validation studies), and scores taken one week apart correlate at about .93, so it measures consistently. These figures say nothing yet about whether it measures depression rather than, for example, general distress or the fatigue of a physical illness, which is a question of validity.
Sources: Beck, A. T., Steer, R. A., & Brown, G. K. (1996). _Manual for the Beck Depression Inventory-II. Psychological Corporation._
The second question is whether a measure captures what it claims to capture. A bathroom scale that always reads 2 kg too heavy is perfectly reliable, because it gives the same wrong answer every time, but it is not valid. Validity is the more important property, and also the harder one to establish, because the true value of a construct can never be observed directly.
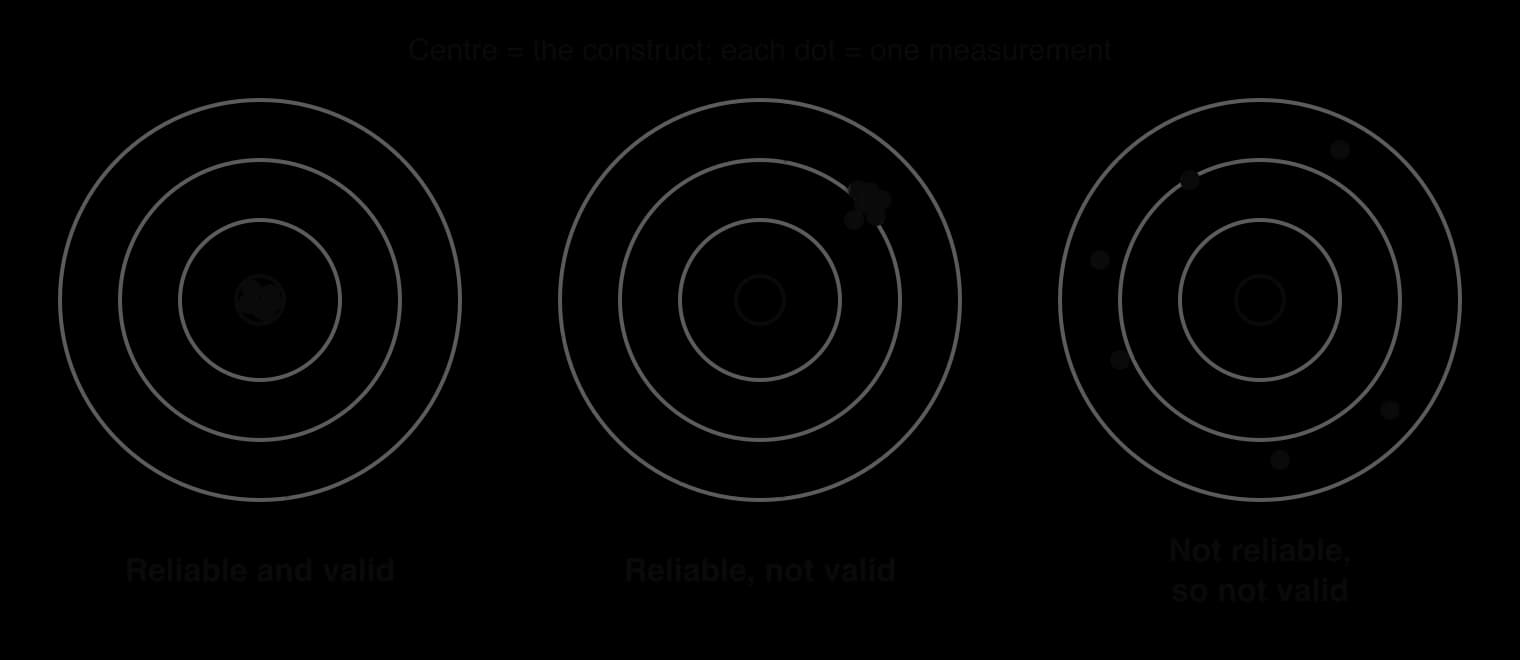
A measure cannot be valid without being reliable: if scores jump around randomly, they cannot be tracking the construct. Reliability is therefore necessary for validity but not sufficient. When a measure is unreliable, real relationships between variables are also harder to detect, because random error weakens any correlation.
Type of validity | Question it asks | Example |
|---|---|---|
Face validity | Does the measure appear, on the surface, to measure the construct? | A stress questionnaire asking about worry and poor sleep looks like a stress measure |
Content validity | Does it cover all the parts of the construct? | A depression scale asking only about sad mood, not sleep, appetite or concentration, has weak content validity |
Construct validity | Does it truly reflect the theoretical construct, and relate to other measures as the theory predicts? | Does passing a false-belief task reflect understanding of other minds, or also language and memory? |
Criterion validity | Do scores agree with, or predict, an outside criterion? | Do scores on a test of reading readiness predict reading ability a year later? |
Construct validity can be examined in the false-belief task used by Baron-Cohen, Leslie and Frith (1985). In this task a child watches a doll (Sally) put a marble in a basket and leave; another doll (Anne) moves it to a box, and the child is asked where Sally will look. In the study, 85% of typically developing children and 86% of children with Down syndrome answered correctly, compared with 20% of autistic children.
Passing the task requires understanding that Sally holds a false belief, but it also requires following a story, understanding the question and holding events in memory. Failure may therefore reflect these demands as well as a difficulty with theory of mind, which is a question about the construct validity of the task.
Researchers have tested this by designing tasks with fewer language and memory demands, such as tasks that record where young children look rather than what they say. If a construct is measured in several different ways and the results agree, construct validity is supported; if they disagree, the measure may be capturing something other than the construct.
Criterion validity is tested by comparing a measure with an outside standard. A new screening questionnaire for depression can be compared with diagnoses made in a full clinical interview: if people who score high on the questionnaire are mostly those whom clinicians diagnose, the questionnaire has good criterion validity. When the criterion is measured later, as when a test given at age 5 is checked against school results at age 10, this is called predictive validity.
 YouTube
Validity also applies to whole studies. Internal validity is the extent to which a study shows that the independent variable, rather than some other factor, caused the change in the dependent variable. External validity is the extent to which findings apply beyond the study, and ecological validity is the extent to which they apply to real-life settings. These are questions about design as much as about measurement, but a weak measure undermines all of them: a study cannot show what causes “memory distortion” if its measure of memory distortion is narrow or ambiguous.
Biological measures look objective, because they produce images and numbers rather than answers to questions. They are nonetheless indirect: each infers a psychological process from a physical signal, and each inference rests on assumptions.
Functional magnetic resonance imaging (fMRI) does not record neurons firing. It measures the BOLD signal, a change in the ratio of oxygenated to deoxygenated blood that follows neural activity by several seconds. Logothetis (2008), reviewing what fMRI can and cannot show, argued that the signal reflects the input and local processing of a brain area more than its output, and that it can confuse excitation with inhibition. Researchers infer neural activity from blood flow, and then infer a mental process from neural activity, so there are two steps between the data and the conclusion.
A further problem is reverse inference. Finding that the amygdala is active while participants view a photograph does not show that they felt fear, because the amygdala also responds to many other things, including anything new or emotionally important. A brain area becoming active is consistent with a mental process, but rarely specific to it.
Genes cannot be observed causing behaviour, so twin studies estimate genetic influence indirectly by comparing how often identical and non-identical twins share a trait. The result, a heritability estimate, is a statistic about the variation in a trait within one population in one environment. It is not a measure of how much of any individual’s behaviour is caused by genes, and it depends on assumptions, such as identical twins’ environments being no more similar than non-identical twins’ environments, that may not hold.
Cortisol in saliva, heart rate and skin conductance are used to measure stress and arousal. They avoid the problems of self-report, but cortisol varies across the day and with food and sleep, so sampling times must be controlled, and a physiological change is not the same as the experience of stress. People can show a large cortisol response and report feeling calm, or the reverse.
Virtual reality (VR) simulations allow behaviour to be measured in situations that would be impossible or unethical in real life. Slater et al. (2006) recreated Milgram’s obedience procedure with a computer-generated “learner” who appeared to suffer as participants gave her shocks. Although participants knew she was not real, many showed signs of stress and some stopped early. VR improves control and realism compared with a written scenario, but behaviour in a simulation may still differ from behaviour when real people and real consequences are involved.
The measurement of stressful life events shows how two operationalisations of the same construct can lead to different conclusions. Holmes and Rahe (1967) developed the Social Readjustment Rating Scale, a checklist of 43 life events, each given a number of “life change units” according to how much readjustment it was judged to require: death of a spouse scored 100, the highest value. A person’s stress score is the total of the events they have experienced.
The checklist is quick, standardised and easy to score, so it is reliable and allows large samples. Its validity is weaker. It assumes that an event means the same to everyone, but losing a job is a disaster for one person and a relief for another. In Rahe’s study of about 2,500 US Navy sailors, scores for the previous six months correlated with illness over the following six months at only about .12.
Brown and Harris (1978) took the opposite approach in their research on depression in women in Camberwell, London. Their Life Events and Difficulties Schedule is a semi-structured interview: trained interviewers collect a detailed account of each event and its circumstances, and a panel of raters judges how threatening it would be for a person in that situation. The method takes context into account and so has better construct validity, but it is slow, needs trained raters, and depends on the judgement of those raters, which must be checked through inter-rater reliability.
Many questions in psychology are about time: how behaviour develops, whether early experiences predict later outcomes, and whether an effect lasts. The way time is built into a study is itself a measurement decision, because it determines whether the data show change within people or only differences between them.
A longitudinal design follows the same people over months, years or decades. It measures change directly and shows which variables come first, which helps with questions of cause. Its costs are time, money and attrition: participants drop out, and those who leave are often different from those who stay. Measures can also become outdated during a long study, and repeated testing can change how participants respond.
A cross-sectional design is quicker and cheaper, so it can include large and varied samples. Its weakness is the cohort effect: a difference between 20-year-olds and 60-year-olds may reflect the different worlds they grew up in, such as schooling, diet or technology, rather than the effect of age. For this reason, cross-sectional data show differences between age groups rather than development within individuals.
A related distinction concerns when the information about the past is collected. Prospective research records experiences as they happen and then follows people forward to see what happens to them later. Retrospective research starts with people as they are now and asks them, or their records, about the past.

The Adverse Childhood Experiences (ACE) study by Felitti et al. (1998) is a well-known retrospective study. A questionnaire about seven categories of childhood adversity was mailed to 13,494 adults who had attended a medical clinic in California, and 9,508 (70.5%) responded. Adults who recalled four or more categories of adversity had a much higher risk of alcoholism, depression and suicide attempts than those who recalled none. The design made it possible to study thousands of people quickly, but the measure of childhood adversity was adults’ recall of events decades earlier.
Whether recall can stand in for a prospective record was tested directly by Baldwin et al. (2019). They found 16 studies, with 25,471 participants, that had measured childhood maltreatment both prospectively (for example, from records or reports made during childhood) and retrospectively (from adults’ own reports). Agreement was poor, with a kappa of 0.19 on a scale on which 1 is perfect agreement, and was somewhat better when the retrospective measure was an interview rather than a questionnaire. The two kinds of measure largely identified different people, so findings from one cannot simply be assumed to apply to the other.
Prospective cohort studies, such as the Dunedin study in New Zealand, which has followed about 1,000 people born in 1972–73 since birth, avoid this problem because experiences are recorded when they happen. They are, however, very expensive, take decades to produce results about adult outcomes, and are limited to the variables that were thought important when the study began.
Measurement does not end with collecting data. Researchers must decide whether a difference or relationship in their data reflects a real effect or chance variation. In psychology this decision usually uses statistical significance: a result is called significant if it would be unlikely to occur by chance if there were really no effect, with the usual threshold being p < 0.05, a probability of less than 5%.
This decision can go wrong in two ways, shown in the grid. Researchers start from a null hypothesis that there is no effect, and either reject it (concluding there is an effect) or retain it (concluding there is not). Either conclusion can be mistaken.
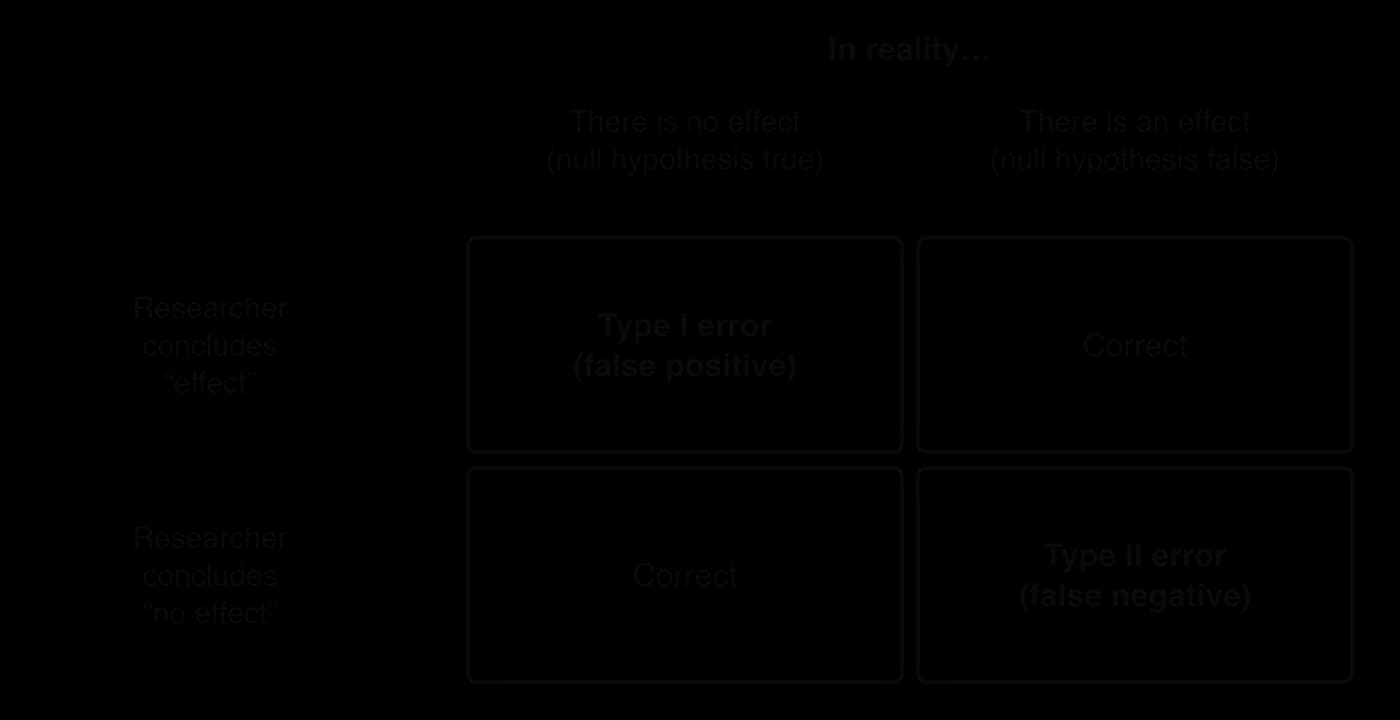
A type I error is more likely when many tests are run on the same data, because with a 5% threshold about one in twenty tests of non-existent effects will be significant by chance. Brain imaging is especially exposed to this, because a single scan contains tens of thousands of small units, each of which can be tested. Flexible analysis, trying different measures or exclusions until a significant result appears, also inflates type I errors.
A type II error is more likely with small samples, strict thresholds and unreliable measures, because random error hides real effects. Button et al. (2013) argued that the average statistical power of neuroscience studies is very low, so many real effects are missed. Low power also means that the significant results that are found, and published, tend to overestimate the size of effects.
The two errors trade off against each other. Lowering the threshold to p < 0.01 makes type I errors rarer but type II errors more common, and the reverse is true for a looser threshold. The most effective way to reduce both at once is better measurement and larger samples, which is why measurement quality and sample size are central to how far a finding can be trusted.
These errors connect measurement to the replication crisis. When the Open Science Collaboration (2015) repeated 100 published psychology studies, 97 of the originals had reported significant results but only about 36% of the replications did. Small samples, unreliable measures, flexible analysis and publication bias all make type I errors more common in the published record. Responses include stating hypotheses and analyses in advance (pre-registration), larger samples and reporting the size of effects as well as p values.
Because every measure has weaknesses, a conclusion is more convincing when it is supported by several measures with different weaknesses. If self-report, observation and a physiological measure all point the same way, it is unlikely that the result depends on a flaw in any one of them.
Type of triangulation | What is combined | Example |
|---|---|---|
Method triangulation | Different methods, such as questionnaire, interview and observation | Measuring adolescents’ eating attitudes with a questionnaire and exploring them in interviews |
Data triangulation | Different sources, times or places | Rating a child’s aggression from teacher reports, peer reports and playground observation |
Researcher triangulation | Several researchers collect or analyse the same data independently | Two researchers code the same interview transcripts and compare their themes |
Theory triangulation | Interpreting the data through more than one theory | Interpreting obesity data through both social learning and biological appetite regulation |
Triangulation is especially important in qualitative research, where credibility (how far the findings give a true picture of participants’ experience) cannot be shown by a reliability statistic. In a study of Fijian schoolgirls after the arrival of television, Becker et al. (2002) combined a standard questionnaire on eating attitudes with interviews, so that the rise in questionnaire scores could be checked against what the girls said about body ideals in their own words.
A measure developed in one culture may not mean the same thing in another. Questionnaire items have to be translated, but some ideas have no exact equivalent, and response styles differ: in some cultures people avoid the extreme points of a rating scale, in others they favour them. Distress is also expressed differently. In many cultures depression is described mainly through bodily symptoms such as tiredness, pain and poor sleep rather than sadness or guilt, so a questionnaire built around Western descriptions of mood can underestimate it.
Researchers therefore check measurement equivalence: whether a measure works in the same way, and measures the same construct, in each group being compared. Using a measure from one culture in another without such checks is an imposed etic approach, and differences in scores may then reflect the measure rather than the people. The Beck Depression Inventory, for example, has been translated and validated in many languages, including Arabic, Chinese, Japanese and isiXhosa, precisely because a translation alone does not guarantee a valid measure.
Each approach favours certain kinds of measure, which reflect its assumptions about what behaviour is. Comparing them shows that measurement links to perspective: choosing a measure is also choosing how to see the behaviour.
Approach | Typical measures | Key measurement question | Example |
|---|---|---|---|
Biological | Brain imaging, hormone levels, genetic testing, twin comparisons, animal models | Does a physical signal validly represent a psychological state? | fMRI infers activity from blood oxygen, not from neurons firing |
Cognitive | Reaction times, recall and recognition scores, error rates, false-belief tasks | Can unobservable mental processes be inferred from performance on tasks? | Loftus and Palmer (1974): memory distortion measured as a speed estimate |
Sociocultural | Surveys, observations, interviews, ethnography, cross-cultural scales | Does a measure mean the same thing in different groups and cultures? | Cultural dimensions measured with a work-values survey given in many countries |
Research methodology provides the shared tools for all three: operationalisation, the reliability and validity checks, the choice between quantitative and qualitative data, and statistical decisions about significance. The approaches differ mainly in what they treat as the most valid evidence, which is why combining their measures often gives a fuller picture than any one alone.
In this context, diagnosis is itself measurement. Whether a person has major depressive disorder is decided by a clinical interview or a symptom checklist, so figures for how common a disorder is, and for how well a treatment works, are only as good as these instruments. Outcomes of treatment are usually measured by self-report scales such as the BDI-II, which raises the question of whether a fall in scores reflects real recovery or participants’ wish to please the therapist who treated them.
Young children cannot complete questionnaires, so developmental research relies on observation and carefully designed tasks. Attachment is operationalised through infants’ behaviour in a standard sequence of separations and reunions, coded by trained observers, and theory of mind through false-belief tasks. In both cases the evaluation centres on construct validity (whether the task measures the construct or something else, such as temperament or language) and on whether a task designed in one culture measures the same thing elsewhere.
Love, attraction and relationship satisfaction are usually measured through self-report scales, which are quick but depend on how people wish to present their relationships. Researchers add observational measures, such as coding how couples speak to each other during a discussion of a disagreement, and biological measures such as hormone levels, which are difficult to measure accurately in blood or saliva. Each captures a different part of what a relationship is.
Memory, attention and decision-making are usually measured in controlled tasks, through recall, reaction time and errors. These measures are reliable and support causal conclusions, but often at the cost of ecological validity: remembering a word list in a laboratory is not the same as remembering a lesson or a conversation. Researchers increasingly add eye-tracking, brain recordings and studies in real classrooms to bring measures closer to real learning.
Concept | How measurement links to it |
|---|---|
Bias | Self-report invites participant bias such as social desirability; observation and coding invite researcher bias; measures built in one culture can be biased against others |
Causality | Unreliable measures hide real relationships; measuring at one time point cannot show which variable came first; multiple comparisons create false causal claims |
Change | Detecting change requires the same valid measure at several time points; changes in how something is measured can look like changes in behaviour |
Perspective | Each approach measures the construct it believes in: cortisol, negative thoughts or life events for the same “stress” |
Responsibility | Ethical choices affect measurement: anonymity can make self-report more honest; deception may be needed to avoid participants guessing the aim; feedback from a measure can affect participants |
These links often run in both directions. An ethical decision to let participants withdraw at any time can bias the sample that is finally measured, and a decision to measure covertly to avoid demand characteristics raises questions of consent. Measurement decisions are therefore rarely only technical, because each one also has consequences for bias and responsibility.
The Implicit Association Test (IAT) is one of the most widely used and most debated measures in psychology. It is a case study in how a construct that people may be unable or unwilling to report is operationalised, and in how reliability and validity are tested after a measure has become popular.
Greenwald, McGhee and Schwartz (1998) aimed to develop a measure of automatic associations between concepts, such as a social group and the idea of “good” or “bad”, that would not depend on what people are willing or able to say about their attitudes. They wanted a measure of implicit bias that self-report could not provide.
The IAT is a computer task in which participants sort words or pictures into categories as quickly as possible by pressing one of two keys. In one block, two categories that are assumed to be strongly associated share a key, for example flower names and pleasant words on the left, insect names and unpleasant words on the right. In another block the pairing is reversed, so that insect names share a key with pleasant words. The difference in average response time between the two blocks is the IAT score, operationalising the strength of an association as a difference in milliseconds.
The original paper reported three experiments with university students. The first used flowers and insects, which almost everyone evaluates differently. The second tested Japanese and Korean participants with Japanese and Korean surnames, to see whether the IAT detected the expected preference for one’s own group. The third tested White participants who described themselves as unprejudiced, using typically White and typically Black first names.
In all three experiments responses were faster when the “expected” categories shared a key. Participants sorted faster when flowers were paired with pleasant words than when insects were; Japanese and Korean participants each showed a stronger positive association with their own group’s names; and White participants who reported no prejudice still responded faster when White names were paired with pleasant words. The researchers concluded that the IAT detected associations that participants did not report, or did not know they had.
Later research tested the measure’s quality. Test–retest reliability across studies has been about .6. In a meta-analysis of 122 research reports with about 14,900 participants, Greenwald et al. (2009) found that IAT scores correlated with behaviour, judgements and physiological responses at an average of r = .27, while self-report measures correlated at .36. Self-report predicted less well for socially sensitive topics, and for interracial behaviour the IAT predicted better than self-report.
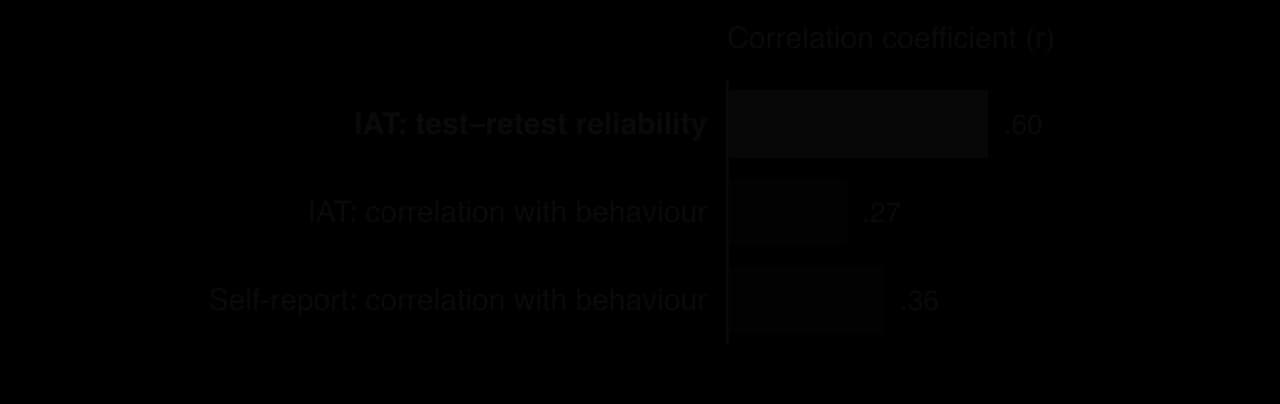
Other researchers reached more critical conclusions. Oswald et al. (2013) re-analysed studies of racial and ethnic discrimination and concluded that IATs were poor predictors of every kind of discriminatory behaviour except brain activity, and no better than simple self-report measures. Forscher et al. (2019) combined 492 studies with 87,418 participants that had tried to change people’s IAT scores. Scores could be changed, though only weakly, and the changes did not lead to changes in behaviour.
The IAT records a consistent effect, because people do respond faster to some pairings than others, and this appears across many groups. Whether that something is a personal attitude that drives behaviour is much less certain. The evidence supports using the IAT to study associations at the level of groups, and does not support using one person’s score to judge that person’s prejudice.
A test–retest reliability of about .6 means that a person’s score can change considerably from one day to the next, which is well below the consistency expected of tests used to make decisions about individuals. Construct validity is also disputed. A faster response to one pairing may reflect a personal attitude, but it may also reflect familiarity with the categories, knowledge of stereotypes common in one’s culture without agreeing with them, or general skill at switching between tasks, so the same reaction-time difference is compatible with several constructs.
Because the IAT may pick up associations learned from a culture rather than personal beliefs, members of a group can show negative associations with their own group, and people who reject a stereotype can still produce a score that suggests they hold it. Interpreting such scores as personal bias risks attributing to individuals what may be a feature of the culture they live in.
Large numbers of people have taken the IAT online through Project Implicit and received feedback describing their level of automatic preference. Given the measure’s limited reliability and predictive validity, such feedback may mislead people about themselves. The test has also been used to justify implicit bias training in workplaces, although Forscher et al. (2019) found that changing IAT scores did not change behaviour. Researchers have a responsibility to communicate the limits of a measure as clearly as its findings.
Sources: Greenwald, A. G., McGhee, D. E., & Schwartz, J. L. K. (1998). Measuring individual differences in implicit cognition: The Implicit Association Test. _Journal of Personality and Social Psychology, 74(6), 1464–1480. Greenwald, A. G., Poehlman, T. A., Uhlmann, E. L., & Banaji, M. R. (2009). Journal of Personality and Social Psychology, 97(1), 17–41._
Measurement can be the concept named in a Paper 1 Section C question, and it is one of the concepts most often useful in Paper 2: for explaining your class practical, and for evaluating the unseen study in Section B, where the way the study measured its variables is usually its most open feature.
Measurement represents unobservable constructs as data through operationalisation; every conclusion is limited by the quality of its measures.
Operationalisation trades precision and reliability against breadth and validity.
Data can be quantitative or qualitative, and evidence anecdotal, empirical or self-reported; mixed methods and content analysis extend what can be measured.
Reliability is consistency (test–retest, inter-rater, internal consistency); validity is measuring the right thing (face, content, construct, criterion). Reliability is necessary but not sufficient for validity.
Brain imaging, twin studies and physiological measures are indirect: each infers a psychological process from a physical signal.
Longitudinal and prospective designs measure change and the order of events; cross-sectional and retrospective designs are quicker but measure differences or recall.
A type I error is a false positive and a type II error a false negative; small samples, unreliable measures and many tests make errors more likely.
Triangulation combines measures with different weaknesses, increasing credibility.
The IAT measures response-time differences reliably enough for group research, but its reliability for individuals and its validity as a predictor of behaviour are limited.
I can explain how a construct is operationalised, and the trade-offs involved.
I can compare and contrast quantitative, qualitative, self-reported, anecdotal and empirical data.
I can explain the types of reliability and validity and apply them to a study.
I can explain why brain imaging, twin studies and physiological measures are indirect.
I can compare and contrast longitudinal and cross-sectional designs, and prospective and retrospective research.
I can explain type I and type II errors and what makes each more likely.
I can describe how triangulation and content analysis are used.
I can evaluate the Implicit Association Test with reference to reliability, validity and responsibility.