Notes on 4.3 Human and physical influences on global interactions
Learning objectives
Describe the levels of economic integration and the aims of multi-governmental organisations such as the EU, USMCA, RCEP and the AfCFTA.
Explain how MGOs, the WTO, free trade zones and special economic zones influence flows of trade, investment and people.
Distinguish between points-based systems, employer-sponsored visas, free movement and guest-worker schemes such as the kafala system, and explain their effects on migration flows.
Explain the “shrinking world” using the concepts of time–space convergence and time–space compression.
Describe how transport developments, including containerisation, canals and hub-and-spoke air networks, have changed global interactions.
Analyse patterns and trends in data flows, submarine cables and internet use, including the digital divide.
Examine how natural resource availability attracts global interactions and why it can lead to a resource curse.
Evaluate the limiting effect of geographic isolation at global, national and local scales, using small island developing states and landlocked developing countries.
Examine how political, technological and physical processes interlink to speed up or slow down globalisation.
Introduction
Global flows do not move freely across a featureless world. Their speed, size and direction are shaped by political decisions (trade agreements, tariffs and migration rules), by technology (ships, aircraft, cables and the internet) and by the physical environment (where resources are found and how isolated a place is). These influences on globalisation explain why a container of electronics can cross the Pacific for a few hundred dollars while a landlocked country in Africa pays more than twice as much as its coastal neighbours to export one.
The emphasis is on process: the mechanisms that speed up or slow down global interactions. The processes interact with power, because governments and multi-governmental organisations set the rules, and with place, because the same technology connects some places far more than others. The influences studied here act on the flows of trade, investment, people and data described for global networks and flows, and they link forward to the ways in which places resist global interactions, through protectionism (shielding domestic producers from foreign competition with tariffs and other barriers) or controls on the internet, and to the risks created by dependence on networks, such as cybercrime.
Multi-governmental organisations and trade blocs
A multi-governmental organisation (MGO) is an organisation whose members are the governments of several countries, which agree to co-operate and to follow shared rules. Some MGOs, such as the UN, cover many issues; others focus on trade and economic integration. A trade bloc is a group of countries that agree to reduce or remove barriers to trade between themselves, usually tariffs (taxes on imports) and quotas (limits on the quantity imported).
Trade blocs grew rapidly after the 1990s because governments saw free trade as a way to attract investment and to give their firms access to larger markets. Almost every country now belongs to at least one, and many belong to several at once.
Levels of economic integration
Trade blocs differ in how deeply their members integrate. Each level adds rules to the one before, and each gives up a little more national control over economic policy.
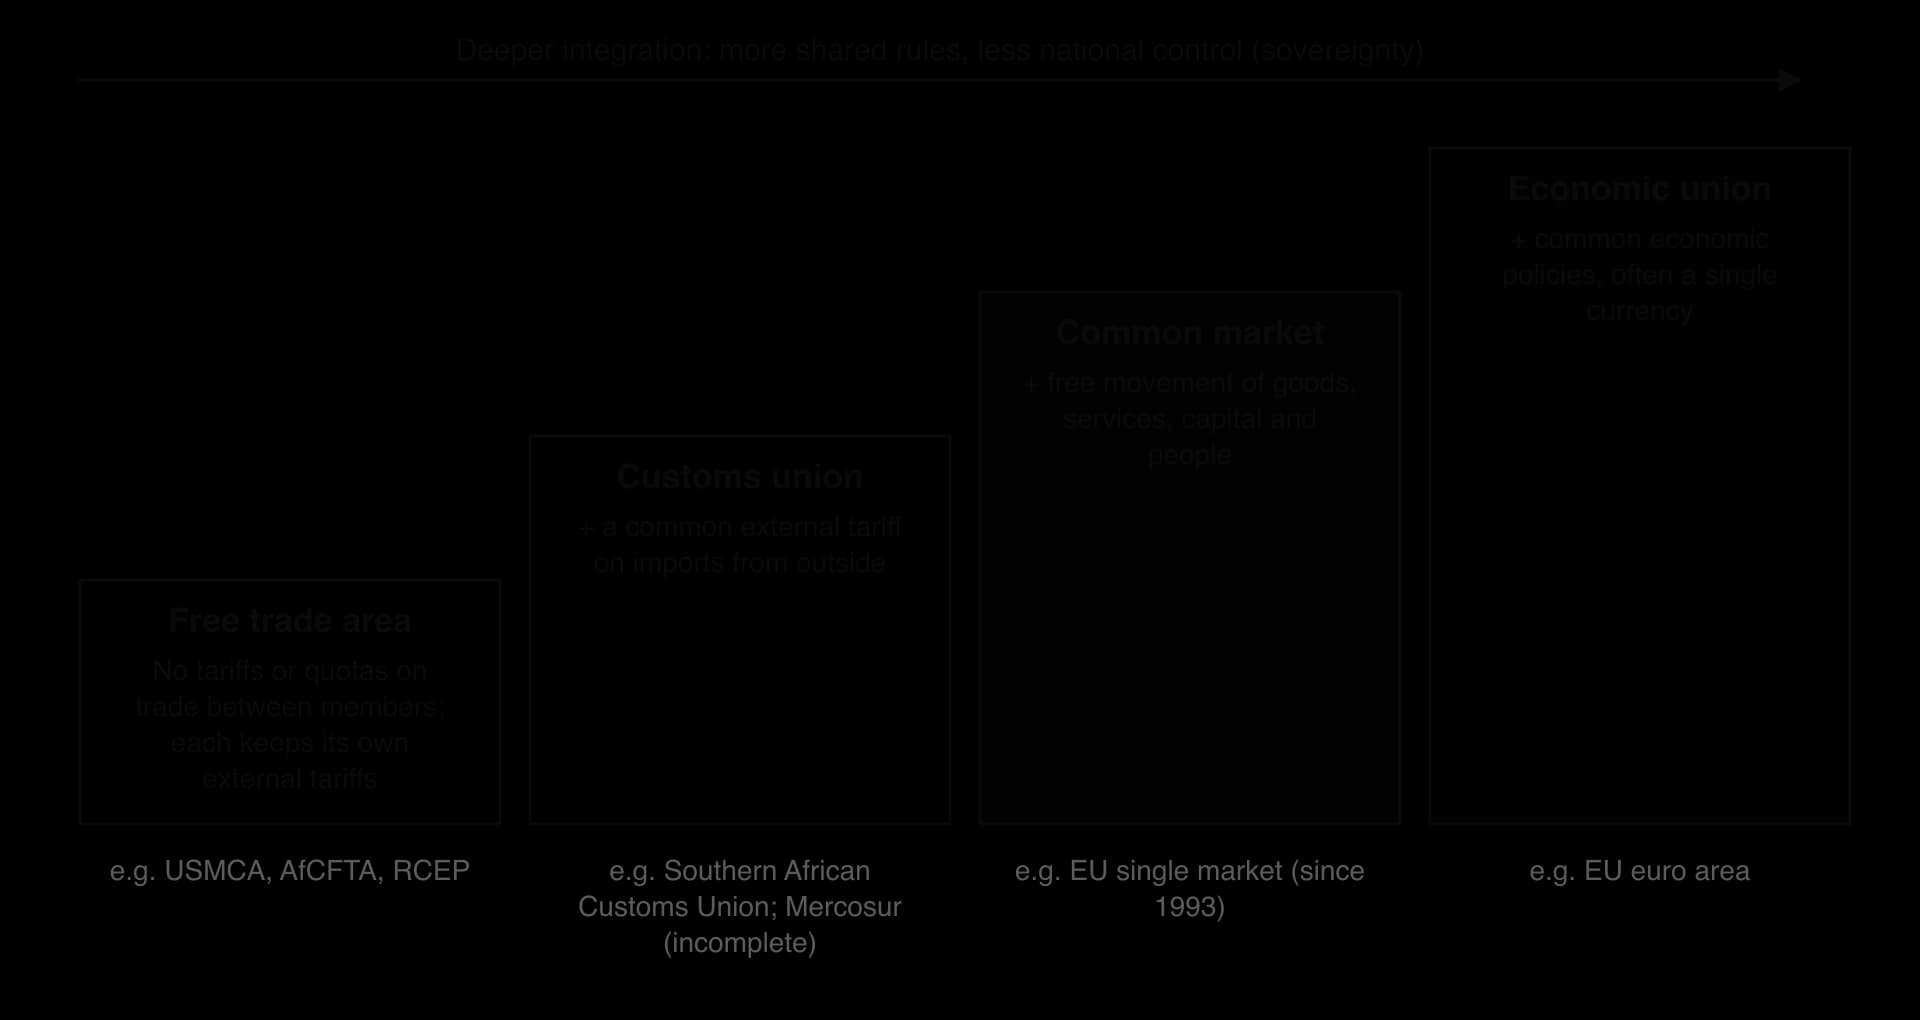
In a free trade area, members remove tariffs on goods traded between them, but each keeps its own tariffs on imports from outside. This creates a problem: goods could enter through the member with the lowest external tariff and then move tariff-free to the others, so free trade areas need rules of origin stating how much of a product must be made inside the bloc to qualify.
A customs union adds a common external tariff, so imports from outside pay the same duty whichever member they enter, and rules of origin are no longer needed. The Southern African Customs Union, which links South Africa, Botswana, Eswatini, Lesotho and Namibia, is the oldest customs union in the world.
A common market adds free movement of the factors of production: goods, services, capital and people. The EU’s single market, completed in 1993, is the main example. An economic union goes further, with common economic policies and often a single currency, as in the euro area.
Few blocs have gone beyond a common market. Twenty-one of the EU’s members used the euro in 2026, after Bulgaria joined on 1 January 2026, with monetary policy set by the European Central Bank in Frankfurt.
Examples of MGOs and trade blocs
MGO or bloc | Members and size | Level | Key features and recent changes |
|---|---|---|---|
European Union (EU) | 27 member states | Economic union (most members use the euro) | Single market since 1993; Schengen Area without border checks; the UK voted to leave on 23 June 2016 (51.9% Leave) and left on 31 January 2020 |
United States–Mexico–Canada Agreement (USMCA) | USA, Mexico, Canada | Free trade area | Replaced NAFTA in July 2020; stricter rules of origin for cars; drives near-shoring to Mexico |
Regional Comprehensive Economic Partnership (RCEP) | 15 Asia-Pacific countries, including China, Japan, South Korea, Australia and the ten ASEAN members | Free trade area | Signed November 2020, in force from 1 January 2022; about 30% of world population and GDP, the largest trade bloc; India withdrew from negotiations |
Mercosur | Argentina, Brazil, Paraguay, Uruguay, Bolivia (full member since 2024) | Customs union (incomplete) | Founded 1991; common external tariff with many exceptions |
African Continental Free Trade Area (AfCFTA) | 54 signatories, about 1.3 billion people | Free trade area | Trading began 1 January 2021; tariffs on 90% of goods to be removed over 5–13 years |
The table shows that integration varies with place. The EU is the deepest example in the world, with shared institutions, a parliament and a court; most other blocs are free trade areas that leave far more power with national governments. Blocs also overlap: Vietnam, for example, belongs to ASEAN, RCEP and a separate agreement with the EU.
Brexit: integration in reverse
The United Kingdom’s departure from the EU shows that integration can be reversed. After the referendum of 23 June 2016, in which 51.9% voted to leave, the UK left on 31 January 2020 and the transition period ended on 31 December 2020. The EU–UK Trade and Cooperation Agreement kept tariff-free trade in goods that meet rules of origin, but the UK left the single market and the customs union.
Exporters now face customs declarations, checks on food and rules-of-origin paperwork, and free movement of people between the UK and the EU ended. For supporters of Brexit, the gain was control over laws, trade policy and immigration; for critics, the cost was more friction in trade with the UK’s largest partner.
Sources: Wikipedia, “Brexit” and “Regional Comprehensive Economic Partnership”, 2026.
The World Trade Organization
The World Trade Organization (WTO) is the global MGO that sets and enforces rules for trade between nations. It was founded on 1 January 1995, replacing the General Agreement on Tariffs and Trade (GATT) of 1947, and has its headquarters in Geneva. Its 166 members account for over 98% of world trade.
The WTO’s central rule is most-favoured nation treatment: a member that lowers its tariffs for one member must do the same for all, except within free trade agreements and in preferences for lower-income countries. China joined in 2001, and its entry opened the way for the rapid growth of its exports and the global shift of manufacturing.
The WTO has become weaker. The Doha Round of negotiations, launched in 2001, stalled over farm subsidies and the demands of developing countries. Since 2019 the WTO’s Appellate Body has been unable to hear appeals, because the USA has blocked the appointment of its judges, so disputes can no longer be settled with final rulings. Rising use of tariffs, including those imposed by the USA from 2018 and again in 2025, shows that national governments can still override global rules when they choose.
The effects of MGOs on global interactions
Flow or issue | Effects of trade blocs and the WTO | Example |
|---|---|---|
Trade | Lower tariffs increase trade between members (trade creation), but may divert trade away from cheaper outside suppliers (trade diversion) | Intra-EU trade dominates EU members’ trade |
FDI | Firms invest inside a bloc to reach the whole market without tariffs | Car and electronics plants in Mexico supplying the USA under USMCA |
Migration | Common markets allow free movement of workers | Polish and Romanian workers in Germany and, before 2021, the UK |
Sovereignty | Members give up some control over tariffs, standards and laws | The EU’s single market rules; Brexit as a reaction |
A country’s sovereignty, its authority to govern itself, is pooled in deeper blocs. This is the main source of debate about them: supporters see shared rules as a way to gain influence and markets, critics as a loss of democratic control. Trade agreements also create winners and losers within countries, such as consumers and exporters who gain and workers in industries exposed to cheaper imports who may lose their jobs.
Free trade zones and special economic zones
A free trade zone is a defined area inside a country, usually near a port or airport, where goods can be imported, stored, processed and re-exported without paying customs duties, and often with simpler regulations. A special economic zone (SEZ) is a broader area in which the government offers incentives such as tax breaks, cheaper land and eased labour or investment rules to attract foreign direct investment (investment by firms in businesses they control abroad) and boost exports. Both are political tools that governments use to plug their economies into global networks.
Shenzhen: the first SEZ in China
Shenzhen, in Guangdong province next to Hong Kong, was made one of China’s first four SEZs in 1980, as part of Deng Xiaoping’s policy of reform and opening up; the others were Zhuhai, Shantou and Xiamen. Foreign investors, mostly from Hong Kong and Singapore at first, received tax incentives, low labour costs and simpler rules for trade.
In 1980 the area had roughly 300,000 residents, about 30,000 of them in the original market town; by 2000 the population was about 4.33 million, and the official count in 2007 was 8.6 million. Shenzhen grew from assembly work for foreign firms into a centre of technology firms such as Huawei and Tencent, and its success led China to create many more zones.
Jebel Ali Free Zone, Dubai
The Jebel Ali Free Zone (Jafza) opened in 1985 with 19 companies beside Dubai’s Jebel Ali port, the largest deep-sea port in the region. It now covers 57 km² and hosts more than 11,000 businesses from over 150 countries. It accounts for almost 32% of the FDI flowing into the United Arab Emirates and supports more than 144,000 jobs. It has helped Dubai to become a hub for trade between Asia, Africa and Europe, and an example of a state with limited oil reserves using a free zone to diversify its economy.
Mexico’s maquiladoras
Mexico’s maquiladora programme, begun in 1965, allowed foreign-owned factories near the US border to import components duty-free, assemble them and export the products back to the USA. Cities such as Tijuana and Ciudad Juárez grew around these plants, which today supply cars, electronics and medical devices under USMCA.
Benefits of free trade zones and SEZs | Criticisms |
|---|---|
Attract FDI, technology and skills | Tax breaks reduce government revenue; zones may compete with each other in a “race to the bottom” |
Create jobs and export earnings | Weak labour rights and low wages in some zones |
Allow a government to test reforms in one area first (Shenzhen) | Can become enclaves with few links to the rest of the economy |
Make a country part of global supply chains | Some free zones are used to relabel and move counterfeit goods |
Sources: Wikipedia, “Shenzhen Special Economic Zone” and “Jebel Ali Free Zone”, 2026.
Economic migration controls and rules
Flows of goods and money have become freer since the 1990s, but flows of people remain tightly controlled. Every country decides who may enter, for how long and with what rights to work, settle and bring family. These rules shape the size and direction of flows of economic migrants, and through them the flows of remittances and skills between places.
Points-based systems
A points-based immigration system awards points for characteristics that the government values, such as a job offer, skills, qualifications, language ability, age and salary. Applicants who reach a threshold may apply for a visa. Canada introduced the first points-based system in 1967, and Australia and New Zealand followed; Canada’s Express Entry system has selected skilled migrants online since January 2015.
The United Kingdom adopted a points-based system for all applicants from 1 January 2021, when free movement with the EU ended. Applicants for a skilled worker visa needed 70 points. Fifty were mandatory: a job offer from an approved sponsor (20), a job at the required skill level (20) and the required level of English (10). The rest could be “traded”, for example a salary of at least £25,600 (20 points) or a job in a shortage occupation (20 points).
The rules have since been tightened. The general salary threshold for a skilled worker visa rose to £38,700 in 2024 and to £41,700 from 22 July 2025, with lower thresholds for some health, care and education jobs. Such changes reduce the number of eligible migrants and shift flows towards the highest-paid occupations, but they can create labour shortages in sectors such as social care that depended on recruitment from abroad.
Employer-sponsored visas
In employer-sponsored systems, the employer applies for the worker. The US H-1B visa for specialist occupations has an annual cap of 65,000, plus 20,000 for holders of advanced US degrees. Demand far exceeds the cap, so places are allocated by lottery: in the 2024 financial year there were 758,994 eligible registrations and 110,791 selections. Indian IT firms are among the largest users.
On 19 September 2025 a presidential proclamation required employers to pay a one-time fee of US$100,000 for new H-1B applications; on 8 June 2026 a federal judge in Boston ruled that the fee was unlawful, although the ruling was paused a few days later pending an appeal. Rules like these show how quickly a single government decision can change a migration flow between two countries.
Free movement within blocs
Free movement allows citizens of member states to live and work in any other member state without a visa. It is a feature of common markets such as the EU, where it led to large flows from Poland, Romania and other new member states to Germany, the UK and Ireland after the enlargements of 2004 and 2007. The Economic Community of West African States (ECOWAS) also allows visa-free travel and residence for its citizens, although its rules are less fully applied.
Guest-worker schemes and the kafala system
Some countries admit large numbers of temporary workers on contracts but give them few rights to settle or bring their families. The Gulf states depend heavily on such workers: in 2025 foreign workers made up about 95% of Qatar’s labour force. Most are employed under the kafala system, in which a worker’s visa and legal residence are tied to a single sponsor, usually the employer, who can control whether the worker changes job or leaves the country.
The system channels huge flows of workers and remittances from South Asia, Southeast Asia and East Africa to the Gulf, but it gives employers great power over workers.
Human rights organisations have documented passport confiscation, unpaid wages, excessive hours and abuse, especially of domestic workers. Reforms have been introduced: Qatar removed exit permits and the need for an employer’s permission to change jobs and extended a minimum wage to all workers between 2014 and 2021, and Saudi Arabia’s labour reforms took effect in March 2021. Human Rights Watch and Amnesty International said in 2025 that the reforms in Qatar had had limited effect, and Saudi Arabia’s announcement in June 2025 that it was abolishing kafala was disputed by migrant-rights groups.
Effects of migration rules on source and host countries
Type of rule | Effect on flows | Host country | Source country |
|---|---|---|---|
Points-based (UK, Canada, Australia) | Selects skilled, well-paid migrants | Gains skills and tax revenue; shortages in low-paid sectors | Loses skilled workers (brain drain) but gains remittances and returnees with skills |
Employer-sponsored (US H-1B) | Flows follow employers’ demand; capped | Firms fill specialist jobs | Large flows from India; remittances; diaspora links with US firms |
Free movement (EU, ECOWAS) | Large, flexible flows that respond to wages and jobs | Fills labour shortages quickly; political debate over numbers | Young workers leave; remittances; population decline in some regions |
Guest-worker and kafala (Gulf states) | Very large temporary flows; few rights to settle | Labour for construction and services; small citizen workforce | Remittances (Nepal, Bangladesh, the Philippines); risks of exploitation |
Migration rules also show how unequal power over global flows is. A citizen of Japan or Germany can enter well over 100 countries without a visa, while a citizen of Afghanistan or Somalia can enter very few. Rules made in host countries therefore decide much of the size and direction of migration, and of the remittances that follow it.
Sources: UK Home Office, “The UK’s points-based immigration system: policy statement”, 2020; EP Advisory, skilled worker thresholds, 2025; Wikipedia, “Points-based immigration system”, “H-1B visa” and “Kafala system”, 2026.
The shrinking world
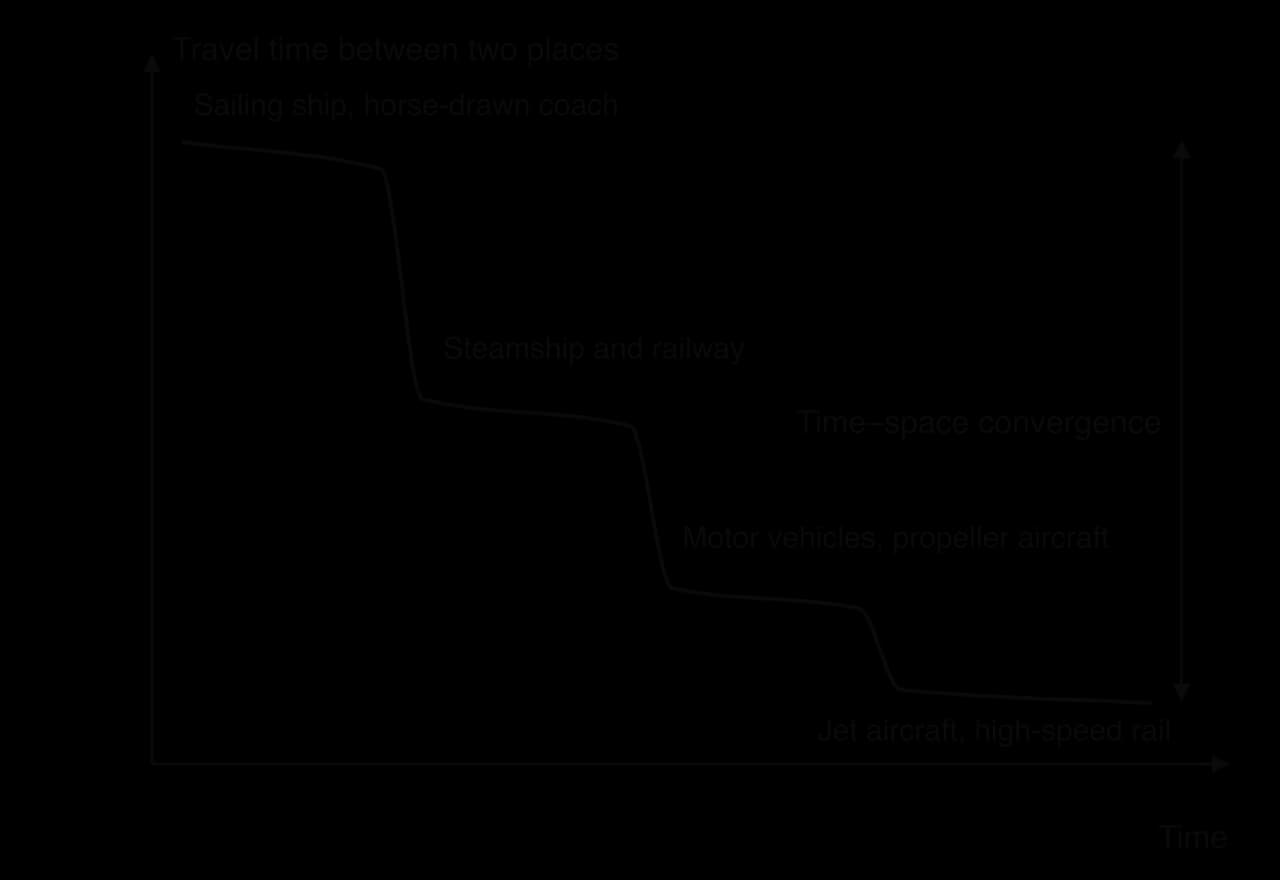
The idea of a shrinking world describes how improvements in transport and communication have made distant places feel closer, because the time and cost of moving between them have fallen. The physical distance between places stays the same, while the time and cost of covering it fall. In the 1750s a stagecoach journey from London to Edinburgh took ten to twelve days; today the same journey takes under five hours by train.
Time–space convergence
The geographer Donald Janelle introduced the term time–space convergence in the late 1960s for the rate at which places “move closer together” in travel time as transport improves. It can be measured as the reduction in travel time between two places per year. The concept explains why the most connected places, such as large cities joined by high-speed rail or direct flights, converge fastest, while places off the main networks converge slowly or not at all.
Time–space compression
Time–space compression is a broader idea, developed by David Harvey in The Condition of Postmodernity (1989). It describes how the speeding up of transport, communication and capital flows changes the experience of time and space itself: events in one place have almost instant effects elsewhere, financial markets react in seconds, and people’s lives are linked to distant places through media and supply chains. Harvey traced the idea to Karl Marx’s phrase about the “annihilation of space by time”.
The geographer Doreen Massey argued that time–space compression is experienced very unequally, a point she called its “power geometry”. A business traveller flying between London and Singapore experiences a shrinking world; a refugee or a farmer in a remote area without roads or internet may experience the opposite, as the places around them become more connected and they are left further behind.
Forces driving technological innovation
Competition between firms: shipping lines build larger ships to cut the cost per container; airlines adopt more fuel-efficient aircraft.
Research and development: universities and firms invest in new materials, engines and electronics; TNCs such as Apple, Google and Huawei spend billions on R&D each year.
State and military investment: the internet began as a US defence research network, ARPANET, in 1969, and satellite navigation (GPS) was developed by the US military.
Market demand: consumers want faster delivery and cheaper communication, which rewards firms that provide them.
Global interaction itself: more trade and migration create demand for better transport and communication, which in turn allows more interaction (a positive feedback).
Transport developments over time
Transport technology has changed global interactions in a series of revolutions. Each reduced the cost and time of moving goods and people, and each made new places part of global networks.
Period | Development | Effect on global interactions |
|---|---|---|
19th century | Steamships and railways | Regular, scheduled voyages independent of wind; railways opened continental interiors to trade; mass migration to the Americas |
1869 and 1914 | Suez Canal and Panama Canal | Shortened sea routes between Europe and Asia and between the Atlantic and the Pacific |
1950s–1960s | Jet aircraft | Fast international passenger travel; growth of international tourism and air freight for high-value goods |
From 1956 | Containerisation | Cut the cost and time of handling cargo; made global supply chains possible |
From the 1970s | Hub-and-spoke air networks; low-cost airlines from the 1990s | Cheaper flights between many more cities; growth of hub airports |
2016 | Panama Canal’s new locks | Allowed Neopanamax ships of up to about 14,500 TEU to pass |
Containerisation
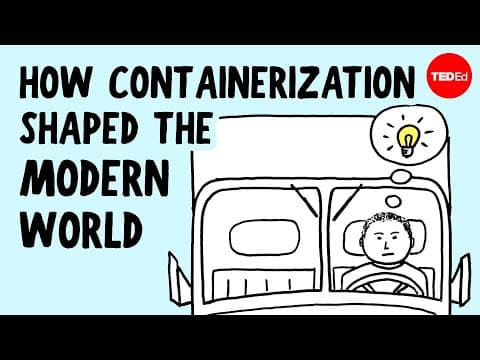
Containerisation, the transport of goods in standard steel containers that can be moved between ships, trains and trucks without being unpacked, is often described as the most important transport innovation for globalisation. Its effect on trade was enormous. On 26 April 1956 the American trucking businessman Malcom McLean loaded 58 containers onto the converted tanker Ideal X in Newark, New Jersey, and shipped them to Houston, Texas. Before containers, ships were loaded by hand, piece by piece, which was slow, expensive and allowed theft and damage.
The key step was standardisation. In 1968 the International Organization for Standardization published ISO 668, which set the dimensions of containers, so that any container could be handled by any crane, ship, train or truck in the world. Capacity is now measured in twenty-foot equivalent units (TEU): one TEU is a standard container 20 feet (about 6.1 m) long and 8 feet (about 2.4 m) wide. About 90% of the world’s non-bulk cargo now travels by container ship.
Ships have grown enormously. The table shows the main size classes of container ships. The largest, the MSC Irina class delivered from 2023, can carry 24,346 TEU. Larger ships cut the cost of carrying each container, but they need deep-water ports, huge cranes and wide channels, so only a few ports, such as Shanghai, Singapore, Rotterdam and Busan, can handle them. This concentrates trade in large hub ports and makes smaller ports feeders.
Class | Capacity (TEU) | Limited by |
|---|---|---|
Panamax | 3,001–5,100 | The original Panama Canal locks (beam up to 32.31 m) |
Post-Panamax | 5,101–10,000 | Too wide for the original locks |
Neopanamax | 10,000–14,500 | The new locks opened in June 2016 (about 366 m long, 49 m beam) |
Ultra large container vessel (ULCV) | 14,501 and above (MSC Irina class: 24,346) | Port depth, cranes, the Suez Canal and narrow straits |
 YouTube
Canals
Canals shorten sea routes between oceans. The Suez Canal, opened in 1869, cut the voyage from Europe to Asia by avoiding the route around southern Africa. The Panama Canal, opened in 1914, linked the Atlantic and Pacific without the voyage around South America. Its new, larger locks opened on 26 June 2016 for Neopanamax ships, so that much larger container ships and liquefied natural gas carriers could pass. Canals and narrow straits are also chokepoints, where the interruption of a single route affects trade worldwide.
Hub-and-spoke networks and low-cost airlines
In a hub-and-spoke network, routes from many smaller places (the spokes) all connect to one central place (the hub), where passengers or goods transfer. Large airlines organise their networks around hubs such as Dubai, Doha, Istanbul, Frankfurt and Atlanta, and the same pattern applies to shipping, with feeder ships linking small ports to hub ports such as Singapore.
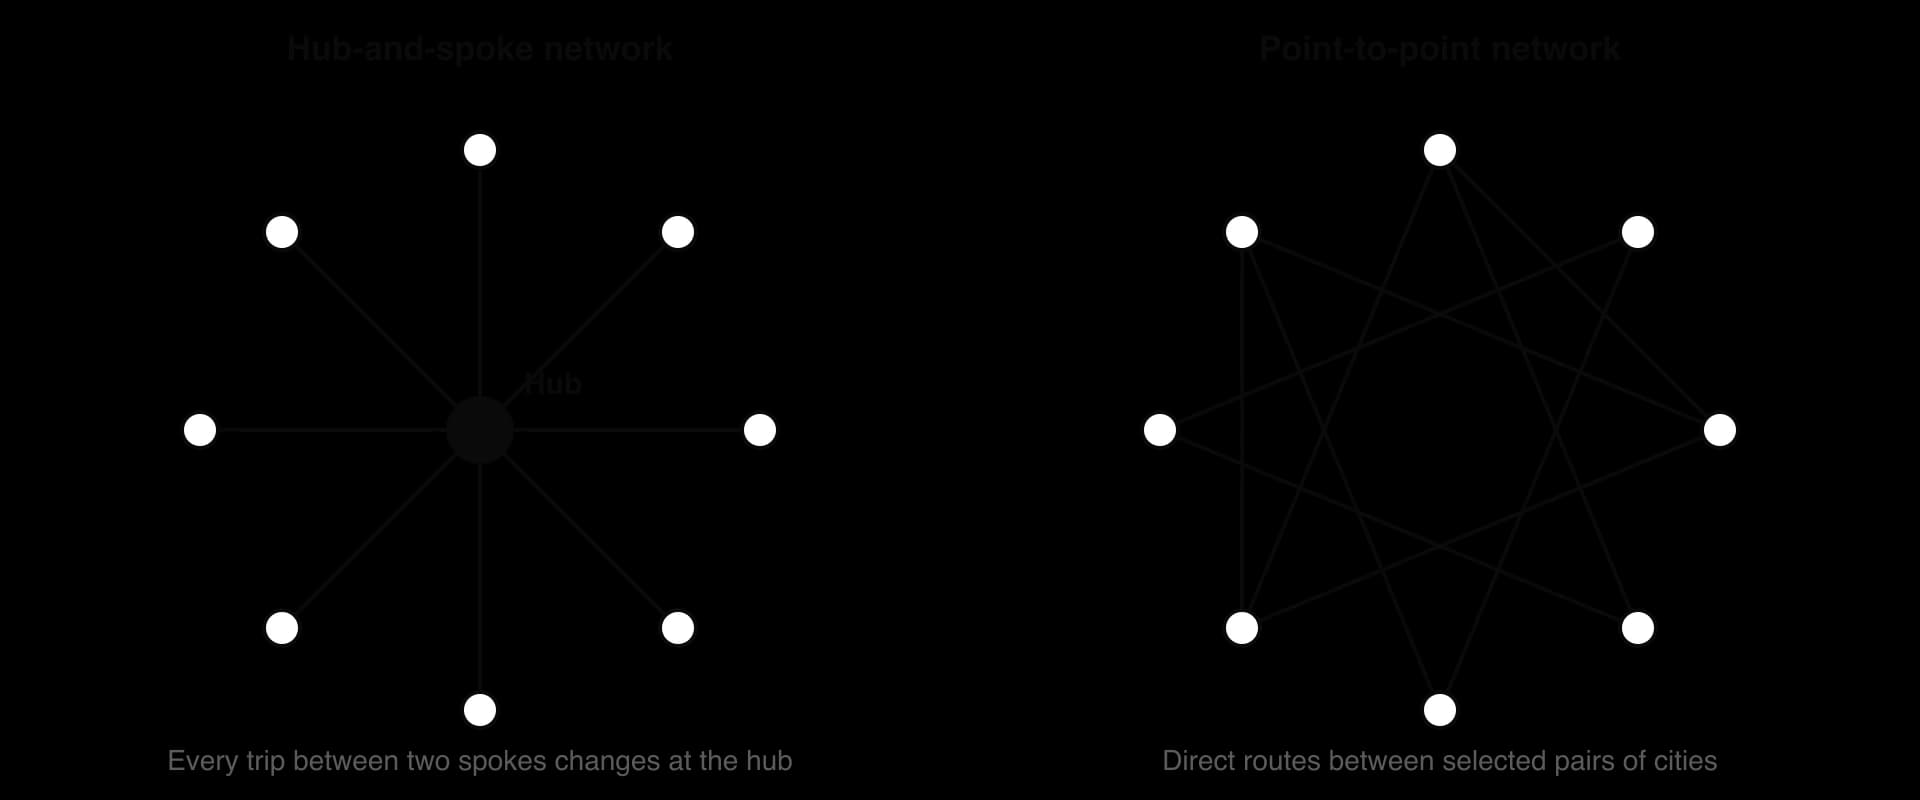
Hub-and-spoke networks connect many places efficiently, because each spoke needs only one route, and they allow airlines to fill large aircraft by combining passengers from many places. Their weakness is that every journey between two spokes needs a change, and disruption at the hub spreads through the whole network. Low-cost airlines such as Ryanair, easyJet, AirAsia and IndiGo use point-to-point routes between secondary airports, with lower fares and no transfers. Together, the two models have made air travel available to far more people and cities, and they help to explain the growth of international tourism and business travel since the 1990s.
Sources: Wikipedia, “Containerization” and “Container ship”, 2026.
Data flows and communication infrastructure
Information and communications technology (ICT) includes the cables, satellites, mobile networks, data centres, devices and software that store and transmit information. A data flow is the movement of digital information between places: emails, video calls and streaming, financial transactions, the data that TNCs use to run their supply chains, and the cloud services that store it. Data flows now link places as strongly as flows of goods and money, and they are growing much faster.
Data flows have three distinctive features. They are almost instantaneous over any distance, they have very low costs for each extra unit sent, and they can be stopped or redirected by the governments and firms that control the infrastructure. They therefore speed up other flows, because a TNC can co-ordinate design in California and assembly in Zhengzhou in real time, but they also create new forms of dependence.
Submarine cables
Almost all international data travels through submarine cables: fibre-optic cables laid on the sea floor between landing stations on the coast. In 2026 there were more than 600 active and planned cable systems with a total length of over 1.5 million km. Some are very long: the Asia America Gateway, linking South-East Asia with the USA, is about 20,000 km long. Satellites carry only a very small share of international traffic, about 0.37% of US international capacity, because a fibre cable can carry far more data at much lower cost.
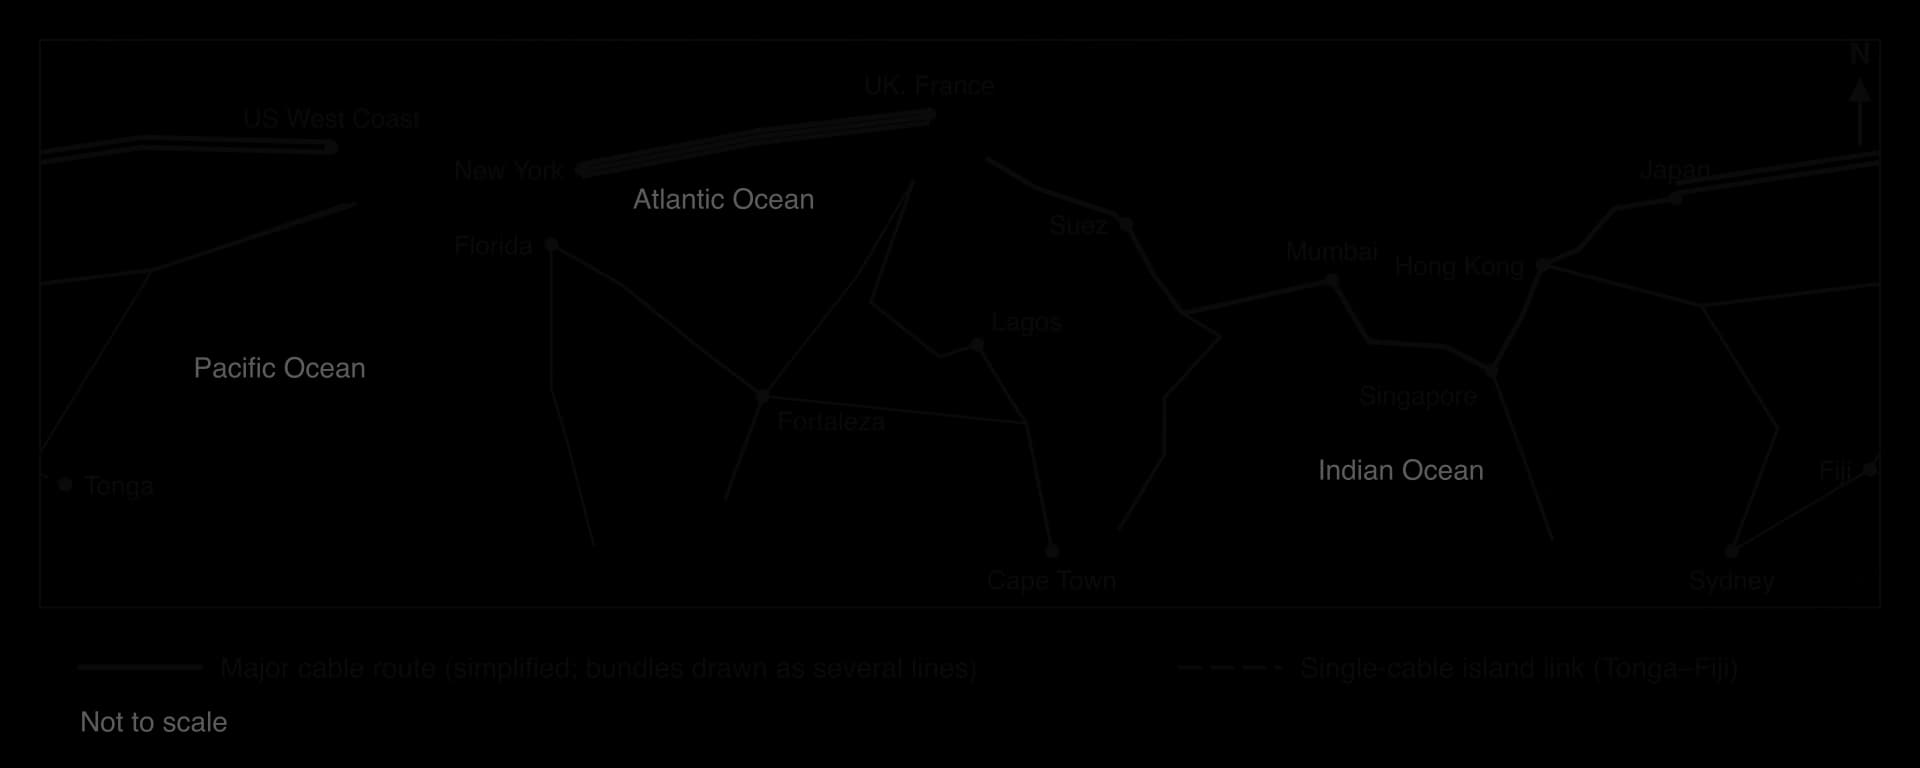
The pattern of cables mirrors the pattern of economic power. The densest routes join North America, Europe and East Asia, while Africa, South America and the Pacific are served by fewer cables, so they have less capacity and fewer alternatives if one is damaged. Ownership has changed: cables were once built by groups of telecommunications companies, but content providers such as Google, Meta, Microsoft and Amazon are now major investors and own their own cables, so a few TNCs control a growing share of the world’s data infrastructure.
Cables are vulnerable. About 200 faults occur each year, two-thirds of them caused by fishing gear and ship anchors. Places with only one or two cables are most at risk: when the Hunga Tonga–Hunga Haʻapai volcano erupted on 15 January 2022, Tonga’s only international cable, linking it to Fiji, was broken in several places, and the country was cut off from the internet, apart from limited satellite links, for about five weeks, until the cable was repaired on 22 February.
Data centres, satellites and mobile networks
Data are stored and processed in data centres, large buildings full of servers that need cheap, reliable electricity and cooling. They cluster near cable landing points and in places with cheap energy and stable politics, such as northern Virginia in the USA, Ireland, the Netherlands and Singapore. Low-orbit satellite networks such as Starlink now offer broadband in remote areas and on ships, but they remain more expensive than fixed and mobile networks. For most people in lower-income countries, the internet arrives through mobile broadband on a smartphone rather than a fixed line.
Patterns and trends in internet use
About 6 billion people, 74% of the world’s population, were using the internet in 2025, up from 5.8 billion in 2024, according to the International Telecommunication Union (ITU). Around 2.2 billion people remained offline, mostly in low- and middle-income countries. Use was 94% in high-income countries but 23% in low-income countries, and 36% in Africa compared with 88–93% in Europe, the Americas and the CIS countries.
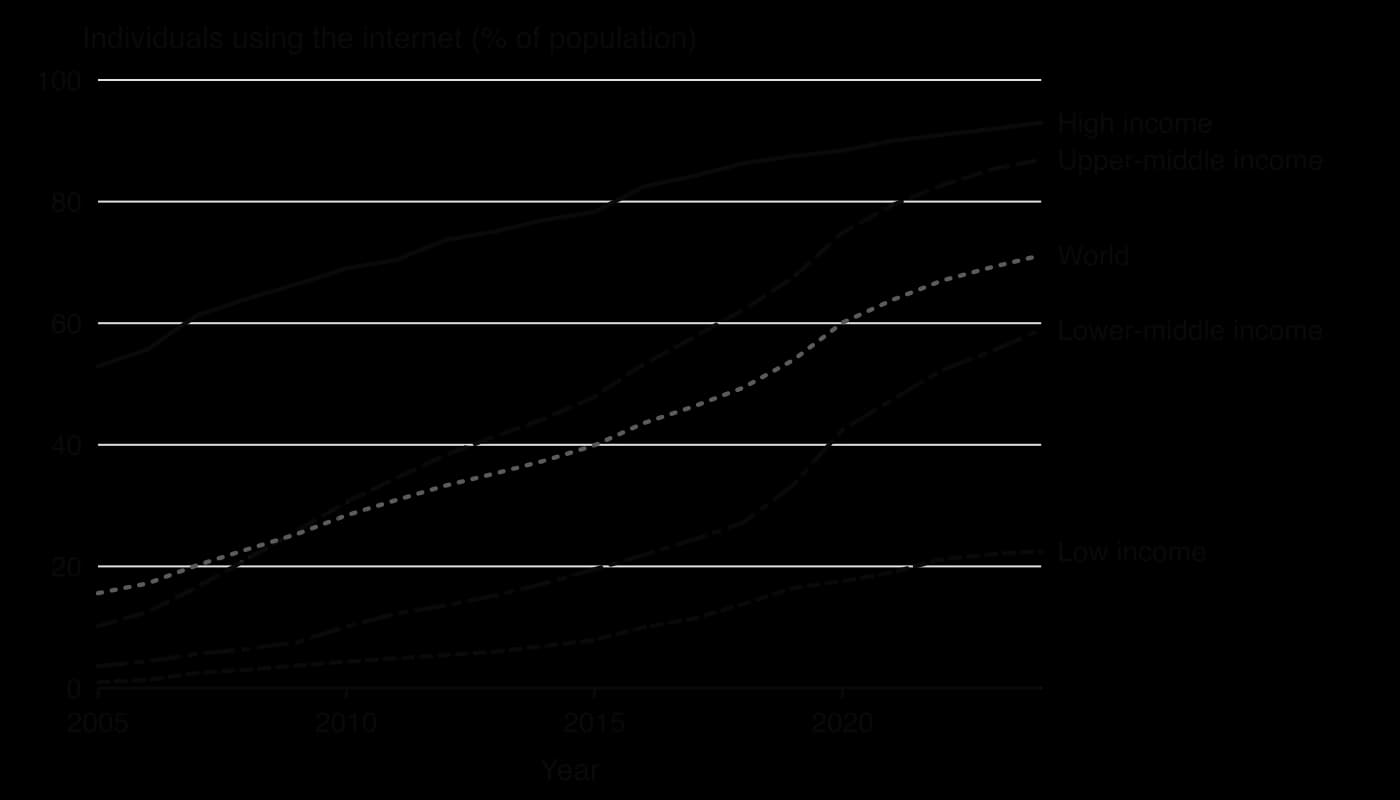
The chart shows rapid growth and a persistent gap. Upper-middle-income countries such as China and Brazil have nearly closed the gap with high-income countries, rising from 10% in 2005 to 87% in 2024. Lower-middle-income countries such as India and Nigeria grew fastest after 2015, as cheap smartphones and mobile data spread. Low-income countries reached only 22.5% in 2024, so the absolute gap with high-income countries (93.0%) is still about 70 percentage points.
The digital divide
The digital divide is the gap between people and places with good access to ICT and those without it. It exists between countries and within them: by income, by gender, between urban and rural areas and between age groups. In 2025, 77% of men and 71% of women worldwide used the internet, and the gender gap was widest in low-income countries. Rural areas lag behind cities, because it costs more to build networks for scattered populations, and the cost of a smartphone and data plan is a much larger share of income in low-income countries.
Dimension of the divide | Evidence (latest year) | Main reasons |
|---|---|---|
Income | High-income countries 94%, low-income 23% (2025) | Cost of devices and data; weaker infrastructure |
Region | Africa 36%; Europe, the Americas and the CIS 88–93% (2025) | Fewer cables and towers; lower incomes |
Gender | Men 77%, women 71% (2025) | Lower female incomes and education; social norms |
Landlocked countries | 38% of people in LLDCs online (2025) | Dependence on neighbours’ cables; higher costs |
Country examples | South Korea 97.9%, Mongolia 85.1%, Tonga 67.4%, Niger 15.6%, Chad 12.6% (2024) | Income, policy, geography |
The divide matters because access to data flows increasingly shapes access to jobs, banking, education, government services and markets. Mobile money, telemedicine and online learning can help remote places to leapfrog missing infrastructure, but places and people without access fall further behind. Governments also shape data flows through data localisation rules, which require that data about citizens be stored in the country, and through controls on what citizens can see, a form of resistance to global interactions.
Sources: ITU, Facts and Figures 2025 (internet use; gender digital divide); TeleGeography, Submarine cable FAQs, 2026; Wikipedia, “2022 Hunga Tonga–Hunga Haʻapai eruption and tsunami”, 2026; World Bank, World Development Indicators, 2026.
The influence of the physical environment
Political rules and technology can speed up flows, but the physical environment still shapes where interactions happen. Two influences matter most: where natural resources are found, and how isolated a place is by distance, relief, climate or the sea.
Natural resource availability
Natural resource availability is the presence and accessibility of resources such as fossil fuels, minerals, fertile land, water and forests in a place. Resources attract global interactions because firms and governments invest to extract them, build railways, pipelines and ports to export them, and sign trade and investment agreements to secure them.
Oil and gas in the Gulf: Saudi Arabia, Qatar and the UAE became hubs of global investment, migration and trade because of their oil and gas, with Gulf exports shipped through the Strait of Hormuz.
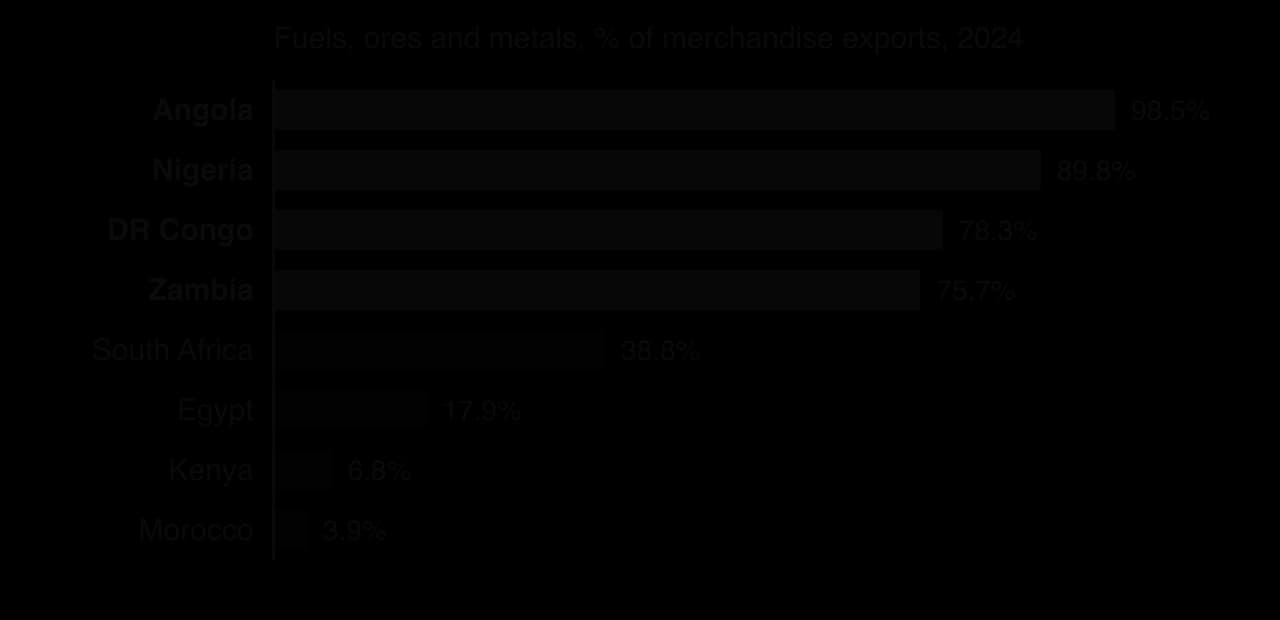
Copper in Chile, Peru, the DRC and Zambia: mining TNCs and Chinese investors have built mines and transport links; ores and metals were 76% of the DRC’s merchandise exports and 73% of Zambia’s in 2024.
Lithium in the “lithium triangle”: Argentina, Bolivia and Chile were thought to hold about 54% of the world’s lithium reserves in 2017. Chile produced about 140,000 tonnes of lithium carbonate equivalent a year in the early 2020s and Bolivia only about 600 tonnes, showing that availability does not lead to interaction without investment, technology and political decisions.
Rare earth elements in China: China mines and processes most of the world’s rare earths, used in magnets for electric vehicles and wind turbines, which gives it a strong position in these supply chains.
Physical features also channel flows. Straits such as Hormuz and Malacca, canals, navigable rivers such as the Rhine and the Yangtze, and natural deep-water harbours such as Singapore concentrate trade at particular places. These features give the places that control them economic and strategic importance.
The resource curse
The resource curse describes the observation that many countries rich in natural resources, especially oil and minerals, have slower economic growth, weaker democracy and more conflict than countries with fewer resources. Several processes can cause it. Resource exports raise the value of the currency, which makes manufacturing and farming less competitive (sometimes called “Dutch disease”). Revenues swing with world prices, so governments borrow in booms and struggle in slumps, as Zambia did before its default in 2020. Large revenues controlled by a small elite can encourage corruption and conflict over who controls the resource.
The curse is not inevitable. Norway has used a sovereign wealth fund to save oil revenues, and Botswana has used diamond revenues to fund education and infrastructure. Institutions, transparency and diversification decide whether resource wealth becomes a curse or an opportunity, which links resource geography to the study of governance and to resource nationalism, when governments take more control of their resources.
Sources: World Bank, World Development Indicators (fuel exports; ores and metals exports), 2026; Wikipedia, “Lithium triangle”, 2026.
Geographic isolation at different scales
Geographic isolation is the separation of a place from others by distance or by physical barriers such as oceans, mountains, deserts and ice. Isolated places have higher transport costs, smaller markets and fewer connections, which limits the global interactions they can take part in. Isolation operates at every scale, from whole island nations to a mountain village.
Global scale: small island developing states
Small island developing states (SIDS) are a group of 39 states and 18 associate members in the Caribbean, the Pacific, and the Atlantic and Indian Oceans, with about 65 million people, just under 1% of the world’s population. Remoteness raises the cost of imports and exports and makes shipping irregular; small populations give small markets and few economies of scale; and narrow resource bases make many dependent on tourism, fishing and remittances. Their exclusive economic zones average 28 times their land area, so much of their resource wealth is in the sea.
Pacific SIDS show isolation clearly. Tonga’s 2022 cable break showed the risk of depending on one connection, and remittances equal to 39.4% of Tonga’s GDP show how strongly its people depend on links to New Zealand, Australia and the USA. Their isolation also increases their vulnerability to climate change, as for Tuvalu and Kiribati, whose atolls lie only a few metres above sea level.
National scale: landlocked developing countries
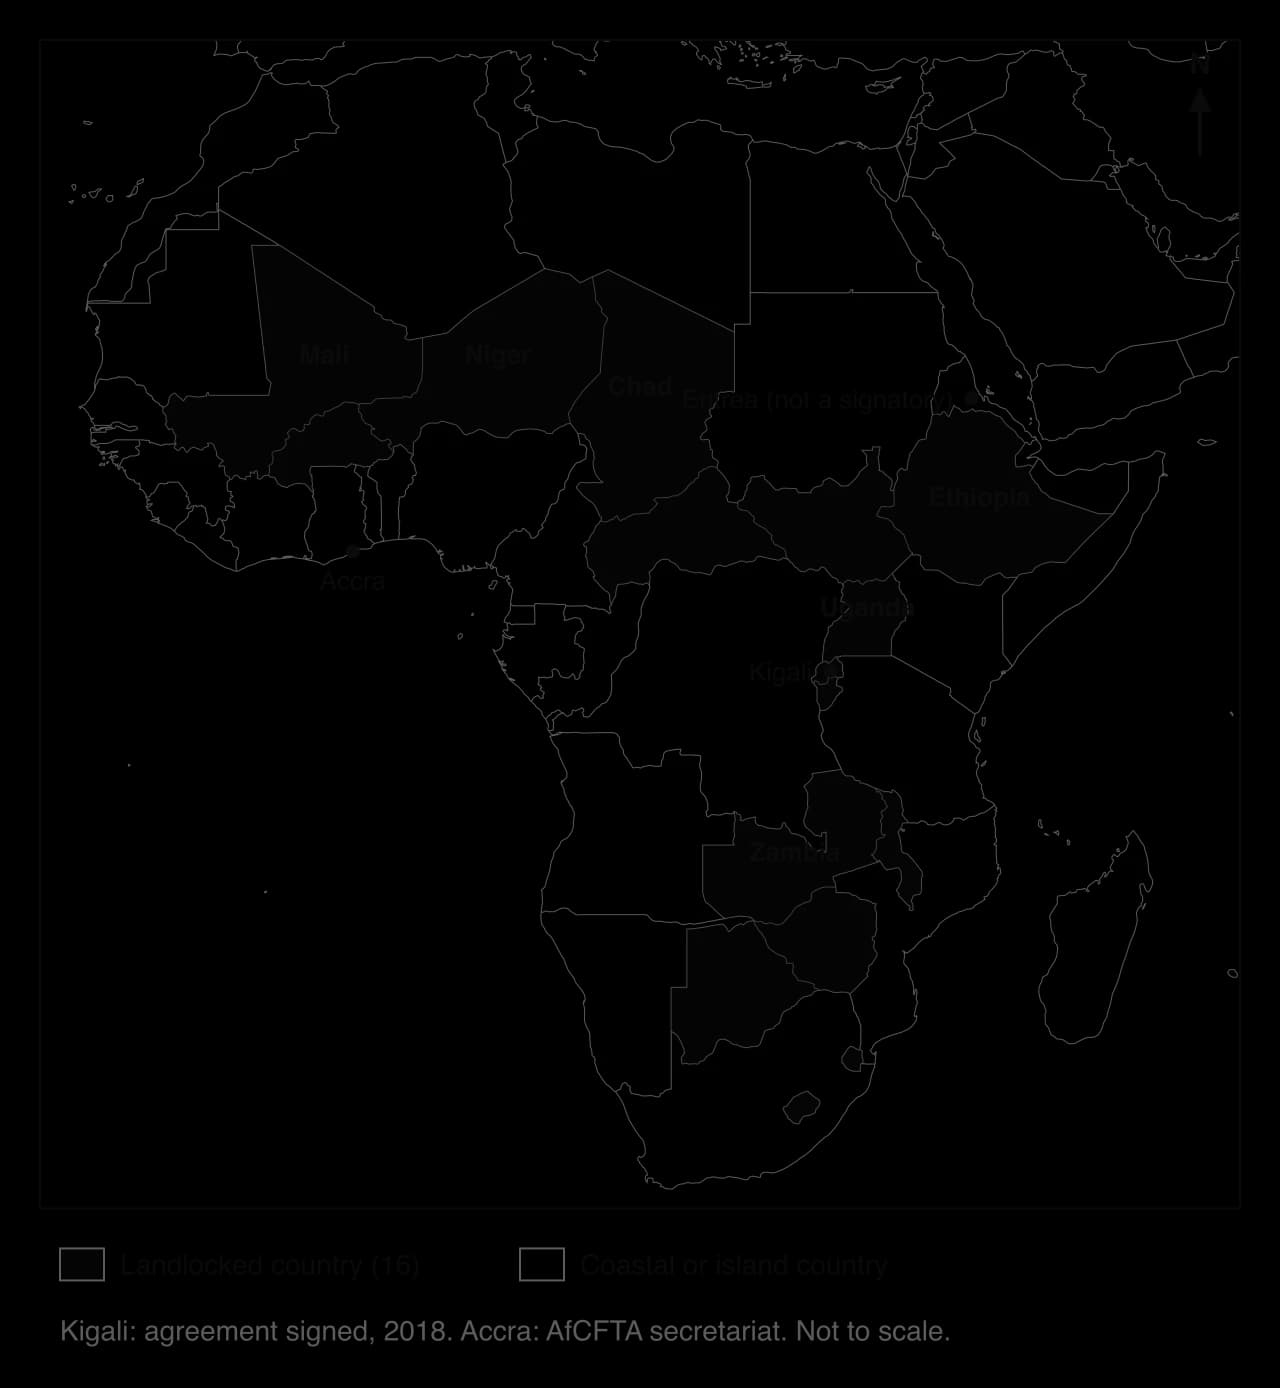
Landlocked developing countries (LLDCs) have no coastline, so their trade must cross at least one neighbouring transit country to reach a seaport. There are 32 LLDCs, 16 of which are also least developed countries; 16 are in Africa, including Chad, Niger, Mali, Ethiopia, Uganda and Zambia, and others include Mongolia, Bolivia, Paraguay, Kazakhstan, Afghanistan and Nepal. Kazakhstan is the farthest from the sea, at about 3,750 km, and Afghanistan, Chad, Niger, Zambia and Zimbabwe are each more than 2,000 km from the nearest coast.
Being landlocked has large effects. The UN estimates that LLDCs’ levels of development are about 20% lower than they would be if they were not landlocked, and they spend nearly twice the developing-country average on transport and insurance relative to their export earnings. Only 38% of their people used the internet in 2025, because they also depend on their neighbours for submarine cable connections. Political relations with transit countries matter: a dispute or a war in a neighbour can cut a landlocked country off.
Some landlocked countries are prosperous, such as Switzerland, Austria and Luxembourg, which shows that isolation is not destiny. They are surrounded by wealthy neighbours, linked by excellent road, rail and river networks, and belong to trade agreements that remove border delays. For LLDCs, the UN’s Vienna Programme of Action (2014–2024) aimed to turn them from “land-locked” into “land-linked” countries through transit corridors, trade facilitation and regional integration.
Local scale: remote communities
Within countries, mountain villages in the Himalaya and the Andes, communities in the Arctic, and settlements in deserts and rainforests are isolated from their own national cores. They may lack all-weather roads, reliable electricity and mobile coverage, so they take little part in global flows except through migration and remittances. Here the digital divide and the transport gap overlap, and local people may feel the shrinking world least.
Reducing isolation, and isolation as an advantage
Technology and policy can reduce isolation. Submarine cables and satellite internet connect islands; new airports and airlines open remote places to tourism; transit corridors and trade agreements such as the AfCFTA reduce the costs of crossing borders; and mobile money reduces the cost of receiving remittances. Isolation persists where investment is unprofitable or politics prevent co-operation.
Isolation can also be an advantage. New Zealand and Australia use their island isolation to keep out pests and diseases through strict biosecurity, which protects their farming exports, and remote places such as the Galápagos Islands or Bhutan use their remoteness as part of their tourism brand.
Sources: UN-OHRLLS, “About landlocked developing countries” and “About small island developing states”, 2026; ITU, Facts and Figures 2025; World Bank, World Development Indicators, 2026.
How the processes interlink
Political, technological and physical processes rarely act alone. Globalisation has accelerated because they reinforce each other, and it slows when they work against each other.
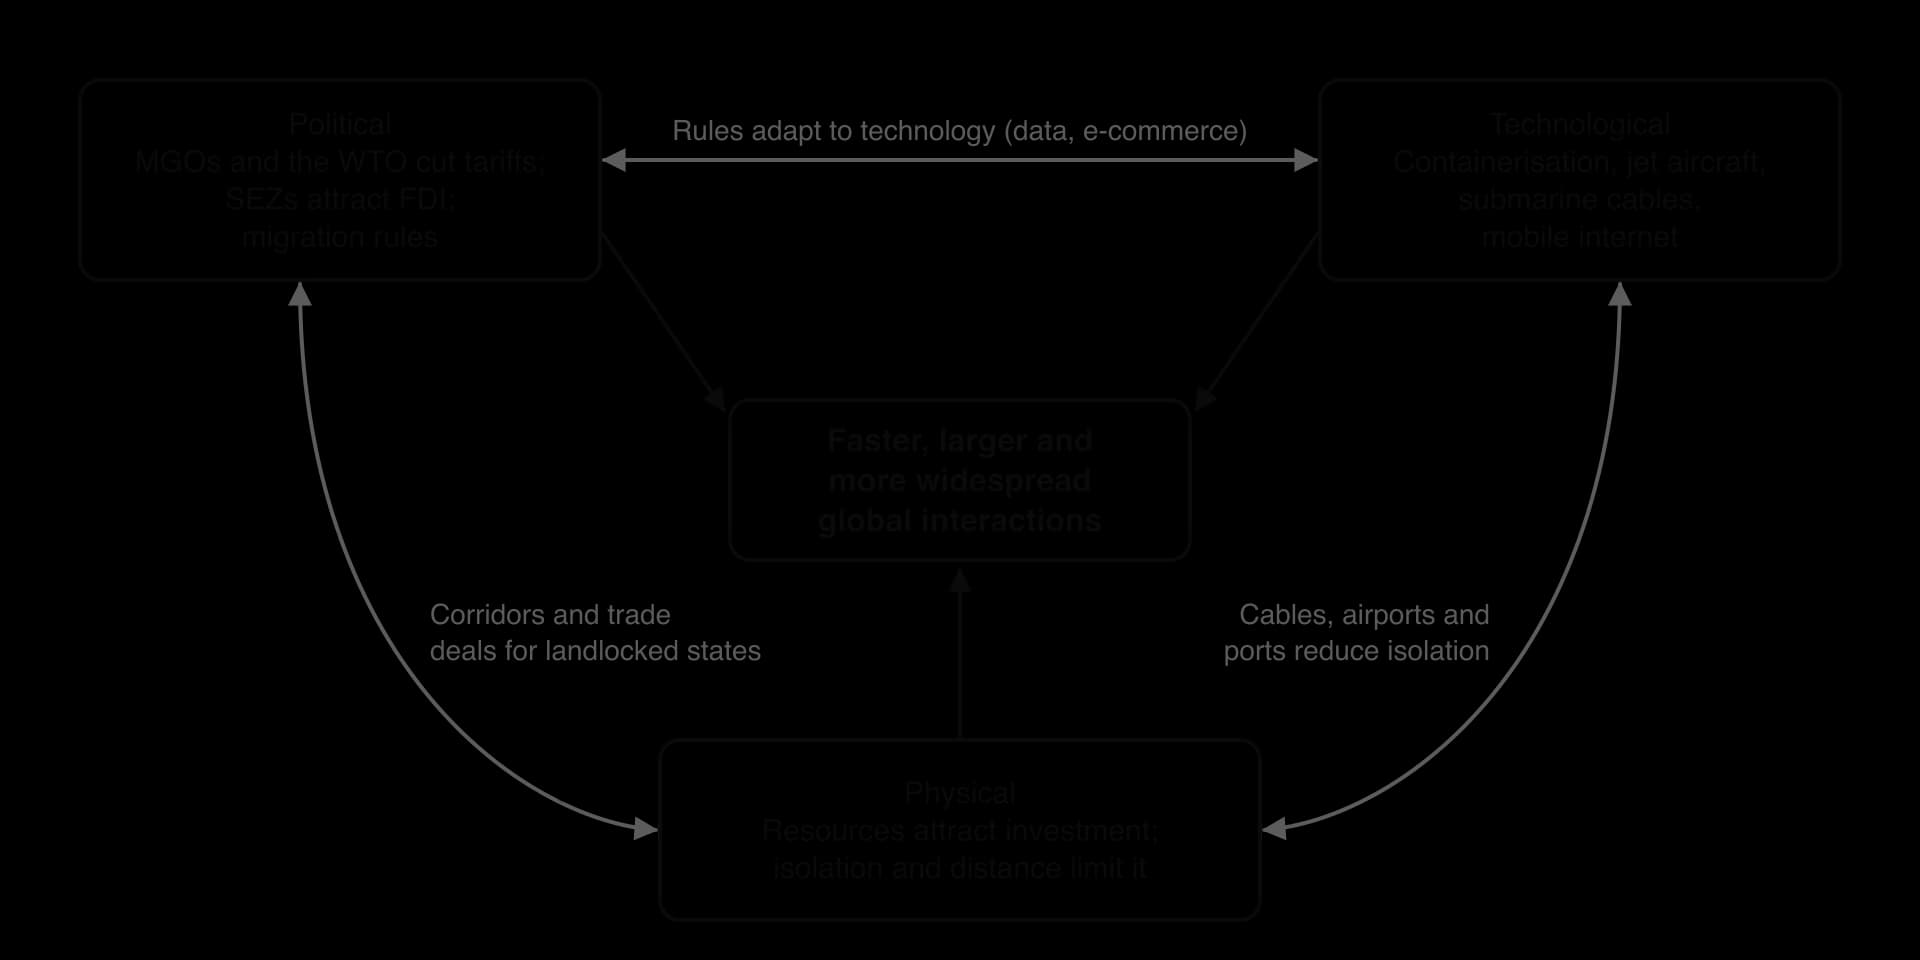
Political and technological: the WTO’s cuts in tariffs and China’s entry in 2001 were most effective because containerisation and the internet already made it cheap to ship goods from and manage factories in China. In turn, new technologies need new rules, such as agreements on e-commerce and data.
Technological and physical: submarine cables, airports and container ports reduce the effects of isolation, as in the Pacific islands, but they are built first where physical conditions (deep water, flat land) and markets make them profitable.
Political and physical: trade agreements and transit corridors reduce the disadvantage of being landlocked; resource wealth attracts investment agreements and, sometimes, resource nationalism.
Feedback: more interaction raises demand for transport and data, which drives more innovation and more agreements: a positive feedback loop that accelerates globalisation.
The same processes can also slow globalisation. Tariffs and stricter migration rules since 2018, the UK’s departure from the EU and the closure of borders during the COVID-19 pandemic show that political decisions can reverse the effect of technology. Physical events, such as the 2022 eruption in Tonga or droughts that lower water levels in canals, can cut links that technology created. Globalisation is therefore not a one-way or inevitable process: the speed of global interactions depends on how political, technological and physical processes combine in each place and at each time.
Case study: the African Continental Free Trade Area
The African Continental Free Trade Area (AfCFTA) is a free trade area that aims to create a single market for goods and services across the 55 member states of the African Union, with about 1.3 billion people. It combines all three influences on global interactions: a political agreement, designed to overcome physical barriers such as distance and landlocked borders, that depends on transport and digital infrastructure to work.
Why intra-African trade is low
Only about 15% of Africa’s trade in 2023 was with other African countries, up from 13.6% in 2022, compared with more than 55% within Asia and more than 70% within Europe. Intra-African trade was worth about US$192 billion. Several causes combine:
Colonial transport networks: railways and roads were built to carry minerals and crops from the interior to ports for export to Europe, not to link African countries with one another.
Similar exports: many African economies export the same primary commodities (oil, metals, cocoa, coffee) and import manufactured goods from outside, so they have little to sell to each other.
Tariffs and non-tariff barriers: border delays, checks, permits and differing standards raise the cost of moving goods between neighbours.
Physical barriers and isolation: 16 landlocked countries depend on transit through neighbours, and the Sahara, rainforests and long distances raise transport costs.
Payments: many trades between African countries were settled in US dollars or euros through banks outside the continent, adding cost and delay.
What the agreement does
The AfCFTA agreement was signed on 21 March 2018 in Kigali, Rwanda, by 44 of the African Union’s 55 member states. It came into force on 30 May 2019, after the 22nd country ratified it, and trading under it officially began on 1 January 2021. By May 2026, 54 countries had signed and 49 had ratified it; Eritrea is the only African Union member that has not signed. The permanent secretariat is in Accra, Ghana.
Feature | Detail |
|---|---|
Tariffs | Tariffs to be removed on 90% of goods, over 5, 10 or 13 years depending on a country’s level of development and the product; each country may exclude up to 3% of goods |
Services and investment | Further protocols cover trade in services, investment, competition, intellectual property and digital trade |
Payments | The Pan-African Payment and Settlement System (PAPSS), launched on 13 January 2022, allows payments between countries in local currencies |
Non-tariff barriers | An online mechanism lets traders report barriers so that governments can remove them |
Expected gains | A World Bank study of 2020 estimated that it could lift 30 million people out of extreme poverty and add US$450 billion of income by 2035, if fully implemented |
Who may gain and who may lose
Stakeholder | Likely gains | Possible losses or concerns |
|---|---|---|
Landlocked countries (Ethiopia, Uganda, Zambia, Chad) | Lower transit costs if border procedures are simplified; access to a larger market | Gains depend on neighbours’ roads, ports and border agencies |
Larger, more industrialised economies (South Africa, Egypt, Nigeria, Kenya, Morocco) | New markets for manufactured goods, banking and telecommunications | Domestic firms may face more competition |
Small and least developed economies | Longer timetables to cut tariffs; investment in regional value chains | Loss of tariff revenue; local firms may be undercut by imports from larger neighbours |
Small traders, many of them women | Simpler procedures and lower costs for cross-border trade | Little benefit if informal trade continues and corruption at borders remains |
Foreign TNCs and investors | One larger market makes investment in African manufacturing more attractive | Rules of origin require more local content |
How well is it working?
Progress has been real but slow. Ratification is almost complete, PAPSS is operating, and the African Union announced in April 2024 that the agreement had entered its operational phase. However, implementation has been uneven, with countries at different stages in applying tariff cuts and rules of origin, and the main barriers are not tariffs but the cost and time of moving goods. Without roads, railways, ports, power and fast border crossings, removing tariffs alone will not greatly increase trade.
The case therefore shows how political, technological and physical processes interlink. A political agreement reduces tariffs and creates new payment systems, but its success depends on transport and digital infrastructure (technology) to overcome the distance and landlocked borders (physical environment) that have kept African trade low. It also shows that global interactions are being reshaped from within lower-income regions, not only by high-income countries and TNCs.
Key concept | How the AfCFTA shows it |
|---|---|
Process | Removal of tariffs and non-tariff barriers; new payment systems; the slow process of implementation |
Power | African governments setting their own trade rules collectively, rather than through agreements with the EU, China or the USA; larger economies may gain more |
Place | Landlocked and coastal countries, commodity exporters and manufacturers gain in different ways |
Possibility | The World Bank’s projected gains to 2035 depend on full implementation and investment in infrastructure |
Sources: Wikipedia, “African Continental Free Trade Area” (AU and World Bank sources), 2026; Afreximbank, African Trade Report 2024 (via PACCI, June 2024); UN-OHRLLS, 2026; World Bank, World Development Indicators, 2026.
Analysis questions
Explain why intra-African trade has remained low compared with trade within Asia and Europe.
To what extent can a free trade agreement overcome the disadvantages of being landlocked?
Examine which countries and groups are most likely to gain from the AfCFTA.
Exam practice
This subtopic appears in Paper 3, in the question set on Unit 4. Part (a) [12 marks] usually asks you to analyse or explain how one type of influence (political, technological or physical) affects global interactions; part (b) [16 marks] gives a statement about the shrinking world, globalisation or barriers to interaction, which you discuss using evidence from across the HL units.
Part (a): analysis
Part (b): discussion
Summary
MGOs and trade blocs integrate economies at four levels: free trade area, customs union, common market and economic union; deeper integration pools more sovereignty.
The EU, USMCA, RCEP (in force 2022, about 30% of world population and GDP), Mercosur and the AfCFTA shape flows of trade, FDI and people; Brexit (2020) shows that integration can be reversed.
The WTO (1995, 166 members) sets global trade rules, but its dispute system has been blocked since 2019 and tariffs have risen since 2018.
Free trade zones and SEZs, such as Shenzhen (1980) and Jebel Ali (1985), attract FDI and exports with tax and customs incentives, but can become enclaves with weak labour rights.
Migration rules select and channel flows: points-based systems (UK from 2021, 70 points), employer-sponsored visas (US H-1B), free movement (EU, ECOWAS) and the kafala system in the Gulf.
Time–space convergence is the measurable fall in travel time between places; time–space compression is the wider speeding up of social and economic life (Harvey), experienced unequally (Massey).
Containerisation (from 1956), canals (Suez 1869, Panama 1914 and 2016), jet aircraft, hub-and-spoke networks and low-cost airlines have cut the cost of moving goods and people.
More than 600 submarine cable systems carry almost all international data; about 74% of people were online in 2025, but only 23% in low-income countries and 38% in LLDCs.
Natural resources attract investment and trade but can cause a resource curse; isolation limits interactions for SIDS, LLDCs (export costs about 2.5 times their neighbours’) and remote communities.
Political, technological and physical processes interlink, accelerating globalisation where they work together and slowing it where they conflict, as the AfCFTA shows.
Self-check
- To do:
I can describe the four levels of economic integration and give an example of each.
- To do:
I can explain how MGOs, the WTO, free trade zones and SEZs influence trade, investment and migration, with named examples.
- To do:
I can distinguish points-based systems, employer-sponsored visas, free movement and the kafala system, and apply a points system to an applicant.
- To do:
I can explain the shrinking world and distinguish time–space convergence from time–space compression.
- To do:
I can describe how containerisation, canals and air networks have changed global interactions.
- To do:
I can analyse patterns of submarine cables and internet use and explain the digital divide using data.
- To do:
I can examine how resource availability attracts global interactions and why it may lead to a resource curse.
- To do:
I can evaluate the effect of geographic isolation at global, national and local scales, using SIDS and LLDCs.
- To do:
I can examine how political, technological and physical processes interlink, using the AfCFTA.