Notes on 5.1 Development opportunities
Learning objectives
Distinguish between economic growth and human development, and explain why human development is a multidimensional process.
Examine how the Sustainable Development Goals are used as criteria to measure development, and the limits of the data behind them.
Evaluate the validity and reliability of development indicators and indices, including the HDI, IHDI, MPI and GII.
Construct and interpret a development diamond and a scatter graph of two development indices.
Explain how women, Indigenous peoples and minority groups can be empowered, and why empowerment narrows the development gap.
Evaluate affirmative action as a way of closing the development gap, using India, Brazil and Rwanda as detailed examples.
Explain how microfinance organisations, alternative trading networks such as Fairtrade, and TNC corporate social responsibility frameworks support human development.
Analyse how actions to support human development involve spatial interactions from the local to the global scale.
Introduction
Development is usually discussed in terms of income, but two countries with the same income can offer their people very different lives. Human development asks a wider question: how far people are free to live long, healthy and educated lives, take part in decisions and choose how to live. Geographers measure that freedom with indicators and indices, and study the ways of widening it for the groups who have least of it.
Two key concepts run through the study of human development: possibility and power. Indices such as the HDI and the Gender Inequality Index set out what development could look like and track how far places are from it, while quotas, microloans, fair prices and corporate rules are attempts to shift power towards women, Indigenous peoples, minorities and small producers. Each of those attempts links a household or a village to national governments and to global organisations, so they also involve spatial interactions across scales.
Human development as a multidimensional process
Development is a process of positive change in the economic, social, political, environmental and cultural conditions of people’s lives. Income is one part of it, measured as gross national income (GNI) per capita and used to sort countries into low-income countries (LICs), middle-income countries (MICs) and high-income countries (HICs). Human development shifts the focus from what an economy produces to what people are able to do and to be.
The idea comes from the Indian economist Amartya Sen, who argued that poverty is a lack of real freedoms (capabilities), such as the freedom to avoid preventable disease, to read, to work outside the home or to speak in public without fear. The Pakistani economist Mahbub ul Haq used this capability approach to launch the first Human Development Report for the United Nations Development Programme (UNDP) in 1990, with the stated aim of shifting the focus of development from national income to people.
Because development has several dimensions, a change in one does not guarantee a change in the others. The table sets out the five dimensions with examples of indicators used to measure each.
Dimension | What it covers | Examples of indicators |
|---|---|---|
Economic | Income, work, assets, financial security | GNI per capita (PPP), share of people in extreme poverty, unemployment rate, access to a bank account |
Social | Health, education, housing, gender equality | Life expectancy, maternal mortality ratio, mean years of schooling, access to safe water |
Political | Rights, participation, security, rule of law | Women’s share of seats in parliament, voter turnout, press freedom scores, corruption indices |
Environmental | The quality and sustainability of the resource base | CO₂ emissions per person, air pollution exposure, forest loss, material footprint |
Cultural | Freedom to keep and express identity, language and beliefs | Language rights, recognition of Indigenous land, religious freedom |
Each of these is a development indicator. A single indicator captures one dimension, so geographers combine several into composite indices or compare them side by side. The choice of indicators is itself a judgment about what development means.
Where development is uneven, a development gap opens between places or groups. The gap exists between countries (Norway’s life expectancy of 83.3 years in 2023 against 55.1 years in Chad) and within them: between urban and rural areas, between regions, between men and women, and between majority and minority groups.
Measuring development with the Sustainable Development Goals
The Sustainable Development Goals (SDGs), adopted by all UN members in 2015 for the period to 2030, are the most widely used framework for deciding what counts as development. They replaced the eight Millennium Development Goals (MDGs, 2000–2015) and, unlike them, apply to every country, rich or poor. Their adoption and progress are a resource stewardship topic; here they matter as a set of criteria against which places are measured.
Goals, targets and indicators
The framework has three levels. The 17 goals state broad aims, such as SDG 5 (gender equality) or SDG 10 (reduced inequalities). Under them sit 169 targets, such as target 5.5: women’s full participation and equal opportunities for leadership. Each target is tracked by one or more indicators; after the refinements agreed by the UN Statistical Commission in March 2026, the framework lists 251 indicators, of which 234 are unique (13 indicators repeat under two or three targets).
Level | Example (SDG 5, gender equality) | What it gives a geographer |
|---|---|---|
Goal | Achieve gender equality and empower all women and girls | A broad criterion of development |
Target | 5.5: ensure women’s full and effective participation and equal opportunities for leadership | A specific, time-bound aim (2030) |
Indicator | 5.5.1: proportion of seats held by women in national parliaments and local governments | A number that can be mapped, ranked and tracked over time |
Because the indicators are numbers, the SDGs can be turned into rankings and dashboards. The SDG Index of the Sustainable Development Solutions Network, for example, scores every country on all 17 goals and shows each goal as on track, improving, stagnating or falling back. The UN’s own progress reports give a similar verdict: in 2025 only 35% of the assessable targets were on track or making moderate progress and 18% had gone into reverse, and the 2026 report, released on 7 July 2026, found 36% on track or making moderate progress, nearly half stalling and 15% in reverse.
Validity and reliability of the SDG data
Two questions apply to every development measure. Validity asks whether an indicator measures what it claims to measure: does the share of seats held by women in parliament measure women’s political power, or only their presence? Reliability asks whether the measurement is consistent and accurate: would the same method give the same result if repeated, and can figures be compared between countries and years?
The SDGs raise both problems. Many indicators have no recent data for many countries, especially LICs and countries in conflict, so their values are modelled estimates. Indicators for qualitative targets, such as the quality of governance or of education, are hard to define. The large number of goals also means that a country can look successful on some and fail on others, and that trade-offs between goals (economic growth against emissions, for example) are hidden when each goal is scored on its own.
The Human Development Index: validity and reliability
The Human Development Index (HDI) is the UNDP’s composite measure of human development. It combines a health dimension, a knowledge dimension and a standard of living dimension, each converted into an index from 0 to 1 between fixed minimum and maximum “goalposts”. The HDI is the geometric mean of the three indices, so a very low value in one dimension pulls the whole index down more than an arithmetic average would.
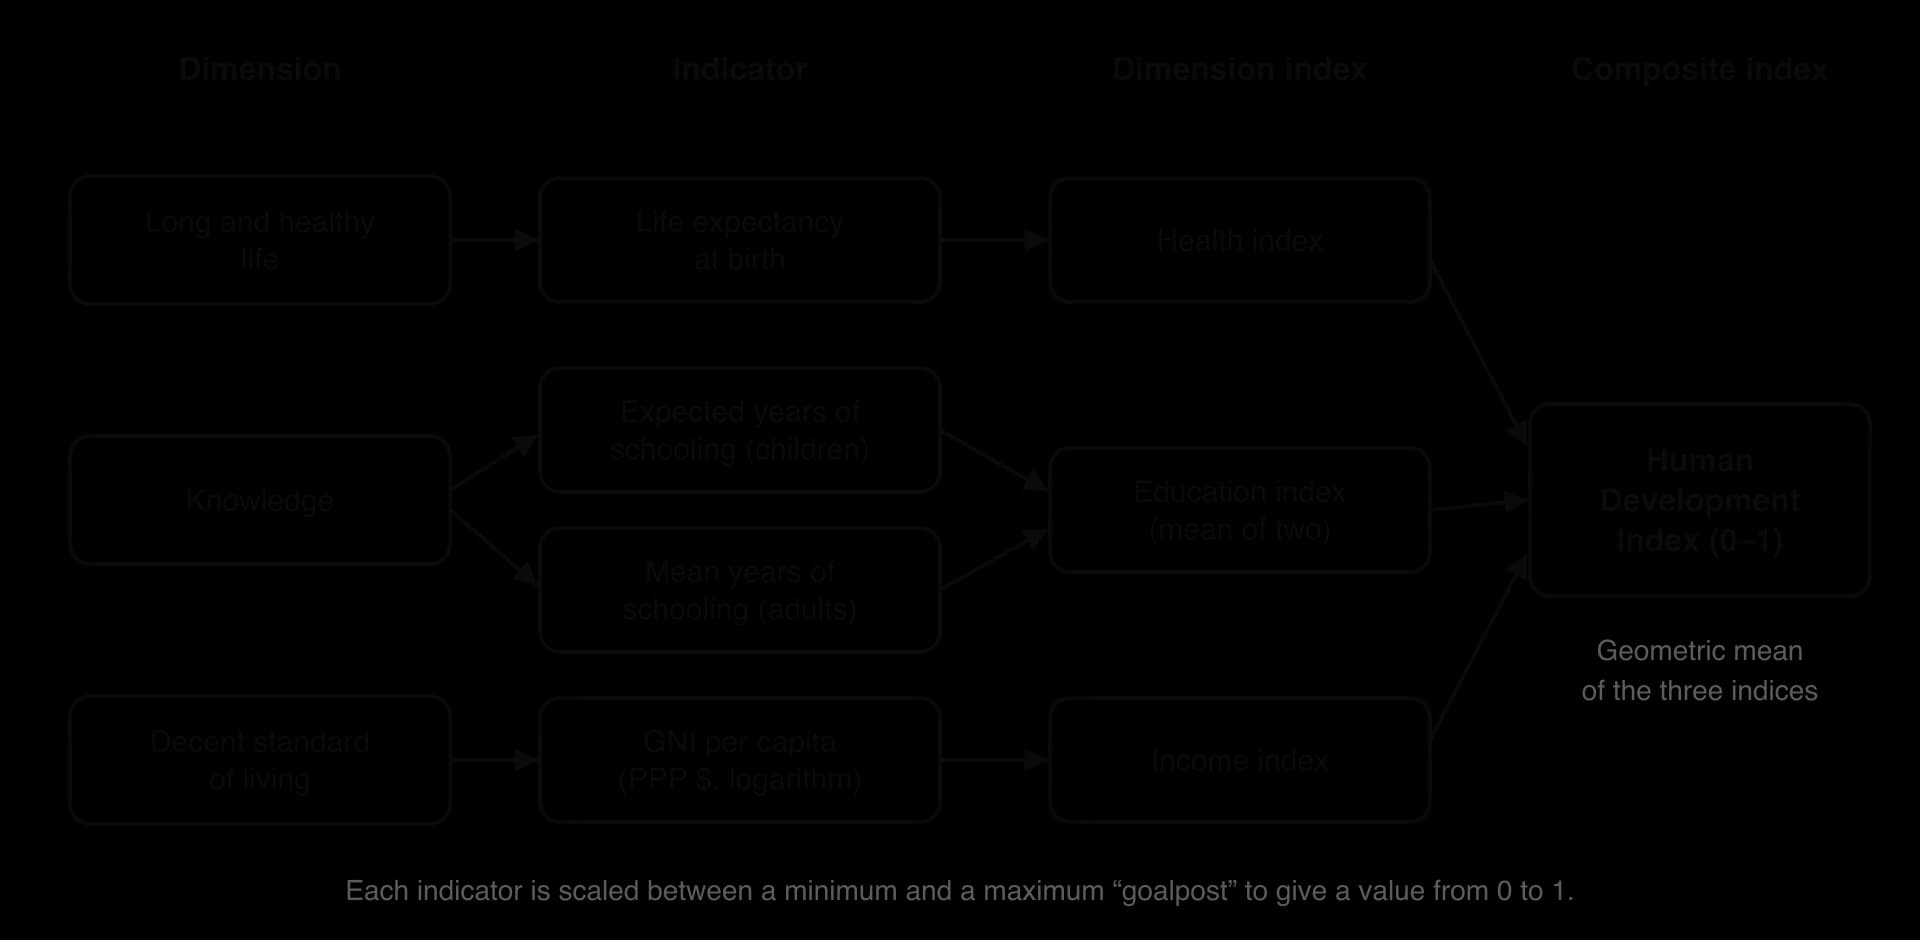
In 2023 HDI values ranged from 0.972 in Iceland to 0.388 in South Sudan, and the world average was 0.756. Rwanda’s HDI of 0.578 placed it 159th of 193 countries, in the medium human development group.
What the HDI leaves out: validity
The HDI is valid as a measure of three basic capabilities, but it leaves out much of what human development means. It ignores inequality: a national average can hide very poor regions or groups. It ignores gender, political freedom, security and environmental sustainability: a country can score highly while denying free elections or emitting far more carbon than the planet can absorb. Its education indicators count years in school, not what pupils learn.
The UNDP has responded with companion indices rather than by changing the HDI itself. The Inequality-adjusted Human Development Index (IHDI), introduced in 2010, discounts each dimension for inequality between people. The planetary pressures-adjusted HDI (PHDI) lowers a country’s score according to its carbon dioxide emissions and material footprint per person: in 2023 Qatar’s HDI of 0.886 fell to a PHDI of 0.276.
How far the numbers can be trusted: reliability
The HDI is only as reliable as its inputs. Life expectancy in many LICs is estimated from surveys and models, not from complete registers of births and deaths; GNI per capita at purchasing power parity depends on price surveys that are repeated only every few years; schooling data come from censuses that may be a decade old. When the inputs are revised, past values change too, so the UNDP warns that HDI values from different reports should not be compared: only the recalculated time series in the latest report is consistent.
The method has also changed. In 2010 the UNDP replaced adult literacy with mean years of schooling and switched from an arithmetic to a geometric mean, which moved some countries between groups. Comparisons over long periods are therefore safest using the UNDP’s back-calculated series, and small differences in rank (Rwanda 159th, Uganda 157th) are less meaningful than they look.
 YouTube
Multidimensional poverty
The Multidimensional Poverty Index (MPI), developed in 2010 by the Oxford Poverty and Human Development Initiative (OPHI) and the UNDP, measures poverty as a set of deprivations rather than as a lack of income. It uses ten weighted indicators in the same three dimensions as the HDI (for example child mortality, years of schooling, cooking fuel, sanitation and housing), and counts a person as poor if they are deprived in at least a third of them.
The 2025 global MPI found 1.1 billion multidimensionally poor people out of 6.3 billion in the 109 countries covered, more than half of them children. About 740 million of the poor (64.5%) live in middle-income countries, which shows how national income averages can hide deprivation. The MPI is built from household surveys, so it can be mapped by region within a country, but surveys are infrequent and in some countries more than ten years old.
Index | What it measures | Main strength | Main limitation |
|---|---|---|---|
HDI (1990) | Average health, education and income | Simple, global coverage, long time series | Hides inequality; ignores gender, freedom, environment |
IHDI (2010) | HDI discounted for inequality between people | Shows the gap between the average and the typical person | Needs detailed distribution data, missing for some countries |
PHDI | HDI adjusted for CO₂ emissions and material footprint | Links development to sustainability | Two pressures only; penalises resource exporters |
MPI (2010) | Overlapping deprivations of households | Identifies who is poor and where, below the national scale | Surveys are infrequent; weights are a judgment |
GII (2010) | Gender inequality in health, empowerment, work | Puts women’s position at the centre | Elite and formal measures; misses unpaid work and violence |
Sources: UNDP, Human Development Report 2025 and its composite indices time series (data for 2023); UNDP and OPHI, Global Multidimensional Poverty Index 2025; United Nations, The Sustainable Development Goals Report 2025 and 2026.
The development diamond
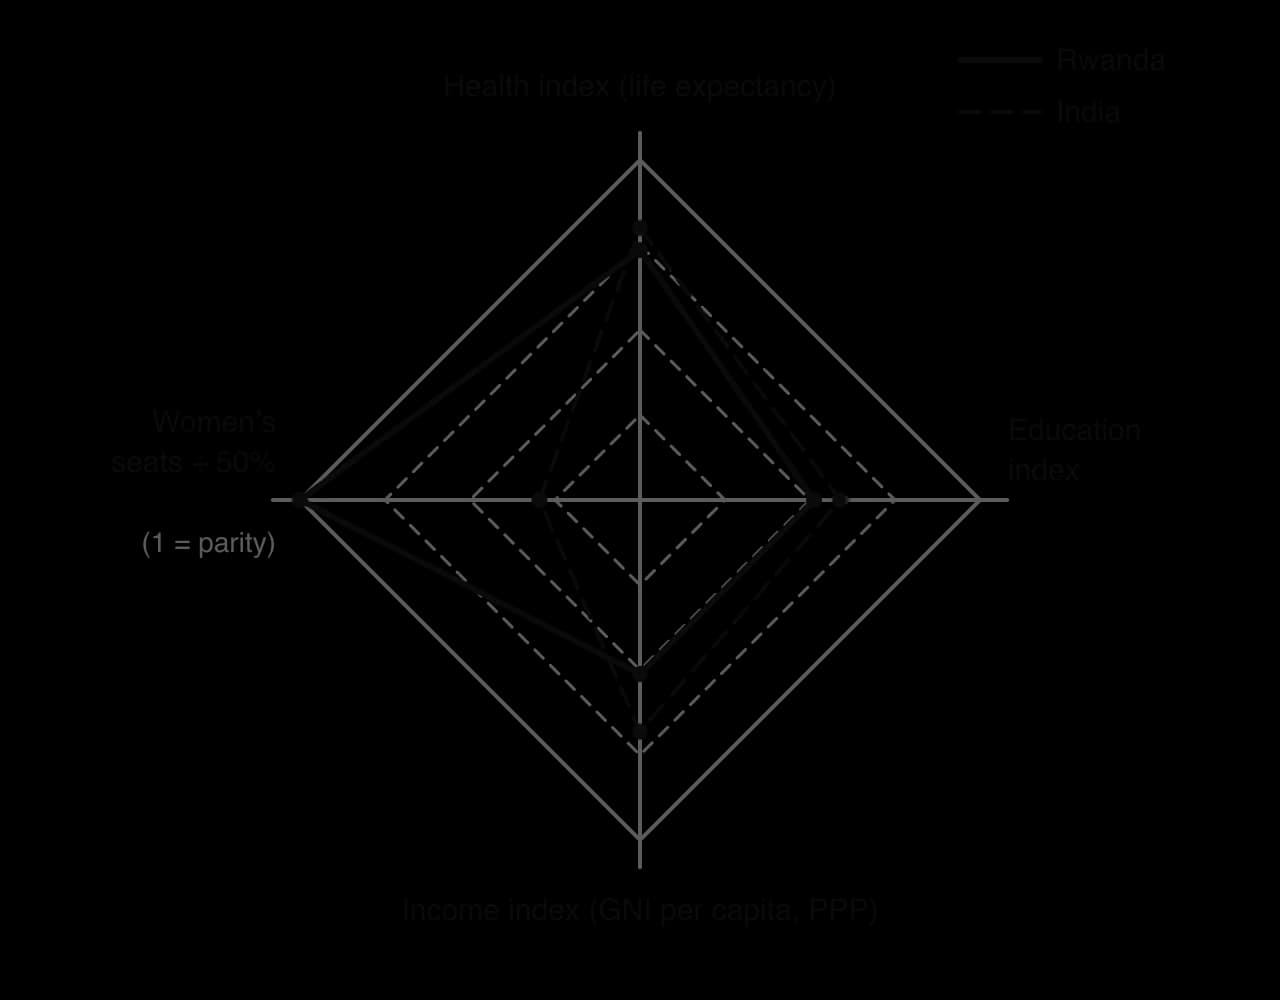
A development diamond compares places on four indicators at once. Four axes meet at a common centre, each scaled from 0 at the centre to a maximum at its end; a place’s values are plotted on the four axes and joined. A large, even diamond shows high and balanced development; a small or lopsided shape shows weakness in some dimensions.
The Gender Inequality Index
Gender equality is one of the clearest tests of human development, because women make up half of every population but hold far less than half of income, property and political power almost everywhere. The Gender Inequality Index (GII), introduced by the UNDP in 2010, measures how much a country loses in human development because of inequality between women and men.
How the GII is built
The GII combines five indicators in three dimensions. Unlike the HDI, a higher GII value means more inequality, so the best-performing countries have the lowest values.
Dimension | Indicator | Why it is included |
|---|---|---|
Reproductive health | Maternal mortality ratio (deaths per 100,000 live births) | Deaths in pregnancy and childbirth are largely preventable and affect only women |
Adolescent birth rate (births per 1,000 women aged 15–19) | Early childbearing cuts schooling and raises health risks | |
Empowerment | Share of parliamentary seats held by each sex | A measure of political voice |
Share of adults aged 25 and over with at least some secondary education, by sex | A measure of access to knowledge and skilled work | |
Labour market | Labour force participation rate, by sex | A measure of economic independence |
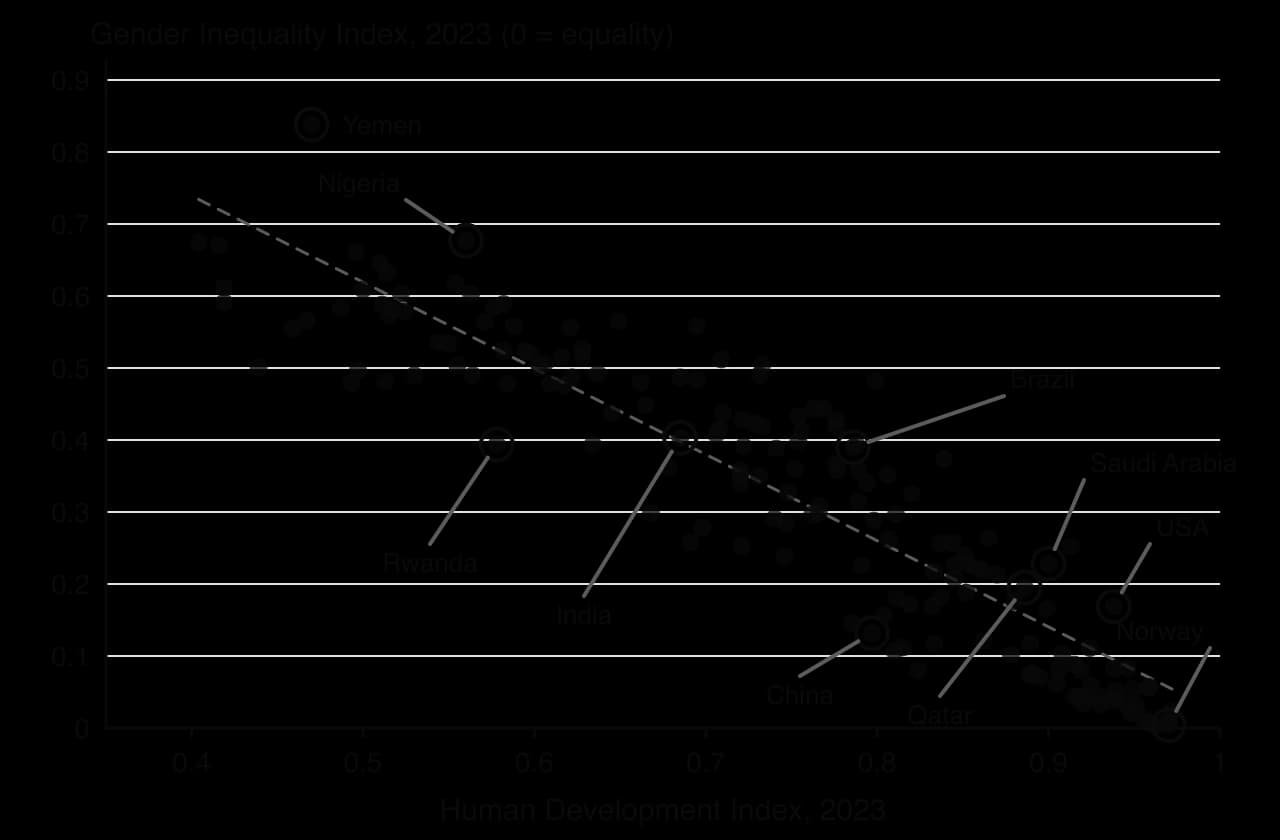
The values are aggregated within each sex and then compared, so the index measures the gap between women and men rather than the level of women’s wellbeing. In 2023 the lowest values were in Denmark (0.003), Norway (0.004), Sweden (0.007) and Switzerland (0.010). The highest were in Yemen (0.838), Nigeria (0.677), Somalia (0.675), Chad (0.670) and Afghanistan (0.661). The world value was 0.455.
Patterns of gender inequality
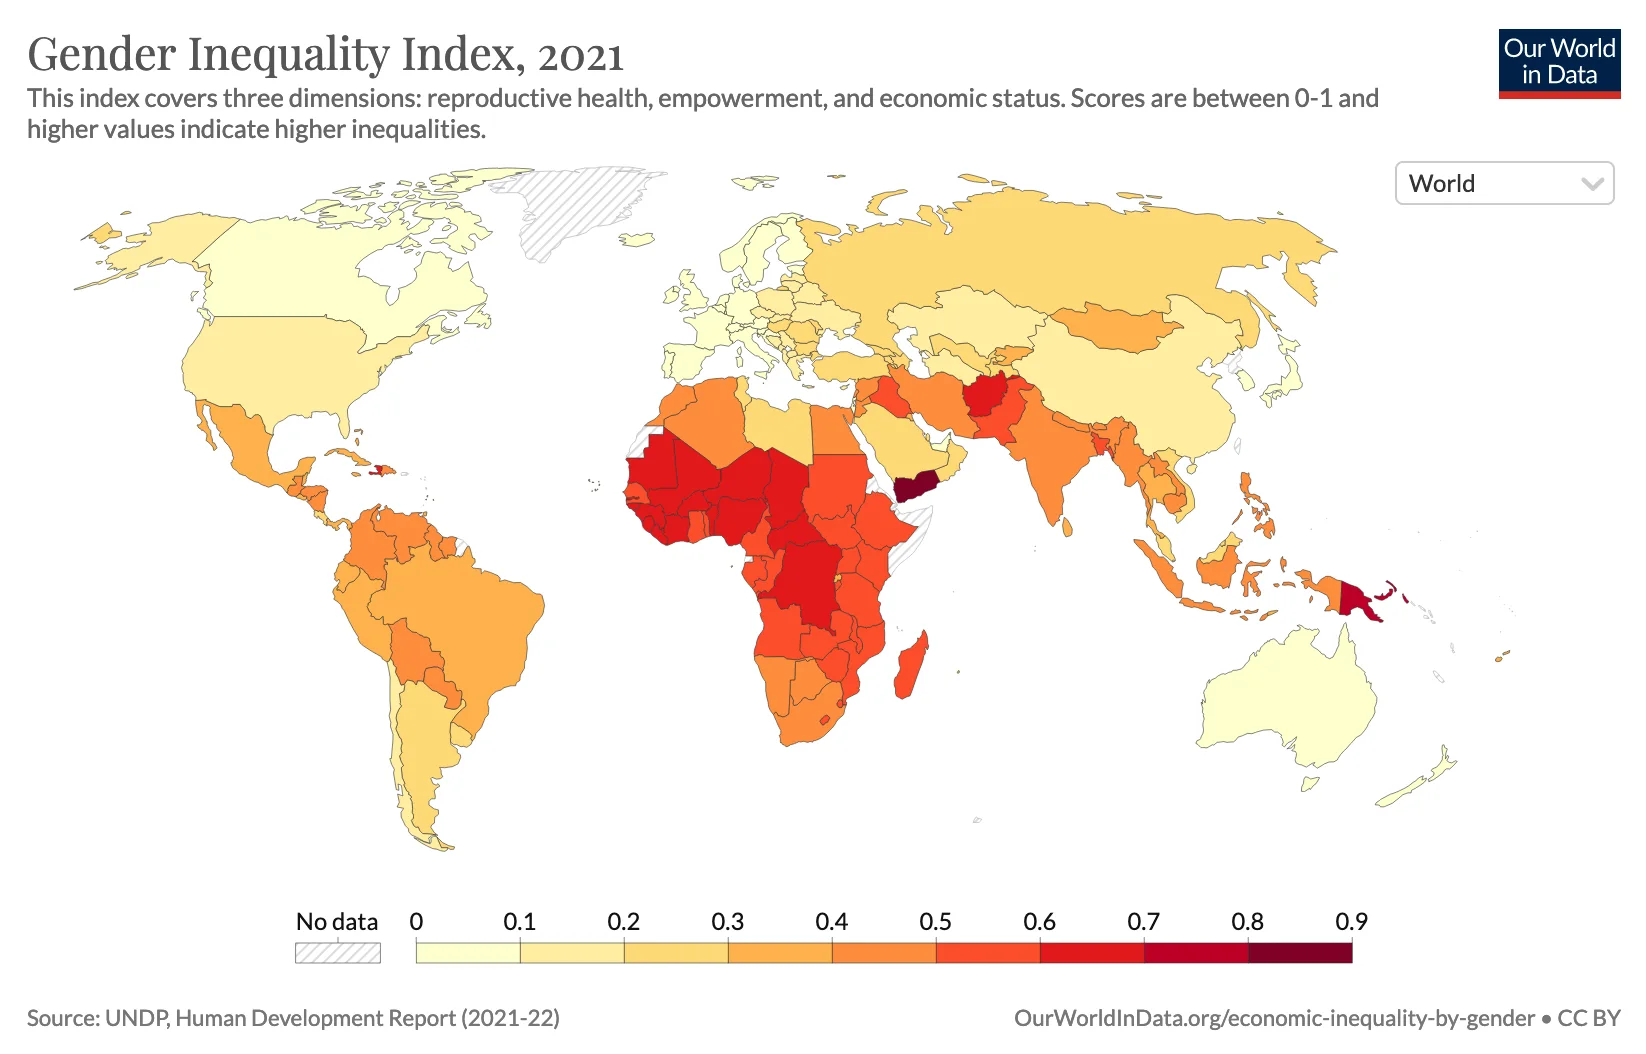
The map shows a strong relationship with income and human development, but not a perfect one. Most of sub-Saharan Africa has GII values above 0.5, driven by high maternal mortality and adolescent birth rates and by the low share of women with secondary education. The Gulf states show a different pattern: high incomes and low maternal mortality but, in 2023, low female labour force participation (Saudi Arabia 34.6%, against 83.6% for men), so their GII is higher than their wealth would predict.
Validity and reliability of the GII
The GII is valid in that each of its indicators measures something that matters for women’s lives, but it leaves out much more than it includes. It measures no unpaid care and domestic work (most of it done by women), no gender pay gap, no violence against women, no ownership of land or property and no legal rights. Its empowerment indicator counts seats in a national parliament, which measures the presence of a small elite rather than the power of most women, and says nothing about whether the parliament itself holds power.
Its reliability is limited by its data. Maternal mortality ratios in many LICs are modelled by UN agencies because deaths are not registered, and they carry wide uncertainty ranges. Seat shares differ between sources: the UNDP uses both chambers of parliament, so Rwanda’s 2023 figure is 54.7%, while the Inter-Parliamentary Union’s figure for the lower house alone is 61.3%. Because the index measures a gap, a country where both sexes have poor outcomes can score better than one where women do well but men do even better.
Other indices measure gender inequality differently. The World Economic Forum’s Global Gender Gap Index, published since 2006, scores countries on economic participation, education, health and political empowerment, and ranks several countries very differently from the GII: Rwanda, for example, has appeared among its top ten. Comparing the two is a reminder that a ranking depends on which indicators are chosen and how they are weighted.
Empowering women, Indigenous peoples and minority groups
Indices show where the development gap lies; empowerment is the process of closing it. Empowerment is about power as well as resources: a loan, a school place or a parliamentary seat matters because it changes who can make decisions in a household, a community or a country.
Empowering women
Strategies for empowering women work at different scales and address different dimensions of the gap. The table summarises the main approaches with examples.
Approach | How it empowers | Example |
|---|---|---|
Education | Raises skills, earnings and confidence; delays marriage and first births | Girls’ secondary schooling programmes; free secondary education in many African countries |
Legal rights | Gives women equal status in marriage, divorce and inheritance | Rwanda’s laws giving daughters and sons equal rights to inherit land |
Land and property rights | Provides collateral, security and bargaining power in the household | Joint land titles for married couples in Ethiopia and Rwanda |
Political quotas | Places women in decision-making bodies | Rwanda’s reserved seats; India’s one-third reservation in village councils |
Financial inclusion | Lets women save, borrow and receive payments in their own name | Microfinance groups; mobile money accounts |
Health | Reduces maternal deaths; gives control over fertility | Free maternal care; family planning services |
The approaches reinforce each other. A woman with secondary education is more likely to work for wages, to have fewer and healthier children, and to stand for election; a woman with land rights is more likely to obtain a loan. Without legal rights, however, education and loans may simply raise household income without changing who controls it.
Empowering Indigenous peoples and minority groups
Indigenous peoples are the descendants of the original inhabitants of a territory, with cultures, languages and ties to land that predate colonisation or the formation of the present state. They include the Inuit of Canada, the Sámi of Norway, Sweden, Finland and Russia, the Māori of New Zealand and the Adivasi of India. A minority group is a wider category that includes any group differing from the majority in ethnicity, religion or language, such as the Roma in Europe or the Dalits in India.
Both groups often have lower incomes, poorer health and less schooling than the majority, as a result of past dispossession and present discrimination. Empowerment strategies therefore focus on rights as well as services:
Land rights: legal recognition of territory, which protects livelihoods and gives communities a say over mining, logging and dams.
Language and cultural rights: schooling and public services in Indigenous and minority languages.
Self-governance: institutions run by the group itself, from councils to whole territories.
International standards: the United Nations Declaration on the Rights of Indigenous Peoples (UNDRIP), adopted in 2007, which sets out rights to land, culture and free, prior and informed consent.
Nunavut in northern Canada is the largest example of self-governance. Created on 1 April 1999 out of the Northwest Territories, under the Nunavut Act and the Nunavut Land Claims Agreement, it gave the Inuit, who make up most of its 36,858 people (2021), a territorial government across about 1.8 million km². The Sámi Parliaments of Norway (opened in 1989), Sweden (1993) and Finland give the Sámi elected bodies with responsibility for their language, culture and reindeer herding, although decisions on land and energy projects remain with national governments.
Affirmative action to close the development gap
Where discrimination is built into a society’s institutions, equal treatment from now on may not close the gap within a generation, because the disadvantaged group starts further behind. Affirmative action responds by giving members of that group preferential access to education, jobs, contracts or political office for a period.
Affirmative action takes several forms, from hard quotas (a fixed number or share of places reserved for a group) through reserved seats in a legislature and preferences in selection, to targets without penalties. The table compares six national programmes.
Country and policy | Group targeted | Form | Notable feature |
|---|---|---|---|
India: reservations (from 1950) | Scheduled Castes, Scheduled Tribes, Other Backward Classes; women | Quotas in public universities, government jobs and legislatures | The oldest such programme in the world |
Brazil: Law of Quotas (2012) | Public-school, low-income, Black, mixed-race (pardo) and Indigenous students | Half of federal university places reserved | Racial sub-quotas match each state’s census population |
Rwanda: 2003 constitution | Women | At least 30% of posts in decision-making bodies; 24 of 80 seats in the Chamber of Deputies | Women have held over half the lower house since 2008 |
South Africa: Broad-Based Black Economic Empowerment (2003) | Black South Africans | A scorecard for ownership, management, skills and suppliers that affects government contracts | Relaunched in 2003 after criticism that earlier policy favoured a small elite |
Malaysia: New Economic Policy (from 1971) | The bumiputera (Malays and other Indigenous groups), a majority | Preferences in education, housing, public jobs and business | Favours a majority group over Chinese and Indian Malaysians |
Norway: board quota (2003 law) | Women | At least 40% of each sex on boards of public limited companies | Enforced with the threat of dissolving companies |
Sources: Wikipedia articles “Reservation in India”, “Lei de Cotas” (Portuguese), “Constitution of Rwanda”, “Broad-Based Black Economic Empowerment”, “Bumiputera (Malaysia)” and “Gender representation on corporate boards of directors”, 2026; Constitution of Rwanda (2003, revised 2015), Articles 10 and 75, via Constitute Project.
Detailed example: India’s reservations
India’s system of reservations is a response to caste, a hereditary social hierarchy in which the groups once treated as “untouchable” (now the Scheduled Castes, or Dalits) and the Adivasi (Scheduled Tribes) were excluded from education, land and public life for centuries. The constitution of 1950 outlawed untouchability and allowed the state to make special provision for these groups.
In central government jobs and centrally funded universities, 15% of places are reserved for Scheduled Castes and 7.5% for Scheduled Tribes; an additional 27% for Other Backward Classes (OBCs) was introduced in government jobs in the 1990s and in universities in 2006, and a further 10% for economically weaker sections of the general category in 2019. Constituencies in the Lok Sabha (the lower house of parliament) and state assemblies are also reserved for Scheduled Castes and Tribes.
Women are the newest target. The constitutional amendment of 2023 (the Women’s Reservation Act) reserves one-third of directly elected seats in the Lok Sabha and state assemblies for women, but only after a new census and a redrawing of constituency boundaries; the Act was brought into force on 16 April 2026, and a constitutional amendment to allow implementation before the 2029 election was defeated in the Lok Sabha the next day. In 2025 women held only 13.8% of Lok Sabha seats, against 63.8% in Rwanda.
The results are mixed. Reservations have created a large Dalit and Adivasi middle class of graduates, civil servants and politicians, including two Dalit presidents of India. Critics argue that the benefits go mainly to the better-off families within each group (the Supreme Court excludes a “creamy layer” of wealthy OBCs for this reason), that caste rather than poverty decides eligibility, and that the system entrenches caste identity. The Supreme Court capped caste reservations at 50% in 1992, but the 2019 quota took the total in central institutions to 59.5%, and groups such as the Patidars of Gujarat and the Marathas of Maharashtra have campaigned, sometimes violently, to be added.
Detailed example: Brazil’s Law of Quotas
Brazil has the largest population of African descent outside Africa, and its federal universities, free and highly selective, were long dominated by white students from private schools. Law 12.711, signed on 29 August 2012, reserves 50% of places on every course at federal universities and federal institutes for students who completed their secondary education in public schools. Half of these reserved places go to students from low-income families, and within each group places are reserved for Black, pardo (mixed-race) and Indigenous students in proportion to their share of the state’s population at the last census. The Supreme Federal Court had already ruled racial quotas constitutional, unanimously, in April 2012.
Feature | Detail |
|---|---|
Law | Law 12.711 of 29 August 2012, reviewed every ten years |
Reserved places | 50% of each course at federal universities and institutes |
Sub-quotas | Half for low-income students; racial quotas matching each state’s census share; people with disabilities added in 2016 |
2023 review | Quilombola communities (descendants of escaped enslaved people) added; quota candidates compete first for open places; income limit lowered to one minimum wage per person |
Disputes | Verification committees to check racial self-declaration, criticised as subjective; Santa Catarina’s 2026 state ban on racial quotas overturned by the Supreme Federal Court on 17 April 2026 |
Studies at several universities found little difference in academic performance between quota and non-quota students, and student bodies have become far more diverse. Opponents argue that quotas treat a symptom: the gap opens much earlier, in under-funded public schools, which is where spending should go. Polls in 2021 and 2023 found that between about half and 60% of Brazilians supported racial quotas.
Sources: Wikipedia, “Lei de Cotas” and “Racial quota”, 2026 (Lei 12.711/2012; Lei 14.723/2023).
Evaluating affirmative action
Strengths | Limitations |
|---|---|
Produces fast, measurable change in who holds places and seats (Rwanda’s parliament; Brazil’s universities) | Benefits may go to the better-off members of the group (“elite capture”), as with India’s creamy layer and South Africa’s early BEE deals |
Creates role models and networks that change expectations for the next generation | Can create resentment among groups left out, and claims of reverse discrimination |
Corrects for discrimination that ordinary competition reproduces | Treats symptoms if the causes (poor schools, land inequality) are left untouched |
Places decision-makers from excluded groups where they can change laws and budgets | Representation is not the same as power, especially where one party dominates |
Can be designed to target overlapping disadvantages (Brazil combines school type, income and race) | Group categories are hard to define and to verify, and once created are hard to remove |
The evidence suggests that affirmative action works best where it is precisely targeted, time-limited and combined with investment in the causes of the gap. India’s reservations have reached hundreds of millions of people over 75 years but have become permanent and politically contested; Brazil’s quotas combine race with income and school type and include a ten-year review; Rwanda’s quota changed the composition of parliament within one election but, as the case study shows, much less quickly the lives of most rural women. The power to design such policies lies with national governments, so their success also depends on how democratic and accountable those governments are.
Social entrepreneurship
Governments and aid donors are not the only actors in development. Social entrepreneurship uses the methods of business, such as selling products, charging interest or competing for customers, to achieve a social or environmental aim. It sits between a charity, which depends on donations, and a conventional company, which exists to make profits for its owners.
The appeal of the approach is that a social enterprise can become self-financing and grow without waiting for aid budgets, and that it treats poor people as customers and producers rather than as recipients. Its risk is that the business side can come to dominate: an enterprise under pressure to grow or to repay investors may drift away from the people it was meant to serve. Three forms are especially important for human development: microfinance, alternative trading networks such as Fairtrade, and the frameworks that set out the social responsibilities of transnational corporations (TNCs).
Microfinance organisations and their networks
Many of the world’s poorest adults have no account at a bank. Banks avoid them because their loans would be tiny, they have no collateral (property that can be seized if a loan is not repaid) and they often live far from a branch. Without credit, a farmer cannot buy seed before the harvest and a street trader cannot buy stock in bulk, so moneylenders charging very high interest fill the gap.
Lending is the best-known part of microfinance, known as microcredit, and for many years the whole movement was called after it.
The Grameen Bank model
The model was developed in Bangladesh by the economist Muhammad Yunus. In 1976, during research at the University of Chittagong, he began lending tiny sums to villagers in Jobra, and in October 1983 the project became the Grameen (“village”) Bank under a government ordinance. Its central method is solidarity lending: borrowers, almost all women, form small groups that meet every week with a loan officer. Group members are not legally liable for each other’s loans, but a group in which one member defaults cannot borrow again, so peer support and peer pressure take the place of collateral.
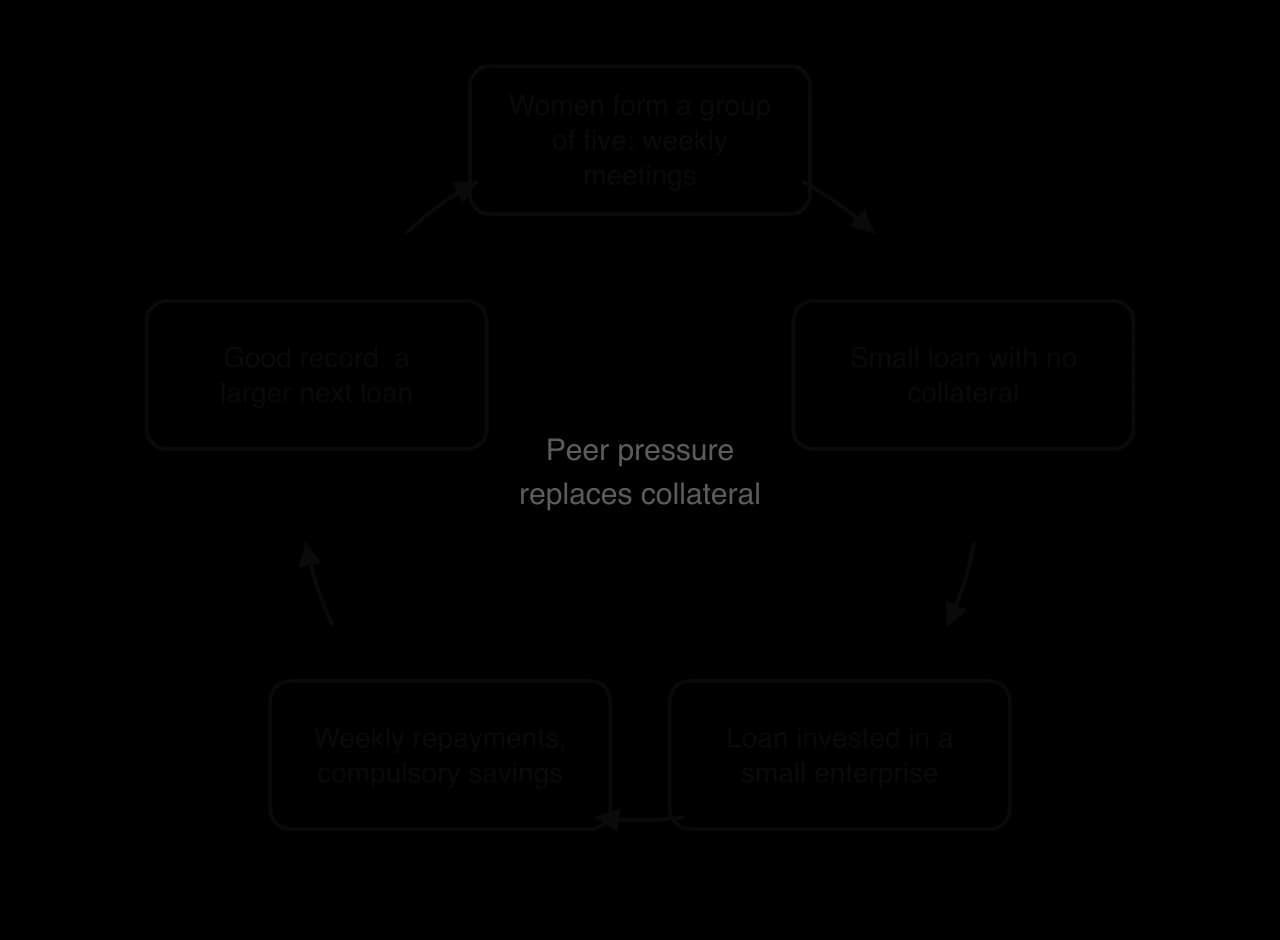
Grameen grew to nearly 9.5 million borrowers by January 2022, 96.8% of them women, with branches covering about 94% of Bangladesh’s villages. It is owned mainly by its borrowers, and the bank and Yunus shared the Nobel Peace Prize in 2006. The model has been copied in more than 64 countries, including by Grameen America, whose borrowers in US cities are all women.
Networks that spread microfinance
Microfinance now works through networks that link places at every scale. BRAC, founded in Bangladesh in 1972 and the largest non-governmental organisation in the world by number of employees, runs microfinance alongside schools and health programmes in Bangladesh and 16 other countries. Kiva, founded in San Francisco in 2005, is an online platform through which more than 2 million lenders worldwide have funded small loans, channelled to borrowers through local partner institutions. Commercial banks, mobile-phone companies and investment funds have also entered the market, which by the early 2010s reached more than 200 million people.
Evaluating microfinance
Supporters argue that microfinance empowers women by giving them income and assets in their own name, smooths household spending through bad seasons, and reaches people that no other institution serves. Grameen reports repayment rates of over 98%, which suggests that poor borrowers are reliable customers.
The evidence is more modest than the early claims. In 2015 the economists Abhijit Banerjee, Dean Karlan and Jonathan Zinman summarised six randomised evaluations of microcredit in six countries on four continents: they found a consistent pattern of modestly positive effects that were not transformative. Loans helped some households invest in businesses and cope with shocks, but on average did not raise incomes, consumption or women’s decision-making power by much.
Commercialisation has brought serious harm in some places. In the Indian state of Andhra Pradesh, lenders such as SKS Microfinance, which listed on the stock exchange in July 2010, expanded rapidly using commission-paid agents, at interest rates of about 28–34% a year. Many households took several loans at once to repay earlier ones. In 2010 the media reported nearly 200 suicides among indebted borrowers, an independent investigation linked SKS staff to at least seven, and the state government intervened with an inquiry and restrictions on lenders. The crisis showed that credit can deepen poverty when it is used for consumption rather than investment, and when lenders put growth before borrowers.
Strengths | Limitations |
|---|---|
Reaches people excluded from banks, mostly women | Average effects on income are small (six randomised studies, 2015) |
Lowers the cost of borrowing compared with moneylenders | Interest rates remain high because tiny loans are costly to administer |
Savings and insurance help households cope with shocks | Multiple loans can trap households in debt, as in Andhra Pradesh in 2010 |
Group meetings build networks, confidence and skills | Loans may be controlled by husbands; peer pressure can be harsh |
Self-financing institutions can grow without aid | Commercial lenders may put profits and growth before social aims |
Sources: Wikipedia, “Grameen Bank”, “BRAC (organisation)”, “Kiva (organization)”, “Microcredit” and “SKS Microfinance”, 2026; Banerjee, Karlan and Zinman, American Economic Journal: Applied Economics 7(1), 2015.
Alternative trading networks: Fairtrade
Many LICs depend on exporting a few agricultural commodities, such as coffee, cocoa, tea and bananas, whose world prices rise and fall sharply. Smallholders sell to traders who have far more market power than they do, and most of the final price of a product goes to roasters, manufacturers and retailers in importing countries. An alternative trading network tries to change those terms.
Two terms need keeping apart. Fair trade is the general idea of trading partnerships that pay producers a fair price; Fairtrade, one word with a capital F, is the certified system run by Fairtrade International.
Certified Fairtrade is the largest and best-known of these systems.
The first certification label, Max Havelaar, was created in the Netherlands in 1988, and Fairtrade International was established in 1997 to bring the national labels together. The system has two financial guarantees. The Fairtrade Minimum Price is a floor paid to the producer organisation whenever the world price falls below it; when the world price is higher, the market price is paid. The Fairtrade Premium is an extra sum paid on top, which the members of each cooperative or workers’ committee decide democratically how to spend. Producers must meet standards on labour, democratic organisation and the environment, checked by the certifier FLOCERT.
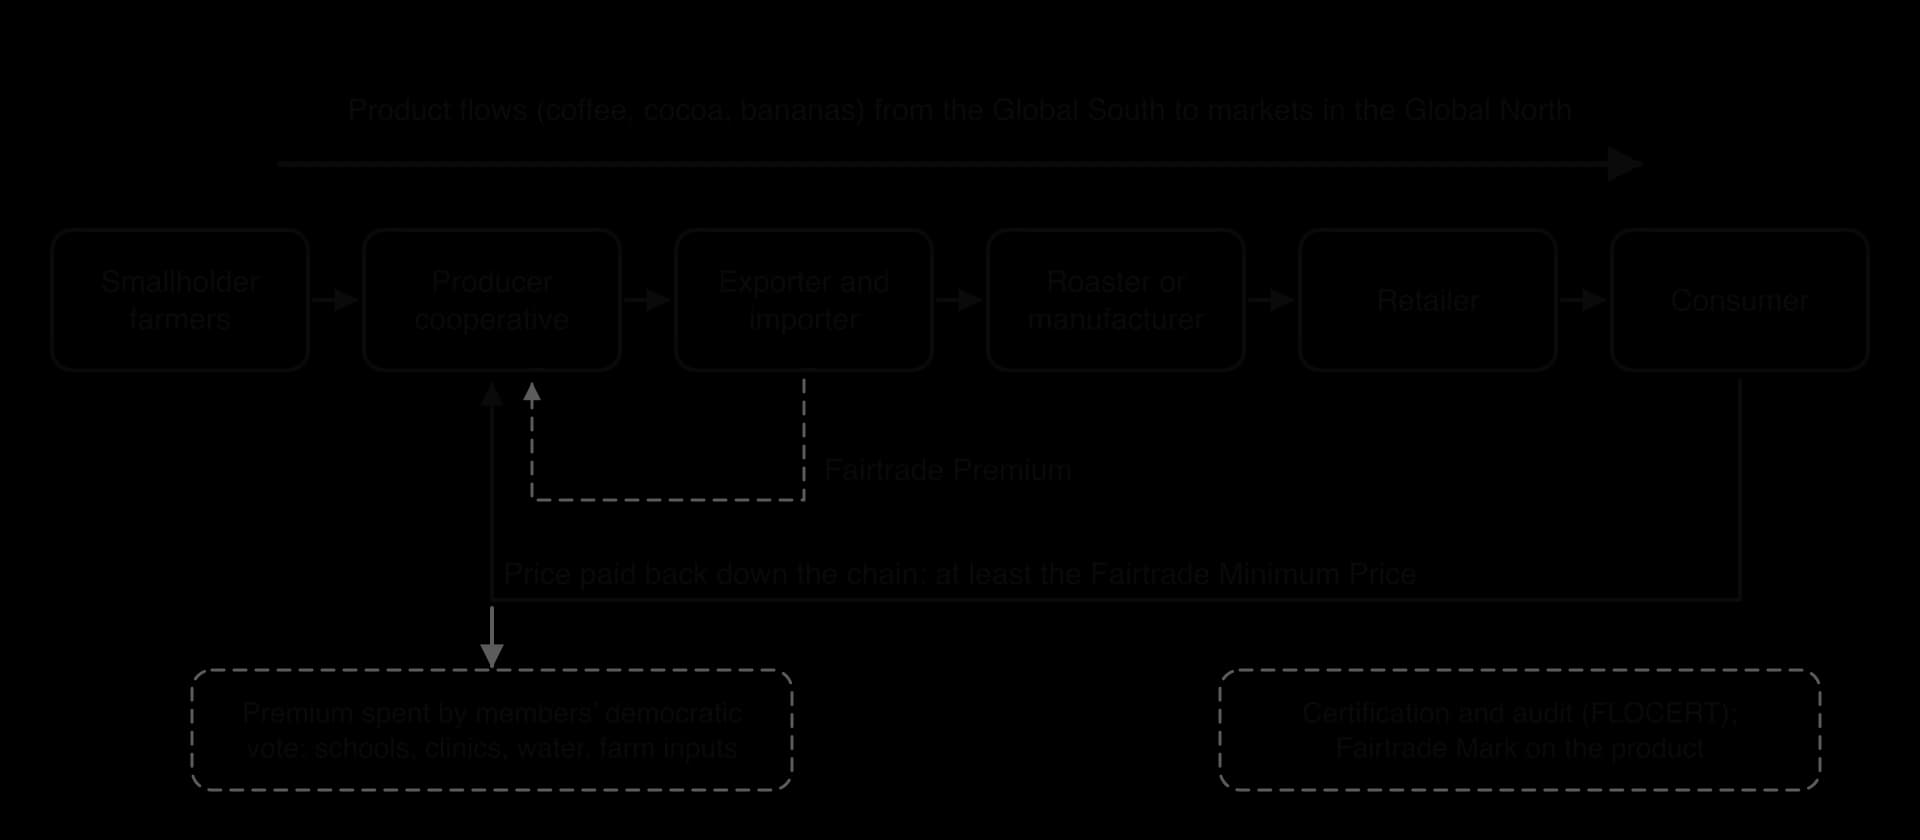
At the end of 2024 there were 1,824 Fairtrade-certified producer organisations, with about 1.87 million farmers and workers, in Africa and the Middle East, Latin America and the Caribbean, and Asia and the Pacific. Africa and the Middle East held about 69% of the farmers and workers and Latin America and the Caribbean about 13%. Producers earned €201.6 million in Fairtrade Premium in 2024, down from €222.8 million in 2022.
 YouTube
Other networks work in different ways. The Rainforest Alliance certifies farms against environmental and labour standards but guarantees no minimum price. Direct trade, used by some specialty coffee and chocolate companies, buys straight from named farms at negotiated prices, without a certifier. Each offers producers a different balance of price security, market access and independence.
Evaluating Fairtrade
Strengths | Limitations |
|---|---|
A price floor protects producers when world prices collapse | Fairtrade products are a small share of world trade in most commodities |
The premium funds schools, clinics, water and farm improvements chosen by members | Certification costs and standards can exclude the poorest farmers |
Cooperatives give smallholders bargaining power and a democratic voice | Hired labourers on members’ farms may gain little; the floor is paid to the cooperative, not each farmer |
Links consumers in HICs with producers in LICs and MICs, raising awareness | Most of the retail price is still captured by manufacturers and retailers |
Encourages environmental standards and bans child labour | Producers often sell only part of their crop on Fairtrade terms |
Fairtrade shows power being renegotiated within a supply chain. It cannot change the structure of world commodity markets, which depend on the choices of governments and very large companies, but it gives organised producers a guaranteed share and a say over how part of the value is spent. Its reach depends on consumers in rich countries choosing, and paying for, certified products.
TNC corporate social responsibility frameworks and global agreements
TNCs organise supply chains that employ tens of millions of people in LICs and MICs, so their standards have a direct effect on human development. Corporate social responsibility (CSR) is a company’s commitment to manage the social and environmental effects of its activities, including those of its suppliers. In climate change, CSR appears as companies’ emissions targets; here the focus is on the frameworks and global agreements that set out what responsible conduct means for workers and communities.
Framework | Date and origin | What it asks of companies | Binding? |
|---|---|---|---|
ILO core conventions | International Labour Organization, from 1919 | Freedom of association, no forced or child labour, no discrimination, safe and healthy workplaces | Binding on states that ratify them, not directly on firms |
OECD Guidelines for Multinational Enterprises | OECD, first adopted 1976, updated 2023 | Standards on labour, environment, human rights, tax, corruption; complaints through national contact points | Voluntary for companies |
UN Global Compact | United Nations, launched 26 July 2000 | Ten principles on human rights, labour, environment and anti-corruption; annual reporting | Voluntary |
UN Guiding Principles on Business and Human Rights | UN Human Rights Council, 16 June 2011 | “Protect, respect and remedy”: states protect, companies respect rights, victims get remedy | Voluntary, but the basis for later laws |
EU Corporate Sustainability Due Diligence Directive | European Union, adopted 2024 | Large companies must identify and prevent human rights and environmental harm in their chains of activities | Binding law in EU member states |
The UN Global Compact is the largest of the voluntary frameworks, with more than 20,000 corporate participants and other stakeholders in over 167 countries. Membership does not certify that a company actually meets the principles, and critics argue that it allows firms to associate themselves with the UN at little cost, a practice sometimes called “bluewashing”.
The UN Guiding Principles introduced the idea that companies should carry out human rights due diligence: actively looking for the harm their business causes, rather than waiting for scandals.
From voluntary to binding: the lesson of Rana Plaza
The collapse of the Rana Plaza building in Savar, near Dhaka in Bangladesh, on 24 April 2013 killed 1,134 garment workers. Many of the international brands supplied by its five factories had voluntary codes of conduct and audit programmes, which had not stopped the illegal extra floors or the order to return to work after cracks appeared. The response, the Accord on Fire and Building Safety in Bangladesh (May 2013), was a legally binding contract between brands and trade unions rather than another voluntary code.
The Accord marked a wider shift towards binding rules: national due diligence laws in France (2017) and Germany, and the EU directive of 2024, whose scope the EU began to narrow again in 2025 under pressure to reduce the burden on business.
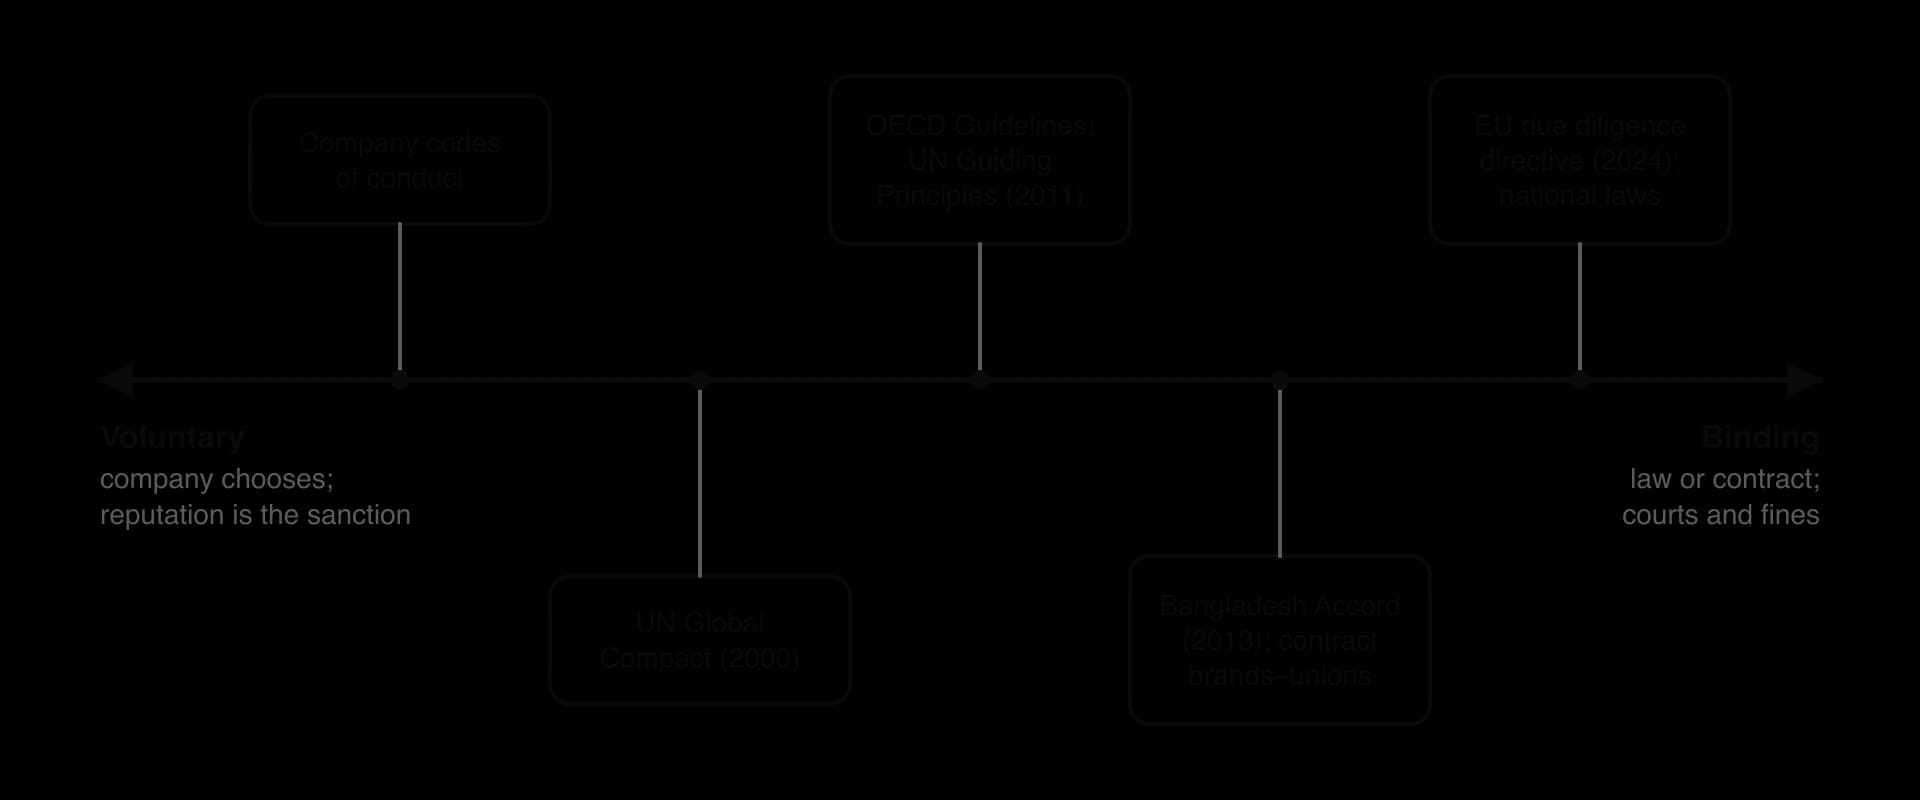
Voluntary frameworks (codes, Global Compact) | Binding agreements and laws (Accord, EU directive) | |
|---|---|---|
Strengths | Flexible; companies of any size and country can join; spread norms quickly | Enforceable by unions, regulators and courts; victims can claim compensation |
Limitations | No penalties; audits can be superficial; reputation is the only sanction | Cover only large firms in some jurisdictions; costly; firms may move sourcing to less-regulated countries |
Who holds power | The company decides what to disclose | Workers, unions and governments gain a say |
Sources: Wikipedia, “United Nations Global Compact”, “Guiding Principles on Business and Human Rights”, “Rana Plaza collapse”, “Accord on Fire and Building Safety in Bangladesh” and “Corporate Sustainability Due Diligence Directive”, 2026; Fairtrade International, Monitoring Report, 17th edition (2024 data), 2026.
Development actions and spatial interactions across scales
Every approach to supporting human development links places at several scales. A Fairtrade cooperative in the highlands of Peru depends on a certifier in Germany, an importer in the Netherlands and shoppers in the United Kingdom; a Kiva lender in Canada funds a tailor in Kenya through a local microfinance institution; an EU directive changes conditions in factories in Bangladesh. Development support is therefore a set of global interactions: flows of money, goods, rules and ideas between places.
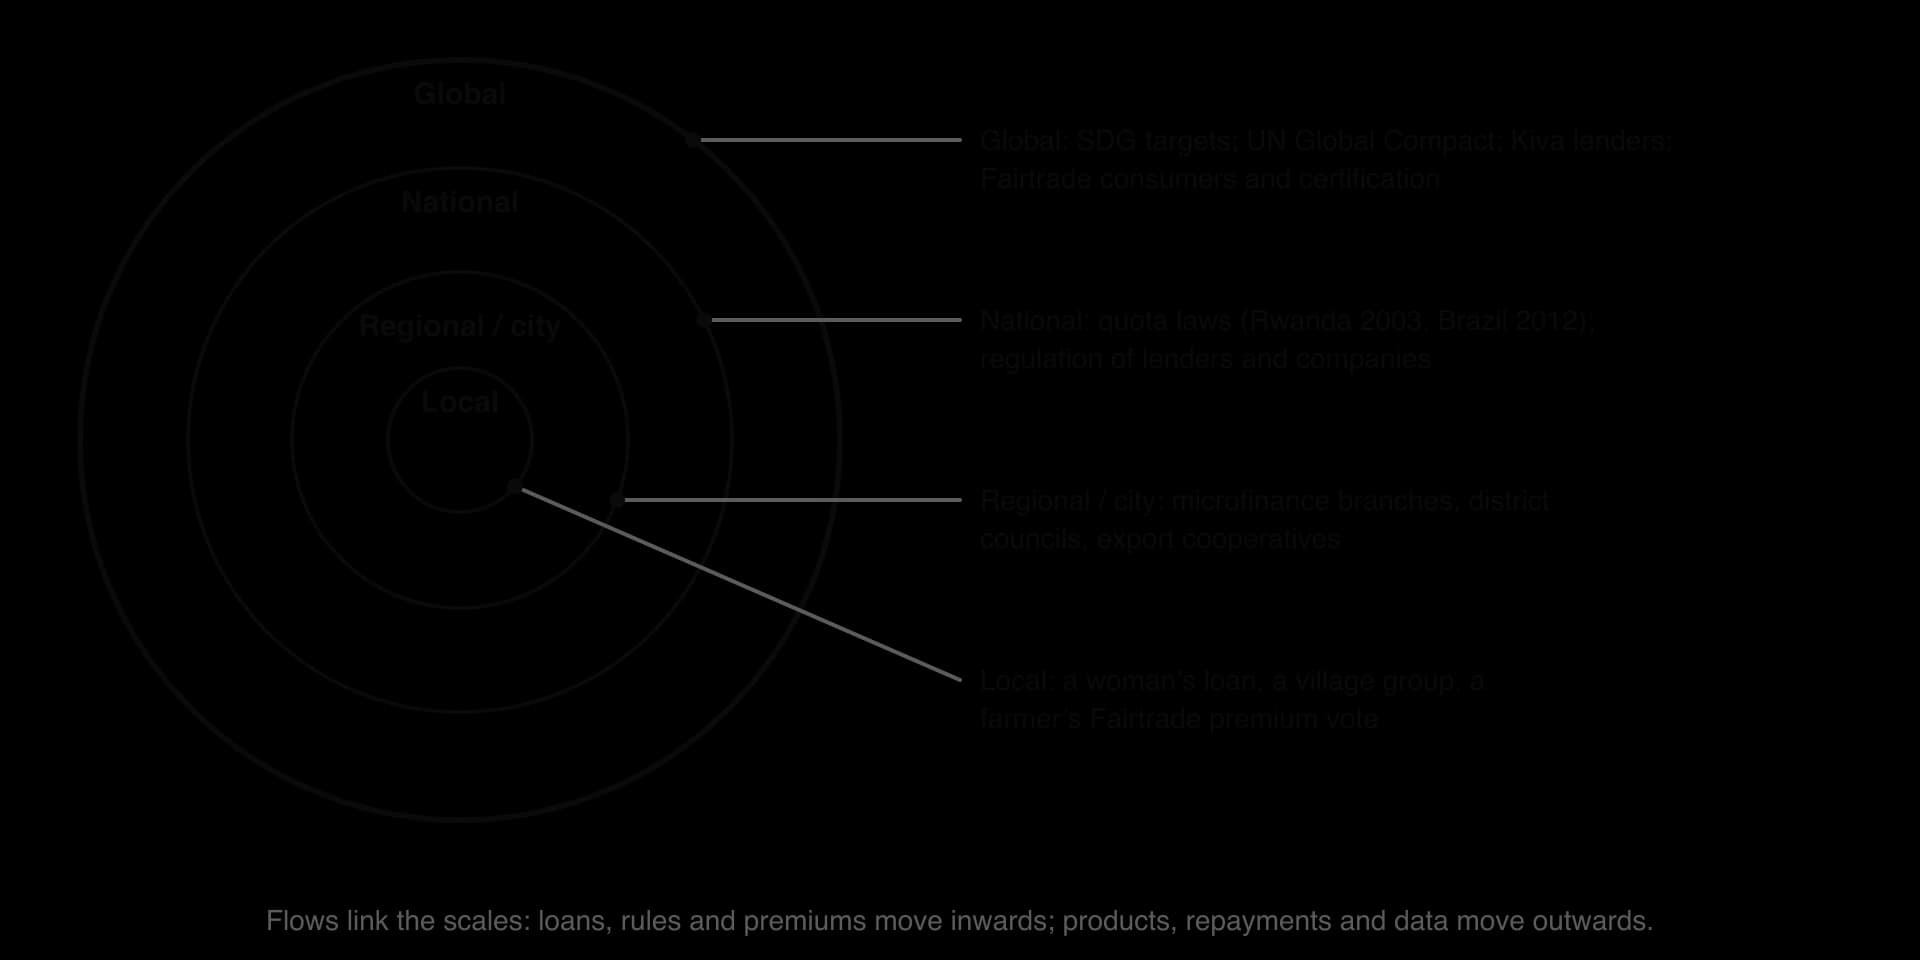
The direction of the flows matters for power. Money, rules and standards usually flow from the Global North and from global institutions towards producers and borrowers in the Global South, while products, repayments and data flow back. This gives the funders and rule-makers great influence over what development means. Some flows run the other way: microfinance began in Bangladesh and was copied in the United States through Grameen America, and constitutional quotas for women spread between countries of the Global South. Remittances sent home by migrants are a much larger flow than either microloans or Fairtrade premiums, and they reach households directly.
Action | Local scale | National scale | Global scale |
|---|---|---|---|
Affirmative action | A woman elected to a district council | Rwanda’s constitution; Brazil’s Law of Quotas | SDG target 5.5; UN Women campaigns |
Microfinance | A village borrowing group | Grameen Bank; state regulation in Andhra Pradesh | Kiva’s online lenders; international investment funds |
Fairtrade | A cooperative’s vote on the premium | National Fairtrade organisations in importing countries | Fairtrade International’s standards; global commodity prices |
CSR frameworks | Safety repairs in one factory | France’s and Germany’s due diligence laws | UN Global Compact; UN Guiding Principles |
Case study: Rwanda, women’s representation and the development gap
Context
Rwanda is a small, landlocked, densely populated country in the highlands of East Africa, bordered by Uganda, Tanzania, Burundi and the Democratic Republic of the Congo (DRC). It covers 26,338 km² and had about 14.3 million people in 2024. With a GNI per capita (Atlas method) of US$1,150 in 2025 it is a low-income country, and most people still farm small plots; coffee and tea are its main cash crops and tourism its leading earner of foreign exchange.
The country’s recent history shapes its politics. Between 7 April and mid-July 1994, during a civil war, Hutu extremist militias killed Tutsi, and moderate Hutu and Twa, in a genocide lasting about 100 days. Scholarly estimates of the Tutsi killed range from about 500,000 to 662,000, and the Rwandan constitution gives a figure of over one million deaths; between 250,000 and 500,000 women were raped. The Rwandan Patriotic Front (RPF), which ended the genocide, has governed ever since, led by Paul Kagame, president since 2000.
Affirmative action in the constitution
Women took leading roles in rebuilding the country after 1994, and the constitution adopted in 2003 wrote gender equality into the structure of the state. Article 10 requires that women occupy at least 30% of positions in decision-making bodies. Article 75 sets the composition of the 80-member Chamber of Deputies: 53 deputies elected by proportional representation from party lists, two chosen by the National Youth Council, one by the federation of associations of people with disabilities, and 24 seats reserved for women, elected by electoral colleges of local officials in each province. Women can also stand for any of the other 56 seats.
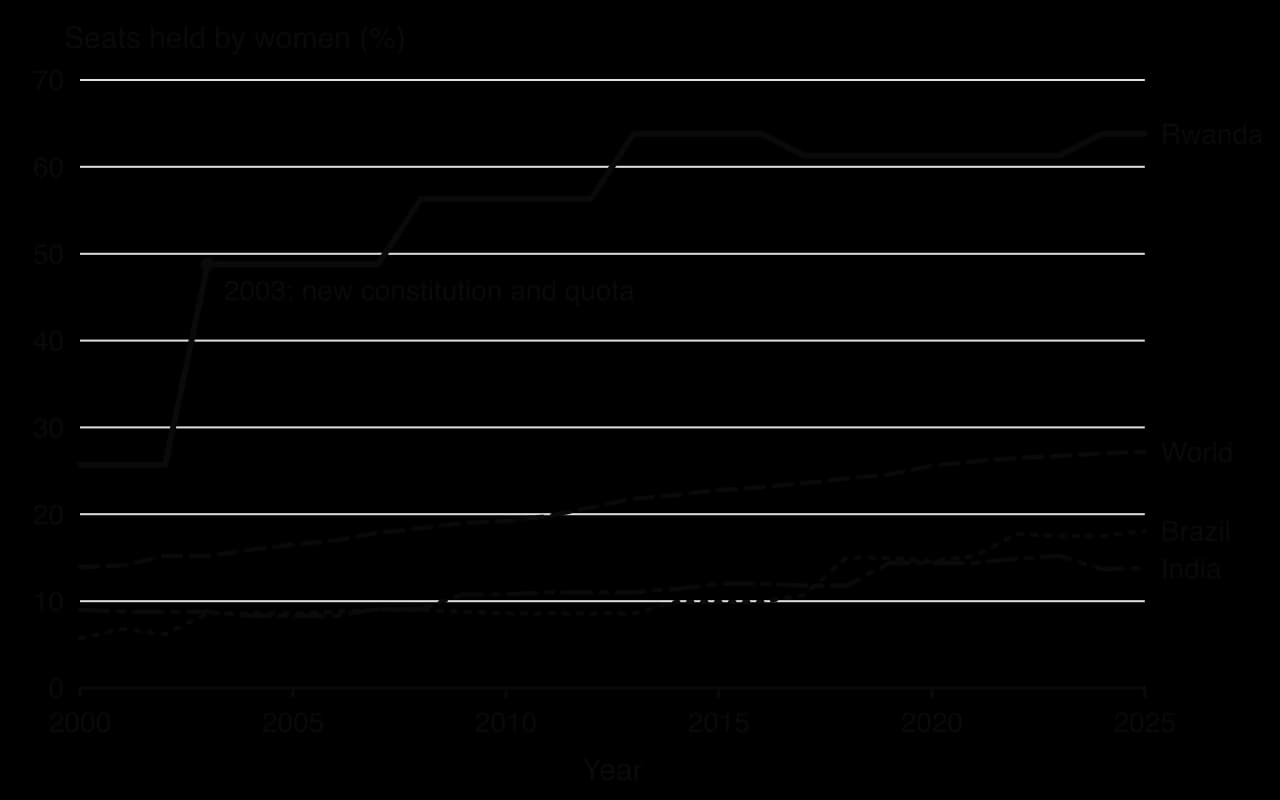
The quota guarantees 30% of seats, but the outcome has been more than double that. In the 2003 election women won 39 of 80 seats (48.8%); after the 2013 and 2024 elections they held 51 seats (63.8%). Since 24 of those seats are reserved, women won 27 of the 56 open seats in 2024, close to half. The quota therefore changed the expectations of parties and voters as well as filling the reserved places, which is the main argument made for quotas as a temporary measure.
Impacts on laws and on development
Women legislators have been associated with laws that strengthen women’s rights. Daughters and sons were given equal rights to inherit land, a new civil code allowed married women to open bank accounts and act in their own name, a Gender Monitoring Office was created in 2007 to hold institutions to account, and in 2008 Rwanda became the first country in sub-Saharan Africa to pass a law specifically against gender-based violence. Government budgets must also show how spending affects women and men (gender-based budgeting).
Over the same period, development indicators improved rapidly from a very low base. The table compares Rwanda in 2000 and the most recent year with the averages for sub-Saharan Africa.
Indicator | Rwanda, 2000 | Rwanda, latest | Sub-Saharan Africa, 2023 |
|---|---|---|---|
Human Development Index | 0.340 | 0.578 (2023) | 0.568 |
Gender Inequality Index (0 = equality) | 0.561 | 0.394 (2023) | 0.558 |
Life expectancy at birth (years) | 47.8 | 68.0 (2024) | 62.5 |
Maternal mortality ratio (per 100,000 live births) | 1,007 | 259 (2023) | 509 |
Population below US$3.00 a day, 2021 PPP (%) | 82.3 | 38.6 (2023) | – |
Women aged 25+ with some secondary education (%) | 8.1 (2010) | 20.5 (2023) | 32.1 |
Seats held by women, lower house (%) | 25.7 | 63.8 (2025) | – |
Sources: UNDP, Human Development Report 2025, composite indices time series (HDI, GII, maternal mortality, secondary education); World Bank WDI (life expectancy, poverty at US$3.00 a day, GNI per capita, population), fetched October 2026; IPU via World Bank (seats).
Rwanda’s HDI rose by 0.238 between 2000 and 2023, faster than the regional average, and its GII fell from about the regional level to well below it. Maternal mortality fell by about three-quarters and life expectancy rose by 20 years. These gains cannot be credited to women’s representation alone: they also reflect recovery from the genocide, rapid economic growth, expanded health services and large flows of aid.
What has changed less
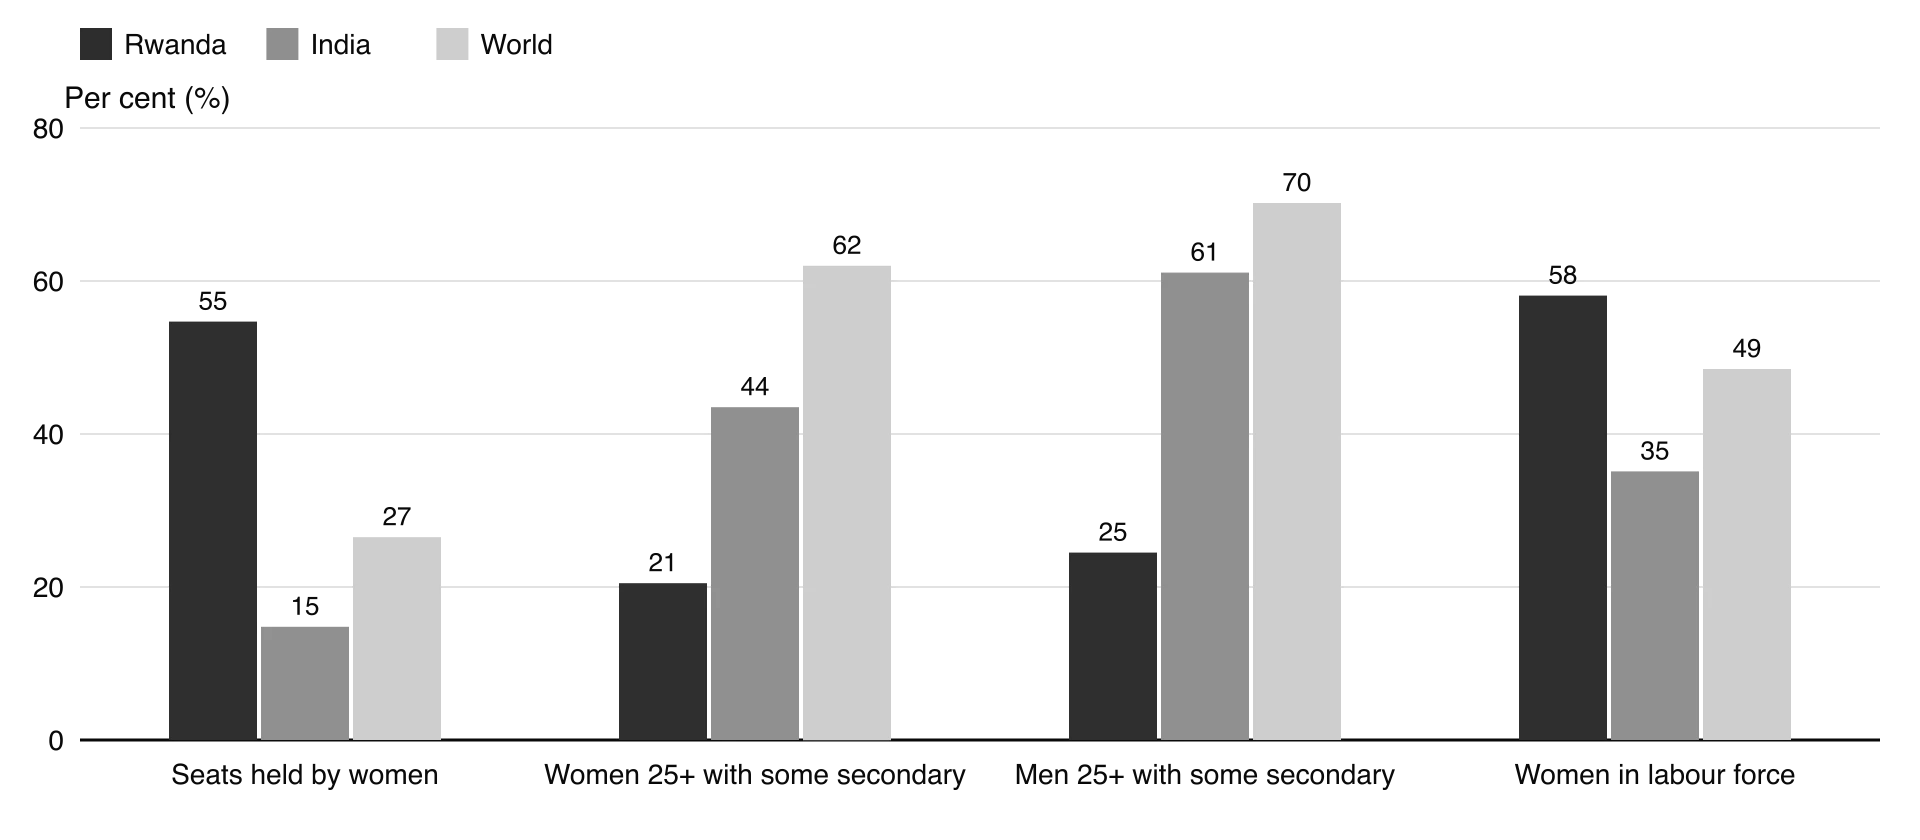
The chart shows the imbalance in Rwanda’s development. Only 20.5% of women and 24.5% of men aged 25 and over have any secondary education; the share for women is the 24th lowest of 185 countries with data, and most women’s high labour force participation (58.1%) is in subsistence farming and informal work, often alongside most of the unpaid care. About 31% of Rwanda’s human development is lost to inequality (IHDI 0.399), much as in India. The country remains in the medium human development group, 159th of 193.
Critics also question how much power the deputies hold. Rwanda’s parliament works within a political system dominated by the RPF, in which opposition parties are restricted and critics of the government have been arrested or have left the country. Women legislators who disagree with the governing party have little room to campaign independently, and civil society organisations face government controls. Studies of rural areas suggest that national laws on inheritance and violence are only partly applied at village level, where customary norms still decide who controls land and household income.
What the case shows
Concept | How Rwanda shows it |
|---|---|
Place | A post-genocide, low-income, landlocked state, where the trauma of 1994 and the dominance of one party shaped how and why the quota was introduced |
Process | A quota changed the composition of parliament within one election; the laws that followed changed rights faster than social norms |
Power | Women gained formal political presence, but real power remains concentrated in the governing party and the presidency |
Possibility | Rwanda’s quota shows what a legislative quota can achieve quickly; whether representation will narrow the education and income gaps is still uncertain |
Rwanda therefore shows both the potential and the limits of affirmative action. A constitutional quota produced the most female parliament in the world and was followed by laws that improved women’s legal position, and the country’s GII is now lower than its income would predict. It also shows that one indicator of empowerment can advance far ahead of the others, and that representation in a national institution does not, on its own, close the development gap for rural women.
Explain why the share of women deputies in Rwanda is far higher than the 30% the constitution requires.
To what extent can Rwanda’s improvements in maternal mortality and life expectancy since 2000 be attributed to women’s political representation?
Examine why Rwanda’s GII (0.394) is almost the same as India’s (0.403), although women hold four times the share of seats.
Sources: Constitution of Rwanda (2003, revised 2015), Articles 10 and 75, via Constitute Project; Wikipedia, “Rwanda”, “Politics of Rwanda”, “Rwandan genocide” and “Gender equality in Rwanda”, 2026; UNDP HDR 2025; World Bank WDI, 2026.
Exam practice
Paper 3 sets one of its three questions on Unit 5. The question has two parts on the same unit: part (a) for 12 marks, usually “Analyse…”, “Explain how…” or “Examine…”, and part (b) for 16 marks, usually a quoted statement followed by “Discuss…” or “To what extent do you agree…”. Both are marked with holistic markbands rather than point by point.
Part (b) is worth more and asks for more: the top bands need synthesis and evaluation as well as analysis.
Part (b) answers are longer and must range more widely. The strongest plans build synthesis and evaluation into each paragraph rather than leaving them to the end.
A second part (a) question on the same topic could ask about measurement rather than support. The key is to analyse the indices rather than describe them.
Summary
Human development is the expansion of people’s capabilities and choices; it is multidimensional and wider than economic growth.
The SDGs provide criteria for measuring development (17 goals, 169 targets, 234 unique indicators), but many indicators have data gaps and hide trade-offs.
The HDI combines health, education and income; it hides inequality, gender, freedom and environmental pressure, which the IHDI, PHDI, MPI and GII try to capture.
The GII measures inequality between women and men in reproductive health, empowerment and work; higher values mean greater inequality, and it omits unpaid work, violence and pay.
Empowering women, Indigenous peoples and minority groups means rights and power as well as services: land, language, legal equality, self-governance (Nunavut, Sámi parliaments) and UNDRIP.
Affirmative action (India’s reservations, Brazil’s Law of Quotas, Rwanda’s constitutional quota) closes gaps in representation quickly, but risks elite capture and resentment and does not by itself close gaps in health and income.
Microfinance, through Grameen, BRAC and Kiva, widens access to credit, with modest average effects and a risk of over-indebtedness, as in Andhra Pradesh in 2010.
Fairtrade guarantees a minimum price and a premium to about 1.87 million farmers and workers, but reaches only a small share of trade.
CSR has moved from voluntary frameworks such as the UN Global Compact of 2000 towards binding agreements: the Bangladesh Accord after Rana Plaza in 2013 and the EU directive of 2024.
All these actions link households, nations and global institutions; their success depends on decisions at every scale and on who holds power.
Self-check
- To do:
I can distinguish between economic growth and human development, and explain why development is multidimensional.
- To do:
I can examine how the SDGs are used as criteria for measuring development, and the limits of their data.
- To do:
I can evaluate the validity and reliability of the HDI, IHDI, MPI and GII, with figures.
- To do:
I can construct and interpret a development diamond and a scatter graph of the HDI against the GII.
- To do:
I can explain how women, Indigenous peoples and minority groups are empowered, with named examples.
- To do:
I can evaluate affirmative action using India, Brazil and Rwanda as detailed examples.
- To do:
I can explain how microfinance, Fairtrade and CSR frameworks support human development, and evaluate each.
- To do:
I can analyse how development actions link the local, national and global scales.