Notes on 2.2 Consequences of global climate change
Learning objectives
Describe how climate change is changing the water stored in ice and oceans, and explain the causes of global and local sea-level rise.
Explain how carbon is stored in and exchanged between the atmosphere, oceans, ice and biosphere, and how warming can turn carbon sinks into sources.
Examine how climate change affects the frequency and severity of extreme weather events, including heatwaves and drought, using attribution science.
Explain spatial changes in biomes, habitats and animal migration patterns, with located examples.
Evaluate the effects of climate change on agriculture, including crop yields, the limits of cultivation and soil erosion, in different places.
Explain the impacts of climate change on human health, migration and ocean transport routes.
Analyse projections of change under different climate scenarios, and discuss why the effects are uneven and uncertain in timing, scale and impact.
Introduction
The extra energy trapped by the enhanced greenhouse effect does not only raise air temperatures. It melts ice, warms and expands the oceans, changes how much carbon the land and sea can store, alters rainfall and the frequency of extreme events, and moves the places where plants, animals and crops can live. These physical changes then affect human health, where people live and how goods move around the world.
The consequences of climate change are a clear example of place and process working together. The same global process, warming of about 1.1–1.5 °C so far, produces very different outcomes in different places, depending on whether a place is a low-lying delta, a dry grassland, a mountain valley fed by glaciers or a high-latitude farming region. Some places gain longer growing seasons or new shipping routes, while many lose crops, water supplies, coastline or lives.
Water stored in ice: the cryosphere
About 69% of the Earth’s fresh water is frozen in ice sheets, glaciers and ground ice. This frozen part of the Earth system is the cryosphere. It acts as a long-term store in the hydrological cycle: water that falls as snow can remain locked up as ice for hundreds of thousands of years before it melts and returns to the oceans.
Part of the cryosphere | Where it is | How climate change is affecting it |
|---|---|---|
Ice sheets | Greenland and Antarctica, on land | Losing mass; the rate of ice-sheet loss increased four times between 1992–1999 and 2010–2019 |
Mountain glaciers | Himalaya, Andes, Alps, Alaska, Patagonia and other ranges | Almost all retreating at the same time, at a rate unprecedented in at least 2,000 years |
Sea ice | Floating on the Arctic Ocean and around Antarctica | Arctic September sea-ice area about 40% smaller in 2010–2019 than in 1979–1988; the September minimum extent is falling by about 14% of its 1991–2020 average per decade. Antarctic sea ice showed no clear trend until its record lows after 2016 |
Snow cover | Northern continents in winter and spring | Northern Hemisphere spring snow cover has decreased since 1950 |
Permafrost | Siberia, Alaska, northern Canada, Tibetan Plateau | Warming and thawing, releasing carbon |
Sources: IPCC AR6 Working Group I, Summary for Policymakers, 2021; WMO, State of the Global Climate 2025, 2026.
Glacier retreat and the world’s water towers
A glacier advances when more snow accumulates each year than melts, and retreats when melting exceeds accumulation, so its front moves back up the valley. Glacier retreat is now happening almost everywhere at once. Of the ten years since 1950 in which the world’s reference glaciers lost the most ice, eight have come since 2016, and the largest loss was in 2022/2023. Switzerland’s Great Aletsch Glacier, the longest in the Alps, has retreated by about 3.2 km since 1870, 1.3 km of it since 1980.
Mountain glaciers are called “water towers” because they store winter precipitation and release it as meltwater in the warm, dry season, when rivers would otherwise be low. About 1.4 billion people depend on the five main rivers that flow from the Hindu Kush–Himalaya, including the Indus, Ganges and Brahmaputra. In the Andes, cities such as La Paz in Bolivia and Lima in Peru rely partly on glacier meltwater in the dry season.
Retreat affects water supply in two stages. At first, faster melting increases river flow, which can raise the risk of floods and of glacial lakes bursting their moraine dams. Once the glacier has shrunk enough, meltwater reaches a maximum (peak water) and then declines, so dry-season flows fall. Some Andean and Alpine basins have already passed peak water, while many larger Himalayan glaciers are projected to reach it in the middle of the century. Glacier lake outburst floods are a growing hazard in the Himalaya and the Andes, where meltwater lakes dammed by loose moraine are getting larger.
Water stored in the oceans: sea-level rise
Sea-level rise is the increase in the average height of the ocean surface. Global mean sea level is measured by tide gauges along coasts, some with records over 150 years long, and since 1993 by satellites that measure the height of the sea surface across the whole ocean from orbit.
Global (eustatic) sea level rises for two main reasons. Thermal expansion happens because water expands as it warms: the ocean has absorbed about 91% of the extra heat in the climate system, and warmer water takes up more space. Melting land ice adds water to the ocean: meltwater and icebergs from glaciers and the Greenland and Antarctic ice sheets increase its volume. Changes in water stored on land, such as the pumping of groundwater that ends up in the sea, add a smaller amount.
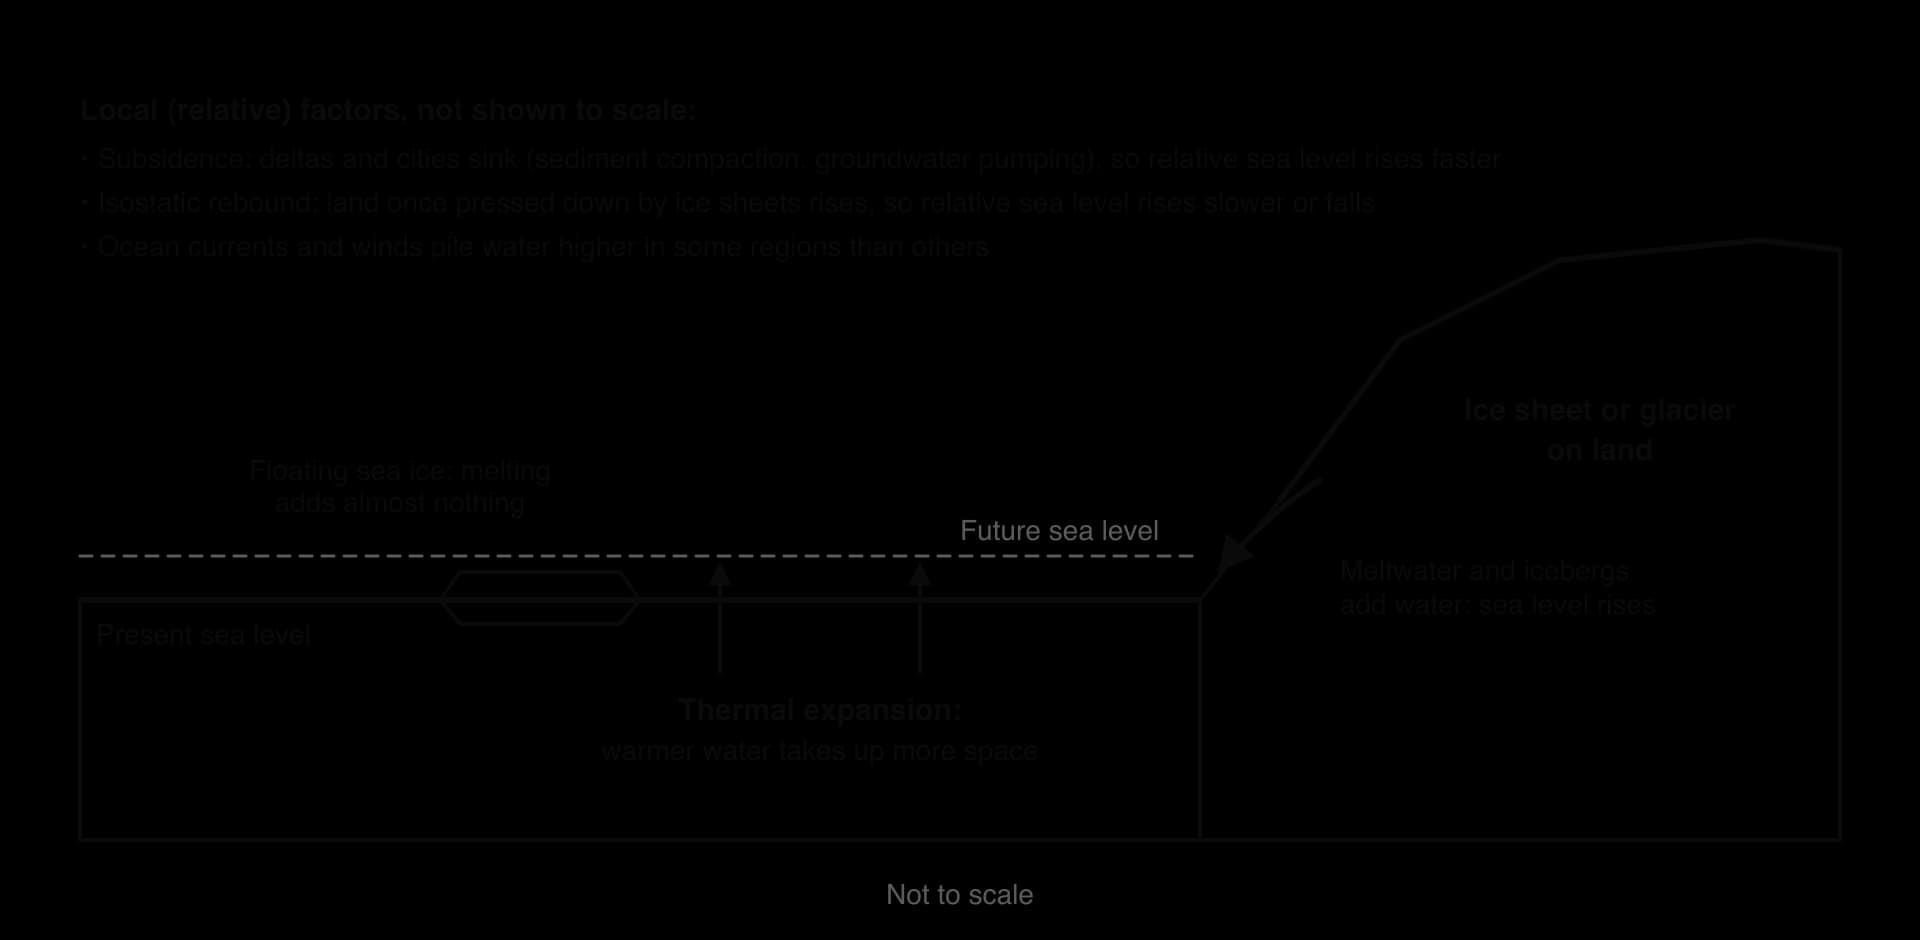
The IPCC assessed the share of each cause between 1971 and 2018. Thermal expansion contributed about half of the rise, with glaciers and ice sheets together contributing about two-fifths. Since about 2006, ice loss from glaciers and ice sheets has become the largest contributor, because the rate of ice-sheet loss has increased so quickly.

How fast sea level is rising
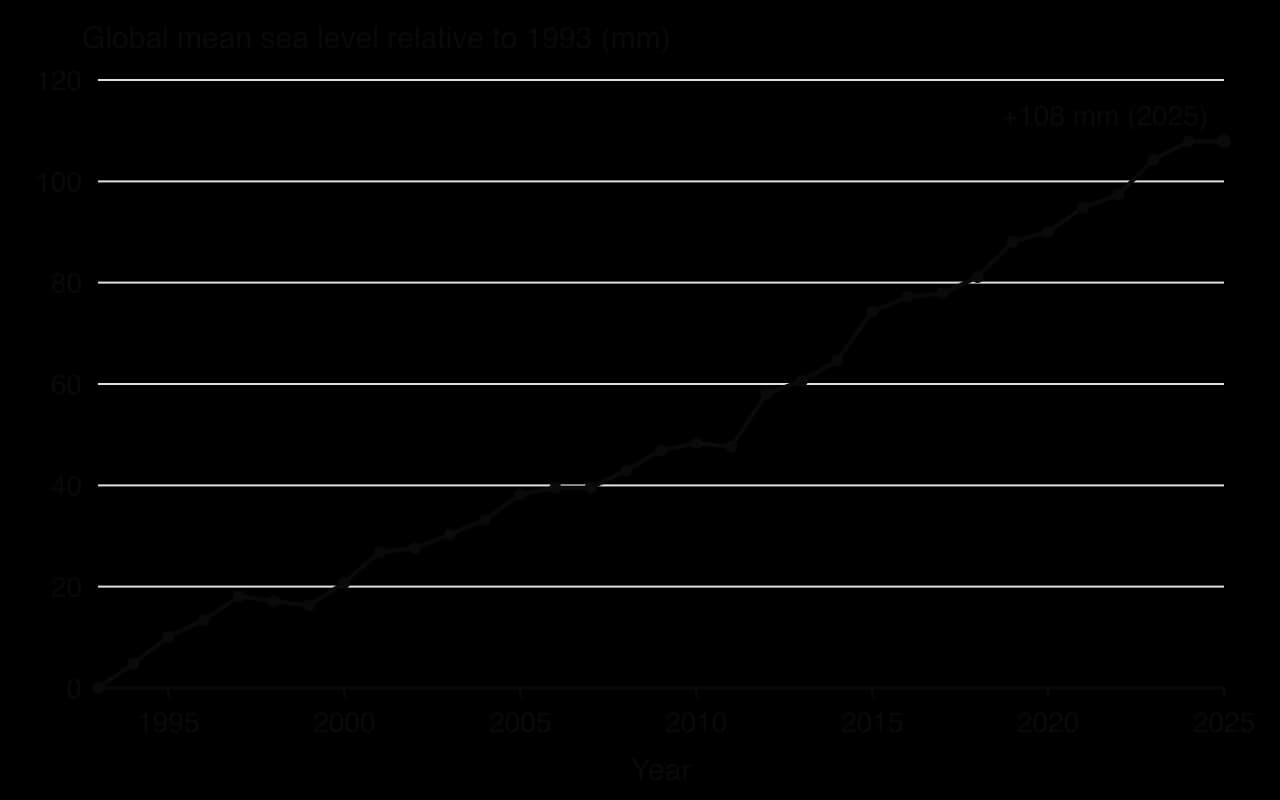
Global mean sea level rose by about 0.20 m between 1901 and 2018. The rate is increasing: about 1.3 mm per year in 1901–1971, 1.9 mm per year in 1971–2006 and 3.7 mm per year in 2006–2018. Satellite measurements show the same acceleration: about 2.65 mm per year in 1993–2011 and about 4.75 mm per year in 2012–2025, by which time global mean sea level stood about 11 cm higher than in January 1993.
Sources: IPCC AR6 WGI Summary for Policymakers, 2021; WMO, State of the Global Climate 2025, 2026.
 YouTube
Future sea-level rise
Sea level will keep rising for centuries, even if emissions stop, because the deep ocean warms slowly and ice sheets take a long time to respond. The IPCC projects that by 2100, relative to 1995–2014, global mean sea level is likely to rise by 0.28–0.55 m under a very low emissions scenario and by 0.63–1.01 m under a very high emissions scenario. A rise approaching 2 m by 2100 cannot be ruled out under very high emissions, because of deep uncertainty about how Antarctic ice sheets might collapse.
Local sea-level change
The sea does not rise by the same amount everywhere. Relative sea level, the height of the sea against the land at a particular place, also depends on vertical movements of the land.
In large deltas and coastal cities, land is subsiding as sediments compact and as groundwater, oil or gas is pumped out, so relative sea level rises much faster than the global average; Jakarta, Bangkok and the Mekong and Ganges–Brahmaputra deltas are examples. In places that were covered by thick ice sheets in the last ice age, such as Scandinavia and Hudson Bay in Canada, the land is still rising slowly (isostatic rebound), so relative sea level is rising slowly or even falling. Winds, currents and differences in ocean warming also make sea level rise faster in some ocean basins, such as the western tropical Pacific.
Carbon stored in ice, oceans and the biosphere
Carbon moves continually between the atmosphere, the oceans, living things, soils and rocks in the carbon cycle. A carbon store is a part of the Earth system that holds carbon, such as the deep ocean, a forest or a peat bog. A carbon sink is a store that is currently taking in more carbon than it releases; a store that releases more than it takes in is a carbon source.
Whether a store acts as a sink or a source can change. A growing forest is a sink; the same forest becomes a source when it burns or dies back. Climate change is altering the balance of many stores, which feeds back on the concentration of carbon dioxide in the air.
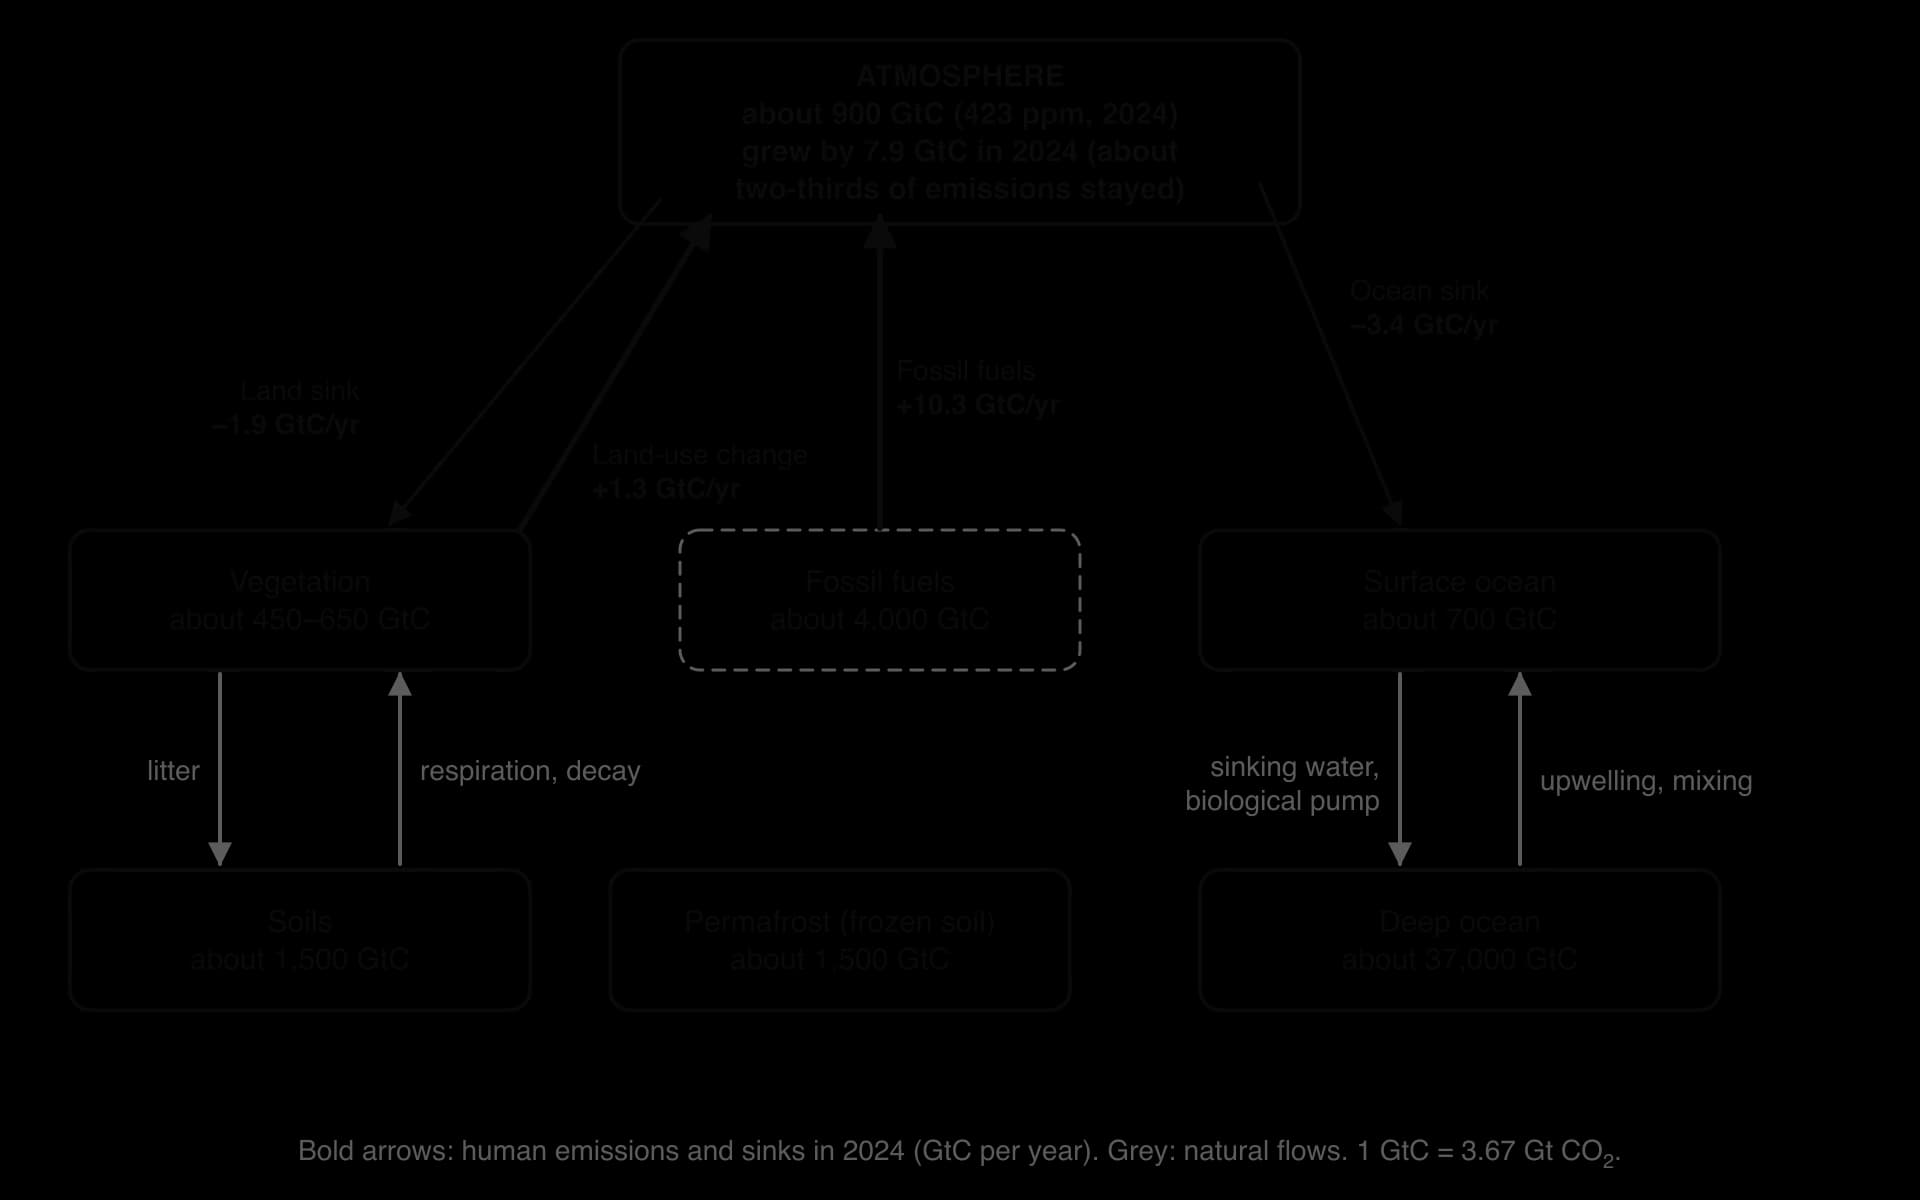
The diagram shows the human disturbance to the carbon cycle. In 2024, fossil fuels released about 10.3 billion tonnes of carbon (GtC) and land-use change about 1.3 GtC. Natural sinks normally remove roughly half of this: over 2015–2024 the ocean took up about 3.2 GtC a year and the land about 2.4 GtC a year, while the amount in the atmosphere grew by about 5.6 GtC a year. The Global Carbon Project estimates that climate change has already weakened the land and ocean sinks enough to account for about 8% of the rise in atmospheric carbon dioxide since 1960.
Carbon in the oceans and ocean acidification
The oceans absorb about a quarter of the carbon dioxide emitted by human activity each year. The gas dissolves at the sea surface, especially in cold water at high latitudes, and some is carried to the deep ocean by sinking currents and by the biological pump, in which plankton take up carbon near the surface and sink when they die. Warmer water dissolves less carbon dioxide, and warming makes the surface ocean more stratified, which slows mixing, so the ocean sink is projected to take up a smaller proportion of emissions in future.
Absorbing carbon dioxide changes the chemistry of seawater. Dissolved CO₂ forms carbonic acid, which releases hydrogen ions and lowers the pH; some of the extra hydrogen ions combine with carbonate ions, leaving less carbonate for shell-building organisms. This process is ocean acidification. Surface ocean pH has fallen from about 8.17 before industrialisation to about 8.08, a fall of about 0.1 units, which is an increase of about 26% in hydrogen ion concentration because the pH scale is logarithmic. Seawater is still alkaline (pH above 7); “acidification” describes the direction of change.
Acidification makes it harder for corals, oysters, mussels, sea urchins and tiny planktonic snails called pteropods to build their calcium carbonate shells and skeletons. The IPCC reports that ocean warming and acidification have already harmed shellfish farming and fisheries in some regions. Projected surface pH by 2100 is about 8.0 under low emissions and about 7.7 under very high emissions.
Coral bleaching
Warm-water coral reefs are also threatened directly by heat. Corals live in partnership with tiny algae that live inside their tissues and provide them with food by photosynthesis. When the water stays about 1 °C or more above the usual summer maximum for several weeks, the corals expel the algae and turn white. This is coral bleaching. Bleached corals can recover if temperatures fall quickly, but prolonged heat kills them.
Australia’s Great Barrier Reef, the world’s largest coral reef system, has suffered mass bleaching in 1998, 2002, 2016, 2017, 2020, 2022, 2024 and 2025, six times in ten years. In 2016, about 67% of corals died in the worst-affected northern section. The IPCC assesses warm-water coral reefs as facing very high risk even at 1.5 °C of warming. Corals take many years to regrow after mass mortality, so events only one to three years apart leave little time for recovery.
Carbon in the biosphere: sinks that may become sources
Forests, grasslands, soils and peatlands hold more carbon than the atmosphere and have absorbed about a fifth to a quarter of human emissions each year. Warming can turn some of these sinks into sources in three ways.
Drought and heat stress slow tree growth and kill trees. Parts of the south-eastern Amazon, where drought, fire and forest clearance overlap, now release more carbon than they absorb in some years.
Wildfire releases carbon stored in trees and soils within hours. Fires in the boreal forests of Canada and Siberia have become larger and more frequent; Canada’s 2023 season is the case study.
Thawing and drying of permafrost and peatlands lets microbes decompose organic matter that had been locked away for thousands of years (the permafrost carbon feedback).
Carbon stored in ice is mostly carbon in permafrost, which holds about twice as much carbon as the atmosphere. Its release through the permafrost carbon feedback is one of the clearest examples of a consequence of warming that adds to its cause.
Extreme weather events
An extreme weather event is a weather event that is rare at a particular place and time of year, such as a heatwave, heavy rainfall, a drought or an intense tropical cyclone. Climate change makes many such events more frequent or more severe, because a warmer atmosphere holds more energy and more water vapour.
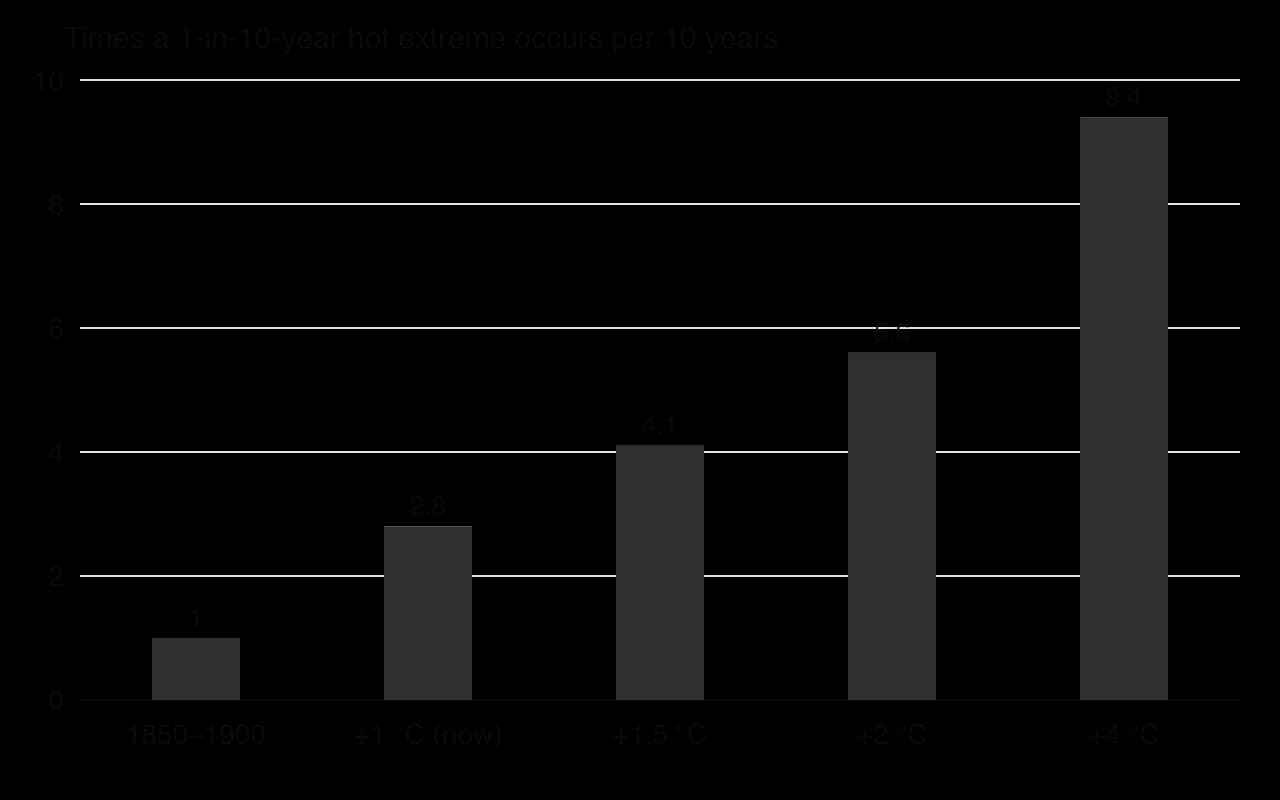
A small shift in the average makes extremes much more frequent. If the whole range of summer temperatures shifts by 1 °C, temperatures that used to be exceeded once in ten years are exceeded much more often. The IPCC calculated that a hot extreme that occurred on average once in ten years in a climate without human influence now happens about 2.8 times in ten years, and would happen 4.1 times at 1.5 °C of warming and 9.4 times at 4 °C.
Heatwaves
A heatwave is a period of several days of unusually high temperatures for a place. Heatwaves are the extreme events most clearly linked to warming. The summers of 2022, 2023 and 2024 in Europe were among the hottest on record: a study by the Barcelona Institute for Global Health estimated about 67,900 heat-related deaths in Europe in summer 2022, about 50,800 in 2023 and 62,775 in summer 2024, when Italy had about 19,000 and Greece the highest death rate, 574 per million people.
Heavy rainfall and tropical cyclones
Warmer air holds about 7% more water vapour for each 1 °C of warming, so the heaviest rainfall events become more intense: the IPCC projects that extreme daily rainfall will intensify by about 7% for each 1 °C of global warming. The proportion of the most intense tropical cyclones (category 4–5) and their peak wind speeds are also projected to increase.
In 2022, monsoon rains in Pakistan flooded about 75,000 km², about 9% of the country, and killed 1,739 people; a rapid attribution study found that the heaviest five-day rainfall in Sindh and Balochistan provinces was about 75% more intense than it would have been without warming.
Drought
A drought is a long period with much less water than normal. Geographers distinguish three types, which follow one another as a dry spell continues. A meteorological drought is a shortage of rainfall; an agricultural drought is a shortage of soil moisture for crops and pasture; a hydrological drought is low water in rivers, lakes, reservoirs and aquifers.
Climate change makes droughts more severe mainly by increasing evaporation: higher temperatures draw more water from soils and plants, so even normal rainfall leaves the land drier. The IPCC reports that human influence has increased agricultural and ecological droughts in some regions. In the Horn of Africa (Somalia, Ethiopia and Kenya), five failed rainy seasons in a row between 2020 and 2023 brought the driest conditions in over 40 years and killed about 9.5 million livestock, the main source of food and income for pastoralist families. An attribution study found that climate change had made such an agricultural drought about 100 times more likely.
Attribution science
No single event can be said to have been “caused” by climate change, because extreme weather has always occurred. Attribution science asks a different question: how much more likely, or how much more intense, has climate change made this kind of event? Scientists compare the observed event with thousands of simulations of two worlds, today’s climate and a climate without human greenhouse gases, and count how often the event occurs in each.
Biomes, habitats and animal migration
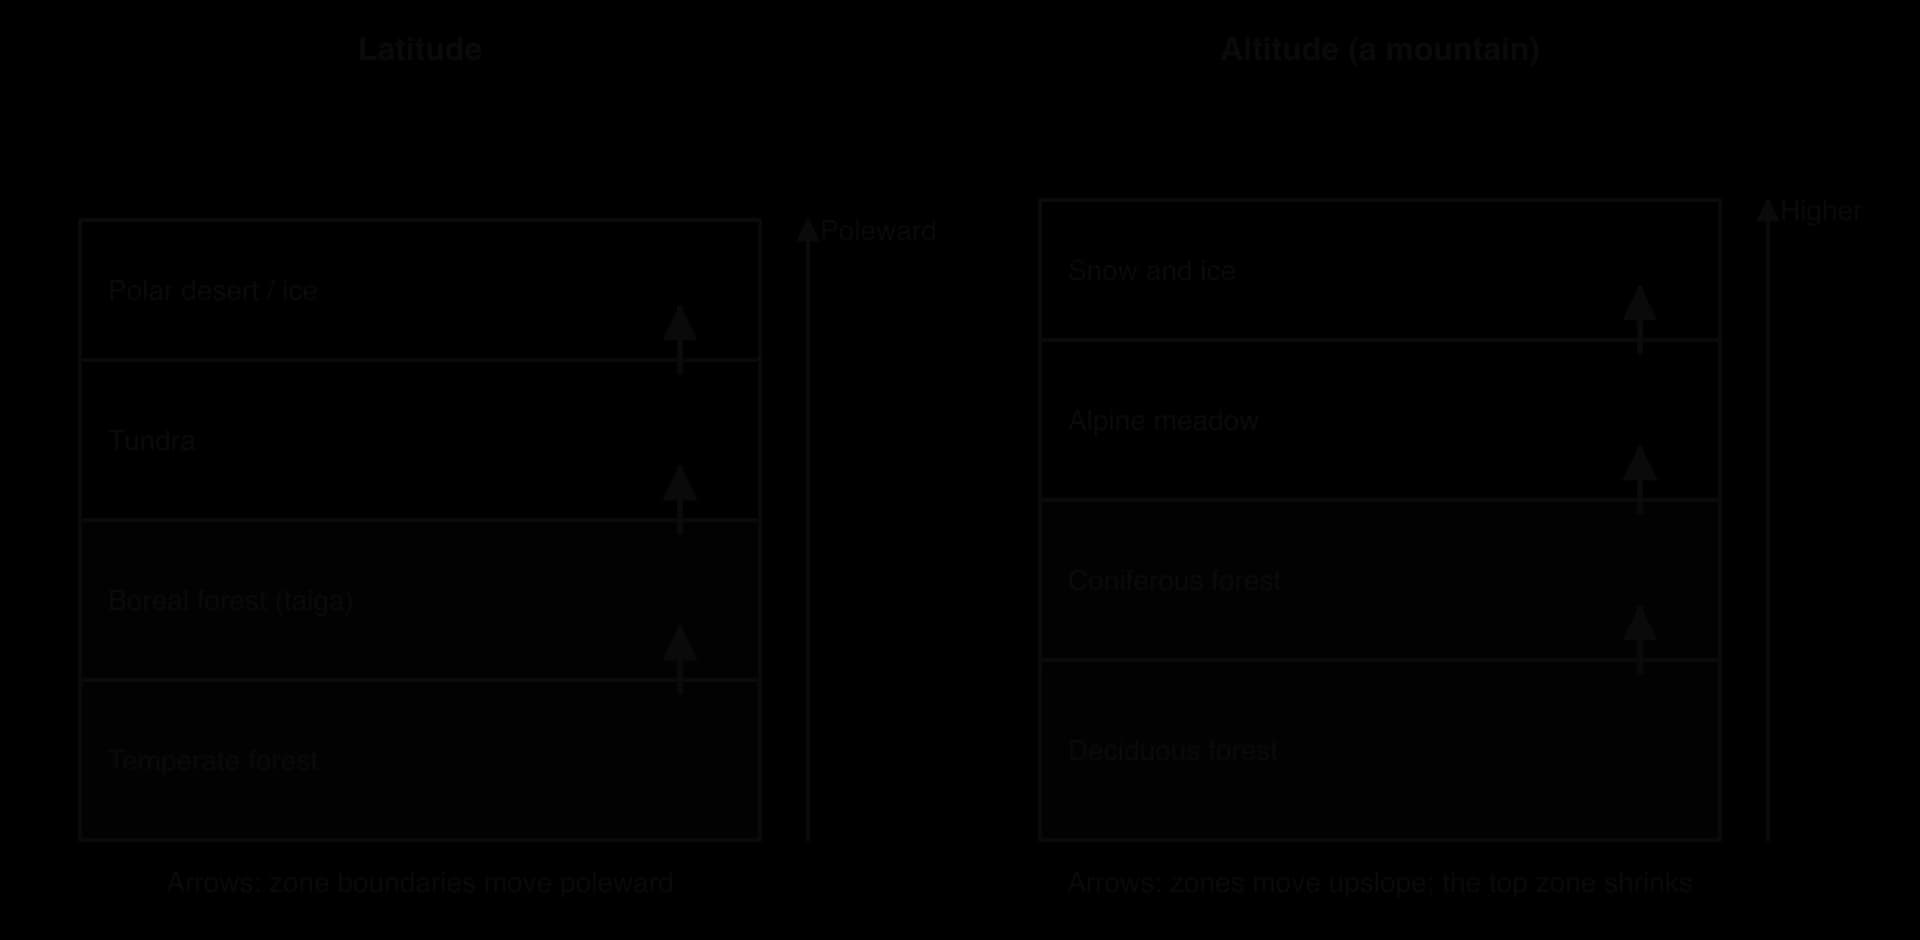
A biome is a large-scale community of plants and animals, such as tropical rainforest, savanna, temperate deciduous forest, boreal forest (taiga) or tundra, whose distribution is controlled mainly by climate, especially temperature and rainfall. As the climate changes, the conditions each biome needs move across the map.
Species respond by moving to places where conditions still suit them, a process called a range shift. The IPCC reports that about half of the species assessed worldwide have already shifted their ranges towards the poles or, on land, to higher altitudes. On mountains, the temperature falls by roughly 6.5 °C for every kilometre of height, so a warming of 1 °C can push a species about 150 m upslope.
Examples of change
Tundra and the boreal forest: shrubs and trees are spreading north into the Arctic tundra, darkening the surface and lowering albedo.
Mountains: plants in the Alps and the Andes are found at higher altitudes than a century ago; species at the summits, such as alpine plants and the American pika, lose habitat as their zone shrinks.
Oceans: in the North Sea, fish such as cod and haddock have shifted north and into deeper, cooler water, changing which species fishing fleets can catch; warm-water species from further south have become more common.
Coral reefs: repeated bleaching is turning some reefs into communities of seaweed and rubble, removing the habitat for many reef fish.
Animal migration and changes in timing
Warming also changes the timing of natural events, such as the dates when leaves open, insects hatch and birds migrate (phenology). Different species respond at different rates, so their timing can fall out of step. In parts of Europe, oak leaves now open and caterpillars hatch earlier in spring, but some migratory birds that arrive from Africa have not advanced their arrival date as much, so their chicks hatch after the peak of caterpillars they need for food. Such phenological mismatches reduce breeding success.
Species that cannot move fast enough, or have nowhere to move to, face extinction. The IPCC estimates that 3–14% of land species assessed are likely to face a very high risk of extinction at 1.5 °C of warming, rising to 3–18% at 2 °C and 3–29% at 3 °C. Habitat fragmentation by farms, roads and cities makes it harder for species to migrate, which links climate change to land-use decisions.
Changes to agriculture
Farming depends on temperature, rainfall, the length of the growing season and the reliability of all three, so it is one of the activities most sensitive to climate change. The effects are mixed and vary strongly from place to place. The IPCC concluded that overall agricultural productivity has increased over the past 50 years, but that climate change has slowed this growth, with negative impacts mainly in mid- and low-latitude regions and some positive impacts in high-latitude regions.
Crop yields
Each crop has an optimum temperature range. Above it, plants lose water faster, flowering and grain filling are disrupted and yields fall; short spells of extreme heat at flowering can cause large losses. A study that combined four independent methods estimated that, without carbon dioxide fertilisation, adaptation or new crop varieties, each 1 °C rise in global mean temperature would cut global yields of maize by 7.4%, wheat by 6.0%, rice by 3.2% and soybean by 3.1%.
Crop | Estimated change in global yield per 1 °C of warming | Main producing regions at risk |
|---|---|---|
Maize | −7.4% | USA Corn Belt, sub-Saharan Africa, Brazil |
Wheat | −6.0% | South Asia, North Africa, Australia |
Rice | −3.2% | South and South-East Asia |
Soybean | −3.1% | USA, Brazil, Argentina |
Sources: Zhao et al., Proceedings of the National Academy of Sciences, 2017 (without CO₂ fertilisation, adaptation or genetic improvement).
Winners and losers
Warming lengthens the growing season in cold regions, so some high-latitude areas gain. Parts of Canada, Russia, Scandinavia and northern China can grow crops further north than before and may harvest more. Vineyards have spread across southern England, where summers are now warm enough for grapes once grown only further south. The tropics and subtropics, where most of the world’s poorest farmers live, already grow crops close to their upper temperature limit, so they are projected to lose most. Small-scale farmers in sub-Saharan Africa and South Asia, who depend on rain-fed crops, have the least capacity to absorb the losses.
These changes move the limits of cultivation, the boundaries beyond which a crop cannot be grown profitably because of temperature, rainfall or growing-season length. In high latitudes and on mountains the limits move poleward and upslope; in drylands, such as the edge of the Sahel or the interior of Australia, they can move back as droughts become more frequent.
Carbon dioxide fertilisation and its limits
Higher concentrations of carbon dioxide can increase the growth of many plants, because CO₂ is the raw material of photosynthesis and because plants lose less water when they need to open their pores (stomata) less. This carbon dioxide fertilisation benefits C3 crops such as wheat, rice, soybean and potatoes more than C4 crops such as maize, sorghum and sugar cane, which already concentrate CO₂ efficiently.
The benefit has limits. It is reduced or cancelled where heat, drought or a lack of nutrients limits growth, and it lowers the nutritional quality of food: the carbon dioxide levels expected by 2050 could reduce the protein, iron and zinc content of food crops by about 3–17%. For people who rely on cereals for most of their diet, this “hidden hunger” is a health risk.
Soil erosion
Soil erosion is the removal of the topsoil by water and wind faster than new soil forms. Climate change increases it in two ways. Heavier rainstorms produce more overland flow, which washes topsoil off bare fields and slopes, while longer droughts dry and loosen the soil and kill the vegetation that protects it, leaving it exposed to the wind. Wildfires also leave slopes bare and easily eroded when rain returns. Losing the topsoil removes the most fertile layer and much of the soil’s carbon, which lowers yields for decades.
Warmer winters also let crop pests and diseases survive further north and complete more generations each year. Locust swarms, fall armyworm and wheat rust have spread into new regions, and outbreaks of these pests are favoured by the warm, wet conditions that follow heavy rains.
Impacts on people and places: health hazards
The IPCC concluded with very high confidence that climate change has already harmed people’s physical health worldwide and their mental health in the regions assessed. The effects work through several pathways, some direct and some through changes in ecosystems, water and food.
Health hazard | How climate change causes it | Example |
|---|---|---|
Heat stress and heat deaths | More frequent, longer and hotter heatwaves; the elderly, outdoor workers and people with heart and lung disease are most at risk | About 62,775 heat-related deaths in Europe in summer 2024 |
Vector-borne disease | Warmer, wetter conditions let mosquitoes and ticks spread to higher latitudes and altitudes and breed faster | Dengue spreading in South Asia, Latin America and southern Europe; malaria at higher altitudes in the East African highlands |
Water-borne disease | Floods contaminate drinking water; warmer seas favour bacteria such as Vibrio | Cholera and diarrhoeal disease after floods |
Malnutrition | Lower yields, crop failures and livestock deaths reduce food supply and income | Horn of Africa drought, 2020–2023 |
Air pollution | Wildfire smoke and more ground-level ozone in hot weather | Canadian wildfire smoke over North America, 2023 |
Mental health | Trauma from disasters, loss of homes and livelihoods, anxiety about the future | Communities after floods and fires |
A vector-borne disease is an illness passed to people by a living carrier, usually an insect or tick, such as malaria and dengue (mosquitoes) or Lyme disease (ticks). The insects that carry these diseases are cold-blooded, so their survival, breeding rate and the speed at which the pathogen develops inside them all increase with temperature, up to a limit. As a result, the area where transmission is possible expands into higher latitudes and altitudes.
The IPCC projects that dengue risk will increase, with longer transmission seasons and a wider distribution in Asia, Europe, Central and South America and sub-Saharan Africa, potentially putting billions more people at risk by the end of the century. Climate is only one factor: urbanisation, travel, poor drainage and water storage, and health services also decide where outbreaks happen.
Impacts on people and places: migration
Climate change affects migration through both rapid-onset events, such as floods and tropical cyclones, which force people to leave suddenly, and slow-onset changes, such as drought, desertification and sea-level rise, which gradually make places harder to live in. The IPCC concluded that weather and climate extremes are increasingly driving displacement in all regions, with small island states disproportionately affected.
Most of this movement is internal and over short distances: people move to a nearby town or city, often temporarily, rather than abroad. Migration is also almost always multi-causal. A farmer in the Sahel who moves to a city after several poor harvests may be responding to drought, falling crop prices, debt and the attraction of urban jobs all at once, so it is difficult to count how many people move “because of” climate change. People who move for these reasons are often called environmental migrants, a term with no status in international refugee law; when the movement is involuntary it is a form of forced migration.
The World Bank’s Groundswell report (2021) projected that without action climate change could force up to 216 million people to move within their own countries by 2050 across six regions, including up to 86 million in sub-Saharan Africa, 49 million in East Asia and the Pacific and 40 million in South Asia. It also found that rapid emissions cuts and inclusive development could reduce this number by up to 80%. Such projections depend on assumptions about future emissions, population and development, so they are scenarios, not forecasts.
Low-lying atoll states face the possibility of whole populations having to move. Most of the land in Kiribati and Tuvalu lies within a few metres of sea level. Tuvalu’s Falepili Union treaty with Australia, in force since August 2024, allows up to 280 Tuvaluans a year to move to Australia with permanent residency.
Impacts on people and places: ocean transport routes
The loss of Arctic sea ice is opening sea routes along the northern coasts of Russia and Canada that were blocked by ice for most of the year. The Northern Sea Route runs about 5,600 km along Russia’s Arctic coast, from the Kara Strait to the Bering Strait, within Russia’s exclusive economic zone. The Northwest Passage runs through the islands of the Canadian Arctic.
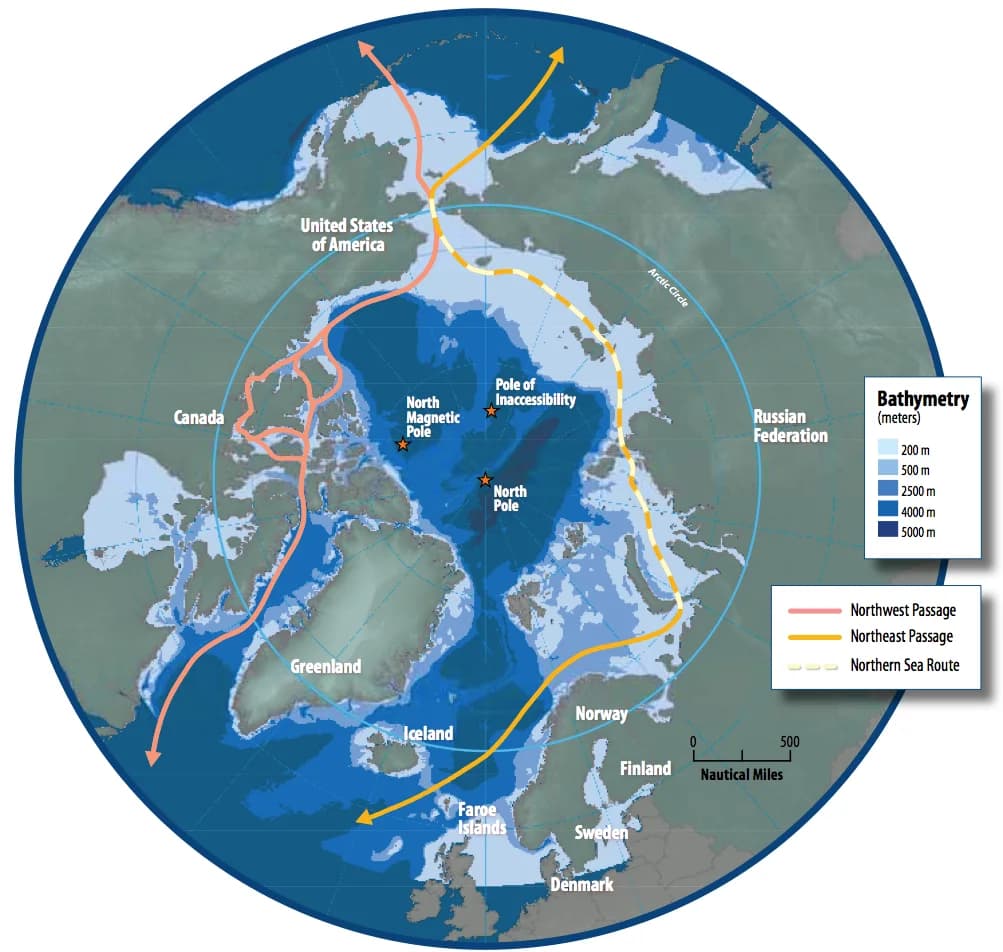
Route | Via the Suez Canal | Via the Northern Sea Route | Saving |
|---|---|---|---|
Yokohama–Murmansk | 23,780 km | 10,690 km | about 55% |
Busan–Rotterdam | 20,370 km | 13,890 km | about 32% |
Shanghai–Hamburg | 20,000 km | 13,520 km | about 32% |
Sources: Wikipedia, Northern Sea Route, 2026 (distances converted from nautical miles).
Opportunities and risks
Shorter routes can cut sailing time between north-western Europe and East Asia by about 30–40% and reduce fuel use per voyage. Cargo shipped on the Northern Sea Route reached 37.9 million tonnes in 2024, mostly oil, liquefied natural gas and coal from Russian Arctic projects, and the number of ships sailing the whole route between the Atlantic and Pacific reached a record 92 in 2024. In October 2025 a container ship completed the first Asia-to-Europe container voyage by the route, reaching Felixstowe in the UK in 20 days.
The risks are significant. The route is usable for only a few months each year, ice conditions vary, and ships need ice-strengthened hulls or Russian nuclear icebreakers, which raises costs. An oil spill would be very difficult to clean up in cold, remote waters with little infrastructure. Questions of sovereignty also arise: Russia regulates the route and requires permits, and Canada regards the Northwest Passage as its internal waters, while the USA and others consider it an international strait. Some large shipping companies, such as MSC, have stated that they will not use the route for environmental and safety reasons.
Rivers and canals in drought
Climate change can also close routes. Drought lowers rivers and canals, so ships must carry less cargo or stop. In August 2022, during Europe’s worst drought for centuries, the Rhine at the Emmerich gauge in Germany fell to −3 cm, 10 cm below the previous record set in 2018 and far below its normal level of about 239 cm. Barges could load only 25–35% of their usual freight, raising transport costs for coal, chemicals and grain along one of Europe’s busiest inland waterways.
The Panama Canal shows the same risk on a sea route. Its locks are filled with fresh water from Gatún Lake, about 200 million litres for each ship, and the lake also supplies drinking water to more than half of Panama’s 4.3 million people.
Rainfall in 2023 was about 30% below average, the third driest year in a 143-year record, so the Panama Canal Authority cut the number of ships allowed through from the normal 36 a day to 25 in November 2023 and as few as 22 in December, and limited how deeply loaded they could be. By late August 2023 about 135 ships were waiting to cross, and some shipping companies sent cargo the long way round.
An attribution study found that the 2023 drought was mainly caused by El Niño, which made such a dry rainy season much more likely, and could not detect a long-term drying trend caused by climate change. The canal’s own water demand is projected to more than double from 2015 levels by 2050, so the risk to the route depends on rising demand as well as on rainfall, and the canal authority is planning a new reservoir on the Indio River to secure supply.
Sources: Wikipedia, 2022 European drought and Panama Canal, 2026; Carbon Brief, “Drought behind Panama Canal’s 2023 shipping disruption ‘unlikely’ without El Niño”, 2024 (World Weather Attribution).
Uneven effects and uncertain futures
The consequences of climate change are distributed very unevenly across the world. Land warms faster than the ocean and the Arctic faster than anywhere; some regions are becoming wetter and others drier; low-lying coasts and deltas face sea-level rise, while some high-latitude regions gain longer growing seasons. The IPCC estimates that about 3.3–3.6 billion people live in contexts that are highly vulnerable to climate change. The harm a change causes also depends on the vulnerability of the people exposed to it and on their capacity for adaptation, which is why the same heatwave or flood kills more people in some places than in others.
Type of place | Main negative effects | Possible positive effects |
|---|---|---|
Arctic and high latitudes | Permafrost thaw, coastal erosion, loss of sea-ice habitat and Indigenous livelihoods | Longer growing seasons; new shipping routes; access to resources |
Mountain regions (Himalaya, Andes, Alps) | Glacier retreat, later water shortages, glacial lake outburst floods, loss of ski seasons | Temporary increase in meltwater; land for farming at higher altitudes |
Low-lying coasts and deltas (Ganges–Brahmaputra, Mekong, Nile) | Sea-level rise, storm surges, salt water in soils and wells | Few |
Small island states (Kiribati, Tuvalu, Maldives) | Sea-level rise, coral bleaching, threats to the existence of the state | Few |
Drylands (Sahel, Horn of Africa, Mediterranean) | More intense droughts, heatwaves, crop and livestock losses | Possible wetter seasons in parts of the Sahel |
Mid-latitude HICs (UK, Canada, northern Europe) | Heatwaves, floods, wildfires, insurance losses | New crops, lower winter heating demand |
Climate scenarios
Because future emissions depend on human choices, scientists project the climate under a set of climate scenarios. The IPCC’s Sixth Assessment Report uses Shared Socioeconomic Pathways (SSPs), each combining a story about future population, economic growth and technology with a level of radiative forcing by 2100. SSP1-1.9 is a very low emissions pathway consistent with about 1.5 °C; SSP5-8.5 is a very high emissions pathway based on fossil-fuelled growth.
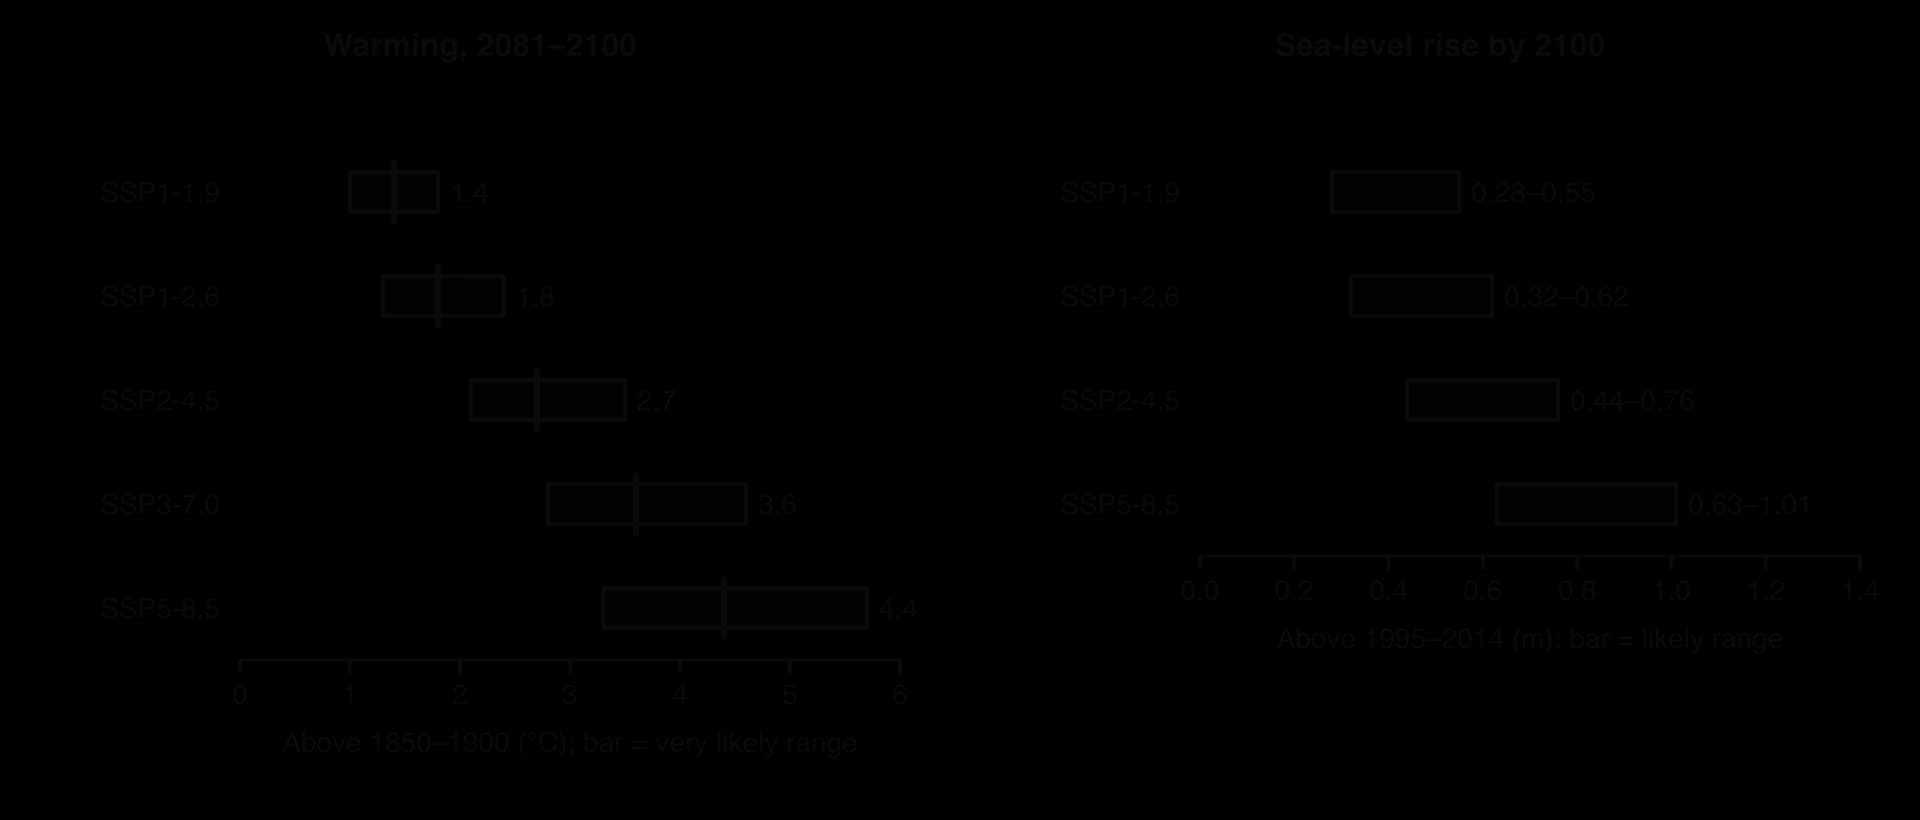
The projections show three kinds of uncertainty. Scenario uncertainty is about human choices: how much will the world emit? Model uncertainty is about how the climate responds: the IPCC’s best estimate is that a doubling of carbon dioxide would eventually warm the world by 3 °C, but the likely range is 2.5–4 °C. Natural variability, such as El Niño, makes individual years and decades warmer or cooler than the trend. Uncertainty is greatest for local and regional changes, such as future rainfall in a particular country, and for low-likelihood, high-impact events such as ice-sheet collapse.
The IPCC communicates these uncertainties in precise words. “Likely” means a probability of 66–100%, “very likely” 90–100% and “virtually certain” 99–100%; confidence (“low”, “medium”, “high”) describes how strong the evidence and the agreement between studies are. This language allows decision-makers to judge risks, even when outcomes cannot be predicted exactly.
Case study: Canada’s 2023 wildfire season
The place and its context
Canada, a high-income country of about 41 million people, contains about a quarter of the world’s boreal forest, a belt of conifers such as spruce, pine and fir that stretches across the country from Yukon and British Columbia to Quebec and Nova Scotia. Fire is a natural part of this biome: lightning starts about half of Canada’s wildfires but causes about 85% of the area burned, because lightning fires often start in remote areas and spread before they are detected. Most of the population lives in a narrow band near the southern border, but many towns and First Nations communities are surrounded by forest.
Process: heat, drought and an extreme fire season
The 2023 season was by far the largest in Canada’s recorded history. By 6 October, 6,551 fires had burned about 18.5 million hectares (185,000 km², an area larger than Tunisia), more than twice the previous national record. Quebec alone had about 5.2 million hectares burned; British Columbia had about 2.8 million and Alberta about 2.2 million.
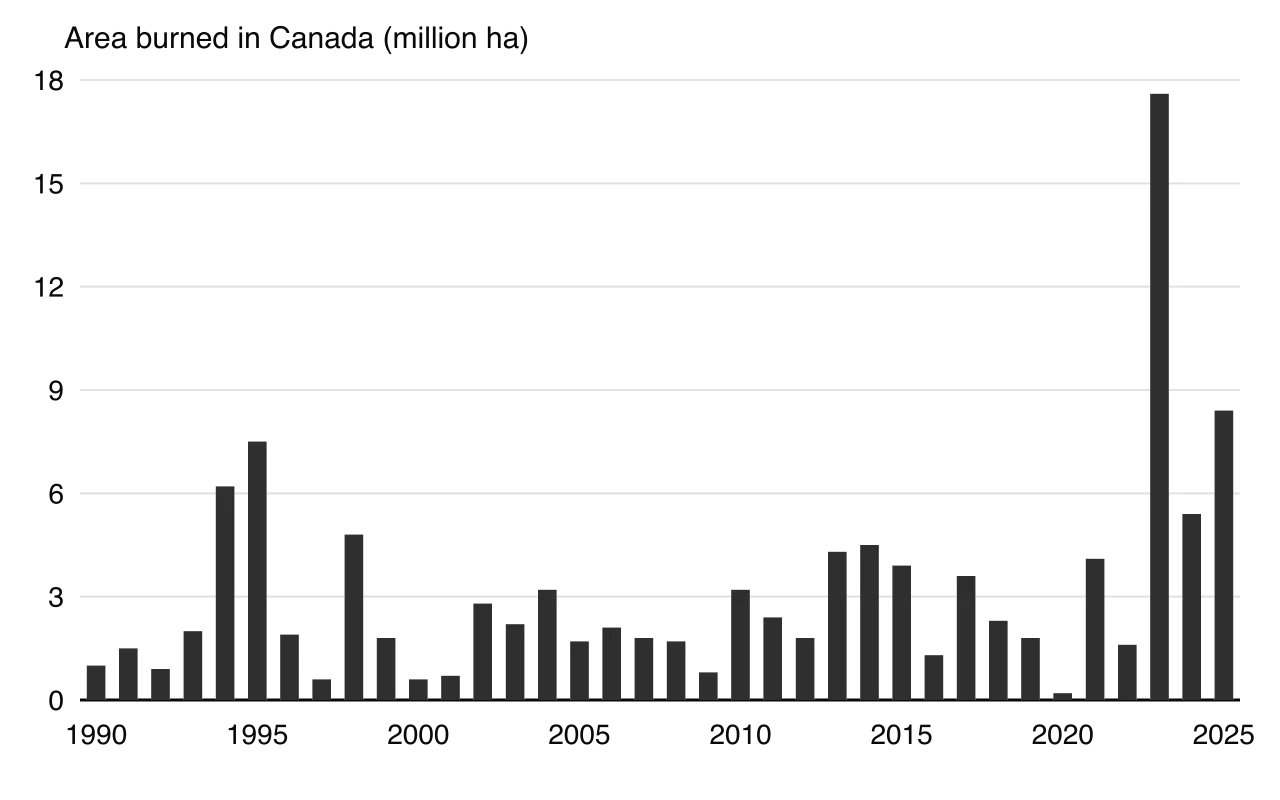
The causes combined weather, climate and the biome itself. Temperatures from May to October 2023 averaged 2.2 °C above the 1991–2020 normal, the warmest such period on record. A low winter snowpack in the west, after drought in 2022, and a rapid “flash drought” in Quebec and Nova Scotia in spring left forest fuels very dry.
Thousands of lightning strikes then ignited fires in remote forests, and hot, windy days spread them faster than crews could respond. A World Weather Attribution study found that climate change had made the extreme fire weather in Quebec about twice as likely and about 20% more intense, and the unusually long national fire season about five times more likely.
Impacts on different groups
Group | Impacts |
|---|---|
People forced to leave their homes | Between about 185,000 and 232,000 people were evacuated during the season. About 21,720 people, around 87% of the city, left Yellowknife, capital of the Northwest Territories, in August; almost 30,000 were evacuated around Kelowna and West Kelowna, British Columbia, and 16,400 near Halifax, Nova Scotia. |
First Nations communities | Many remote Indigenous communities were evacuated, including about 7,000 people from Pimicikamak Cree Nation in Manitoba in May; in Alberta, more than 100 structures were destroyed at Fox Lake. |
Firefighters | Eight wildfire personnel died; thousands of firefighters came from other countries to help. |
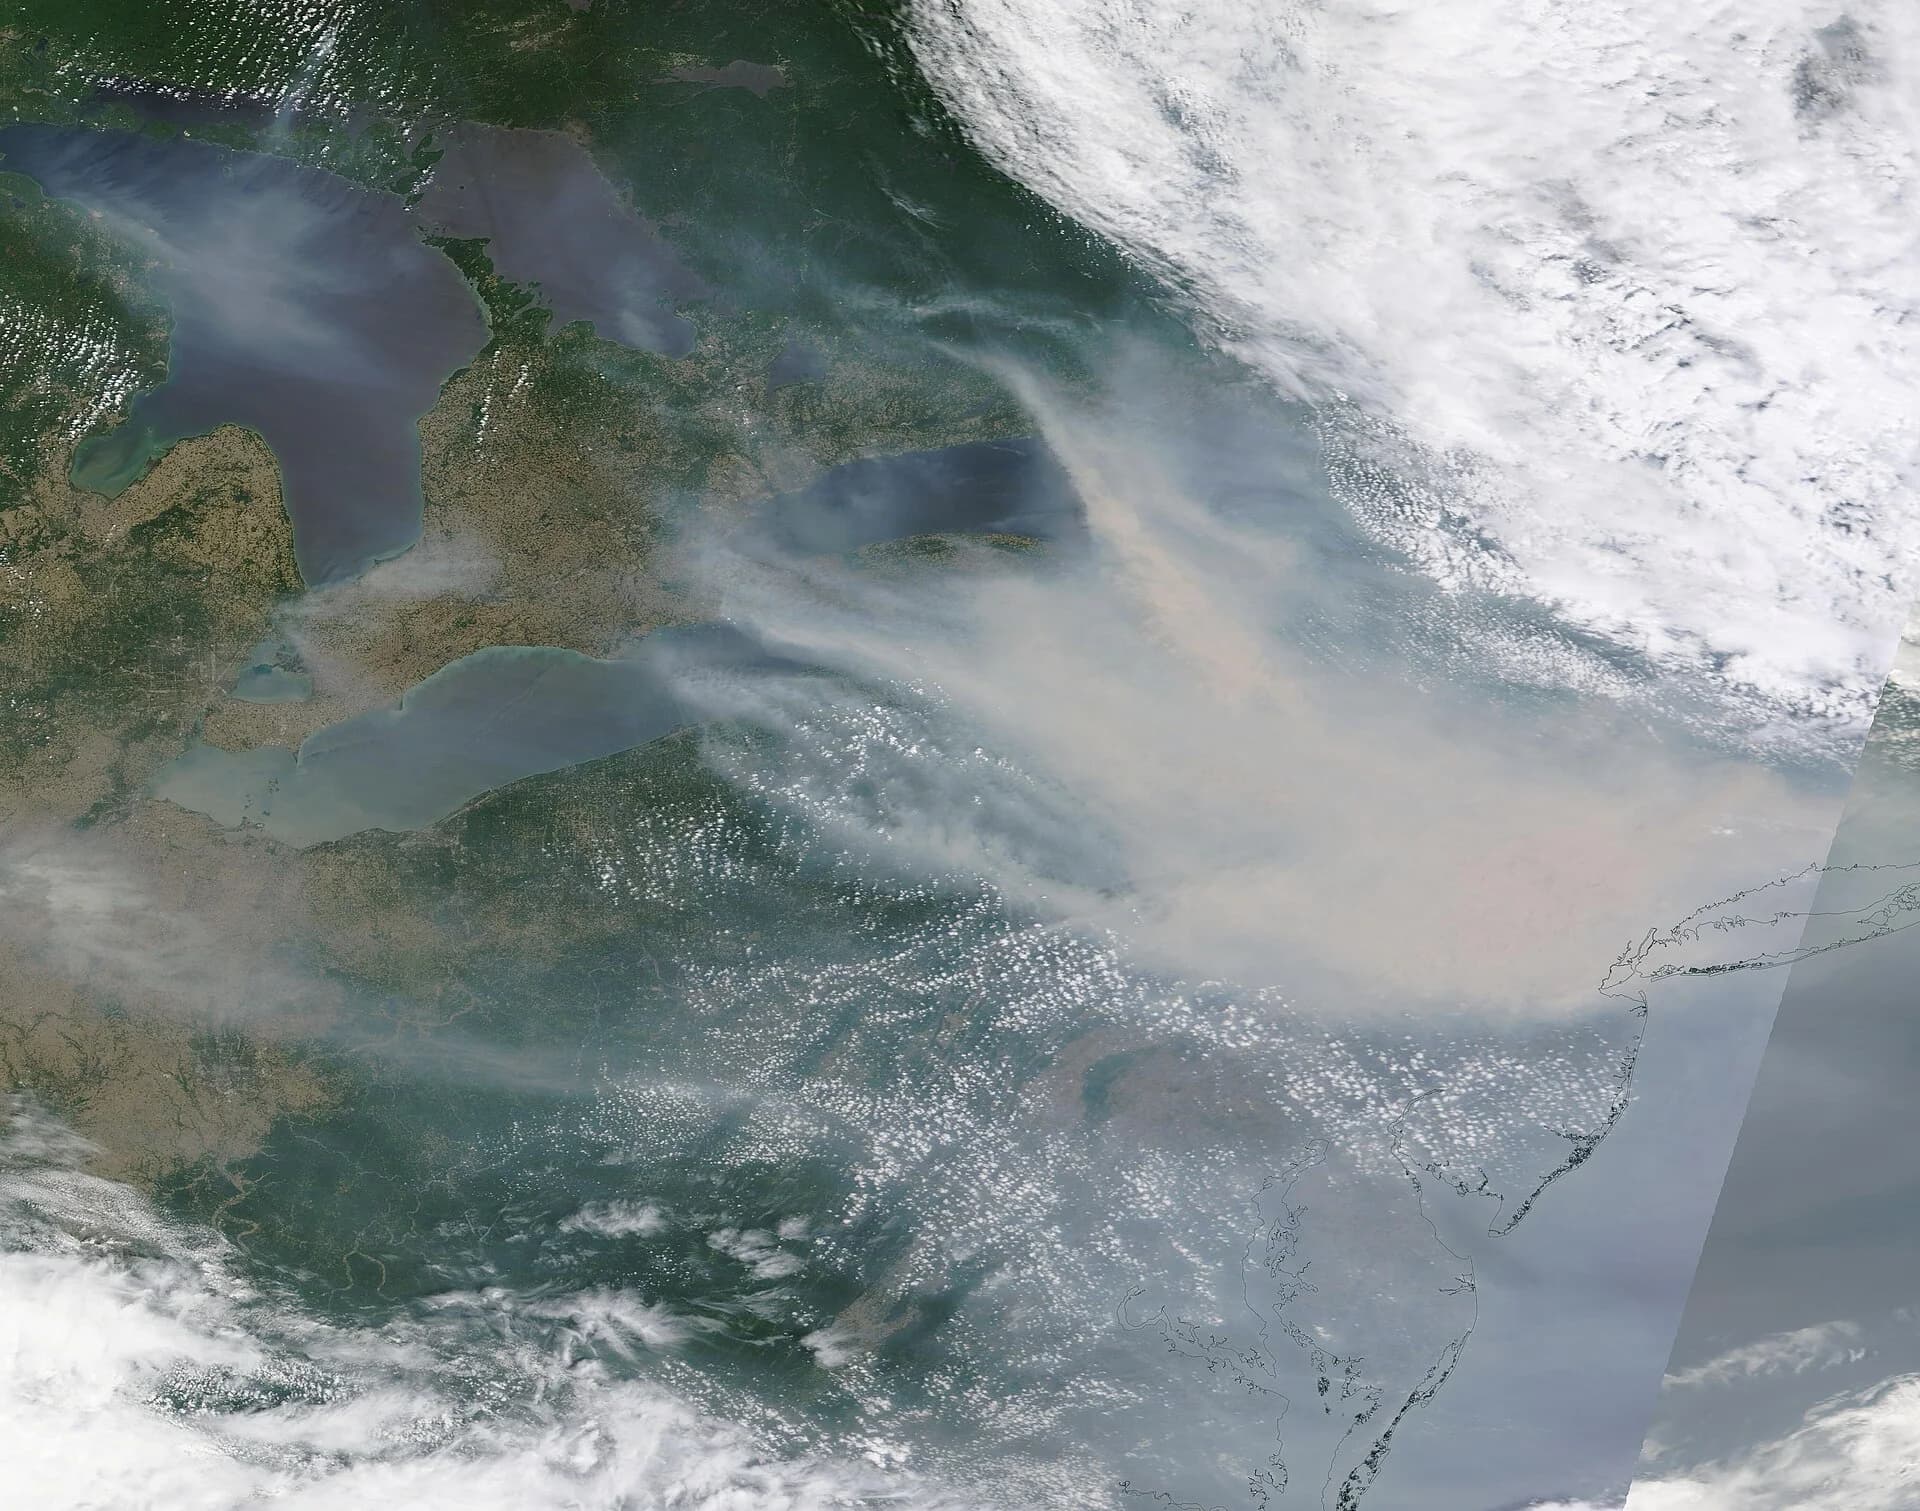
People breathing the smoke | Smoke spread across North America. On 7 June the air quality index in New York City passed 400, among the worst in the world that day, and about 128 million Americans were under air quality alerts. A 2025 study estimated thousands of early deaths in North America from short-term exposure. |
The economy | Insured damage from two fires in British Columbia alone reached about C$730 million; the government estimated the total cost at over C$3 billion by September 2023. Forestry, tourism and transport were disrupted. |
Carbon released from the biosphere
Boreal forests and their peat soils are major carbon stores, so the fires turned a carbon sink into a large carbon source. By late August 2023 the fires had released an estimated 327–355 million tonnes of carbon, equal to about 1.2–1.3 billion tonnes of carbon dioxide. This is more than twice Canada’s fossil-fuel emissions of carbon dioxide in 2023 (about 545 million tonnes). The Copernicus Atmosphere Monitoring Service estimated that Canada’s fires produced 23% of the world’s wildfire carbon emissions in 2023.
Responses and how well they worked
Canada’s response combined emergency management and longer-term planning. Provinces and territories coordinated firefighting through the Canadian Interagency Forest Fire Centre, with firefighters and aircraft from other countries, including the USA and Costa Rica. Evacuations were large and orderly, and the number of deaths among residents was very small compared with the scale of the fires, which shows effective warnings and planning in a high-income country. However, remote First Nations communities, which often have a single road or rely on air transport, were evacuated repeatedly and for long periods, with disruption to schooling, health care and culture.
Longer-term options include FireSmart programmes that clear fuel around homes and towns, prescribed burning and Indigenous cultural burning to reduce fuel loads, better forecasting, and planning rules for new building in forested areas. None of these can remove the underlying cause: as long as warming continues, hotter and drier summers will make large fire seasons more frequent, as the large seasons of 2024 and 2025 suggested.
Key concept | How the case study shows it |
|---|---|
Place | The boreal forest’s fuels, lightning regime and scattered settlements shaped where and how the fires burned. |
Process | Warming, drought and low snowpack dried the forest; the fires then released stored carbon, a positive feedback on climate change. |
Power | Federal and provincial governments decided on evacuation and firefighting; remote First Nations had less control over the decisions that affected them, and smoke crossed into the USA, where people had no say over its source. |
Possibility | Attribution science suggests seasons like 2023 will become more likely with further warming; FireSmart and cultural burning offer ways to reduce, not remove, the risk. |
Sources: Wikipedia, 2023 Canadian wildfires (CIFFC, Natural Resources Canada, World Weather Attribution, Copernicus CAMS), 2026; Canadian Council of Forest Ministers, National Forestry Database, 2026; Global Carbon Budget 2025 via Our World in Data, 2026.
Analysis questions
Explain how the 2023 fires show the link between the consequences and the causes of climate change.
Suggest why First Nations communities were affected differently from people in Canada’s southern cities.
To what extent can the 2023 fire season be attributed to climate change rather than to natural variability?
Exam practice
The consequences of climate change appear in Paper 2. Section A has one structured question of 10 marks on global climate, usually on a graph, map or table; Section B uses an infographic; Section C offers a 10-mark extended response, often a quoted statement followed by “To what extent do you agree with this statement?”.
Structured question (Section A style)
Study the table, which shows global mean sea level measured by satellites, relative to 1993.
Year | 1993 | 1998 | 2003 | 2008 | 2013 | 2018 | 2023 |
|---|---|---|---|---|---|---|---|
Sea level relative to 1993 (mm) | 0 | 17 | 30 | 43 | 60 | 81 | 104 |
Sources: University of Colorado Sea Level Research Group, satellite altimetry (2026_rel2), annual means, 2026.
Part (b) asks for causes of the pattern in the table, so each reason must explain why sea level rises faster over time.
Part (c) tests understanding of a different consequence from the stimulus.
Infographic question (Section B style)
An infographic titled “A changing Arctic Ocean” shows: a polar map with the September sea-ice edge in 1979 (7.05 million km²) and 2026 (4.81 million km²); a ship icon on the Northern Sea Route labelled “Busan to Rotterdam: 32% shorter than via Suez”; a bar for cargo on the route, “37.9 million tonnes (2024)”; a polar bear with the label “Sea-ice habitat shrinking”; and an oil drop labelled “Spill response: weeks away”. (Data from NSIDC and the Wikipedia article on the Northern Sea Route.)
Extended response (Section C style)
Summary
The cryosphere is shrinking: glaciers are retreating almost everywhere, Arctic September sea-ice area fell by about 40% between 1979–1988 and 2010–2019, and ice-sheet loss has accelerated.
Global sea level rose about 0.20 m between 1901 and 2018 and about 108 mm between 1993 and 2025, through thermal expansion and melting land ice; local subsidence or uplift changes relative sea level at each coast.
The oceans and land absorb about half of human CO₂ emissions; the oceans are acidifying (pH down about 0.1), corals are bleaching, and warming, drought and fire can turn forest and permafrost sinks into sources.
Hot extremes, heavy rainfall and droughts are becoming more frequent and intense; attribution science measures how much more likely climate change has made a particular event.
Biomes, habitats and species are shifting poleward and upslope, and changes in timing cause mismatches; species with nowhere to go face extinction.
Agriculture gains in some high-latitude places but loses in the tropics; yields fall with heat, the limits of cultivation move, CO₂ fertilisation helps only partly, and heavier rain and drought increase soil erosion.
People face heat deaths, the spread of vector-borne and water-borne disease, malnutrition and displacement, mostly internal; Arctic routes open while droughts close river routes.
Effects are uneven between places and uncertain in timing and scale; IPCC scenarios (SSPs) show that the emissions pathway chosen matters most.
Canada’s 2023 wildfire season shows heat and drought, biome change, carbon release, health hazards and displacement in one event.
Self-check
- To do:
I can describe changes in the cryosphere, including glacier retreat and peak water, with located examples.
- To do:
I can explain the causes of global and relative sea-level rise and why melting sea ice adds almost nothing.
- To do:
I can explain how oceans and the biosphere store carbon, why the oceans are acidifying and how sinks can become sources.
- To do:
I can explain how climate change affects heatwaves, heavy rainfall and drought, and what attribution science shows.
- To do:
I can describe range shifts of biomes and species and explain phenological mismatch, with examples.
- To do:
I can evaluate the effects of climate change on crop yields, the limits of cultivation and soil erosion in contrasting places.
- To do:
I can explain impacts on health, migration and ocean transport routes, using named examples.
- To do:
I can use IPCC scenarios and confidence language to discuss why the effects are uneven and uncertain.
- To do:
I can use Canada’s 2023 wildfires to explain how one event links several consequences of climate change.