Notes on 2.1 Causes of global climate change
Learning objectives
Describe the structure and composition of the atmosphere and the flows of the global energy balance, using values in W m⁻².
Explain how the natural greenhouse effect warms the Earth’s surface, and why greenhouse gases differ in their warming effect.
Distinguish between positive and negative feedback loops, and construct feedback diagrams for albedo change and methane release.
Explain how variations in solar radiation, volcanic eruptions and human aerosols change the energy balance, including global dimming.
Examine how changes in terrestrial albedo and the release of methane from permafrost and other stores can amplify warming, including the idea of tipping points.
Analyse the Keeling curve and the record of global temperature as evidence of the enhanced greenhouse effect.
Compare total, per capita, cumulative and consumption-based greenhouse gas emissions for countries at different levels of economic development.
Explain how globalisation, transnational corporations and trade move emissions between places, and evaluate what each way of counting emissions implies for responsibility.
Introduction
The Earth’s climate depends on a balance between the energy it receives from the Sun and the energy it sends back to space. Anything that changes this balance, whether a cycle in the Sun’s output, a volcanic eruption or the burning of fossil fuels, changes the temperature of the planet. Since the mid-20th century the dominant cause of change has been the rising concentration of greenhouse gases released by human activity.
The topic is above all about process: the physical mechanisms that move energy through the atmosphere and the feedback loops that can amplify a small change into a large one. It is also about power, because the places that emit most greenhouse gases are not the places that will suffer most, and because the way emissions are counted (by country, per person, over history or by consumption) decides who appears responsible. The consequences of these changes, and the responses to them, follow from these causes.
The atmosphere as a system
The atmosphere is the layer of gases held around the Earth by gravity. By volume, dry air is about 78% nitrogen and 21% oxygen, with about 0.9% argon. The gases that matter most for climate make up only a tiny fraction of the remainder: carbon dioxide is about 0.04% of dry air, and methane less than 0.0002%. Water vapour is highly variable, from almost nothing over cold deserts to about 4% in humid tropical air.
Geographers treat the atmosphere as an open system, with inputs (solar energy, gases), stores (gases, clouds, heat), flows (radiation, convection, evaporation) and outputs (energy radiated to space). A change in any input makes the whole system adjust.
Layers of the atmosphere
The atmosphere is divided into layers by the way temperature changes with height. In the troposphere, the lowest layer, temperature falls with height by an average of about 6.5 °C per kilometre, because the air is heated from below by the ground. The troposphere is between about 8 km deep over the poles and 16 km deep over the equator, holds about 80% of the mass of the atmosphere and almost all of its water vapour, and is where weather happens.
Above the tropopause lies the stratosphere, up to about 50 km. Here temperature rises with height, because the ozone layer, concentrated between about 15 and 35 km, absorbs ultraviolet radiation from the Sun.

The global energy balance
All of the energy that drives the climate comes from the Sun. The Sun is very hot (about 5,500 °C at its surface), so it emits most of its energy as shortwave radiation: visible light, with some ultraviolet and near-infrared. The Earth is much cooler, so it emits energy as longwave radiation, invisible infrared heat. The difference in wavelength is the key to the greenhouse effect, because the atmosphere lets most shortwave radiation through but absorbs much of the longwave.
Shortwave radiation arrives at the top of the atmosphere at about 1,360 W m⁻² on a surface facing the Sun. Because the Earth is a rotating sphere and half of it is always in darkness, the average over the whole globe and the whole year is a quarter of this, about 340 W m⁻². This figure is the starting point of the global energy balance.
Longwave radiation is emitted by every surface and every layer of the atmosphere, day and night. The warmer an object is, the more energy it radiates. This is why the energy balance is self-correcting: if the Earth warms, it radiates more longwave energy to space, which tends to bring it back towards balance.
The flows of energy, step by step
The energy balance can be followed as a sequence of flows, all given as global annual means in W m⁻².
Incoming: 340 W m⁻² of shortwave radiation reaches the top of the atmosphere.
Reflected: about 100 W m⁻² (29%) is reflected to space, 77 by clouds, aerosols and air and 23 by bright surfaces. This reflected share is the planet’s albedo.
Absorbed: about 78 W m⁻² is absorbed by water vapour, dust and ozone in the atmosphere and 163 W m⁻² by the surface.
Heat from the surface: the surface passes heat to the air by evaporation (latent heat, 85 W m⁻²) and rising thermals (sensible heat, 17 W m⁻²).
Longwave from the surface: the surface emits about 398 W m⁻²; only 41 W m⁻² escapes directly to space through the “atmospheric window”, the wavelengths that greenhouse gases absorb weakly.
Back radiation: greenhouse gases and clouds absorb the rest and re-emit it in all directions, so about 340 W m⁻² returns to the surface.
Outgoing: the atmosphere and clouds emit about 199 W m⁻² to space; with the 41 W m⁻² through the window, 240 W m⁻² leaves the planet, equal to the shortwave absorbed.

The diagram shows why the surface is so much warmer than it would be without an atmosphere. The ground receives 163 W m⁻² from the Sun but 340 W m⁻² of back radiation from the atmosphere, so it is kept warm day and night. The balance at the top of the atmosphere is not quite exact today: the Earth absorbs a little more than it emits, an energy imbalance that NASA estimates at a little over 0.8 W m⁻². Over 90% of this extra energy is stored in the ocean.
The natural greenhouse effect
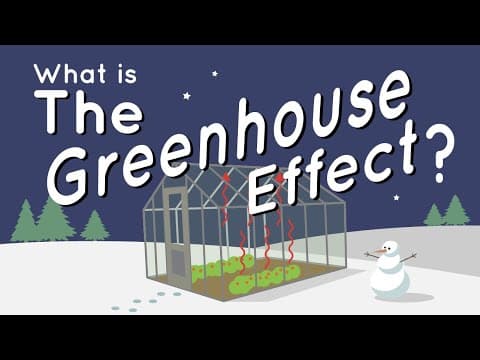
The greenhouse effect is the warming of the Earth’s surface and lower atmosphere by gases that absorb and re-emit longwave radiation. It is a natural process and is essential for life. Without it, the Earth’s mean surface temperature would be about −18 °C, the temperature at which a planet at the Earth’s distance from the Sun, with its albedo, would radiate 240 W m⁻² to space. With it, the mean surface temperature is about +15 °C, a natural warming of about 33 °C.
The process works in four steps. First, shortwave radiation from the Sun passes through the atmosphere largely unabsorbed and warms the surface. Second, the warm surface emits longwave radiation upwards. Third, greenhouse gases absorb much of this longwave radiation, gaining energy. Fourth, the gases re-emit the energy in all directions, so part of it returns to the surface and part continues upwards, to be absorbed and re-emitted again by higher layers before it finally escapes to space from the cold upper troposphere.
Gases absorb longwave radiation when their molecules can vibrate or bend in ways that match infrared wavelengths. Molecules made of three or more atoms (H₂O, CO₂, CH₄, N₂O, O₃) can do this; the two-atom molecules nitrogen (N₂) and oxygen (O₂), which make up 99% of dry air, cannot. This is why a gas that forms only 0.04% of the air can have a large effect on climate.
 YouTube
Greenhouse gases: sources and strength
Each greenhouse gas has natural and human sources, a lifetime in the atmosphere and a warming strength per kilogram. The table summarises them. Water vapour is the most abundant greenhouse gas and produces the largest share of the natural greenhouse effect, but its concentration is controlled by temperature (warm air can hold more water vapour, about 7% more per 1 °C), so it acts as a feedback rather than a driver of climate change.
Gas | Main natural sources | Main human sources | Lifetime in the atmosphere | Global warming potential (100 years) |
|---|---|---|---|---|
Water vapour (H₂O) | Evaporation from oceans, lakes and plants | Very small directly; rises as the air warms | About 9 days | Not given: a feedback, controlled by temperature |
Carbon dioxide (CO₂) | Respiration, decay, volcanoes, forest fires, release from the ocean | Burning coal, oil and gas; cement making; deforestation | No single lifetime: part stays for centuries to millennia | 1 (the reference gas) |
Methane (CH₄) | Wetlands, termites, permafrost, methane hydrates | Cattle and sheep, rice paddies, landfill, leaks from coal mines and gas wells | About 12 years | About 27–30 |
Nitrous oxide (N₂O) | Bacteria in soils and oceans | Nitrogen fertilisers, manure, some industry | About 109 years | About 273 |
Ozone (O₃) in the troposphere | Lightning, reactions of natural gases | Formed from vehicle and industrial pollution in sunlight | Days to weeks | Not given: short-lived and uneven |
CFCs and other fluorinated gases | None | Refrigerants, aerosol sprays, electrical equipment | Decades to thousands of years | Thousands (CFC-12 about 10,200) |
Gases differ in strength because each molecule absorbs a different range of infrared wavelengths, and because some wavelengths are already almost fully absorbed. A molecule of methane absorbs in a part of the spectrum where little else does, so each extra molecule has a large effect. The global warming potential (GWP) compares this effect with carbon dioxide over a chosen period.
The time period matters. Methane is removed from the atmosphere in about 12 years, so its warming is concentrated in the first decades after release: over 20 years its GWP is about 81–83, but over 100 years about 27–30. Emissions of several gases are added together as CO₂-equivalent (CO₂e) by multiplying each mass by its GWP. Choosing the 20-year or the 100-year value can change the apparent importance of a farm, a gas field or a country with many cattle.
Feedback loops in the climate system
The climate is a system of many linked parts: the atmosphere, oceans, ice, land surface and living things. A change in one part causes responses in the others, and some of these responses act back on the original change. This circular chain of cause and effect is a feedback loop. Feedback loops explain why a small initial change in the energy balance can end in a much larger change in temperature.
There are two kinds of feedback. In a positive feedback loop, the response adds to the original change, so the change grows. In a negative feedback loop, the response opposes the original change, so the system tends back towards its earlier state. In climate science, “positive” and “negative” describe the direction of the effect, never whether it is good or bad: a positive feedback on warming is harmful for most societies.
Most natural systems contain both kinds of loop at once, and the balance between them decides whether a disturbance dies away or grows.

The most important negative feedback is the simplest: a warmer surface radiates more longwave energy, so warming increases the energy lost to space. Without it the climate would be unstable. The main positive feedbacks are the water vapour feedback (warmer air holds more water vapour, a greenhouse gas), the ice–albedo feedback and the release of carbon from permafrost and other stores. Together, the positive feedbacks roughly double or triple the warming that carbon dioxide would cause on its own.
Solar radiation variations
The energy balance begins with the Sun, so any change in solar output or in the Earth’s orbit changes the amount of energy available. These changes operate on very different timescales, from about 11 years to about 100,000 years, which is a good example of temporal scale in physical geography.
The sunspot cycle
The Sun’s output rises and falls over a cycle of about 11 years. At solar maximum the Sun has many dark sunspots, but also bright areas around them, so its total output is very slightly higher. Satellites have measured total solar irradiance since 1978: over more than 40 years it has varied by less than 0.1%. Such a small change in the 340 W m⁻² reaching the Earth alters global temperature by only a few hundredths of a degree.
Milankovitch cycles
Over tens of thousands of years, slow changes in the Earth’s orbit and tilt alter how sunlight is distributed between seasons and latitudes. These Milankovitch cycles, named after the Serbian scientist Milutin Milanković, set the rhythm of the glacial and interglacial periods of the last 2.6 million years.
Cycle | What changes | Period | Effect on climate |
|---|---|---|---|
Eccentricity | The orbit changes from nearly circular to slightly elliptical | About 100,000 years (and about 400,000) | Changes the difference in sunlight between the nearest and farthest points of the orbit |
Obliquity (tilt) | The tilt of the axis varies between about 22.1° and 24.5° | About 41,000 years | More tilt gives hotter summers and colder winters, especially at high latitudes |
Precession | The axis wobbles like a spinning top, changing which hemisphere faces the Sun at the nearest point of the orbit | About 19,000–23,000 years | Changes whether northern summers happen when the Earth is nearest to or farthest from the Sun |
The orbital changes themselves are small. They trigger ice ages because they act through feedbacks: cooler northern summers let snow survive the summer, ice sheets grow and raise the albedo, and colder oceans absorb more carbon dioxide, which cools the planet further. The same feedbacks that amplify orbital changes are amplifying human-caused warming today.
Why the Sun cannot explain recent warming
Solar energy reaching the Earth has followed the 11-year cycle with no net increase since the 1950s, while global temperature has risen sharply. Milankovitch cycles are currently driving a very slow cooling trend, not warming. If the Sun were responsible, the whole atmosphere would warm; instead the troposphere is warming while the upper stratosphere is cooling, the pattern expected when greenhouse gases trap heat lower down. NASA estimates that since 1750 the warming from greenhouse gases has been more than 270 times larger than the small extra warming from the Sun.
Global dimming: volcanic and human aerosols
Not all changes in the energy balance warm the planet. Aerosols are tiny solid or liquid particles suspended in the air, such as volcanic ash and sulphate droplets, soot, dust, sea salt and smoke. Many of them reflect incoming sunlight back to space and help clouds form with more, smaller droplets, which makes clouds brighter. Both effects reduce the solar radiation reaching the ground.
The reduction in sunlight reaching the Earth’s surface because of aerosols is called global dimming. It has natural causes, mainly large volcanic eruptions, and human causes, mainly air pollution from burning coal and oil.
Volcanic eruptions: Mount Pinatubo, 1991
A volcanic eruption cools the climate only if it is powerful enough to inject sulphur dioxide into the stratosphere, above the weather. There the gas reacts with water vapour to form sulphate droplets that spread around the globe and stay for one to three years, because there is no rain to wash them out. Ash falls out within days and has little effect on global climate.
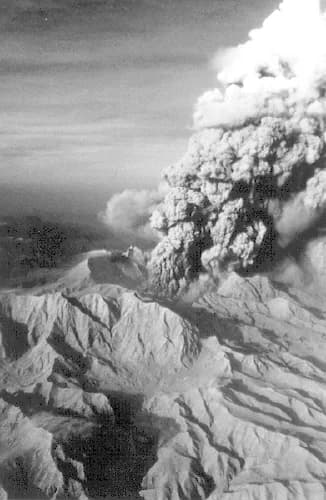
Mount Pinatubo, on the island of Luzon in the Philippines, erupted on 15 June 1991 in the second-largest eruption of the 20th century. The eruption column reached about 35 km. The sulphate haze cut the sunlight reaching the ground by roughly 10%, and global mean temperature fell by about 0.4–0.5 °C over 1991–1993 before recovering as the droplets settled out. The eruption killed 847 people, but the evacuation of tens of thousands of residents beforehand saved many more lives.
Climate models predicted the size and length of the Pinatubo cooling before it happened, which increased confidence in their projections of greenhouse warming. It also inspired proposals for geoengineering by injecting sulphate aerosols into the stratosphere on purpose.
Human aerosols and the masking of warming
From the 1950s to the 1980s, measurements in many parts of the world recorded a fall of about 4–5% per decade in the sunlight reaching the ground, mostly because of sulphate pollution from coal-burning power stations, industry and vehicles. In Europe and North America, clean-air laws from the 1970s onwards cut sulphur emissions, and after about 1990 the trend reversed into global brightening. Dimming continued for longer in China and India, where coal use grew rapidly.
Aerosols therefore hide part of the warming caused by greenhouse gases. The IPCC assessed that human drivers other than greenhouse gases, mainly aerosols, cooled the planet by between 0 and 0.8 °C between 1850–1900 and 2010–2019, against 1.0–2.0 °C of warming from well-mixed greenhouse gases. Cleaning up air pollution saves millions of lives from respiratory disease, but it also removes this mask. The International Maritime Organization’s rule of 1 January 2020, which cut the maximum sulphur content of ships’ fuel from 3.5% to 0.5%, is a recent example of a health measure that also slightly reduced the cooling effect of aerosols over the oceans.
Changes in terrestrial albedo
Albedo is the proportion of incoming solar radiation that a surface reflects, from 0 (absorbs everything) to 1 (reflects everything). The Earth as a whole has an albedo of about 0.3. Different surfaces reflect very different amounts, so changes in the Earth’s surface cover change the amount of energy absorbed.
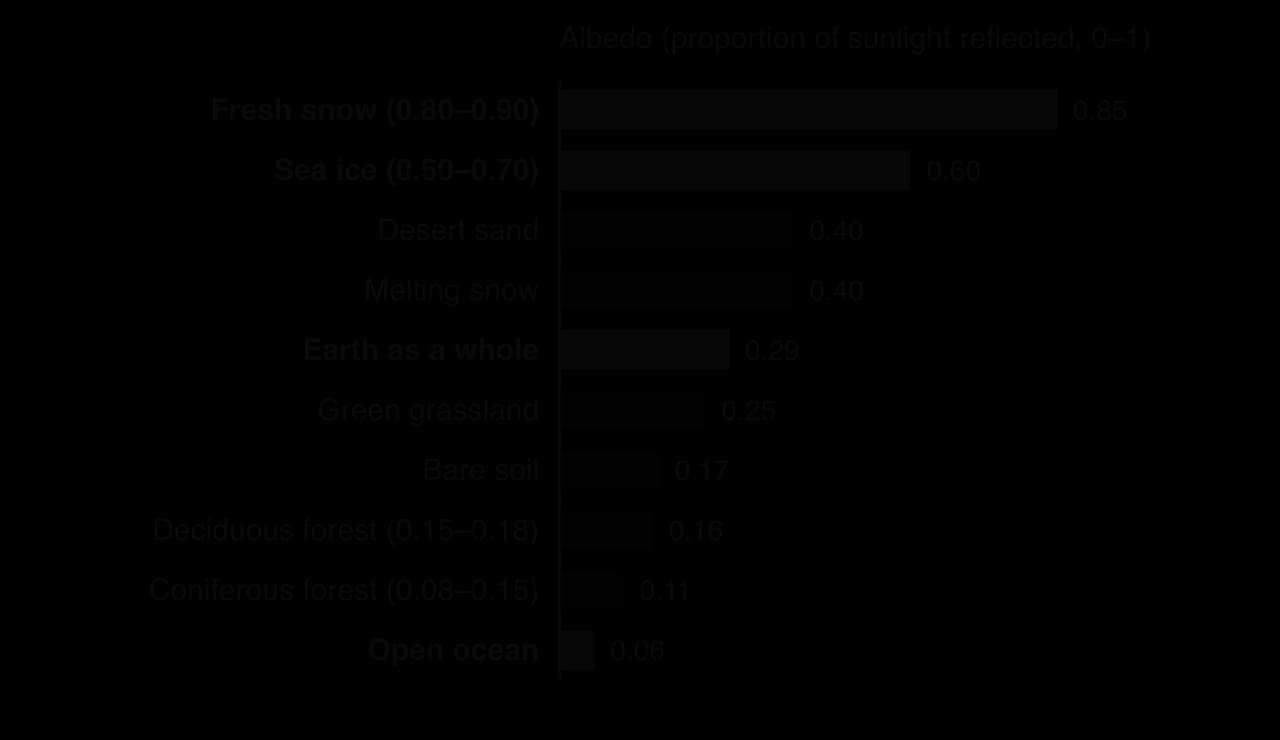
The chart shows the contrast that drives the most important albedo feedback. Sea ice reflects 50–70% of sunlight, while dark open water reflects only about 6%. A surface of sea ice with an albedo of 0.6 absorbs 40% of the sunlight falling on it; open water absorbs 94%. Where melting replaces ice with water, the energy absorbed at that spot more than doubles.
The ice–albedo positive feedback loop
The ice–albedo feedback is a positive feedback loop that works in five steps.
Global warming raises air and ocean temperatures in the Arctic and in mountain regions.
Snow melts earlier in spring and sea ice melts more in summer and forms later in autumn.
Darker surfaces (open ocean, bare ground, tundra vegetation) are exposed, so the surface albedo falls.
More shortwave radiation is absorbed rather than reflected, so the ocean and land store more heat.
The extra heat warms the surface and air further, melting more snow and ice, and the loop repeats.
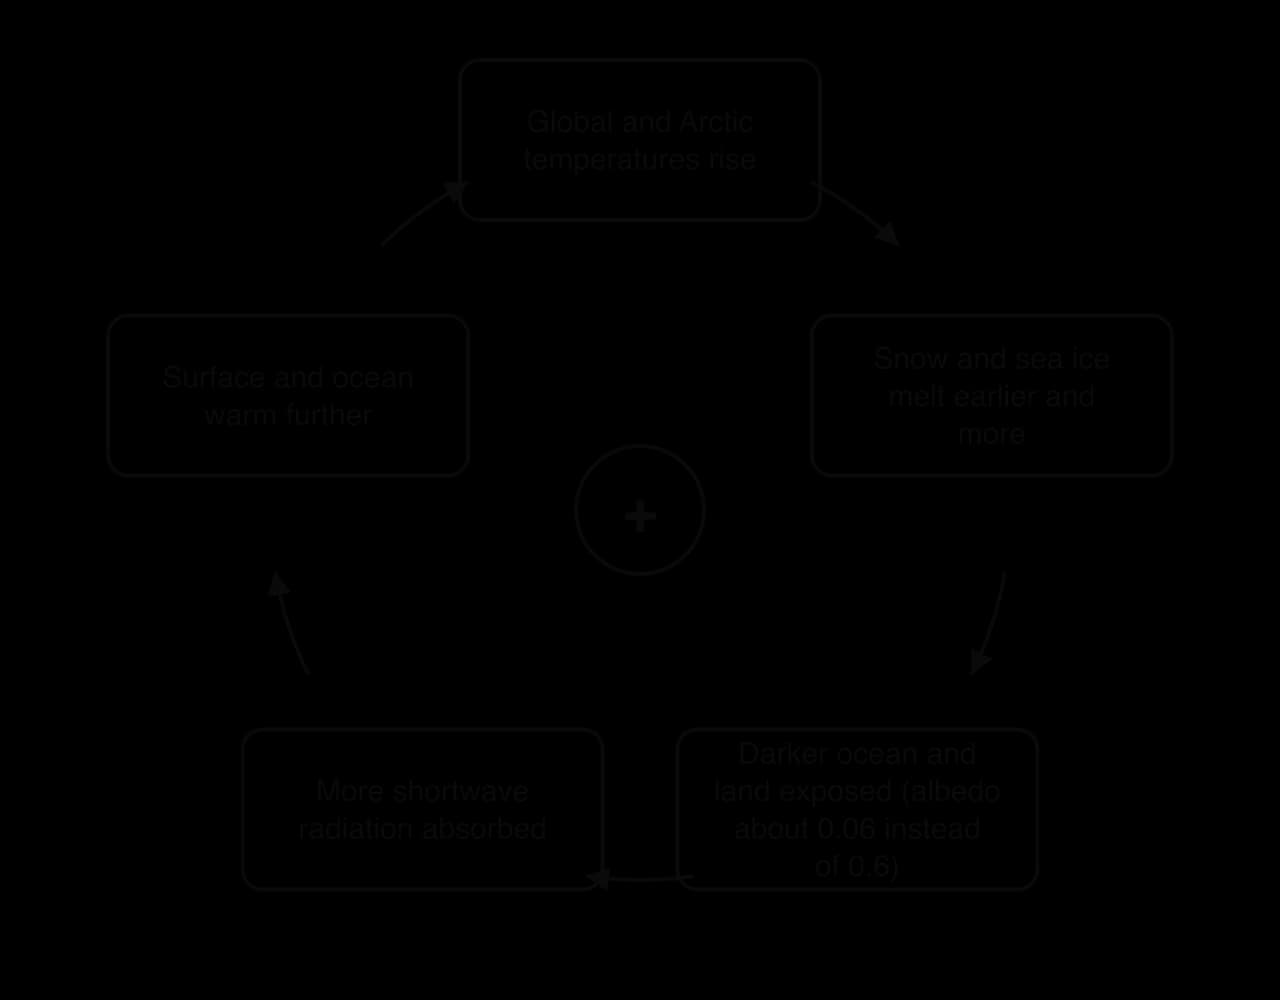
The feedback also works in reverse, which helps explain the ice ages: growing ice sheets raised the albedo and amplified cooling. In the Arctic today it is one of the causes of Arctic amplification, the much faster warming of the Arctic than the rest of the world, examined in the case study.
Land-use change and albedo
Human land use also changes albedo. Clearing forest for fields raises albedo, because grassland (about 0.25) is paler than forest (about 0.1–0.2), but in the tropics the carbon released by deforestation outweighs this cooling. Urbanisation generally lowers albedo where dark roofs and asphalt (about 0.04–0.12) replace vegetation. Soot from fires and industry that settles on snow and ice in the Arctic and the Himalaya darkens them and speeds melting.
Methane release and feedback loops
Methane is the second most important greenhouse gas produced by human activity. Its global mean concentration was 1,936 parts per billion (ppb) in 2025, about two and a half times the pre-industrial level; the IPCC put the rise since 1750 at 156% by 2019. About two-fifths of methane emissions are natural, mainly from wetlands, where microbes decompose organic matter without oxygen; the rest comes from agriculture (cattle and rice), landfill, and leaks from coal mining and oil and gas production.
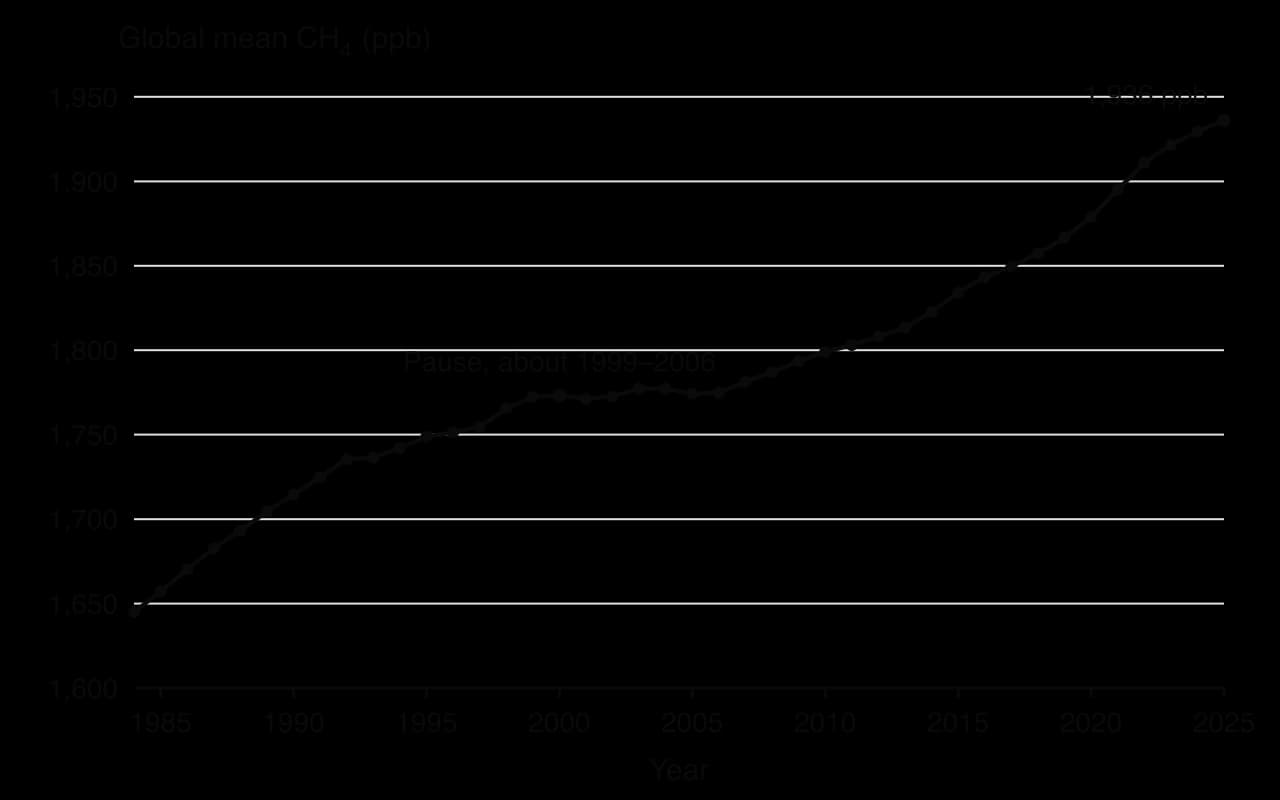
The record since 2007 shows why methane is a concern for feedbacks. Scientists attribute much of the recent rise to microbial sources, including tropical wetlands that release more methane when they are warmer and wetter, as well as agriculture and fossil fuels. A warming climate can therefore increase methane emissions from natural stores, which is a positive feedback.
Permafrost
Permafrost is ground that remains at or below 0 °C for at least two consecutive years. It underlies about a quarter of the exposed land in the Northern Hemisphere, across Siberia, northern Canada, Alaska and the Tibetan Plateau. Above it lies the active layer, which thaws each summer and refreezes each winter.
Permafrost soils contain the remains of plants and animals that froze before they could decompose, in some places over tens of thousands of years. Northern permafrost soils hold about 1,460–1,600 billion tonnes of carbon, more than twice the amount in the atmosphere today. While frozen, this carbon is locked away. When the permafrost thaws, microbes begin to decompose it.
The permafrost carbon feedback loop
The permafrost carbon feedback is a positive feedback loop. Rising air temperatures deepen the active layer and thaw permafrost; microbes decompose the newly thawed organic matter; carbon is released as carbon dioxide where the soil is dry and well aired, and as methane where it is waterlogged and lacks oxygen, as in thaw lakes and wetlands; the extra greenhouse gases strengthen the enhanced greenhouse effect, causing more warming and more thaw.
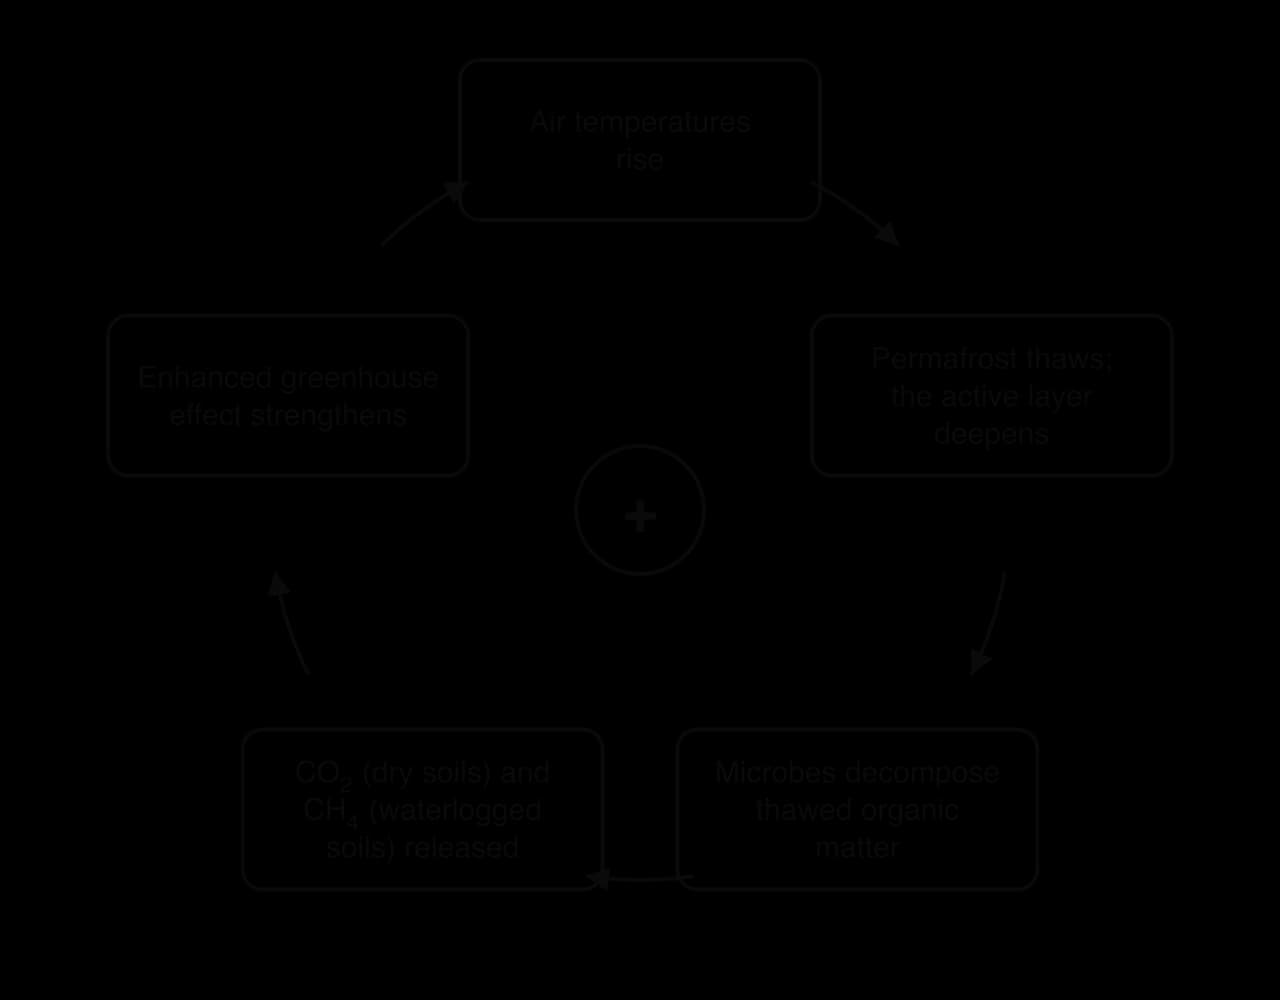
The IPCC estimates that permafrost thaw will release about 14–175 billion tonnes of CO₂-equivalent for each 1 °C of global warming, a very wide range that reflects deep uncertainty about how fast thaw happens and how wet the thawed ground will be. Most of the carbon is likely to be released as carbon dioxide, but methane from thaw lakes forms a growing share. Once thawed, permafrost carbon is lost on timescales of centuries, even if temperatures later fall.
Methane hydrates
Methane hydrates (also called clathrates) are ice-like solids in which methane molecules are trapped in a cage of frozen water. They form under high pressure and low temperature in sediments on continental shelves and slopes, and beneath permafrost. The amount of carbon they hold is very large, so a sudden release would be a powerful positive feedback.
Most hydrates lie under hundreds of metres of cold ocean water, where warming will take centuries to reach them, and much of any methane released from the deep sea floor dissolves and is oxidised before it reaches the air. The IPCC considers a catastrophic release of hydrate methane during this century very unlikely, but shallow hydrates on Arctic shelves, such as the East Siberian Arctic Shelf, are being monitored because they are closest to warming water.
 YouTube
Tipping points and the complexity of the climate system
Most feedbacks change the climate gradually. Some parts of the climate system may instead cross a threshold beyond which change becomes self-sustaining and very hard to reverse. Such a threshold is a tipping point.
Possible tipping element | How it could tip | Feedback that drives it | Effect on the global system |
|---|---|---|---|
Greenland ice sheet | Melting lowers the ice surface into warmer air | Height and albedo feedbacks | About 7 m of sea-level rise over many centuries |
West Antarctic ice sheet | Warm ocean water melts glaciers from below | Ice-sheet instability | Several metres of sea-level rise over centuries |
Permafrost | Abrupt thaw of ice-rich ground | Permafrost carbon feedback | Extra CO₂ and methane |
Amazon rainforest | Heat, drought, fire and clearance turn forest to savanna | Forest–rainfall feedback | A carbon sink becomes a source |
The IPCC is cautious about tipping points. It states that low-likelihood, high-impact outcomes, including ice-sheet instability involving tipping points, cannot be ruled out under high emissions, but there is limited evidence about where the thresholds lie. A 2022 assessment suggested that large-scale permafrost collapse could become irreversible somewhere between about 3 °C and 6 °C of warming. These uncertainties are one reason why the climate system is described as complex: its parts interact, its responses are not linear and its future cannot be predicted exactly.
Negative feedbacks
Not every feedback amplifies warming. Higher carbon dioxide concentrations speed up photosynthesis in many plants (carbon dioxide fertilisation), so land vegetation absorbs more carbon, a negative feedback on rising CO₂. Some changes in cloud cover may also reflect more sunlight. Over hundreds of thousands of years, the chemical weathering of rocks removes carbon dioxide from the air faster in a warmer, wetter climate, acting as a slow natural thermostat. These negative feedbacks are real but weaker or slower than the positive ones, and the IPCC projects that land and ocean sinks will take up a smaller proportion of emissions as warming continues.
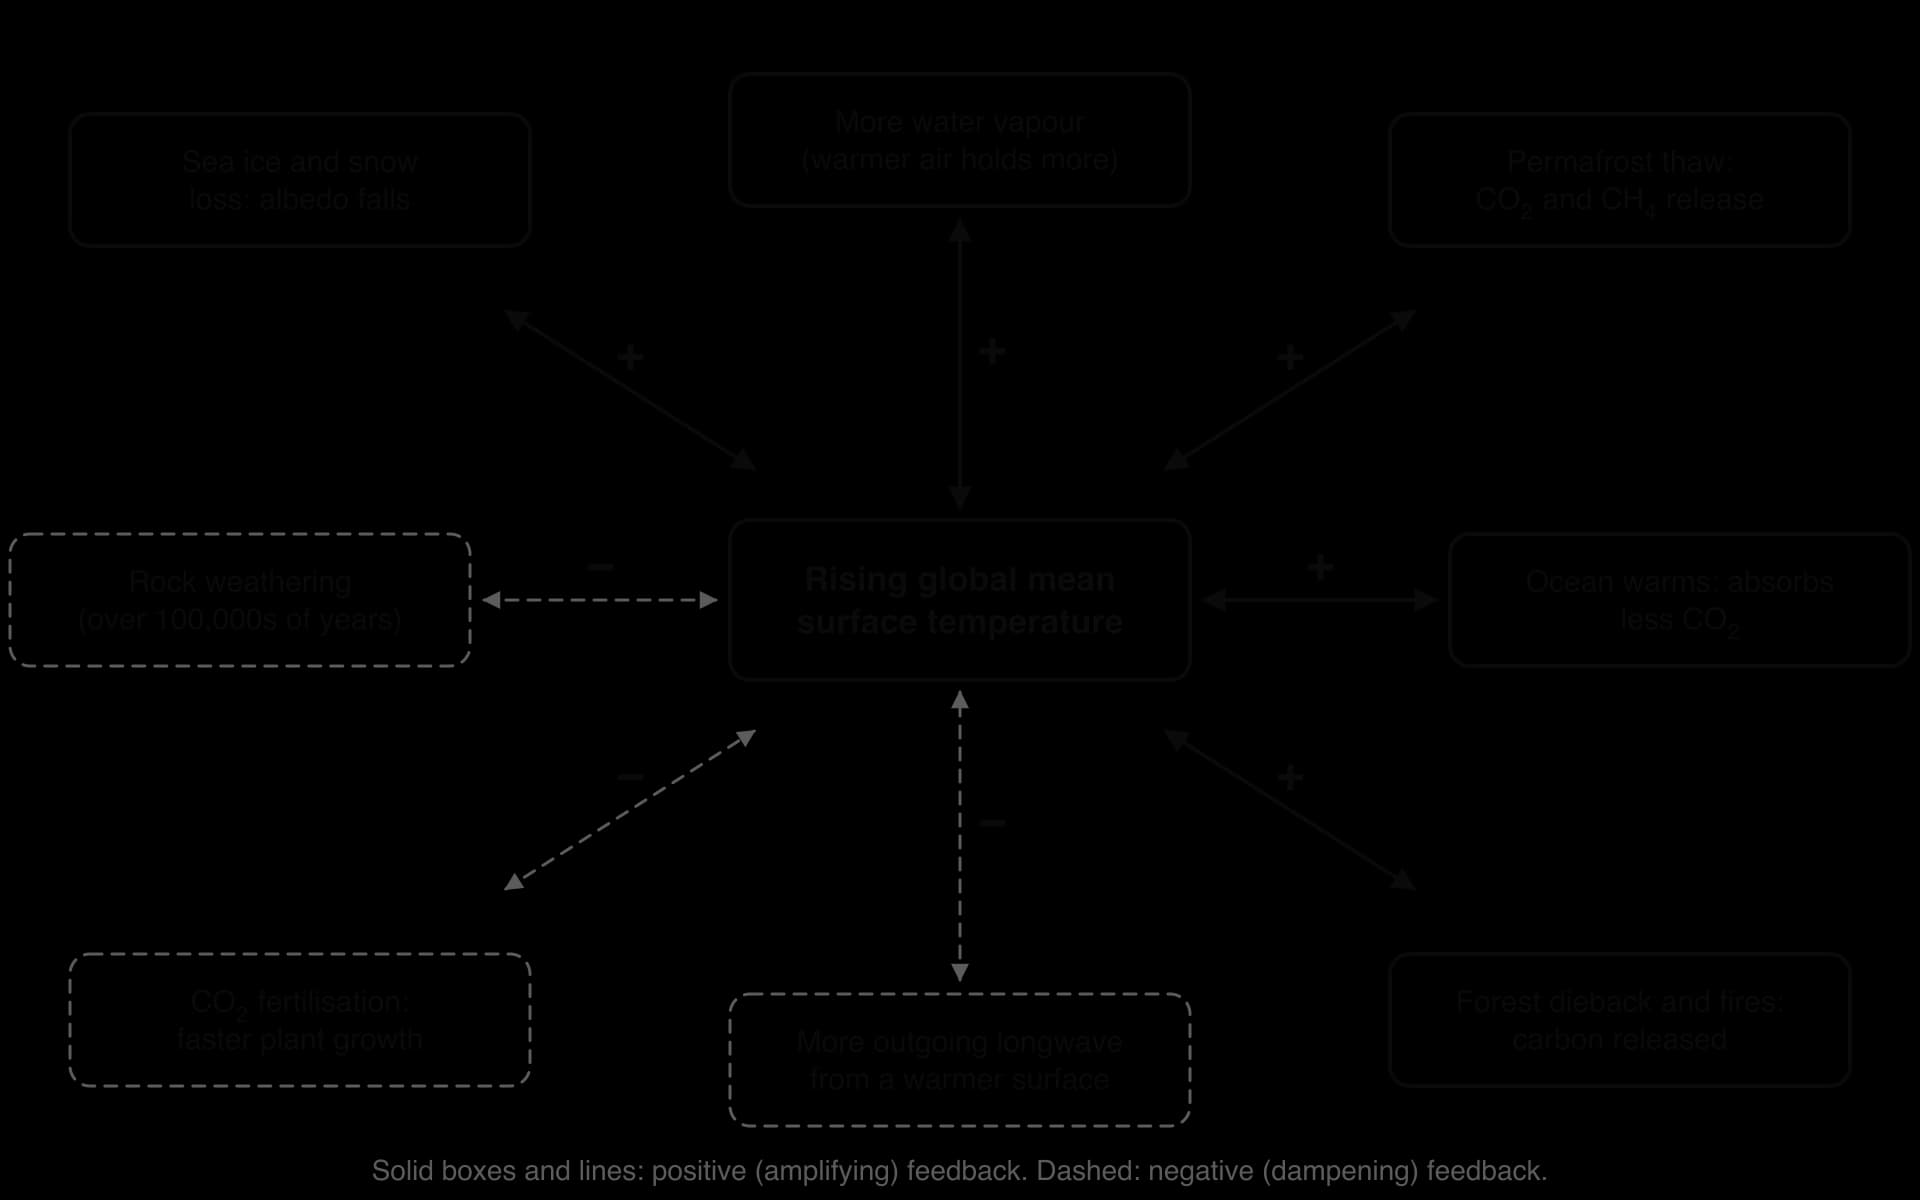
The systems diagram shows how the feedbacks interact through the shared variable of temperature. Arctic sea-ice loss warms the whole Arctic region, which speeds up permafrost thaw on land; warming oceans absorb less carbon dioxide, so more stays in the air; heat and drought make forest fires more likely, and burned forests release carbon. Because the loops are linked, the response of the whole system is larger than the sum of each loop studied on its own.
The enhanced greenhouse effect
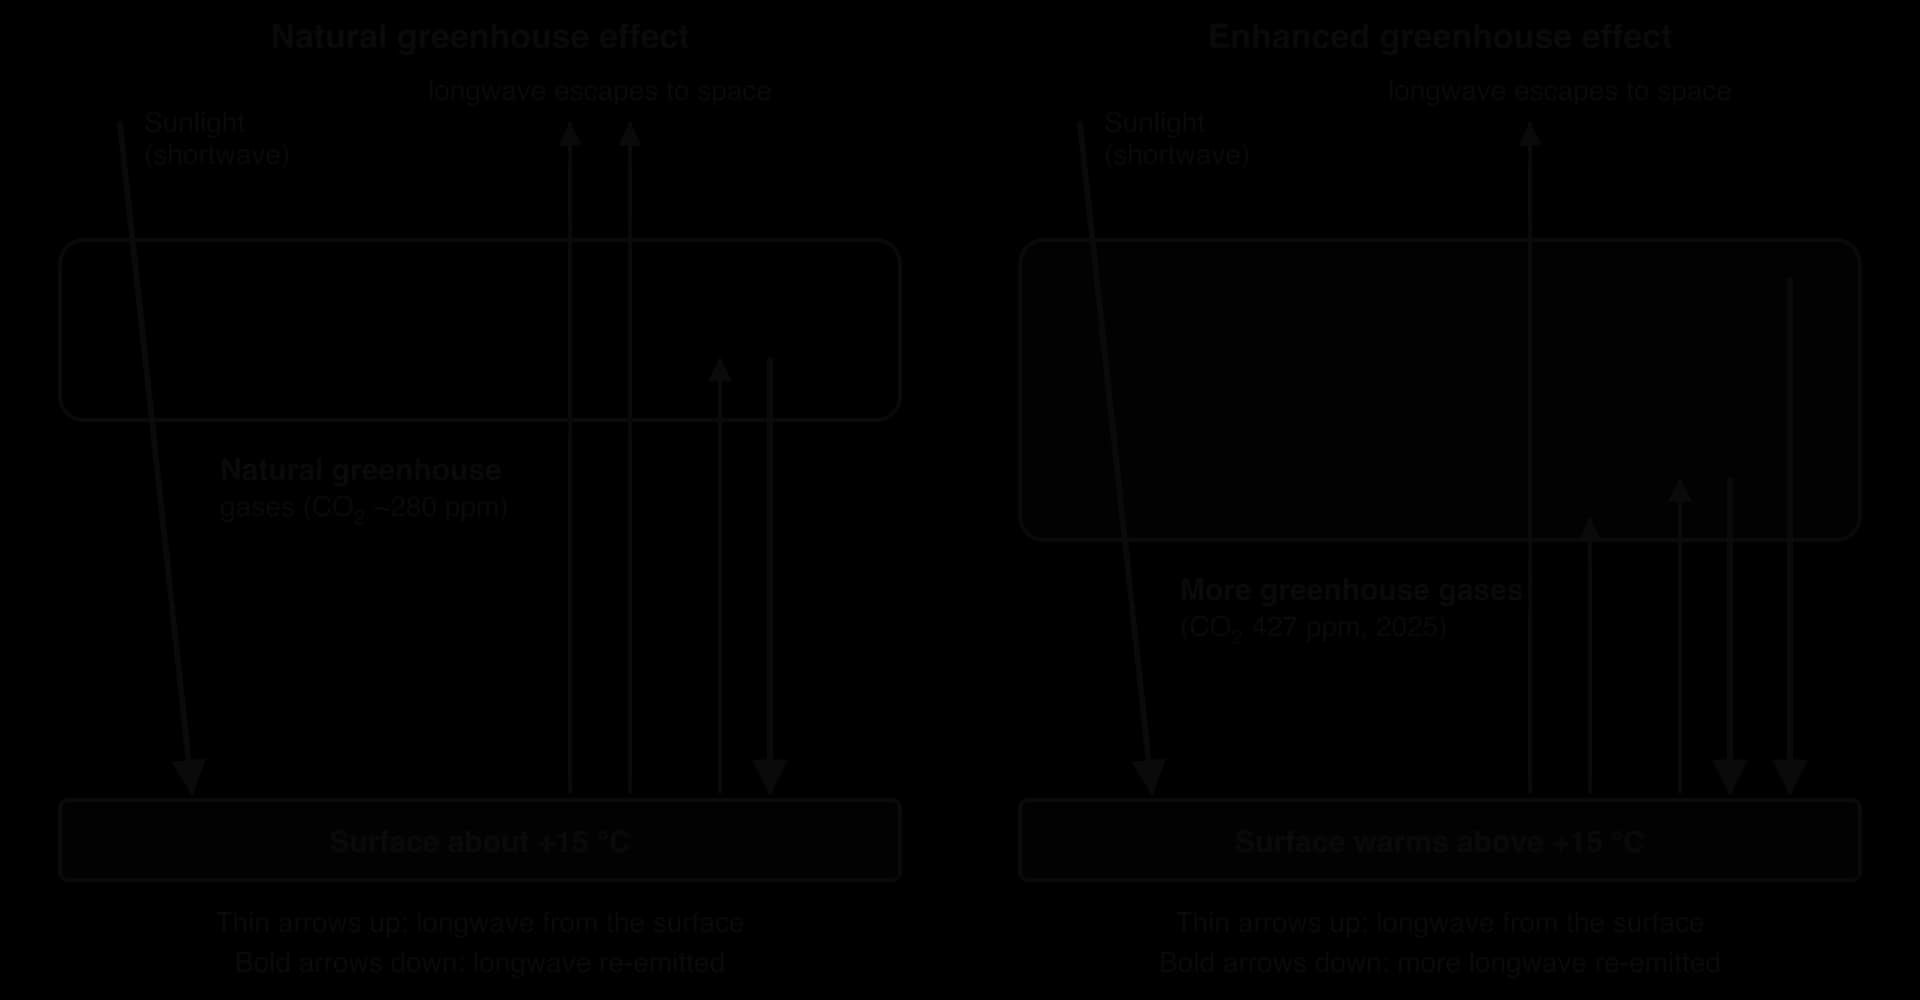
Since the start of the Industrial Revolution, human activity has added large amounts of greenhouse gases to the atmosphere, mainly by burning coal, oil and gas, clearing forests and expanding farming. The extra gases absorb more of the longwave radiation leaving the surface and re-emit more back towards it. This strengthening of the natural process is the enhanced greenhouse effect.
The mechanism can be followed through the energy balance. Higher concentrations of greenhouse gases mean that longwave radiation escapes to space from a higher, colder level of the atmosphere, so less energy leaves the planet. For a time the Earth absorbs more energy than it emits. The surface and lower atmosphere warm until outgoing longwave radiation again equals absorbed sunlight, but at a higher temperature. The positive feedbacks of water vapour, ice and carbon add to this warming.
Evidence: the Keeling curve
The longest continuous record of carbon dioxide in the air was started by the American scientist Charles David Keeling at the Mauna Loa Observatory in Hawaiʻi in March 1958. The site is on a high volcano in the middle of the Pacific Ocean, far from cities and forests, so its air represents the well-mixed background atmosphere. The graph of these measurements is the Keeling curve.
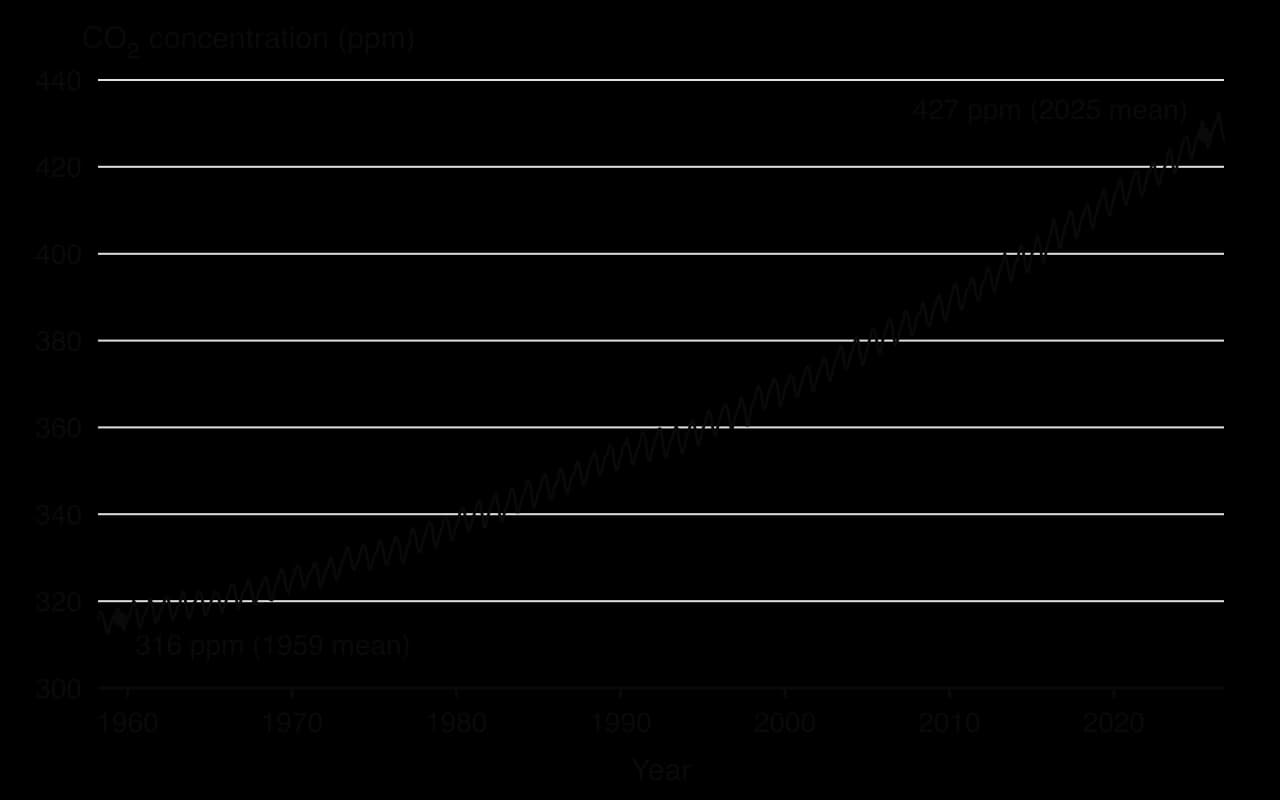
The Keeling curve has two features. The long-term trend is upward and accelerating: the annual mean rose by about 0.9 ppm a year in the 1960s and by about 2.6 ppm a year between 2015 and 2025. Before industrialisation the concentration was about 280 ppm, and ice cores show it stayed between about 180 and 300 ppm for at least 800,000 years. The seasonal cycle of about 6 ppm comes from vegetation in the Northern Hemisphere, which holds most of the world’s land: concentrations fall from May to September as plants absorb carbon dioxide by photosynthesis, and rise in autumn and winter as leaves decay.
Evidence: rising global temperature
Global climate change is the long-term change in the Earth’s climate system as a whole: temperature, precipitation, ice, sea level and the frequency of extreme events. Global warming is one part of it, the rise in global mean surface temperature. The two terms are often used as if they were the same, but warming is only one of many changes.
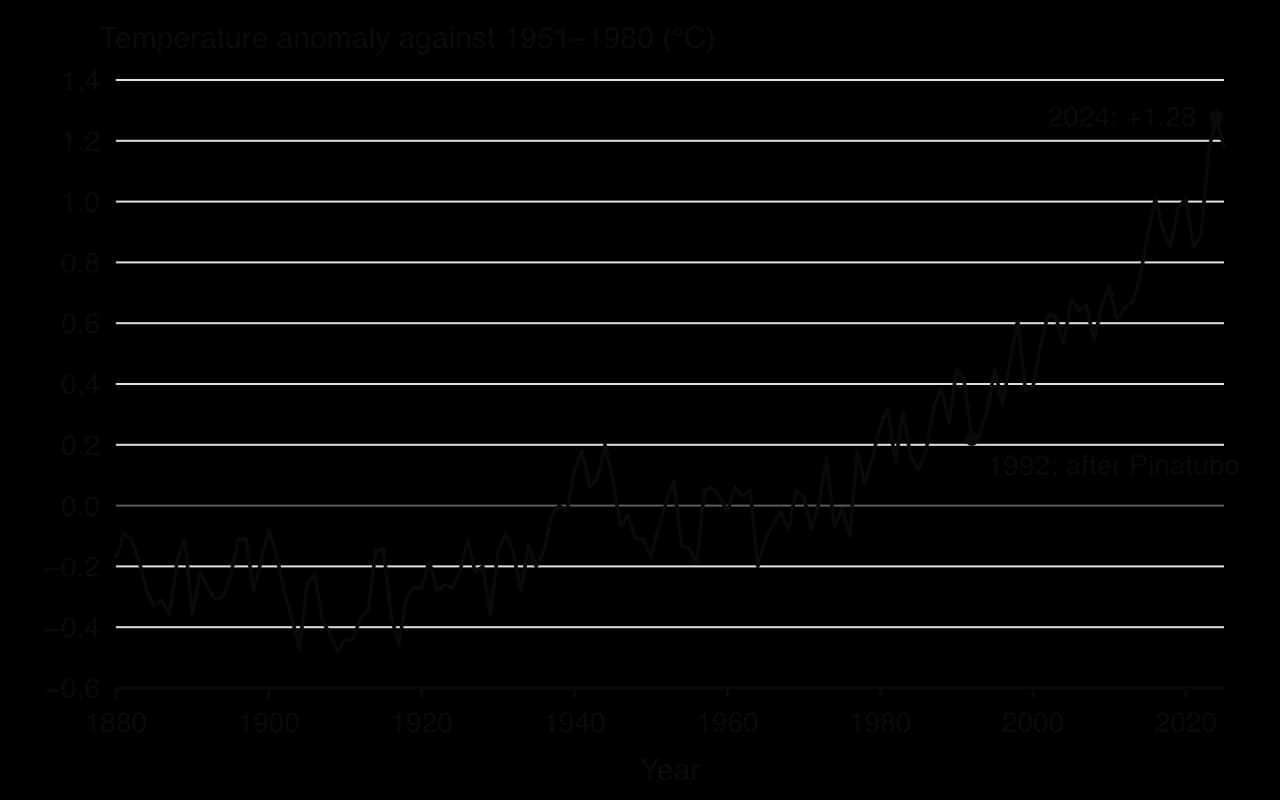
The NASA record shows a warming of about 1.4 °C between the late 19th century and the mid-2020s on its 1951–1980 baseline. The IPCC assessed that global surface temperature was 1.09 °C higher in 2011–2020 than in 1850–1900, with land warming faster (1.59 °C) than the ocean (0.88 °C). Combining nine global datasets, 2024 was about 1.55 °C (±0.13 °C) above the 1850–1900 average, the warmest year on record and the first calendar year above 1.5 °C, helped by an El Niño. 2025 was about 1.43 °C (±0.13 °C) above it, the second or third warmest year, and 2015–2025 were the eleven warmest years on record.
Sources: NASA GISS, GISTEMP v4, 2026; IPCC AR6 WGI Summary for Policymakers, 2021; WMO, State of the Global Climate 2025, 2026.
The IPCC’s best estimate of the human-caused warming from 1850–1900 to 2010–2019 is 1.07 °C, almost all of the observed warming. Natural drivers (the Sun and volcanoes) changed temperature by only −0.1 °C to +0.1 °C over the same period. The IPCC concluded that it is unequivocal that human influence has warmed the atmosphere, ocean and land.
Sources of emissions: by gas and by sector
In 2024, carbon dioxide made up about 77% of global greenhouse gas emissions in CO₂e (using 100-year GWPs), methane about 17% and nitrous oxide about 5%. Fossil fuels are the dominant source: the Global Carbon Project estimated fossil carbon dioxide emissions at a record 38.1 billion tonnes in 2025, 1.1% more than in 2024, with a further 4.1 billion tonnes from land-use change, mainly deforestation in the tropics.
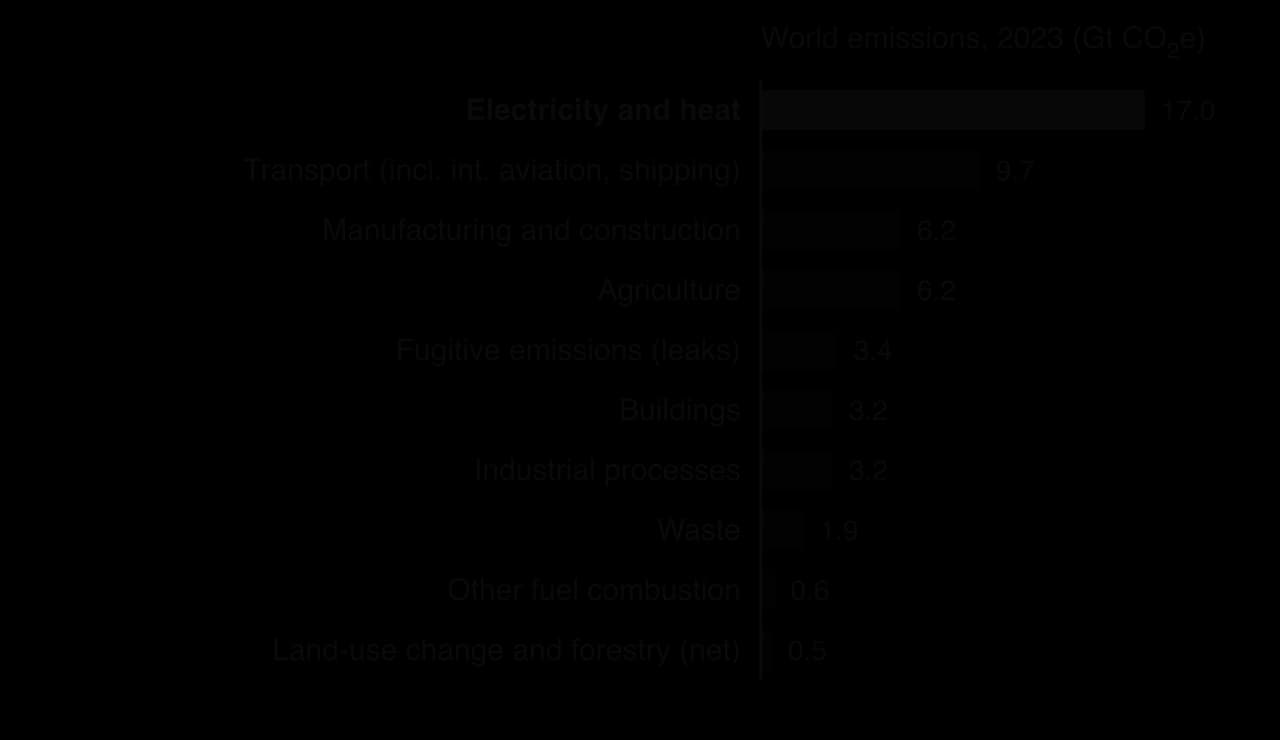
Electricity and heat (about a third of the total) depend above all on how much coal a country burns, and agriculture is the main source of methane and nitrous oxide. Grouping emissions by sector shows where reductions are technically possible; grouping them by country shows who is responsible and who has the power to act.
International variations in greenhouse gas emissions
Emissions are very unevenly distributed between countries, and the pattern looks different depending on how they are measured. Four measures are in common use: total annual emissions, emissions per person, cumulative (historic) emissions and consumption-based emissions. Each tells a different story, and each is used by different groups to support a different view of who should act.
Total and per capita emissions
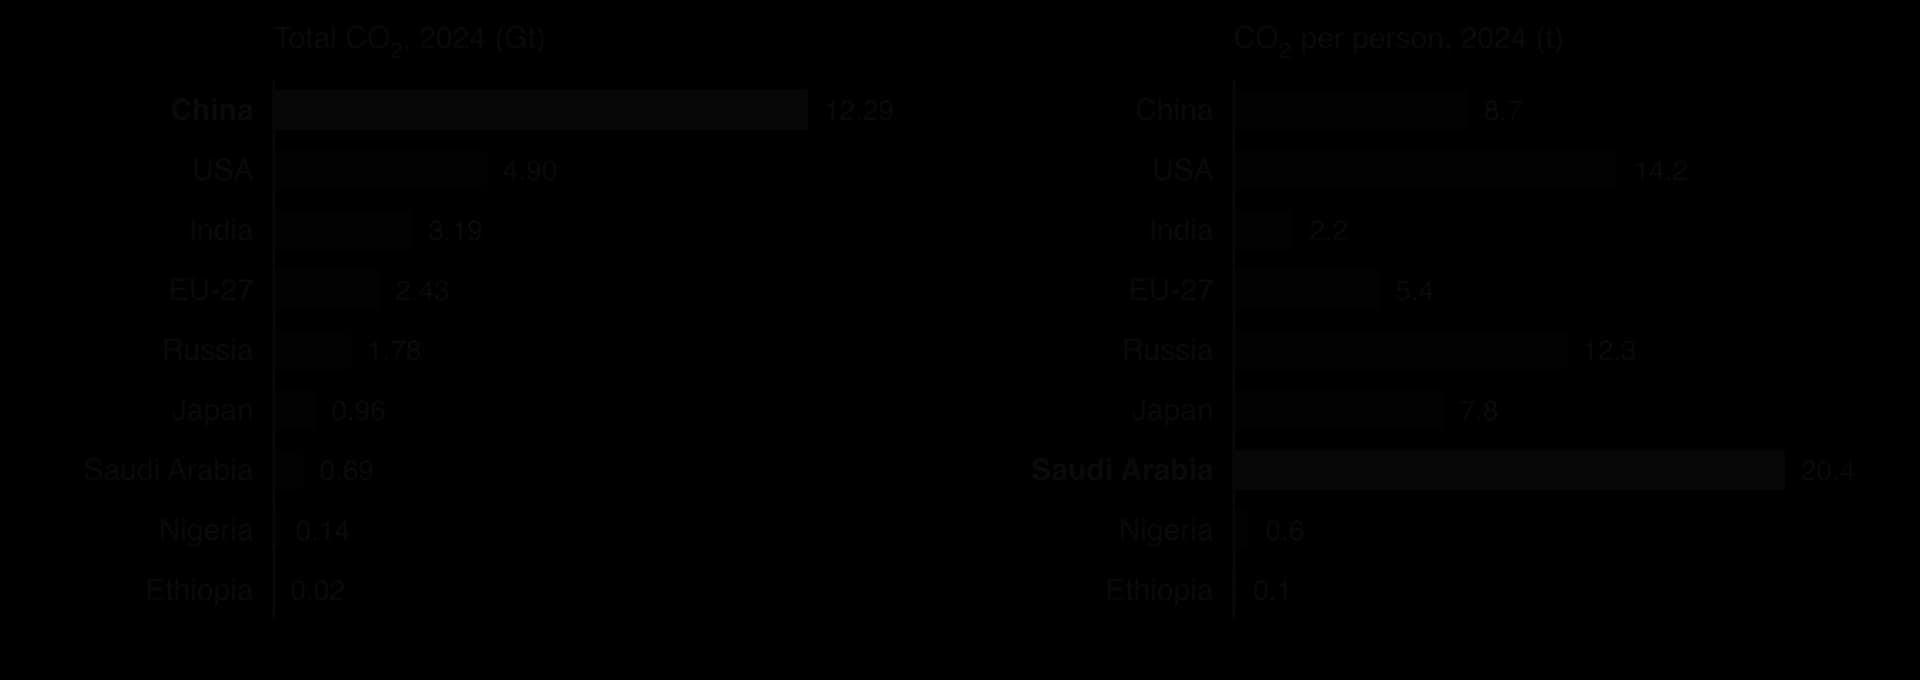
In total annual emissions, China has been the largest emitter since about 2006. In 2024 it emitted 12.3 billion tonnes of carbon dioxide, about 32% of the world total, followed by the USA (12.7%), India (8.3%), the European Union (6.3%) and Russia (4.6%). These five economies produce about two-thirds of global CO₂.
Per capita emissions divide a country’s emissions by its population. They show that an average person in Saudi Arabia (20.4 t), the USA (14.2 t), Australia (14.5 t) or Russia (12.3 t) emits several times as much as a person in China (8.7 t), the EU (5.4 t) or India (2.2 t), and many times as much as a person in Nigeria (0.6 t) or Ethiopia (0.1 t). The world average in 2024 was 4.7 t.
Oil and gas producers with small populations, such as Qatar (41.3 t) and Kuwait (26.2 t), are the highest per capita emitters, because energy is cheap and much of it is used for air conditioning, desalination and fossil-fuel processing.
Cumulative emissions
Carbon dioxide stays in the atmosphere for centuries, so warming today depends on the total emitted since industrialisation, not on this year’s emissions alone. The IPCC estimates that each 1,000 billion tonnes of cumulative CO₂ emissions raises global temperature by about 0.45 °C (likely 0.27–0.63 °C). Countries that industrialised first have therefore contributed most to the warming already observed.
Country or group | Share of world CO₂, 2024 (%) | CO₂ per person, 2024 (t) | Share of cumulative CO₂ since 1750 (%) |
|---|---|---|---|
USA | 12.7 | 14.2 | 23.5 |
European Union (27) | 6.3 | 5.4 | 16.3 |
China | 31.8 | 8.7 | 15.4 |
Russia | 4.6 | 12.3 | 6.6 |
United Kingdom | 0.8 | 4.5 | 4.3 |
Japan | 2.5 | 7.8 | 3.8 |
India | 8.3 | 2.2 | 3.6 |
Nigeria | 0.35 | 0.6 | 0.25 |
World | 100 | 4.7 | 100 |
Sources: Global Carbon Budget 2025 via Our World in Data, 2026 (fossil fuels and industry, excluding land-use change).
The table shows why international negotiations are difficult. The USA and the EU-27 together account for about two-fifths of all the carbon dioxide emitted since 1750, though they produce under a fifth of today’s emissions. The UK, the first country to industrialise, still holds 4.3% of the cumulative total with less than 1% of current emissions. India is the third-largest current emitter but has contributed under 4% of the historic total. Countries in sub-Saharan Africa have contributed almost nothing. This pattern underlies the principle of “common but differentiated responsibilities” in climate agreements and the idea of climate justice.
Emissions and economic development
Per capita emissions rise with economic development, because richer societies use more energy for industry, transport, heating, cooling and consumer goods. The scatter graph plots carbon dioxide per person against GDP per person (at purchasing power parity) for 25 countries.
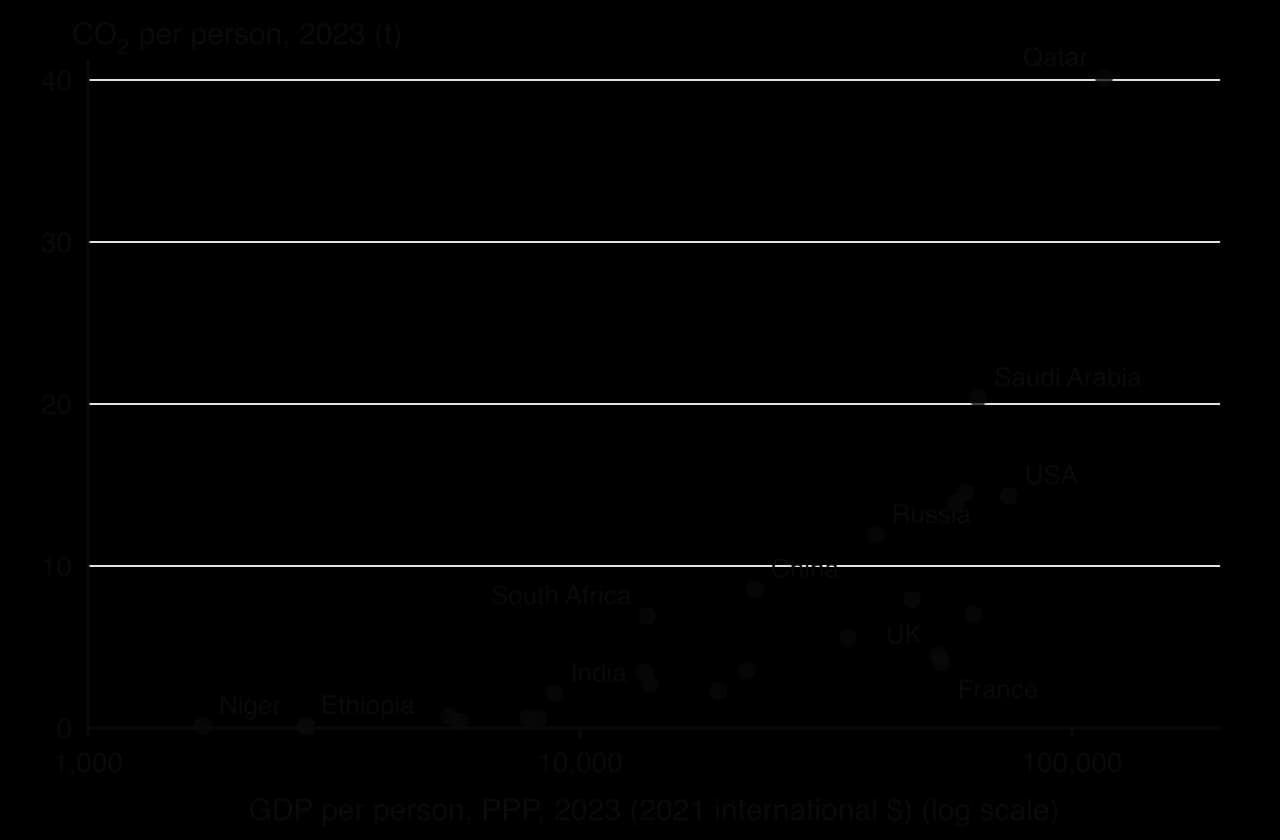
The graph shows a strong positive relationship but with wide variation at high incomes. Low-income countries such as Niger, Ethiopia and Uganda emit 0.1–0.2 t per person, because most people have little access to electricity and use biomass for cooking. Emissions rise quickly as countries industrialise and electrify.
In China, per capita emissions rose from 2.2 t in 1990 to 8.6 t in 2023 as the country industrialised. Among high-income countries, the energy mix and lifestyle matter as much as income: France generates most of its electricity from nuclear power and emits about 4 t per person, about a quarter of the per capita figure of Australia and a fifth of that of Saudi Arabia.
Decoupling
Some high-income countries have managed to grow their economies while cutting emissions. This is called decoupling. The UK’s GDP (in constant prices) rose by about 91% between 1990 and 2023, while its territorial carbon dioxide emissions fell by 49%, from 602 Mt to 308 Mt. The main causes were the switch from coal to gas and then to wind power for electricity, the decline of heavy industry, and gains in energy efficiency.
Decoupling is real but partial. Part of the UK’s fall came from moving manufacturing abroad: its consumption-based emissions, which count the goods its people buy, fell by only about 27% over the same period. Decoupling therefore looks stronger when emissions are counted where they are produced than when they are counted where goods are consumed.
Globalisation, trade and the geography of emissions
Globalisation is the process by which places, economies and societies around the world become more closely connected through flows of goods, services, capital, people, information and ideas. Its growth since the 1970s has been driven by cheaper container shipping and air transport, the spread of telecommunications and the internet, and the removal of many barriers to trade and investment.
The main agents of economic globalisation are transnational corporations (TNCs), sometimes called multinational corporations. A TNC has its headquarters in one country, usually a high-income one, and production or sales operations in many others. TNCs locate each stage of production where it is cheapest or most efficient: research and design near the headquarters, components where skills or materials are available, assembly where labour costs are low. Samsung Electronics, with its headquarters in Suwon, South Korea, makes many of its smartphones in large factories near Hanoi in Vietnam, opened from 2009, and closed its last smartphone factory in China in 2019.
The movement of manufacturing from older industrial regions in Europe and North America to Asia, and especially to China, is called the global shift. China’s share of world manufacturing value added rose from about 18% in 2010 to 28% in 2024, while the UK’s fell from 3.6% in 2000 to 1.8%. Factories in China and other emerging economies rely heavily on coal-fired electricity, so the global shift moved a large share of the world’s industrial emissions to Asia.
Production-based and consumption-based emissions
National emissions are normally counted where they physically occur. This is the production-based or territorial method used in international agreements: the emissions from a steel mill in China count towards China’s total, even if the steel ends up in a car sold in Germany. Consumption-based emissions are counted instead where the goods and services are finally used, by subtracting the emissions in a country’s exports and adding those in its imports.
The emissions released in producing and transporting a good that is traded between countries are its embedded emissions. Large flows of embedded emissions run from emerging economies that export manufactured goods to high-income countries that import them.

The charts show the two sides of the same trade. In 2023 the UK’s consumption-based emissions were 7.1 t per person, 58% higher than its territorial emissions of 4.5 t. China’s consumption-based emissions were 7.6 t per person against territorial emissions of 8.6 t, about 11% lower, because a large part of its industrial output is exported. The USA, a large net importer, had consumption-based emissions of 15.8 t per person against 14.3 t territorial. Without trade-adjusted figures, the success of some high-income countries in cutting emissions would look larger than it is.
Emissions outside national totals
Emissions from international shipping and aviation take place between countries, so they are not counted in any country’s territorial total under the UN rules. Together they were about 1.2 Gt CO₂e in 2023, about 2–3% of global emissions, and they are regulated separately through the International Maritime Organization and the International Civil Aviation Organization.
Carbon footprints
A carbon footprint measures emissions from the point of view of a person, a household, an organisation or a product, including indirect emissions in everything they buy. It extends consumption-based accounting down to the local scale: a flight, a kilogram of beef or a smartphone can each be given a footprint in kilograms of CO₂e.
Way of counting | What it measures | Who it makes look most responsible | Main limitation |
|---|---|---|---|
Total territorial emissions | Emissions inside a country’s borders in a year | China, the USA, India | Ignores population, history and trade |
Per capita emissions | Territorial emissions per person | Qatar, Saudi Arabia, the USA, Australia | Hides inequality inside a country |
Cumulative emissions | All emissions since about 1750 | The USA, EU countries, the UK, Russia | Earlier generations did not know the effects |
Consumption-based emissions | Emissions from what a country consumes, wherever produced | Importing HICs (UK, USA, Germany) | Harder to calculate; data lag |
Carbon footprint | Emissions of a person, firm or product | High-consuming individuals and products | Methods differ; can shift attention from producers |
The comparison shows that emissions are a matter of power and perspective as well as physics. The countries with the greatest historic responsibility are mostly high-income countries with the wealth to cut emissions and adapt; the countries whose emissions are rising fastest are emerging economies that argue for their right to develop; the lowest emitters, mostly low-income countries, have the least power in negotiations. These positions shape the global responses to climate change, from the Kyoto Protocol to the Paris Agreement.
Case study: the Arctic, albedo and permafrost feedbacks
The place and its context
The Arctic is the region around the North Pole, usually defined as the area north of the Arctic Circle (66.5°N). At its centre is the Arctic Ocean, about 14 million km² of sea, partly covered by floating sea ice and surrounded by the northern coasts of Russia, Norway, Greenland (Denmark), Canada and Alaska (USA). Around the ocean lie the tundra and the northern boreal forest, much of it underlain by permafrost. Indigenous peoples, including the Inuit of Canada, Greenland and Alaska, the Sámi of northern Scandinavia and the Nenets of Siberia, have lived in the region for thousands of years.
The Arctic matters to the global energy balance far beyond its size: its snow and sea ice reflect much of the summer sunlight, and its frozen soils store more carbon than the whole atmosphere. Both are changing quickly, and both changes feed back into global warming.
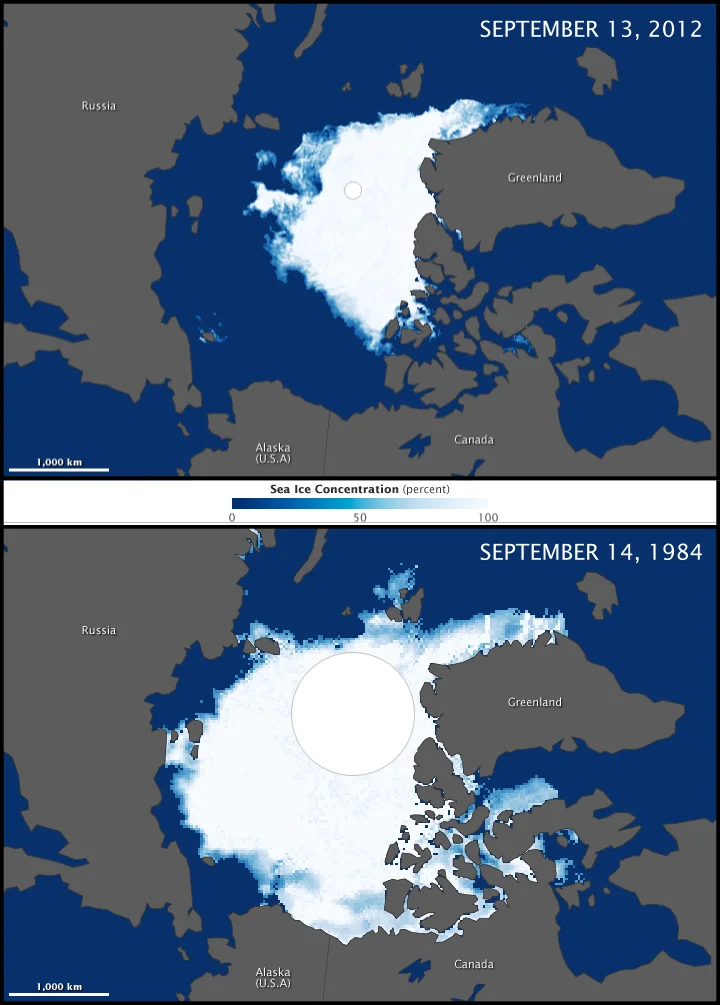
Process: why the Arctic warms fastest
Since 1979 the Arctic has warmed nearly four times faster than the global average, according to a 2022 analysis of observations; parts of the Barents Sea north of Norway and Russia have warmed up to seven times faster. A broader study found that the region north of 60°N warmed by 3.1 °C between 1971 and 2019, against about 1 °C for the world as a whole. This Arctic amplification has several causes acting together.
The ice–albedo feedback. Sea ice with an albedo of 0.5–0.7 is replaced by open water with an albedo of about 0.06, so the ocean absorbs much more summer sunlight. The heat stored in the ocean delays the autumn refreeze and thins the next winter’s ice.
The lapse-rate feedback. In the Arctic, warming is concentrated in a shallow layer of air near the surface, which is held down by cold, stable air above. A warmer surface radiates longwave energy away less efficiently than in the tropics, where heat is carried high into the atmosphere, so more of the warming stays near the ground.
More heat carried from the south, by the atmosphere and by warm Atlantic water flowing into the Barents Sea.
Changes in water vapour and clouds, which trap more longwave radiation in autumn and winter over open water.
The sea-ice record shows the result. NSIDC satellite data show that the average extent of Arctic sea ice in September, the month of the summer minimum, fell from 7.05 million km² in 1979 to a record low of 3.57 million km² in 2012, a loss of almost half. Extents since then have stayed well below the levels of the 1980s and 1990s.
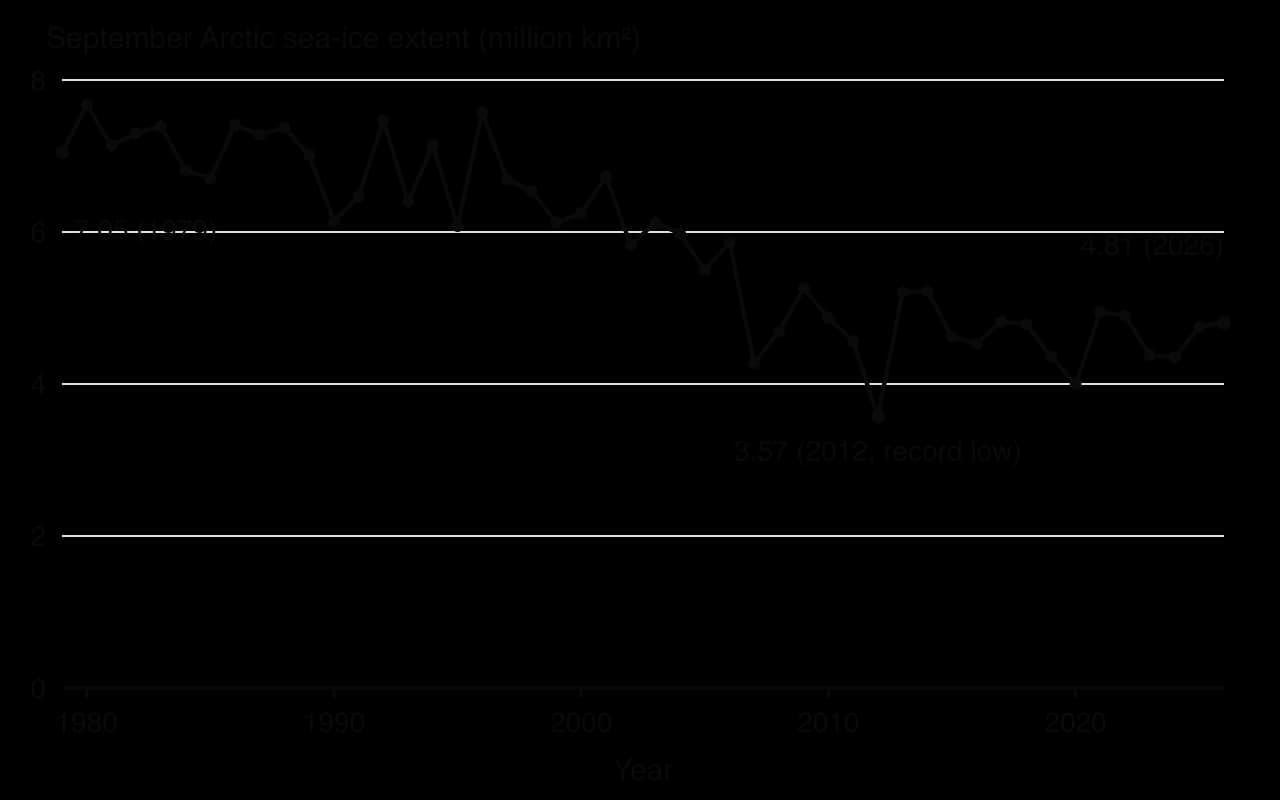
The average September extent in 2026 was 4.81 million km². The daily minimum, 4.60 million km² on 12 September, tied for the tenth lowest in the record with 2008, 2010 and 2025. The low values of 2007 and 2012 followed summers with winds that pushed ice out of the Arctic and storms that broke it up, so a year with fewer extremes, like 2026, can sit above the long-term trend without reversing it. The IPCC concluded that the Arctic is likely to be practically ice-free in September (less than 1 million km²) at least once before 2050 under every one of its main scenarios.
Process: the permafrost carbon feedback
The second Arctic feedback acts on land. Permafrost soils across Siberia, Alaska and northern Canada hold about 1,460–1,600 billion tonnes of organic carbon. As the region warms, the active layer deepens, the permafrost beneath it warms and in places thaws completely. Where the ground is rich in ice, thaw makes the surface slump and collapse, forming irregular hollows and thaw lakes (thermokarst), which expose more frozen carbon at once. A 2022 assessment estimated that this abrupt thaw adds about 50% to the emissions expected from gradual thaw.
During the Siberian heatwave of 2020, the town of Verkhoyansk, north of the Arctic Circle, recorded 38 °C on 20 June, a record for the Arctic. Heat and drought also increase wildfires in the boreal forest and tundra, which burn carbon-rich peat and remove the insulating surface layer above the permafrost, speeding up thaw.
The IPCC estimates that permafrost will release 14–175 billion tonnes of CO₂e for each 1 °C of global warming. Even the low end of the range is significant: humanity emitted about 42 billion tonnes of carbon dioxide in 2025, so each degree of warming could add the equivalent of one-third to four years of today’s emissions. Because this carbon comes from natural stores, it is not covered by any national emissions pledge.
Impacts on different groups
Group | How the changes affect them |
|---|---|
Indigenous communities (Inuit, Sámi, Nenets and others) | Thinner, less predictable sea ice makes hunting and travel dangerous; thaw damages homes and food stores; Alaskan coastal villages erode once sea ice no longer shields them from storms. |
Arctic towns and industries | Buildings, pipelines and runways subside on thawing ground; winter ice roads open for shorter periods. |
Shipping and resource companies | Longer ice-free seasons open sea routes and offshore oil, gas and minerals: opportunities with environmental risks. |
The world as a whole | Arctic feedbacks add to global warming and Greenland meltwater raises sea levels everywhere. |
Responses and their limits
The eight Arctic states and six Indigenous peoples’ organisations cooperate on monitoring through the Arctic Council (founded 1996), and engineers protect buildings on thawing ground by raising them on piles or cooling the ground. These are adaptations to local impacts. The only way to slow the feedbacks themselves is to reduce global emissions, which are produced mostly outside the Arctic.
Key concept | How the Arctic shows it |
|---|---|
Process | Two positive feedback loops, ice–albedo and permafrost carbon, amplify warming and interact through the shared rise in temperature. |
Place | The Arctic’s particular characteristics (bright ice, frozen carbon, a shallow layer of surface air) make it warm faster than any other region. |
Power | The causes lie mostly in distant industrial economies, while the people most affected, Arctic Indigenous communities, have little influence over global emissions. |
Possibility | Ice-free Septembers, permafrost tipping points and new shipping routes are possible futures whose timing depends on global emissions and remains uncertain. |
Sources: NSIDC Sea Ice Index v4 and Arctic Sea Ice News, 2026; Rantanen et al. (2022) and other studies summarised in Wikipedia, Arctic amplification and Permafrost carbon cycle, 2026; IPCC AR6 WGI Summary for Policymakers, 2021; Global Carbon Project, 2025; WMO, 2021.
Analysis questions
Explain why the loss of Arctic sea ice is both a consequence and a cause of global warming.
Suggest why estimates of carbon release from permafrost have such a wide range.
To what extent can the Arctic be described as a region where the causes of change are global but the impacts are local?
Exam practice
The causes of climate change appear in Paper 2. Section A has one structured question of 10 marks on global climate, usually based on a graph, map or table; Section B has an infographic that may draw on any core unit; Section C offers an extended response of 10 marks, often a quoted statement followed by “To what extent do you agree with this statement?”.
Structured question (Section A style)
Study the table, which shows annual mean carbon dioxide concentrations measured at Mauna Loa, Hawaiʻi.
Year | 1960 | 1970 | 1980 | 1990 | 2000 | 2010 | 2020 | 2025 |
|---|---|---|---|---|---|---|---|---|
CO₂ concentration (ppm) | 316.9 | 325.7 | 338.8 | 354.5 | 369.7 | 390.1 | 414.2 | 427.4 |
Sources: NOAA Global Monitoring Laboratory, Mauna Loa annual means, 2026.
Part (b) asks for reasons that the table cannot show directly, so each must be a plausible cause linked to the data.
Part (c) moves away from the stimulus to test understanding of processes.
Infographic question (Section B style)
An infographic titled “Who is responsible?” compares four countries in 2023–2024 with four icons per country: a factory chimney sized by total CO₂ (China 12.3 Gt, USA 4.9 Gt, India 3.2 Gt, UK 0.31 Gt), a figure of a person labelled with CO₂ per person (8.7 t, 14.2 t, 2.2 t, 4.5 t), a stack of coins for the share of cumulative emissions since 1750 (15%, 24%, 4%, 4%) and a shopping bag for consumption-based emissions per person (7.6 t, 15.8 t, 1.8 t, 7.1 t). A caption reads: “Rich countries caused the problem.” (Figures from the Global Carbon Budget 2025 via Our World in Data.)
Extended response (Section C style)
Summary
The Earth absorbs about 240 W m⁻² of the 340 W m⁻² of incoming shortwave radiation and emits the same amount as longwave radiation; the global mean temperature is stable when the two balance.
The natural greenhouse effect, caused by gases such as water vapour, CO₂, methane and nitrous oxide absorbing and re-emitting longwave radiation, keeps the surface at about +15 °C instead of −18 °C.
Greenhouse gases differ in strength and lifetime; global warming potential converts them to CO₂-equivalent, and the 20-year and 100-year values give methane very different weight.
Positive feedback loops (ice–albedo, water vapour, permafrost carbon) amplify a change; negative feedback loops (more outgoing longwave, CO₂ fertilisation, weathering) dampen it.
Solar variations and Milankovitch cycles change the climate over long periods but explain almost none of the warming since 1950; volcanic and human aerosols cause global dimming and mask part of the warming.
Rising CO₂ (427 ppm in 2025, 53% above pre-industrial) and other gases have caused the enhanced greenhouse effect and about 1.1 °C of human-caused warming by 2010–2019, with 2024 about 1.55 °C above 1850–1900.
Emissions vary with the measure: China leads in total, Gulf states and the USA per person, the USA and Europe in cumulative emissions, and importing HICs in consumption-based emissions.
Globalisation, TNCs and the global shift move manufacturing and its emissions to emerging economies, so territorial figures understate the responsibility of consuming countries.
The Arctic warms nearly four times faster than the world because of sea-ice and permafrost feedbacks, which link local change to the global energy balance.
Self-check
- To do:
I can describe the structure of the atmosphere and label the flows of the global energy balance with values in W m⁻².
- To do:
I can explain the natural greenhouse effect step by step and why some gases have a higher global warming potential than others.
- To do:
I can distinguish positive and negative feedback and draw the ice–albedo and permafrost carbon loops from memory.
- To do:
I can explain how solar variations, Milankovitch cycles and volcanic and human aerosols change the energy balance, with Mount Pinatubo as an example.
- To do:
I can examine why tipping points make the climate system complex and its future uncertain.
- To do:
I can describe the Keeling curve and the temperature record and determine percentage changes and rates from them.
- To do:
I can compare total, per capita, cumulative and consumption-based emissions for named countries, with figures.
- To do:
I can explain how globalisation, TNCs and trade create embedded emissions, using China and the UK.
- To do:
I can use the Arctic to explain how albedo and methane feedbacks link a region to the global climate.