Notes on 2.3 Responding to global climate change
Learning objectives
Define risk, exposure, vulnerability, resilience and adaptive capacity, and explain how they combine to determine the harm climate change causes.
Explain how location, wealth, age, gender, education and risk perception make some people and places more vulnerable than others.
Examine the idea of climate justice using per capita, total and cumulative emissions.
Compare two societies with contrasting vulnerability: coastal Bangladesh and Tuvalu.
Distinguish between mitigation and adaptation, with examples of each at national and local scale.
Evaluate global geopolitical efforts to tackle climate change, from the UNFCCC to the Paris Agreement and recent COPs.
Evaluate carbon offsetting, carbon trading and carbon taxes, and technologies including carbon capture and geoengineering.
Examine civil society and corporate strategies, and explain why perspectives differ on the need for, practicality and urgency of action.
Evaluate the response to climate change in the Netherlands, focusing on non-governmental stakeholders.
Introduction
Responding to climate change involves reducing the greenhouse gas emissions that cause it, and adjusting to the changes that are already happening and cannot now be avoided. The response matters because the effects of global climate change fall very unevenly. A heatwave, a drought or a rise in sea level harms some people far more than others, and the people most at risk are often those who have done least to cause the problem.
The topic is about power and possibility. Power decides who sets emissions targets, who pays for adaptation and who is heard in negotiations, from small island states at a United Nations summit to citizens taking their government to court. Possibility is about the range of futures still open: the same physical system can lead to about 1.5 °C or more than 3 °C of warming by 2100, depending on the choices that governments, businesses and citizens make in the next few decades.
Risk, exposure, vulnerability and resilience
Climate change harms people when a climate-related hazard, such as a storm surge or a long drought, meets people and property that are in its path and are unable to cope with it. Geographers and the Intergovernmental Panel on Climate Change (IPCC) separate these ingredients so that each can be measured and managed.
Four linked ideas
Risk is the potential for harm. In the IPCC’s framing it results from the interaction of three things: the hazard itself, the exposure of people and assets to it, and their vulnerability.
Exposure describes who and what is in harm’s way. A city built on a low-lying delta, a farm in a drought-prone region and a road along an eroding coast are all exposed. Exposure can be measured directly, for example as the share of a population living below 5 m above sea level.
Vulnerability describes how badly those exposed are likely to be harmed. Two families can live on the same floodplain and face the same flood; the one with a raised concrete house, insurance and savings is much less vulnerable than the one in a mud-walled house with no savings. Vulnerability therefore depends on the characteristics of people and societies, not on the hazard.
Resilience is the other side of vulnerability. A resilient community absorbs a shock, recovers quickly and adapts so that the next shock does less damage. Resilience is built by the same things that reduce vulnerability: income, good housing, working institutions, social networks and knowledge.
Adaptive capacity is the part of resilience that looks forward: the resources and abilities a society has to change in advance, for example by building sea walls, changing crops or moving people away from danger. Countries with high incomes, strong governments and good education systems usually have high adaptive capacity, although a high capacity is only useful if it is used.
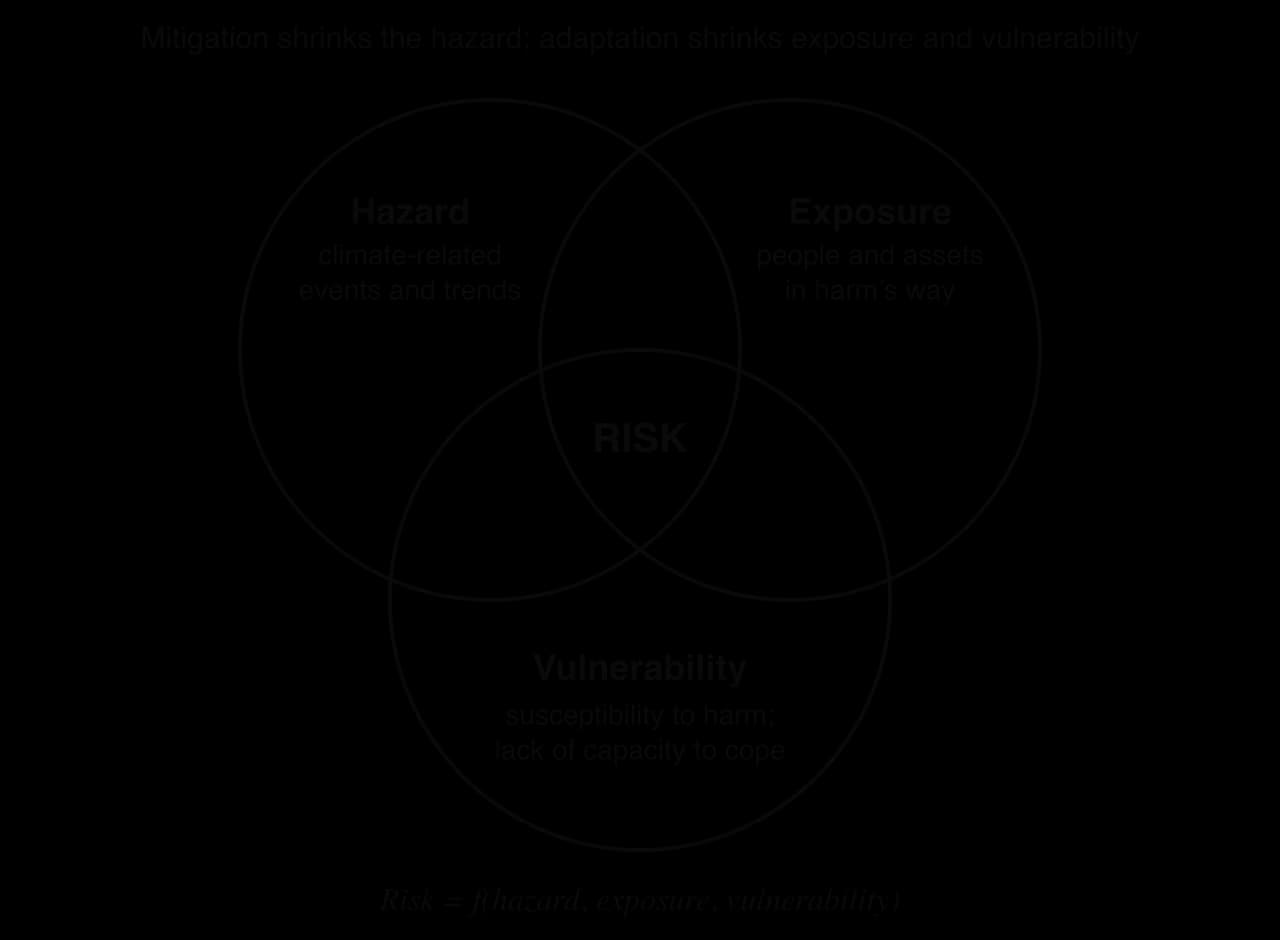
The diagram shows why risk can be reduced in three different ways. Cutting greenhouse gas emissions reduces the size of future hazards; moving people or assets out of danger reduces exposure; and raising incomes, building shelters or issuing warnings reduces vulnerability. The first is mitigation and the last two are adaptation.
Why vulnerability differs between people and places
Vulnerability varies at every scale: between countries, between regions of the same country, between neighbourhoods of the same city and even between members of the same household. Six factors explain most of the variation.

Location
Some places are exposed to several climate hazards at once. Low-lying deltas and coasts (the Ganges–Brahmaputra, Mekong and Nile deltas) face sea-level rise, storm surges and saltwater intrusion into soils and groundwater. Small island states (Tuvalu, Kiribati, the Maldives) have no high ground to retreat to. Drylands such as the Sahel face more frequent drought, and the Arctic is warming much faster than the global average. Within cities, informal settlements are often built on the most hazardous land, such as floodplains and steep slopes, because it is the only land the poorest residents can occupy.
Wealth
Wealth works at two scales. At the household scale, money buys a stronger house, savings to fall back on, insurance, air conditioning in a heatwave and the option of moving. At the national scale, a richer state can afford flood defences, early warning systems, health services and payments to people who lose their harvest. A low-income country facing the same hazard as a high-income country usually suffers more deaths, while the high-income country suffers larger economic losses because it has more valuable property exposed.
Age
Older people are most at risk in heatwaves, because the body’s ability to regulate its temperature declines with age, many have heart or lung conditions, and some live alone. The European heatwave of 2003 killed tens of thousands of people, most of them elderly. Young children are vulnerable to heat, to diarrhoeal disease after floods and to undernutrition after crop failure, and they depend on adults to evacuate.
Gender
Gender shapes vulnerability through social roles rather than biology. In many rural societies women and girls collect water and fuel, so drought lengthens their working day and can take girls out of school. Where women have less access to mobile phones, radio, cash or land titles, they receive warnings later and have fewer assets to recover with. In some past cyclones in South Asia, more women than men died, partly because cultural norms limited their movement in public and fewer had learned to swim. Men are more exposed in some settings, for example as outdoor workers in extreme heat or as migrant workers.
Education
Education helps people understand a forecast, read a warning, use a new crop variety or find work outside farming when the harvest fails. It also raises incomes over time. Literacy and access to information are therefore part of adaptive capacity, and many adaptation programmes include training as well as infrastructure.
Risk perception
Risk perception is how people judge the likelihood and seriousness of a threat, and it decides whether they act on warnings. It is shaped by experience (people who have lived through a severe flood often take the next warning seriously), culture and religion (some communities see disasters as fate), trust in authorities and scientists, and optimism bias, the tendency to believe that bad things happen to other people. In wealthy places, insurance and defences can create a false sense of security that discourages people from preparing.
Climate justice: who causes and who suffers
The sources of greenhouse gas emissions are often spatially distant from the places most affected. A tonne of carbon dioxide (CO₂) emitted in Texas, Qatar or Shanghai mixes through the whole atmosphere within about a year, so its effect is felt everywhere, including in places that emit almost nothing. This mismatch is at the heart of climate justice.
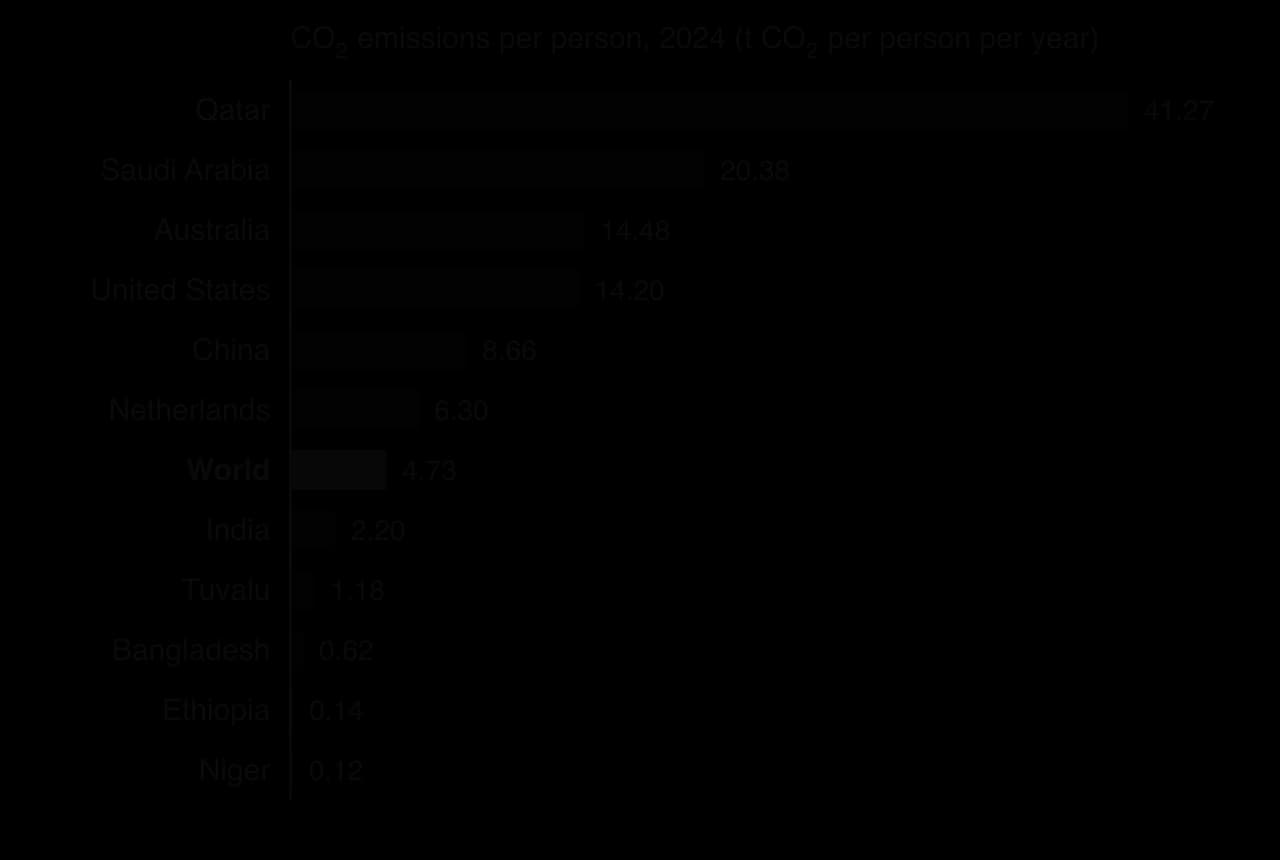
The chart measures emissions per person, which is how many smaller and poorer countries argue responsibility should be judged. Measured in total, the largest emitters are the countries with the biggest populations, led by China; measured over history since 1750, the USA and the European Union are responsible for the largest shares. Each measure supports a different political argument, so the choice between them is itself contested.
Per capita emissions and consumption-based emissions add a further layer. The Netherlands emitted 6.3 t of CO₂ per person on its own territory in 2024, but about 8.3 t per person in 2023 once the emissions embedded in imported goods are counted, because many products Dutch people consume are made elsewhere. Rich importing countries therefore look cleaner on territorial figures than they are.
Measure of responsibility | Who it points to | Who prefers it |
|---|---|---|
Total annual emissions (2024) | China 31.8%, USA 12.7%, India 8.3% | HICs that want large emerging economies to act |
Per capita emissions (2024) | Qatar 41.3 t, Saudi Arabia 20.4 t, Australia 14.5 t, USA 14.2 t; world 4.7 t | LICs, India, small island states |
Cumulative emissions since 1750 | USA 23.5%, EU-27 16.3%, China 15.4% | LICs and emerging economies that stress historic responsibility |
Consumption-based emissions (2023) | Importers such as the Netherlands (8.3 t, against 6.3 t territorial) rise; exporters such as China (7.6 t, against 8.7 t) fall | Exporting countries |
Sources: Global Carbon Budget, via Our World in Data, CO₂ emissions per capita, annual and cumulative shares, and consumption-based CO₂ per capita (accessed 2026).
Measuring vulnerability with an index
Several indices combine many indicators into one score per country. The Notre Dame Global Adaptation Initiative (ND-GAIN) index scores vulnerability (exposure, sensitivity and lack of adaptive capacity across food, water, health, ecosystems, habitat and infrastructure) and readiness (the economic, governance and social conditions for investment in adaptation). Higher vulnerability scores are worse; higher readiness scores are better.
Country | Vulnerability (0–1; high = worse) | Exposure (0–1) | Lack of adaptive capacity (0–1) | Readiness (0–1; high = better) | Overall rank of 190 |
|---|---|---|---|---|---|
Norway | 0.263 | 0.393 | 0.213 | 0.700 | 1 |
Netherlands | 0.371 | 0.464 | 0.192 | 0.659 | 21 |
Australia | 0.300 | 0.449 | 0.297 | 0.658 | 10 |
China | 0.394 | – | – | 0.455 | 61 |
Tuvalu | 0.573 | 0.631 | 0.632 | 0.450 | 117 |
Bangladesh | 0.544 | 0.567 | 0.640 | 0.284 | 160 |
Chad | 0.638 | 0.563 | 0.812 | 0.166 | 190 |
Sources: University of Notre Dame, ND-GAIN Country Index, 2026 release (data for 2024).
The table shows that the Netherlands has an exposure score (0.464) close to Bangladesh’s (0.567), yet its lack-of-capacity score is about a third as high (0.192 against 0.640). Its high readiness means that money spent on adaptation is likely to be used effectively. Chad, ranked last, is a dryland country with the weakest capacity of all, which shows that vulnerability is not only a coastal problem.
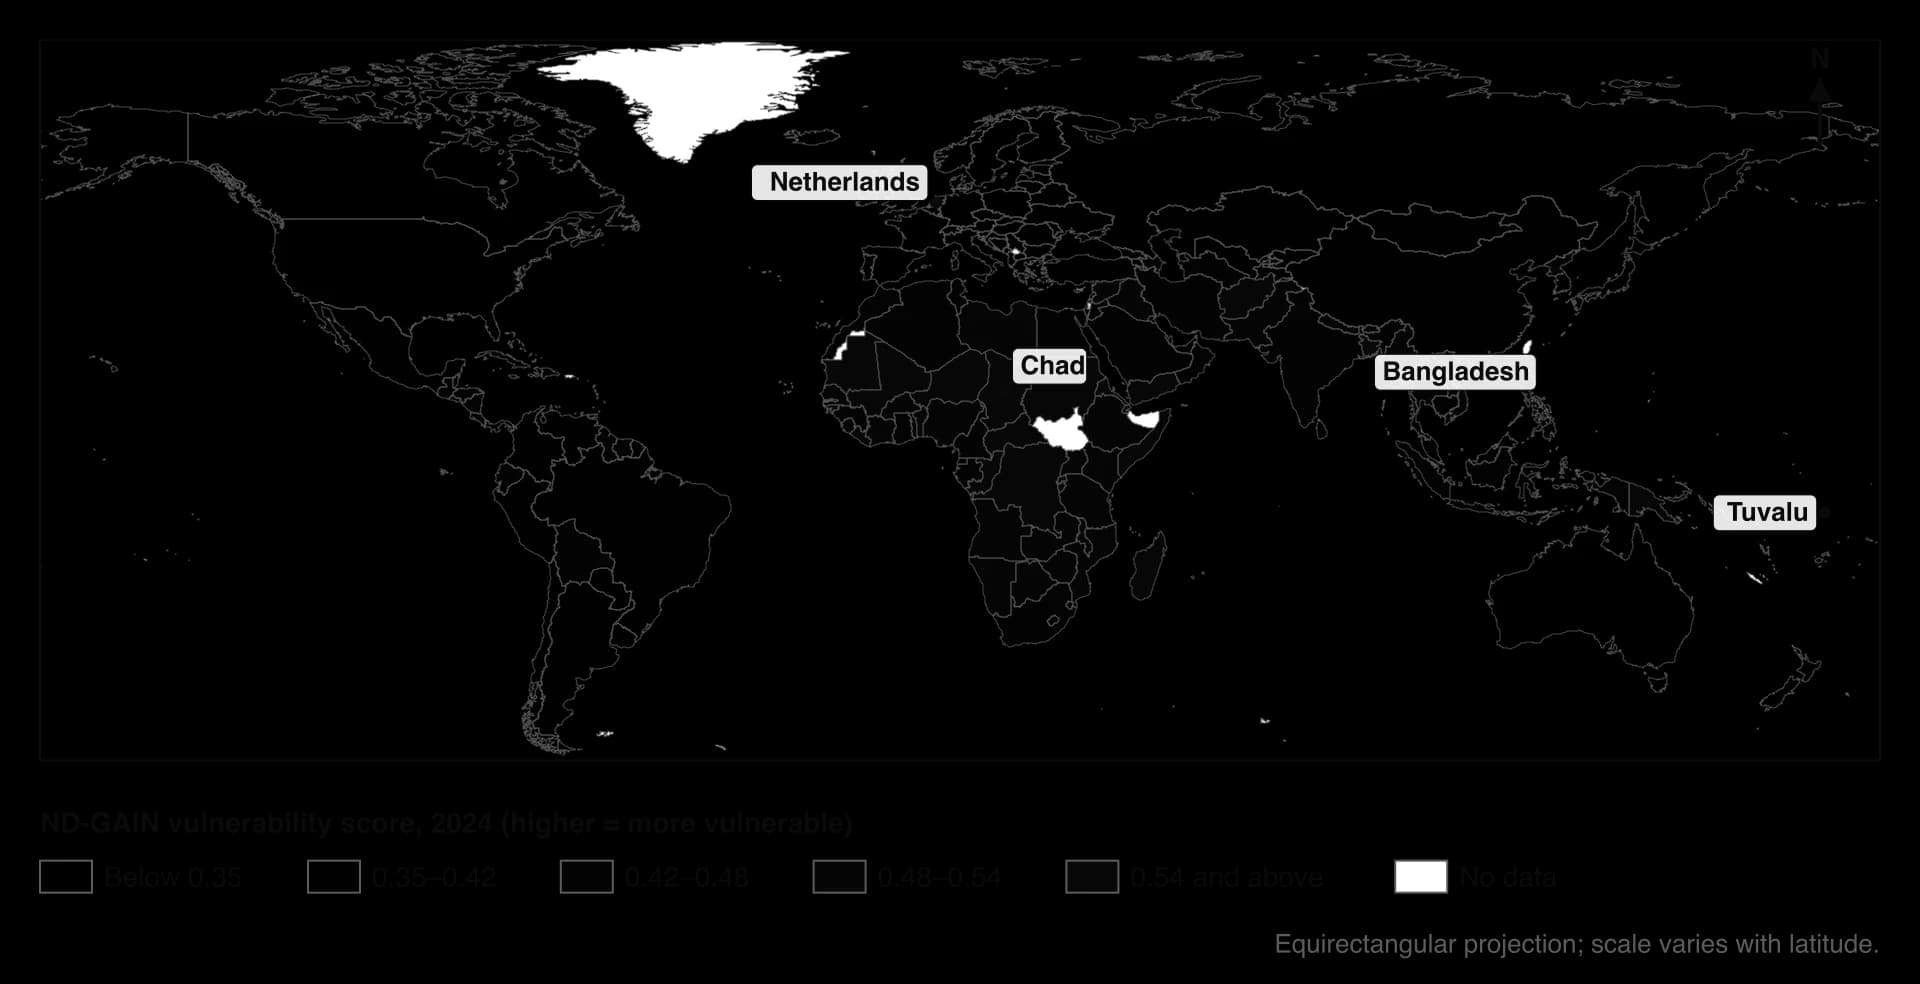
The choropleth map shows the same contrast at the global scale. Scores are highest across the Sahel, central and East Africa, Afghanistan and Bangladesh, and lowest in Europe, North America, Russia and Australia. The pattern follows income and state capacity more closely than exposure: the Netherlands and Bangladesh are both low-lying deltas, but they fall in different classes, while dry, landlocked Chad is in the darkest class.
Contrasting vulnerability: coastal Bangladesh and Tuvalu
Coastal Bangladesh and Tuvalu are both highly exposed to sea-level rise and tropical cyclones, and both emit very little. They differ in scale, in the hazards they face and in the options they have. The Netherlands provides a third point of comparison: a wealthy delta country with very high exposure but low vulnerability.
Coastal Bangladesh | Tuvalu | Netherlands | |
|---|---|---|---|
Population | About 170 million nationally; tens of millions on the coast | 10,643 (2022 census) | About 18 million |
Share of people below 5 m elevation (2015) | 8.4% | 39.3% | 53.7% |
Main hazards | Cyclones, storm surges, river floods, salinisation | Sea-level rise, king tides, storm waves, saltwater in groundwater | Storm surges, river floods, subsidence |
CO₂ per person (2024) | 0.62 t | 1.18 t | 6.30 t |
ND-GAIN rank (of 190) | 160 | 117 | 21 |
Key response | Cyclone Preparedness Programme, shelters, embankments | Land raising, migration pathway to Australia | Engineered coastal and river defences, adaptation finance |
Sources: World Bank, WDI, EN.POP.EL5M.ZS (CIESIN, 2015); Government of Tuvalu census, 2022; Global Carbon Budget via Our World in Data; ND-GAIN, 2026.
The exposure figures show that a larger share of the Netherlands’ population lives below 5 m than of Bangladesh’s or Tuvalu’s, yet the Netherlands is far less vulnerable. Exposure and vulnerability are separate, and the difference between them is mainly wealth, governance and technology.
Coastal Bangladesh: high exposure, falling vulnerability
Bangladesh occupies most of the Ganges–Brahmaputra–Meghna delta, one of the most densely populated places on Earth. Its southern coast is low and flat, faces the funnel-shaped Bay of Bengal, which concentrates storm surges, and is crossed by rivers that flood each monsoon. Higher sea levels push salt water further into rice fields and drinking-water supplies, and stronger cyclones raise surge heights. Many coastal households depend on farming, fishing and shrimp ponds, so their incomes are tied directly to the climate.
Bangladesh has nevertheless reduced cyclone deaths dramatically. Its Cyclone Preparedness Programme, set up in 1973 by the government and the Bangladesh Red Crescent Society, now has about 55,000 volunteers who spread warnings by megaphone, flag and radio and help people to shelters. When Cyclone Amphan struck in May 2020, about 2.2 million people were evacuated in Bangladesh to more than 12,000 shelters, even under COVID-19 distancing rules.
Raised multi-purpose cyclone shelters, many of them schools, embankments and mangrove belts are part of the same strategy. The programme shows that a country with limited money can reduce vulnerability through organisation, community volunteers and an early warning system, although it cannot reduce exposure to slow-onset salinisation and land loss.
Sources: Wikipedia, “Cyclone Preparedness Programme” and “Cyclone Amphan” (accessed 2026), citing the Bangladesh Ministry of Disaster Management and Relief.
Tuvalu: exposure with few options
Tuvalu is a Pacific nation of six atolls and three reef islands with a total land area of about 25 km² and a population of 10,643 in 2022. Its highest point is only 4.6 m above sea level, and most land is a narrow strip of coral sand a few hundred metres wide between a lagoon and the open ocean.
The tide gauge at Funafuti, the capital, has recorded a rise of about 3.9 mm a year, about twice the global average. Rising seas bring salt water into the shallow groundwater lens that people use for drinking and for growing pulaka (swamp taro), and storm waves can wash over whole islands, as Cyclone Bebe did in 1972.
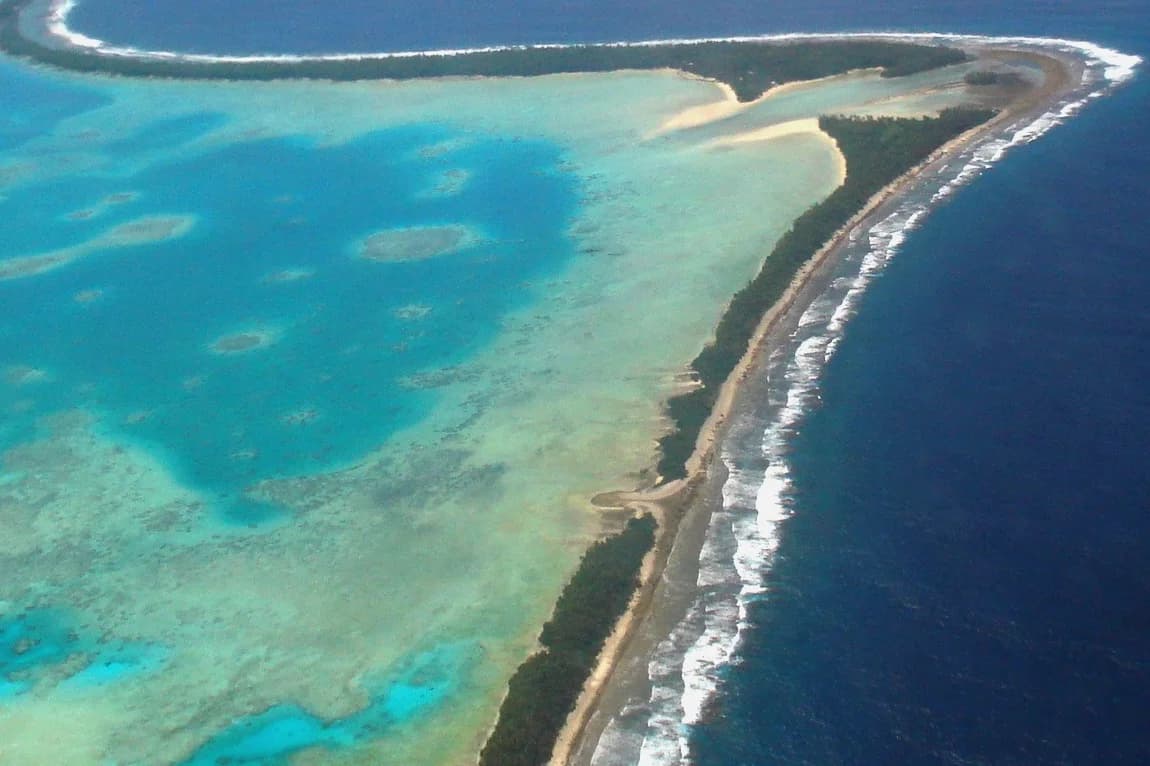
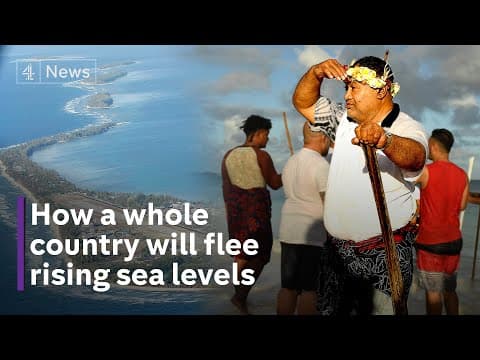
Tuvalu’s responses show how limited the options of a very small island state with few resources of its own are. The Tuvalu Coastal Adaptation Project, funded by the Green Climate Fund and Australia, began reclaiming a 7.8 ha raised platform on Funafuti in December 2022, designed to stay above sea level and storm waves beyond 2100. Under the Falepili Union treaty, signed with Australia on 10 November 2023, up to 280 Tuvaluans a year may migrate to Australia, which makes migration a planned form of adaptation rather than an emergency.
Tuvalu has also announced a digital copy of the country in the metaverse to preserve its culture if the islands become uninhabitable. Research complicates the picture: a 2018 study found that 75% of Tuvalu’s islands grew in area between 1971 and 2014 as waves moved sand, although the government points out that this does not create safe, habitable land or protect groundwater.
Sources: Wikipedia, “Tuvalu” (accessed 2026), citing the 2022 census, the Green Climate Fund and Kench et al. (2018), Nature Communications.
 YouTube
The comparison shows that vulnerability is not fixed. Bangladesh has reduced it through organisation, while Tuvalu’s exposure is so complete that its realistic options include leaving. Both depend on decisions taken by high emitters elsewhere, which links them directly to the debate over climate justice.
Mitigation and adaptation
Every response to climate change belongs to one of two families. Mitigation tackles the cause by reducing the amount of greenhouse gas in the atmosphere. Adaptation tackles the effects by reducing the harm that a changing climate does. Both are needed, because even if emissions stopped tomorrow, the gases already emitted would keep the planet warmer for centuries and sea level would go on rising.
Examples of mitigation are building wind farms, insulating homes, protecting forests that act as a carbon sink and putting a price on carbon. Examples of adaptation are raising sea walls, planting drought-tolerant crops and issuing heatwave warnings.
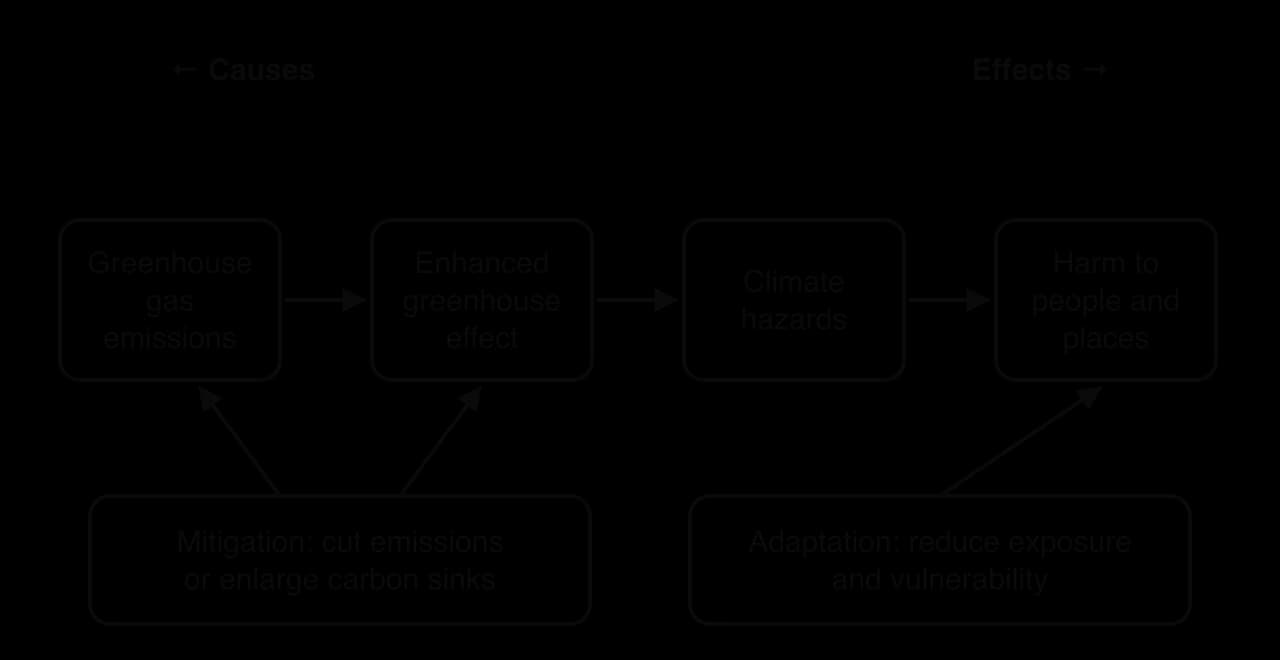
The diagram shows the logic of the two families. Mitigation works on the enhanced greenhouse effect itself, so its benefits are global and are felt mainly in the future. Adaptation works on the local consequences, so its benefits are felt in the place where it happens, often within a few years. This difference in scale and timing explains why countries find adaptation easier to agree on and to fund: those who pay for it receive its benefits directly.
Scale | Mitigation (reducing causes) | Adaptation (reducing effects) |
|---|---|---|
Global | Paris Agreement targets; international carbon markets; methane pledges | Adaptation finance through the Green Climate Fund; the loss and damage fund |
National | Renewable energy targets (China’s solar and wind build-out); coal phase-out (the UK closed its last coal power station in 2024); carbon taxes and emissions trading | Heat action plans (Ahmedabad, India, from 2013); national adaptation plans; drought-resistant crop programmes |
Local | Public transport and cycling schemes; building insulation; community energy co-operatives | Sea walls and raised houses; managed retreat; cyclone shelters; urban green space to cool streets |
Individual | Less flying, lower meat consumption, heat pumps, electric vehicles | Insurance; changing crops or planting dates; storing water |
Some actions do both. Planting mangroves along a coast stores carbon (mitigation) and absorbs wave energy (adaptation); urban trees cool streets and take up CO₂. Such co-benefits make a strategy easier to justify, because its value does not depend on one outcome alone.
Adaptation strategies in more detail
Hard engineering: sea walls, raised embankments and storm surge barriers reduce exposure, but are expensive, need maintenance and can encourage more building behind them.
Managed retreat: moving people, buildings and infrastructure away from hazardous land. It is permanent and avoids the cost of defending land that will eventually be lost, but it is politically difficult because it means abandoning homes, farms and places with deep cultural meaning.
Agricultural change: drought- and salt-tolerant crop varieties (salt-tolerant rice in coastal Bangladesh), drip irrigation, changed planting dates and crop insurance.
Early warning and preparation: forecasts, warning networks and shelters (Bangladesh), and heat action plans that open cooling centres and change working hours during heatwaves.
Ecosystem-based adaptation: restoring wetlands, mangroves and forests to absorb floods and storm waves, often with mitigation co-benefits.
Global geopolitical efforts
Because greenhouse gases mix through the whole atmosphere, no country can solve the problem alone, and every country benefits from cuts made by others. Climate change is therefore a global commons problem, and the response has been built through international negotiation under the United Nations.
The UNFCCC and the Kyoto Protocol
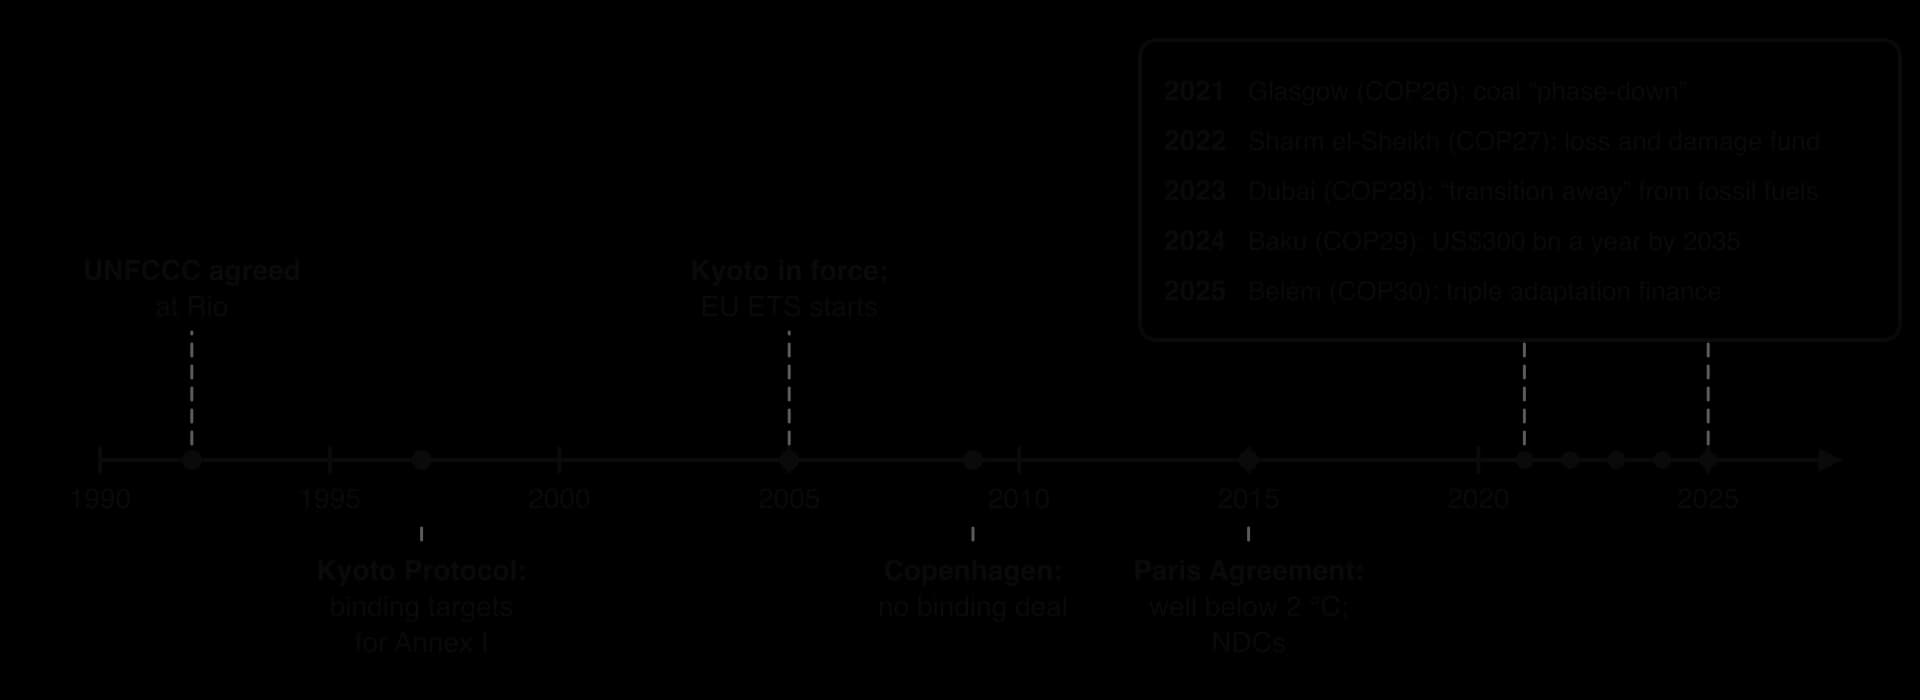
The United Nations Framework Convention on Climate Change (UNFCCC) was agreed at the Earth Summit in Rio de Janeiro in 1992. It set the aim of stabilising greenhouse gas concentrations at a level that would prevent “dangerous” interference with the climate, and the principle of common but differentiated responsibilities: all countries share the problem, but richer countries that had emitted most should act first. Its members meet each year at a Conference of the Parties (COP).
The Kyoto Protocol of 1997 was the first agreement with binding targets. Only the industrialised countries listed in Annex I had to cut emissions, on average by about 5% below 1990 levels in 2008–2012, and they could meet part of their targets through emissions trading and offset projects in developing countries. The USA signed but never ratified it, Canada withdrew in 2011, and fast-growing emitters such as China and India had no targets. Although the 36 countries that took part met their targets, global greenhouse gas emissions rose by 32% between 1990 and 2010.
The Copenhagen summit of 2009 was meant to agree a successor but ended with only a short, non-binding accord. Its failure showed the main obstacles: emerging economies refused binding limits on their development, the USA would not accept targets that excluded China, and poorer countries demanded finance.
The Paris Agreement
The Paris Agreement, adopted at COP21 in December 2015, took a different approach. Instead of targets imposed from above, every country sets its own pledge, a nationally determined contribution (NDC), and must submit a new, more ambitious one every five years. A global stocktake (the first in 2023) checks collective progress, and the cycle is meant to work as a ratchet, raising ambition over time. The long-term goal is to hold warming “well below 2 °C” above pre-industrial levels and to pursue efforts to limit it to 1.5 °C, with net zero emissions soon after mid-century.
National pledges are the core of the system. The EU’s NDC, for example, commits it to cutting net emissions by at least 55% below 1990 levels by 2030, while many LICs make part of their pledge conditional on receiving international finance.
The agreement’s strength is its near-universal membership: 194 parties had joined by January 2026. Its weakness is that the NDCs themselves are not legally binding and there is no penalty for missing them. The first global stocktake found that expected warming by 2100 had fallen from 3.7–4.8 °C (as projected in 2010) to about 2.4–2.6 °C under the pledges in place by 2022, but that the world remains far from 1.5 °C. In 2024 the global average temperature exceeded 1.5 °C above pre-industrial levels for the first time in a single year.
The USA shows how vulnerable the agreement is to national politics. It withdrew under President Trump in November 2020, rejoined under President Biden in 2021, and withdrew again by an executive order signed on 20 January 2025, which took effect on 27 January 2026. The withdrawal of the world’s largest historic emitter weakens trust and finance, although many US states, cities and companies continue their own policies.
Recent COPs: finance, fossil fuels and loss and damage
Since 2021, negotiations have focused on three questions: how fast to move away from fossil fuels, how much rich countries should pay, and who compensates for damage that adaptation cannot prevent.
COP26, Glasgow (2021): countries agreed to “phase down” unabated coal power, weakened from “phase out” at the last minute after objections led by India and China.
COP27, Sharm el-Sheikh (2022): agreement to create a fund for loss and damage, a long-standing demand of small island states and LICs. It was made operational on the first day of COP28 in 2023, with initial pledges of about US$430 million.
COP28, Dubai (2023): the first COP text to call on countries to “transition away from fossil fuels in energy systems” in a just, orderly and equitable manner, together with a goal to triple renewable energy capacity by 2030.
COP29, Baku (2024): a new finance goal of at least US$300 billion a year by 2035 from developed to developing countries, criticised by poorer countries that had asked for far more, and rules for an international carbon market under Article 6 of the Paris Agreement.
COP30, Belém (2025): held in the Brazilian Amazon; agreed to triple adaptation finance by 2035 and adopted indicators to track adaptation, but oil-producing countries blocked any roadmap for phasing out fossil fuels in the official text.
Negotiating blocs
Countries negotiate in groups whose positions reflect their exposure, wealth and dependence on fossil fuels.
The Alliance of Small Island States (AOSIS), which includes Tuvalu and the Maldives, pushes hardest for the 1.5 °C goal and for loss and damage finance. The Least Developed Countries group seeks adaptation finance and technology. The BASIC group (Brazil, South Africa, India and China) defends the right of emerging economies to develop and stresses historic responsibility. Oil exporters, many of them members of the Organization of the Petroleum Exporting Countries (OPEC), resist language on phasing out fossil fuels. The European Union usually presses for high ambition but also wants large emerging emitters to take on more responsibility.
Why agreement is so difficult
The free-rider problem: every country gains from cuts made by others whether or not it cuts its own emissions, so each has an incentive to wait.
Distance between causes and effects: the largest emitters (China, the USA, the EU) are not the most vulnerable, while the most vulnerable (Tuvalu, Bangladesh, Chad) have little power to change global emissions.
Equity and development: emerging economies argue that HICs grew rich by burning fossil fuels and should not now deny that path to others without paying for alternatives.
Time: the costs of mitigation are paid now by voters, while most benefits come decades later to people who cannot vote today.
Economic interests: fossil-fuel exporters and fossil-fuel industries have strong reasons to slow the transition, and at COP29 at least 1,773 fossil-fuel lobbyists were registered.
Sources: Kick Big Polluters Out, analysis of the COP29 participant list, 2024.
Evaluating global agreements
Strengths | Limitations |
|---|---|
Near-universal participation under Paris, including China and India | Pledges are voluntary and, added together, still lead to about 2.4–2.6 °C of warming |
Projected warming has fallen since 2010 | Global CO₂ emissions reached a record of about 38.6 billion tonnes in 2024 |
New funds for adaptation and loss and damage | Finance pledges are small compared with estimated needs, and some are loans |
COP28 named fossil fuels for the first time | Oil producers blocked a fossil-fuel roadmap at COP30 |
Five-yearly ratchet and global stocktake create pressure to raise ambition | National politics can reverse commitments, as the US withdrawals show |
On balance, the UN process has changed the direction of travel more than the speed. It created shared targets, transparency rules and finance channels that did not exist in 1992, and most large emitters now have a net zero target. However, it works by consensus, so the least ambitious large emitters can slow it down, and it has no means of enforcing pledges. Its effectiveness therefore depends on national governments, courts, businesses and citizens turning pledges into action, which is where much of the pressure now comes from.
Carbon offsetting, carbon trading and carbon taxes
Governments use markets and prices to cut emissions where it is cheapest to do so. The idea is that putting a price on carbon makes polluting more expensive than cleaner alternatives, so firms and households change their behaviour without the state having to specify how.
Carbon offsetting
Carbon offsetting means paying for a reduction or removal of emissions somewhere else to compensate for one’s own. A company or airline passenger buys carbon credits, each representing one tonne of CO₂e avoided or removed, from projects such as protecting a forest that would otherwise be cleared, distributing efficient cookstoves in East Africa or capturing methane from landfill.
Offsetting can channel money to projects in LICs, but it raises three problems. Additionality: would the forest have been protected anyway? If so, the credit represents no real reduction. Permanence: a forest protected today may burn or be cleared in twenty years, releasing the carbon. Verification: reductions are hard to measure, and investigations into forest-protection credits certified by Verra, the largest standard-setter in the voluntary market, have alleged that many credits overstated the emissions avoided. Critics also argue that offsets let rich emitters keep polluting instead of cutting their own emissions.
Carbon trading and cap and trade
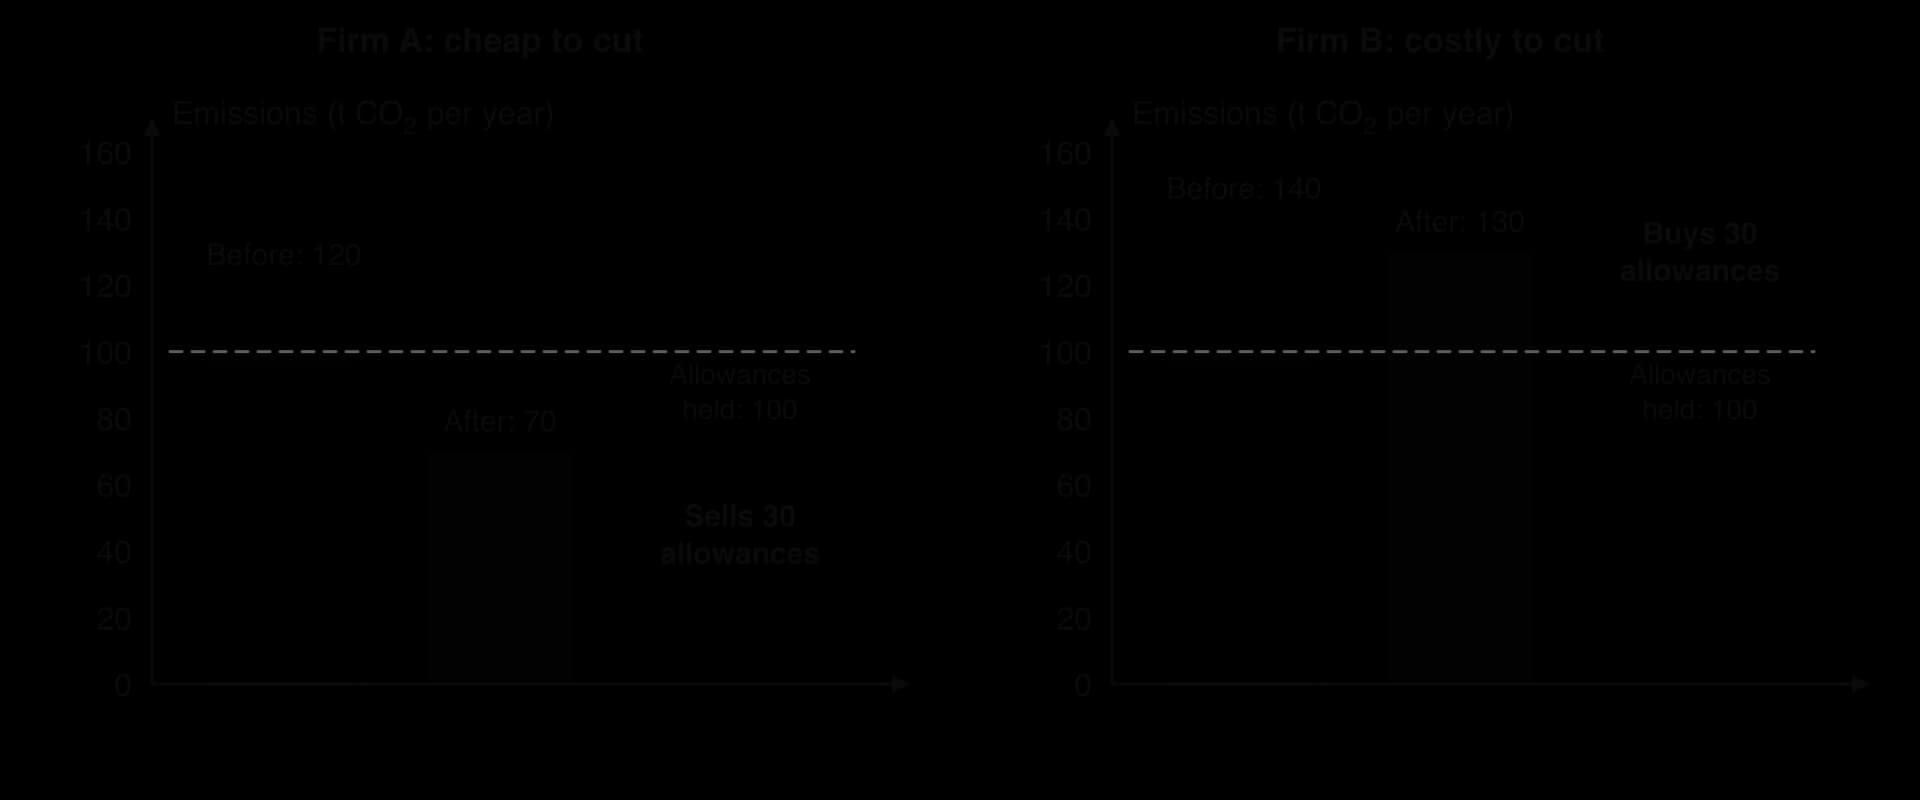
Carbon trading (emissions trading) works through a government-set limit. Under cap and trade, the authority sets a cap on the total emissions allowed from the sectors covered and issues that number of allowances (permits), each allowing one tonne of CO₂. Firms must surrender one allowance for every tonne they emit. A firm that can cut emissions cheaply does so and sells its spare allowances; a firm for which cutting is expensive buys them. Each year the cap is lowered, so total emissions fall and allowances become scarcer and more valuable.
Cap and trade is the most common design of carbon trading, used in the EU, China, California and the UK.
The EU Emissions Trading System
The EU Emissions Trading System (EU ETS), launched in 2005, is the largest carbon market in the world. It covers power stations, heavy industry and flights within Europe in the 27 EU states plus Iceland, Liechtenstein and Norway, about 40% of the EU’s greenhouse gas emissions. Its early years showed the dangers of a weak cap.
In the first phase, too many free allowances were issued and the price fell from about €30 per tonne in 2006 to almost zero in 2007. Reforms since 2013 introduced more auctioning, a Market Stability Reserve that removes surplus allowances, and a faster-falling cap (2.2% a year from 2021). Prices rose to about €97 per tonne in early 2022.
Emissions in the sectors covered by the EU ETS fell by about 50% between 2005 and 2025, compared with about 20% in sectors outside it, although studies attribute only part of this fall to the carbon price itself; the shift from coal to gas and renewables and the 2008 financial crisis also played a part.
Auction revenue, worth tens of billions of euros a year in the 2020s, has been spent largely on energy and transport projects. A second system covering road transport and buildings is planned from 2027. China launched its own national ETS in 2021, covering the power sector, which made it the largest scheme by emissions covered, although its permits are based on emissions per unit of output rather than an absolute cap.
 YouTube
Carbon taxes
A carbon tax is the main alternative to trading. Instead of fixing the quantity of emissions and letting the price vary, it fixes the price and lets the quantity vary. Sweden introduced one of the first carbon taxes in 1991, and the Netherlands introduced a carbon levy on industry in 2021, starting at €30 per tonne and designed to rise every year to 2030.
Carbon trading (cap and trade) | Carbon tax | |
|---|---|---|
What is fixed | The quantity of emissions (the cap) | The price per tonne |
Certainty | The environmental outcome is certain; the price is not | The price is certain; the emissions cut is not |
Strengths | Cuts made where cheapest; cap can tighten each year; can link across countries | Simple to run; predictable for investors; raises steady revenue |
Limitations | Prices can collapse if the cap is too loose (EU ETS 2007); free allowances and lobbying | Politically unpopular; can be regressive, hitting poorer households hardest unless revenue is returned |
Shared risk | Carbon leakage: industry moving to countries without a carbon price | Carbon leakage, addressed in the EU by a border carbon adjustment from 2026 |
Both instruments make polluters pay and both depend on the price being high enough. Whether a price is fair depends on who carries it: fuel taxes fall most heavily on rural and low-income households, which is why some schemes return revenue as payments to citizens. A carbon price is most effective when it is combined with regulation and investment, because some emissions, such as those from cement, are expensive to cut at almost any carbon price.
Technology: renewables, carbon capture and geoengineering
Technology is central to every mitigation pathway. Some technologies are mature and spreading fast; others are expensive, unproven at scale or controversial.
Renewables, efficiency and electric vehicles
Renewable energy, especially solar and wind power, is the main means of cutting emissions from electricity. Costs have fallen so far that new solar and wind are now the cheapest sources of electricity in most of the world. Electric vehicles, heat pumps and better insulation cut emissions further by replacing the burning of fossil fuels in transport and buildings with electricity. These technologies reduce emissions without harming living standards, but they need large investment in grids and storage, and they depend on minerals such as lithium, cobalt and copper whose mining has its own environmental and social costs.
Carbon capture and storage
Carbon capture and storage (CCS) captures CO₂ from a power station, cement works or other industrial plant, compresses it and stores it deep underground, usually in porous rock such as a saline aquifer or a depleted gas field. The first large project began at Norway’s Sleipner gas field in 1996. By July 2024, 44 commercial CCS plants were operating worldwide, but together they captured only about one-thousandth of global greenhouse gas emissions, and about 70% of the projects proposed for 2020 were never built.
CCS is valuable for industries that have few other ways to cut emissions, such as cement and steel. Critics point out that most capacity is linked to the oil and gas industry, that some captured CO₂ is used to push more oil out of the ground, and that the promise of future CCS can be used to justify continued fossil-fuel use.
Geoengineering
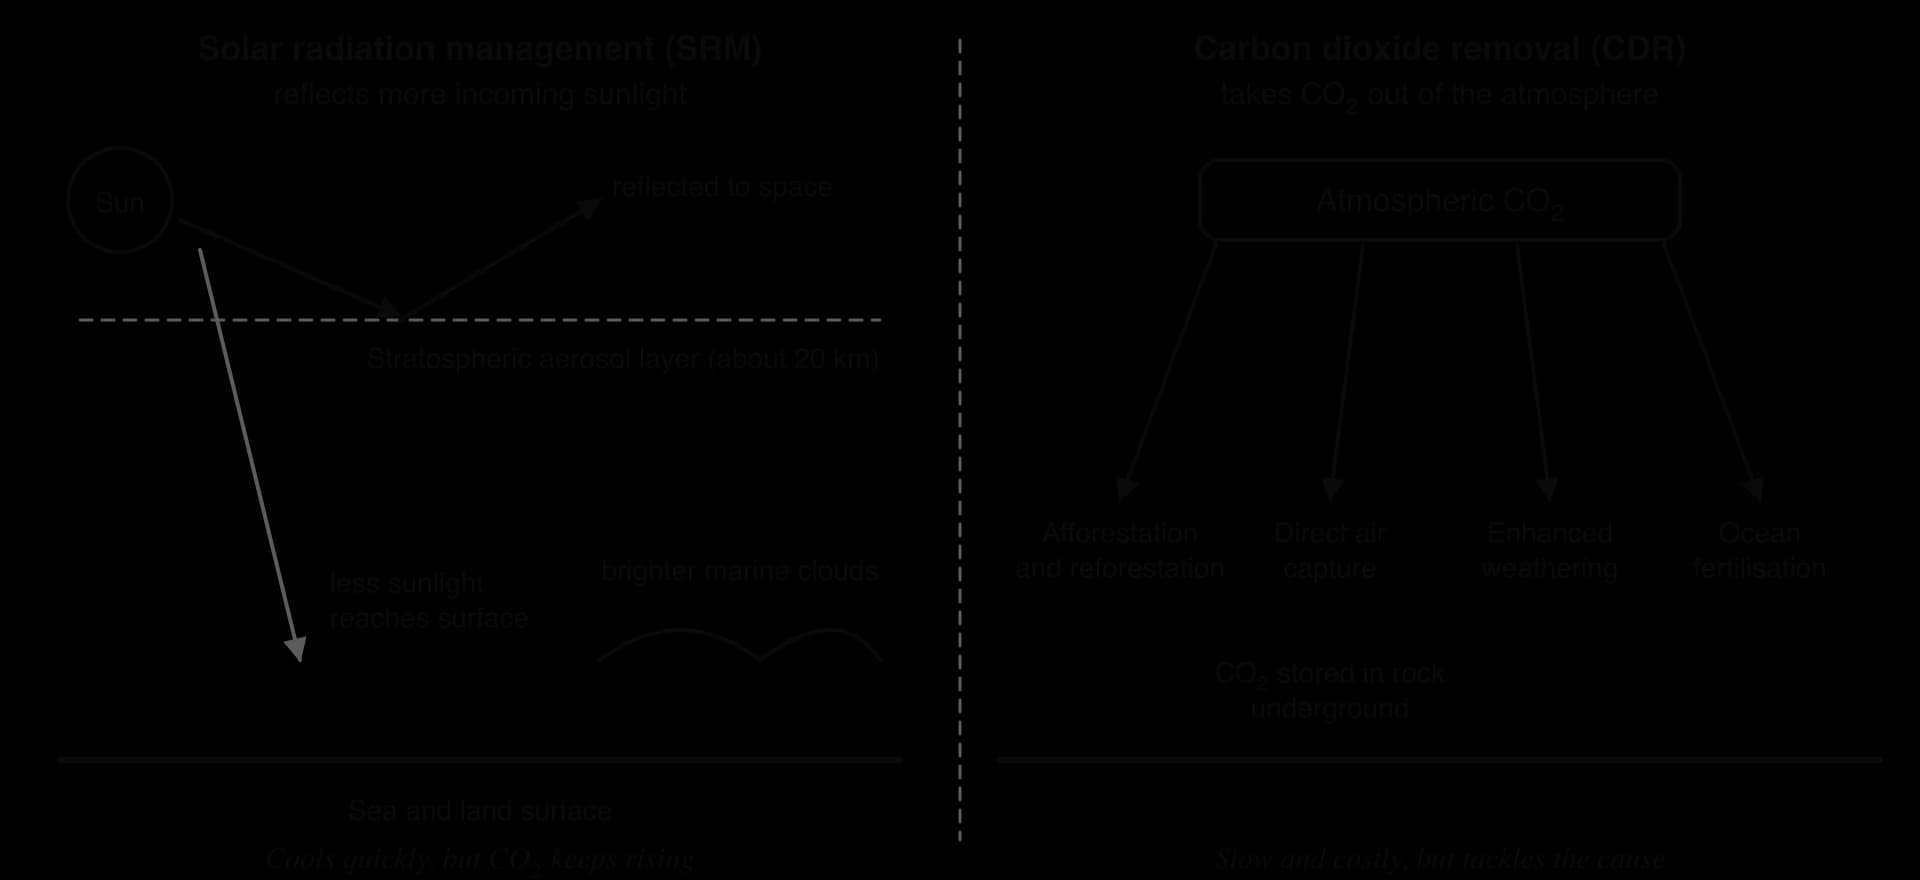
Geoengineering (sometimes written “geo-engineering”) is the deliberate, large-scale intervention in the Earth’s climate system to counter climate change. It falls into two families with very different risks.
Carbon dioxide removal
Carbon dioxide removal (CDR) takes CO₂ out of the atmosphere and stores it. Afforestation and reforestation store carbon in trees and soils, cheaply but on a large area of land and at risk from fire. Direct air capture uses machines with chemical filters to remove CO₂ from ordinary air; in Iceland, Climeworks’ Mammoth plant, opened in May 2024, can capture up to 36,000 t a year and store it as rock in basalt underground. Enhanced weathering spreads crushed silicate rock on farmland to speed up the natural reaction that locks CO₂ into minerals. Ocean fertilisation adds iron to stimulate plankton growth, but its effects on marine ecosystems are poorly understood.
Solar radiation management
Solar radiation management (SRM) would cool the planet by reflecting a little more sunlight back to space. The most studied method is stratospheric aerosol injection, which would spray sulphate or other reflective particles into the stratosphere. It is inspired by large volcanic eruptions: after Mount Pinatubo in the Philippines erupted in 1991, the sulphur it released lowered global temperatures by about 0.5 °C for about two years. Marine cloud brightening would spray sea salt into low clouds over the oceans to make them more reflective.
SRM could lower temperatures quickly and cheaply compared with cutting emissions, which is why some scientists argue that it should at least be researched.
Its risks are serious. It would not stop ocean acidification, because CO₂ would keep rising. It could change rainfall patterns, possibly weakening monsoons on which billions of people depend. If it were stopped suddenly, temperatures could rise rapidly, a danger called termination shock. And it raises a problem of governance: one country or even one company could change the climate of the whole planet. Mexico announced in 2023 that it would ban SRM experiments after a start-up released sulphur dioxide balloons there without permission.
Both families also raise moral hazard, the worry that the promise of a technological fix will reduce the political pressure to cut emissions. The evidence for this effect is contested, but it is one reason why many climate scientists see geoengineering as a possible supplement to deep emissions cuts, never a substitute for them.
Technology | Type | Strengths | Limitations and risks |
|---|---|---|---|
Solar and wind power | Mitigation | Cheapest new electricity in most places; mature; fast to build | Variable output needs storage and grids; mineral supply chains |
CCS | Mitigation | Cuts emissions from cement and steel; uses existing geology | Expensive; tiny scale so far; linked to continued fossil-fuel use |
Afforestation | CDR | Cheap; co-benefits for biodiversity and flooding | Needs vast land, competes with food; carbon lost if forests burn |
Direct air capture | CDR | Permanent storage in rock; measurable | Very expensive and energy-intensive; removes seconds of global emissions |
Stratospheric aerosols | SRM | Fast and relatively cheap cooling | Rainfall changes, termination shock, no effect on acidification, no global governance |
Civil society strategies
Governments are not the only actors in the response to climate change. Much of the pressure for stronger action has come from civil society: people and organisations acting outside both government and business.
A non-governmental organisation (NGO) is a formally organised, not-for-profit group within civil society. Climate NGOs range from large international organisations such as Greenpeace, WWF and Friends of the Earth to small national ones such as Urgenda in the Netherlands. All are stakeholders in climate policy, alongside governments, businesses, scientists and citizens.
Different stakeholders have different amounts of power over climate decisions. A national government can pass laws, a large company controls investment, and an NGO can mobilise public opinion or go to court, while a farmer in Chad or a fisher in Tuvalu usually has little direct influence.
Campaigning and protest
Protest raises public awareness and puts issues on the political agenda. Fridays for Future began when the Swedish student Greta Thunberg sat outside the Swedish parliament from 20 August 2018 with a sign reading “school strike for the climate”. The movement spread quickly: about 4 million people joined the strikes of 20 September 2019, including 1.4 million in Germany. Extinction Rebellion, founded in the UK in 2018, uses non-violent civil disobedience such as blocking roads and bridges. Its disruption brought attention but also opposition: in a national poll in October 2019, 54% of British adults opposed its tactic of disrupting public transport.
Sources: Fridays for Future and Extinction Rebellion figures: Wikipedia, “School Strike for Climate” and “Extinction Rebellion” (accessed 2026), citing YouGov, October 2019.
Litigation
Climate litigation uses the courts to force governments and companies to act. The landmark case is Urgenda’s case against the Dutch state, which led to similar cases in Belgium, France, Ireland, Germany, New Zealand, the UK, Switzerland and Norway.
In April 2024, in Verein KlimaSeniorinnen Schweiz v Switzerland, brought by an association of older Swiss women who argued that heatwaves threatened their health, the European Court of Human Rights ruled that Switzerland had violated the European Convention on Human Rights by failing to act adequately on climate change. It was the first time an international court had found that state inaction on climate change breached human rights.
Divestment and finance
Divestment campaigns ask universities, churches, pension funds and cities to sell their shares in fossil-fuel companies. By July 2023, more than 1,590 institutions with assets of over US$40 trillion had committed to some form of fossil-fuel divestment. Supporters argue that divestment removes the social licence of the fossil-fuel industry and moves capital to clean energy; critics argue that the shares are simply bought by other investors, so the company’s emissions do not change.
Community action and citizen science
At the local scale, community energy co-operatives install solar panels and wind turbines owned by residents, and local groups plant trees, restore wetlands or run repair cafés. Citizen science projects involve volunteers in recording temperatures, flood levels, bird migrations or flowering dates, which adds to the evidence on which policy is based and builds public understanding. Faith groups and trade unions add moral and economic arguments, for example for a just transition that protects coal miners’ and oil workers’ jobs.
Civil society strategy | Example | Strength | Limitation |
|---|---|---|---|
Protest and campaigning | Fridays for Future (from 2018); Extinction Rebellion (from 2018) | Raises awareness; pressures politicians before elections | Can provoke a backlash; awareness does not guarantee policy change |
Litigation | Urgenda v Netherlands (2019); KlimaSeniorinnen v Switzerland (2024) | Court orders are binding; creates legal duties | Slow and costly; courts can be overturned or ignored |
Divestment | More than 1,590 institutions by 2023 | Shifts investment; stigmatises fossil fuels | Shares are bought by others; emissions may not fall |
Community energy and citizen science | Local solar co-operatives; volunteer weather and flood monitoring | Local ownership and knowledge; builds support | Small scale compared with national emissions |
Corporate strategies
Businesses produce most of the world’s goods, energy and emissions, so their choices matter. Many large companies now present climate action as part of corporate social responsibility (CSR), the idea that a firm has duties to society and the environment as well as to its shareholders.
What companies do
Net zero pledges: targets to balance remaining emissions with removals by a set date, often 2040 or 2050. Microsoft pledged in 2020 to become carbon negative by 2030.
Science-based targets: emissions cuts in line with the Paris goals, checked by the Science Based Targets initiative (SBTi), which more than 10,000 companies had joined or committed to by 2025.
Renewable power purchasing: long-term contracts to buy wind and solar electricity; members of the RE100 initiative commit to 100% renewable electricity.
Supply-chain decarbonisation: pressuring suppliers to cut their emissions, which is important because most of a company’s footprint often lies in its supply chain (scope 3 emissions).
Disclosure: reporting emissions and climate risks to investors, increasingly required by law in the EU and elsewhere.
Greenwashing
The main criticism of corporate climate action is greenwashing, when a company presents itself as more environmentally friendly than it is. Typical forms are vague slogans, focusing on a small green product line while expanding fossil-fuel activities, and relying on cheap offsets of doubtful quality. In 2024 a Dutch court ruled that 15 of 19 environmental claims made by the airline KLM, including that it was on its way to “a more sustainable future”, were misleading and therefore unlawful.
Microsoft shows a subtler problem: despite its pledge and heavy spending on carbon removal, its total emissions rose by 29% between 2020 and 2023, mainly because of the construction of data centres.
Insurers and investors
The insurance industry is a stakeholder with unusual power, because it prices risk. As losses from storms, floods and wildfires rise, insurers raise premiums or stop covering high-risk areas, which sends a strong signal about where it is safe to build but can leave households uninsured. Large insurers and pension funds are also major investors, and some have stopped insuring or financing new coal projects.
Why perspectives on action differ
Almost every government accepts the scientific evidence that human activity is warming the planet, yet stakeholders disagree strongly about how much action is needed, how practical it is and how urgent it is. The differences come from where they are, what they own and whom they represent.
Stakeholder | Typical perspective | Why |
|---|---|---|
Small island states (Tuvalu, the Maldives) | Action is urgent; 1.5 °C is a matter of survival | Extreme exposure, tiny emissions, few adaptation options |
LICs (Chad, Niger) | Rich countries must cut first and pay for adaptation and loss and damage | Low historic emissions, high vulnerability, development needs |
Emerging economies (India, China) | Act, but at a pace that allows development; HICs bear historic responsibility | Large total but moderate per capita emissions; millions still in poverty |
HICs (EU, UK) | Ambitious targets, but large emitters must also act | High capacity, public pressure, but concern about competitiveness |
Fossil-fuel exporters (Saudi Arabia, Qatar, Russia) | Slow transition; emphasise CCS and “unabated” wording | Economies and budgets depend on oil and gas exports |
Fossil-fuel companies | Gradual change; policy should target consumers and governments | Assets and profits at stake |
Young people and future generations | Most urgent; they will live longest with the consequences | Intergenerational equity |
Farmers (Dutch farmers’ protests from 2019) | Cuts must not destroy rural livelihoods | Nitrogen and emissions rules threaten herd sizes and incomes |
Framing shapes these positions. A country that measures responsibility per person (India, at about 2.2 t of CO₂ per person in 2024) sees itself as a small emitter; one that measures totals sees India as the world’s third-largest emitter. Time horizons also differ: a government facing an election in two years weighs the costs of action, which come now, against benefits that arrive over decades. Practicality is judged differently too: renewable energy is cheap and practical for a sunny HIC with a strong grid, but a country without a grid, capital or skills cannot switch so easily.
There are also people who doubt the need for action. Organised doubt about climate science, often funded by fossil-fuel interests, was strong in the 1990s and 2000s; today the debate centres more on the cost, pace and fairness of action than on the science. The scientific consensus, summarised by the IPCC, is that human influence has unequivocally warmed the climate.
Case study: non-governmental stakeholders in the Netherlands
Context: a delta nation with high emissions
The Netherlands is a high-income country of about 18 million people on the deltas of the Rhine, Meuse and Scheldt. About 53.7% of its population lives below 5 m above sea level, so it is extremely exposed to sea-level rise and river floods. It is also a large emitter for its size.
Its greenhouse gas emissions were about 9.7 t of CO₂e per person in 2022, among the highest in the EU, because of its energy-intensive industry (the Port of Rotterdam’s refineries and the steelworks at IJmuiden), its large dairy and livestock sector and decades of burning its own natural gas from the Groningen field. Its exposure means it has strong reasons to want global action; its emissions mean it is also part of the problem.
In the 2010s the Dutch government weakened its climate targets. Before 2010 it had planned a 30% cut on 1990 levels by 2020; after 2010 it expected only 14–17%. This gap between the science and government policy is what non-governmental stakeholders set out to close.
Urgenda and the state
Urgenda is a Dutch NGO founded in 2008. In September 2013, acting with 886 citizens, it sued the Dutch state, arguing that by failing to cut emissions fast enough the government was breaching its duty of care to its citizens and their human rights under the European Convention on Human Rights.
Date | Event |
|---|---|
September 2013 | Urgenda and 886 citizens sue the State of the Netherlands |
June 2015 | The District Court in The Hague orders the state to cut emissions by at least 25% below 1990 levels by 2020 |
October 2018 | The Court of Appeal upholds the order, citing the right to life and to private and family life |
20 December 2019 | The Supreme Court rejects the state’s final appeal: the order is binding |
2019–2020 | Climate Act (May 2019) sets a 49% cut by 2030; Hemweg coal plant in Amsterdam closed in 2020, four years early |
February 2022 | Statistics Netherlands (CBS) reports that 2020 emissions were 25.5% below 1990: the target was met |
The Supreme Court rejected the state’s argument that the Netherlands’ share of global emissions was too small to matter, ruling that “no reduction is negligible” and that each country is responsible for its own share. The ruling made Urgenda the first successful case in which citizens forced a government to strengthen its climate policy on human-rights grounds.
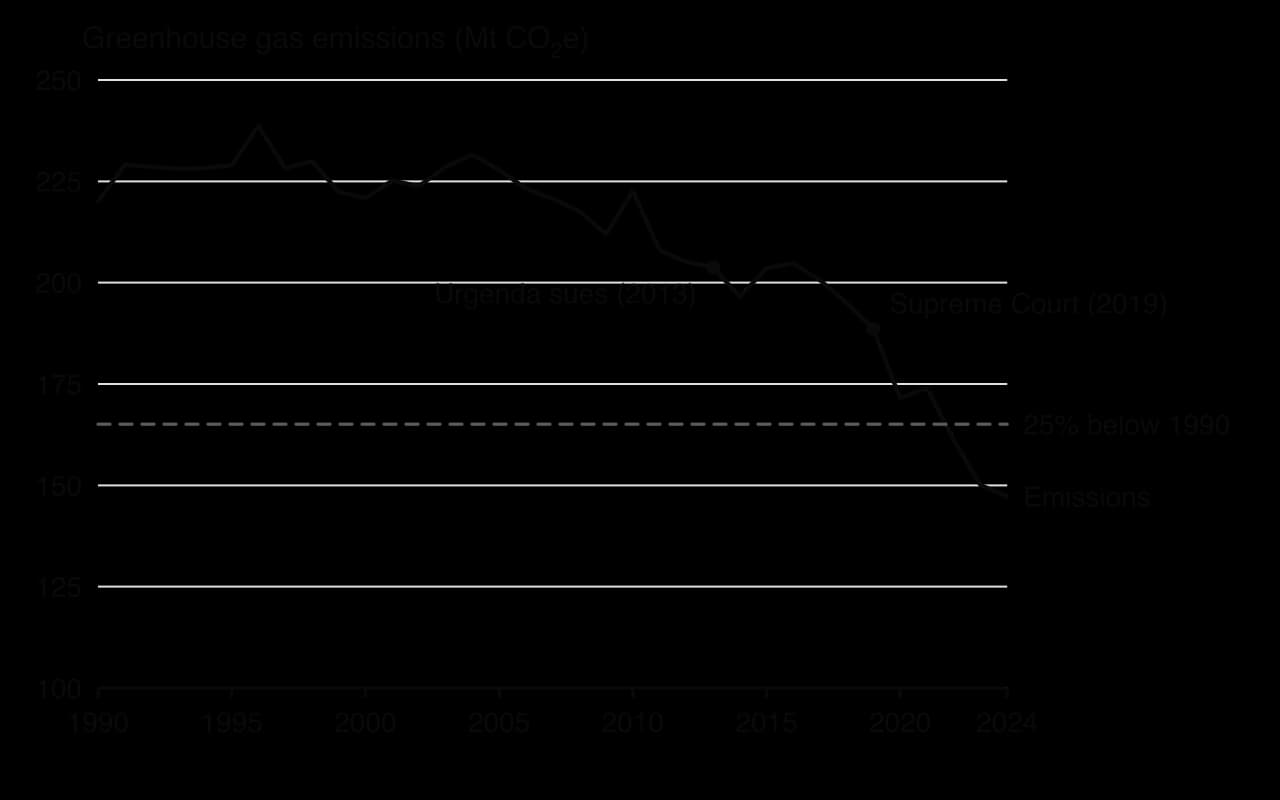
The graph shows that emissions stayed above 200 Mt CO₂e for most years until 2017, and that the largest falls came after the court rulings. The official calculation used to check the court order, made by Statistics Netherlands (CBS) from the national emissions inventory, recorded a 25.5% cut in 2020, whereas this series crosses the 25% line only in 2022.
Emissions from coal-fired power stations fell by about 80% between 2015 and 2020, and road-transport emissions in 2020 were 15% lower than in 2019 because of COVID-19 restrictions. Urgenda itself argued that the target was reached partly by luck, so the case shows both the power of a court order and the limits of what it can guarantee.
Milieudefensie and Shell
The second case targeted a company. In April 2019, Milieudefensie (Friends of the Earth Netherlands), six other NGOs including Greenpeace and ActionAid, and 17,379 individual claimants sued Royal Dutch Shell. On 26 May 2021 the District Court in The Hague ordered Shell to cut its global net emissions by 45% by 2030 on 2019 levels, including the emissions from the oil and gas it sells. It was the first ruling to hold a corporation to the goals of the Paris Agreement. Shell appealed, dropped “Royal Dutch” from its name and moved its headquarters to London in 2022, saying the move was unrelated to the case.
On 12 November 2024 the Court of Appeal overturned the specific 45% order, ruling that there was no social standard of care requiring an exact percentage cut. It nevertheless confirmed that Shell, like other companies, has a responsibility to help prevent dangerous climate change. The case shows both the reach and the limits of litigation against a transnational corporation: a court in one country can set out duties for a company operating worldwide, but judges are reluctant to set its business strategy.
Other non-governmental stakeholders
Consumer and campaign groups: in 2024 a Dutch court found most of KLM’s environmental advertising claims misleading, a case brought by climate campaigners, which increases the legal risk of greenwashing for all Dutch firms.
Farmers: proposed cuts to nitrogen and livestock emissions triggered tractor protests from 2019, and the Farmer–Citizen Movement (BBB), founded to oppose the rules, became the largest party in the Dutch Senate in 2023. Their resistance shows that civil society can slow action as well as speed it up.
Businesses and sectors: the National Climate Agreement of June 2019 was negotiated with electricity, industry, buildings, transport and agriculture, so business stakeholders helped to design the measures they must carry out.
How well did the response work?
Key concept | How the case shows it |
|---|---|
Power | Citizens and NGOs used courts to overrule an elected government’s chosen targets; a transnational corporation won on appeal; farmers used elections to resist |
Possibility | The 25% target, once judged unrealistic by the government, was met within a year of the final ruling |
Scale | A national court ruling inspired cases in at least eight other countries and at the European Court of Human Rights |
Perspectives | The state stressed the separation of powers and the Netherlands’ small global share; Urgenda stressed human rights and fair shares |
The Netherlands’ emissions in 2024 were about 33% below 1990, a much faster fall than in the twenty years before the Urgenda case. Non-governmental stakeholders did not achieve this alone: EU policy, the falling cost of renewables and the closure of the Groningen gas field all mattered. But the court cases changed the timing of national action and created a legal principle, that a state must do its fair share whatever others do, that has spread well beyond the Netherlands. The Shell appeal and the farmers’ protests show the limits: courts are cautious about ordering companies, and policies that impose visible costs on particular groups can generate a powerful backlash.
Sources: Wikipedia, “State of the Netherlands v. Urgenda Foundation”, “Milieudefensie v Royal Dutch Shell”, “Climate change in the Netherlands” and “KLM” (accessed 2026); CBS, “Urgenda reduction target for GHG emissions achieved in 2020”, 2022; Our World in Data, greenhouse gas and CO₂ emissions, 2025; World Bank, WDI, EN.POP.EL5M.ZS.
To what extent did the Urgenda ruling, rather than other factors, cause the fall in Dutch emissions after 2015?
Why might courts be more willing to order a government than a company to cut emissions?
How far does the Dutch experience show that non-governmental stakeholders can both accelerate and slow down climate action?
Exam practice
This topic appears in Paper 2. Section A sets a structured question on a stimulus from Unit 2; Section B is an infographic that may draw on any core unit; Section C offers essays that reward synthesis across population, climate and resources. Questions on responses usually test the distinction between mitigation and adaptation, the reasons for differences in vulnerability, the evaluation of a strategy, and the perspectives of named stakeholders.
Data questions follow the same pattern across the core: read the stimulus carefully, quote it with units, and keep description separate from explanation.
Structured question (Section A style)
The table shows CO₂ emissions per person and ND-GAIN vulnerability scores for nine countries in 2024 (higher vulnerability scores are worse).
Country | CO₂ per person (t) | ND-GAIN vulnerability (0–1) |
|---|---|---|
Qatar | 41.27 | 0.418 |
Australia | 14.48 | 0.300 |
United States | 14.20 | 0.317 |
China | 8.66 | 0.394 |
Netherlands | 6.30 | 0.371 |
India | 2.20 | 0.475 |
Bangladesh | 0.62 | 0.544 |
Niger | 0.12 | 0.587 |
Chad | 0.14 | 0.638 |
Sources: Global Carbon Budget via Our World in Data, 2025; ND-GAIN Country Index, 2026.
Part (b) moves from the stimulus to reasons, so it needs geographical knowledge as well as the table.
Part (c) does not use the stimulus; it tests knowledge of a strategy from the topic.
Infographic question (Section B style)
An infographic titled “Tuvalu: a nation on the front line” shows a map of the nine islands, and these panels: population 10,643 (2022 census); land area about 25 km²; highest point 4.6 m above sea level; sea-level rise at Funafuti about 3.9 mm a year, about twice the global average; share of global CO₂ emissions about 0.00003%; a 7.8 ha raised platform under construction since December 2022; and “Falepili Union with Australia: up to 280 migrants a year”.
Extended response (Section C style)
Section C essays reward a clear argument, detailed examples from more than one place, evaluation of both sides of the statement and a conclusion that follows from the evidence. They also reward links to other core units, for example between climate vulnerability and population change or resource consumption.
Summary
Risk results from the interaction of a climate hazard with exposure (who is in harm’s way) and vulnerability (how well they can cope); resilience and adaptive capacity reduce it.
Vulnerability varies with location, wealth, age, gender, education and risk perception, at every scale from household to nation.
Climate justice: those least responsible for emissions, measured per person or cumulatively, are often the most vulnerable, as coastal Bangladesh and Tuvalu show.
Mitigation reduces the causes of climate change; adaptation reduces its effects. Both are needed, at global, national and local scales.
Global agreements have moved from binding targets for a few HICs under the Kyoto Protocol of 1997 to voluntary pledges from almost every country under the Paris Agreement of 2015, with finance and fossil fuels now central.
Carbon trading fixes the quantity of emissions and lets the price vary; carbon taxes fix the price; offsets raise problems of additionality, permanence and verification.
CCS and carbon dioxide removal are small in scale so far; solar radiation management could cool quickly but carries serious risks and governance problems.
Civil society uses protest, litigation, divestment and community action; companies use net zero targets and renewable purchasing, but greenwashing is common.
In the Netherlands, Urgenda’s court victory forced a 25% emissions cut by 2020, while the Shell appeal and farmers’ protests show the limits of non-governmental power.
Self-check
- To do:
I can define risk, exposure, vulnerability, resilience and adaptive capacity and explain how they relate.
- To do:
I can explain how six factors make people and places more or less vulnerable, with examples.
- To do:
I can use per capita, total and cumulative emissions data to discuss climate justice.
- To do:
I can compare the vulnerability of coastal Bangladesh and Tuvalu, with specific facts.
- To do:
I can distinguish mitigation from adaptation and give examples of each at different scales.
- To do:
I can evaluate the Kyoto Protocol, the Paris Agreement and recent COPs.
- To do:
I can explain and evaluate carbon offsetting, cap and trade and carbon taxes, including a worked calculation.
- To do:
I can evaluate CCS, carbon dioxide removal and solar radiation management.
- To do:
I can examine civil society and corporate strategies and explain why perspectives on action differ.
- To do:
I can use the Netherlands case study to evaluate the role of non-governmental stakeholders.