2 Global climate—vulnerability and resilience
See how the three parts of the unit fit together, from the energy balance to who is vulnerable and how the world responds, with the case studies, key concepts, SL/HL arrangement and Paper 2 questions.
- IB Geography
- SL and HL
What 2 covers
From the subject guide: what you need to know and be able to do.
Core: the causes and consequences of climate change, and how people respond.
3 subtopics in Global climate—vulnerability and resilience
Each one has its own page once something is published for it.
- 2.1Causes of global climate change113 questions · notes
- 2.2Consequences of global climate change161 questions · notes
- 2.3Responding to global climate change124 questions · notes
An overview of 2 Global climate—vulnerability and resilience
The global climate unit studies how natural and human processes change the Earth’s energy balance, what the resulting changes do to environments, people and places, and how societies respond. Global climate change affects every other part of geography, from where crops can grow to where people can safely live, and the people most exposed to it are often those who have done least to cause it.
The unit moves from cause to consequence to response. It begins with the physical system, the energy balance, the greenhouse effect and the feedbacks that amplify change; follows the changes through ice, oceans, weather, ecosystems and human systems; and ends with who is most vulnerable and what governments, citizens and businesses are doing about it. Global temperature in 2024 was about 1.55 °C above the pre-industrial average of 1850–1900, the first calendar year above 1.5 °C, and in 2025 it was about 1.43 °C above it.
Questions that frame the unit
Each subtopic answers one broad geographic question. The first asks how natural and human processes affect the global energy balance. The second asks how global climate change affects places, societies and environmental systems, and why the effects are uneven and uncertain. The third asks what possibilities exist for responding to climate change and who holds power over the decisions.
Behind these inquiries lie real questions about real places:
Why has the Arctic warmed nearly four times faster than the world as a whole since 1979?
How could Canada’s wildfires in 2023 release more than twice as much carbon dioxide as the country’s use of fossil fuels in the same year?
Why can coastal Bangladesh cut its cyclone deaths through warnings and shelters, while Tuvalu’s realistic options include moving people abroad?
Who should cut emissions fastest: the country that emits most today, the one that emits most per person or the ones that have emitted most since 1750?
Can a group of citizens force a government to cut its emissions, as Urgenda did in the Netherlands?
What the unit covers
Subtopic | Main question | Case study and detailed examples |
|---|---|---|
2.1 Causes of global climate change | How do natural processes and human activity change the energy balance, and how do emissions vary between places? | Case study: the Arctic, albedo and permafrost feedbacks. Detailed examples: Mount Pinatubo, 1991; the Keeling curve; emissions of China, the USA, India and the UK; the UK’s decoupling |
2.2 Consequences of global climate change | What is climate change doing to ice, oceans, carbon stores, weather, ecosystems and people, and where? | Case study: Canada’s 2023 wildfire season. Detailed examples: glacier retreat and sea-level rise; the Great Barrier Reef; Europe’s heatwaves; the Horn of Africa drought; the Northern Sea Route and the Rhine in 2022 |
2.3 Responding to global climate change | Why are some people and places more vulnerable, and how effective are the responses? | Case study: non-governmental stakeholders in the Netherlands (Urgenda, Milieudefensie v Shell). Contrasting vulnerability: coastal Bangladesh and Tuvalu. Detailed examples: the Paris Agreement and recent COPs; the EU Emissions Trading System; carbon capture and geoengineering |
How the subtopics connect
The three subtopics form a chain from process to people. The causes in the first subtopic, rising greenhouse gases and the feedbacks they trigger, produce the consequences of the second: melting ice, rising seas, more intense extremes and shifting biomes. Those consequences become harmful where they meet exposed and vulnerable people, which is where the third subtopic begins, with risk, vulnerability and the choice between mitigation and adaptation.
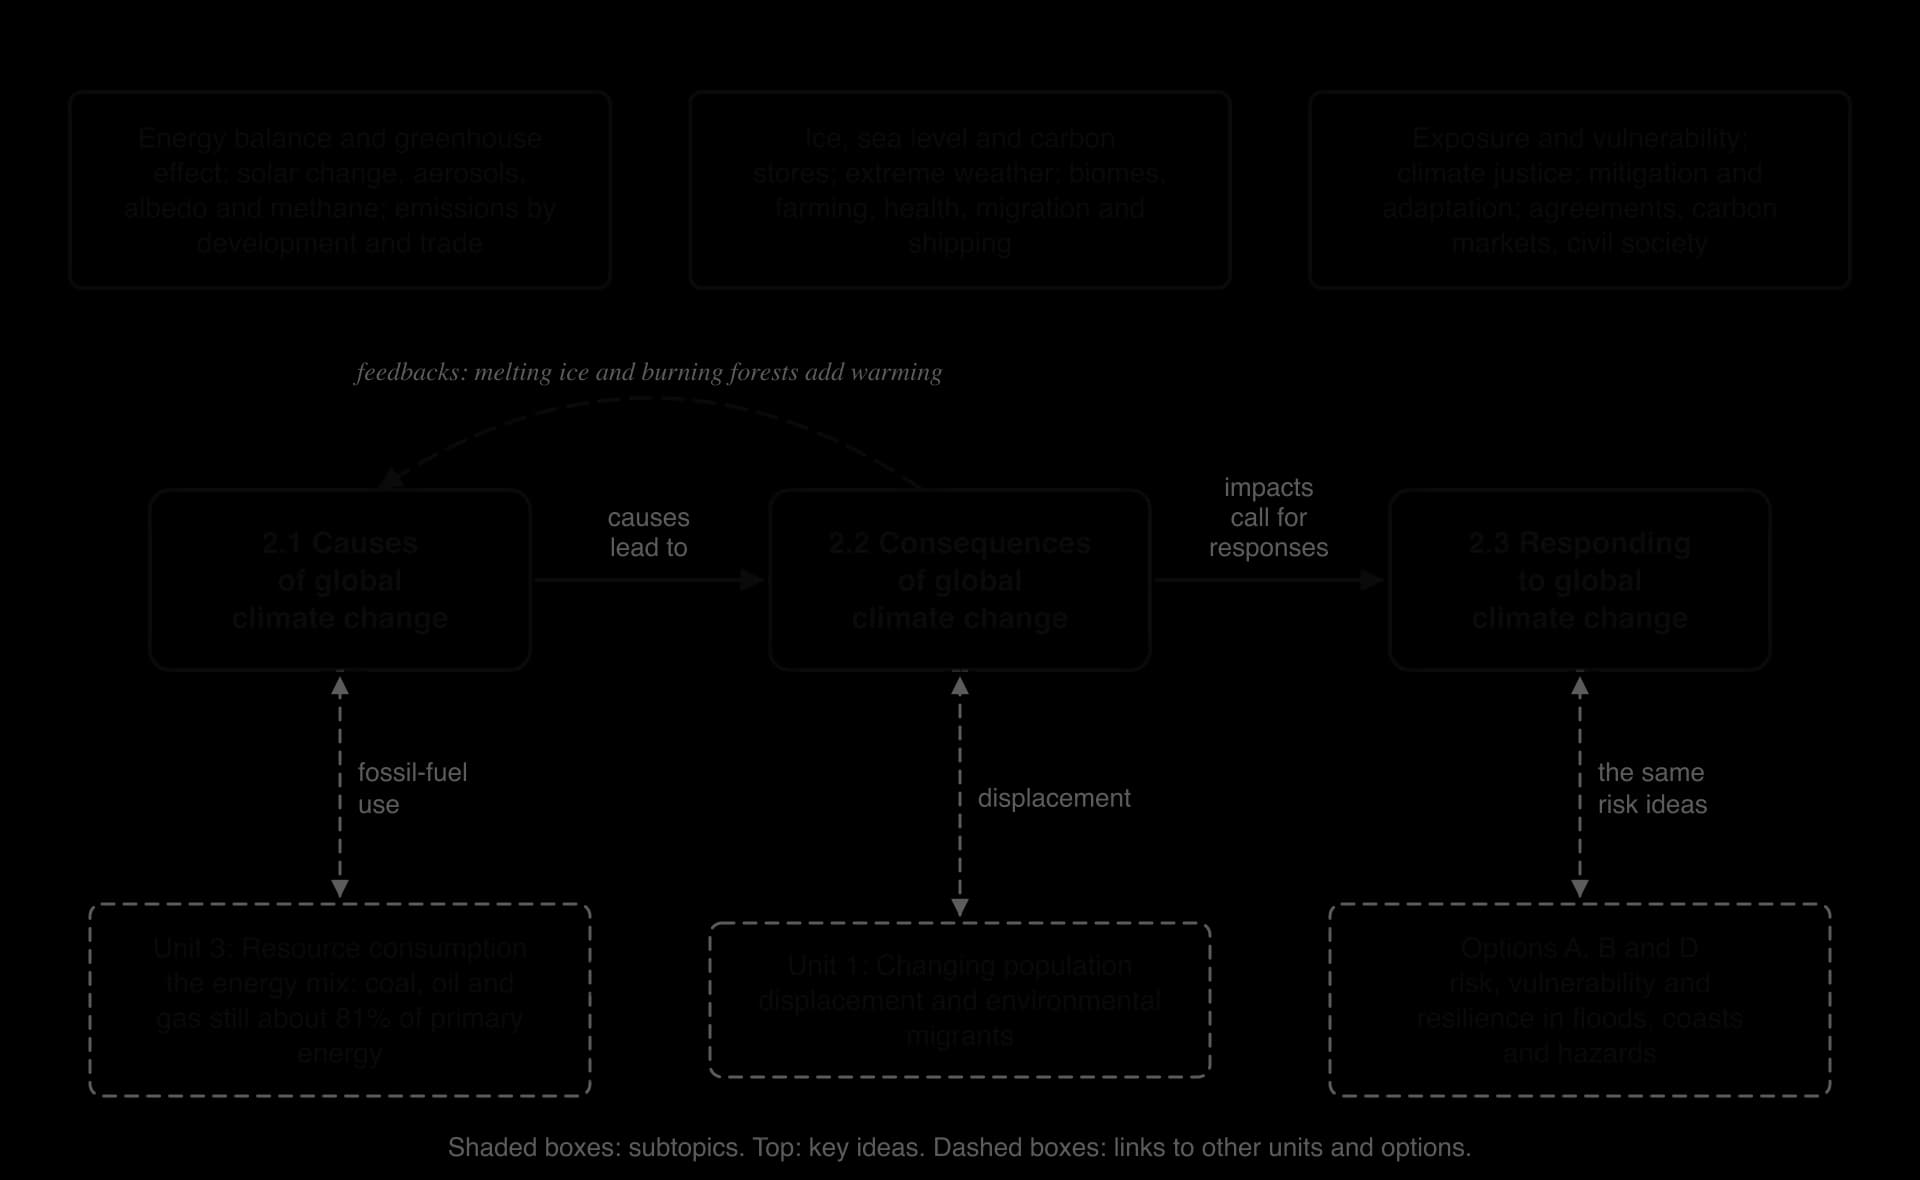
The concept map shows why the climate is described as a complex system. Many consequences act back on the causes: Arctic sea-ice loss lowers albedo and speeds warming, thawing permafrost releases carbon dioxide and methane, and Canada’s 2023 fires turned a forest carbon sink into a source. Each is a positive feedback, and together they explain why responses are urgent and why projections are given as ranges.
The dashed links show where the unit meets the rest of the course. Most emissions come from the fossil fuels that dominate the energy mix studied in resource consumption. Drought, floods and sea-level rise add to the causes of displacement studied in population change. The same ideas of exposure, vulnerability and resilience run through the options on freshwater, coasts and geophysical hazards, where floods, storm surges and earthquakes are judged in the same way.
Key concepts in global climate
The unit is built on process at its start and on power and possibility at its end, with several further concepts at its centre.
Concept | How it appears in the unit |
|---|---|
Process | Shortwave and longwave radiation, the enhanced greenhouse effect, global dimming and feedback loops change the energy balance step by step. |
Place | The same warming melts Arctic sea ice, bleaches the Great Barrier Reef, dries the Horn of Africa and opens the Northern Sea Route. |
Power | Emitters and sufferers are often far apart; negotiating blocs, courts and companies decide how fast emissions fall; the USA has twice withdrawn from the Paris Agreement. |
Possibility | IPCC scenarios give about 1.4 °C to 4.4 °C of warming by 2081–2100 depending on the emissions pathway chosen. |
Systems | The climate is a system of stores and flows of energy and carbon, with tipping points that may make some changes irreversible. |
Risk, vulnerability and resilience | Harm depends on hazard, exposure and vulnerability together: the Netherlands is highly exposed but has low vulnerability; Tuvalu has few options. |
Equity | Climate justice: an average American emitted about 23 times as much carbon dioxide as an average Bangladeshi in 2024. |
Scale and perspectives organise every evaluation in the unit. Emissions can be counted per country, per person, since 1750 or by consumption, and each measure makes a different group look responsible. A negotiator for China and one for the USA can both use correct figures to argue opposite cases, so the choice of measure carries a value judgment about fairness.
How SL and HL differ
Global climate is one of the three core units, studied in full by both SL and HL students and examined in Paper 2, which is the same paper at both levels. Nothing in the unit is HL only, and its pages are identical for SL and HL readers.
HL students later meet the unit again in the HL extension, where environmental risks and resilience are studied at the global scale, but the core content itself does not change.
Assessment
The unit is examined in Paper 2. Section A has one structured question on each core unit, built on a stimulus: a short description of a pattern or trend that must be quantified, then two “suggest” and two “explain” points. Section B is an infographic or visual stimulus that may draw on any core unit, with short readings, one suggestion and a longer judgment on how far the evidence supports a view. Section C is an extended answer of 10 marks chosen from two, often a quoted statement followed by “To what extent do you agree?”.
Climate questions often use a line graph such as the Keeling curve, sea-level or sea-ice records, a bar chart comparing total and per capita emissions, a map of projected change or a systems diagram. Short questions ask students to describe a trend, suggest reasons for it or explain a feedback loop step by step; essays ask whether natural or human causes matter more, whether the most vulnerable are the least responsible, or whether non-governmental stakeholders are more effective than governments.
Carry on with 2 in Augment
With a free account, Augment remembers where you stopped and what you have practiced.