Describe trends in family size, sex ratios and ageing, evaluate ageing, pro-natalist, anti-natalist, gender equality and anti-trafficking policies, and explain the demographic dividend using Vietnam.
Each is in the Geography glossary, with every other term in the subject.
A population in which the proportion of people aged 65 and over is increasing and the median age is rising, mainly as a result of low fertility and rising life expectancy.
A government policy that aims to reduce the birth rate and family size, for example through family planning services, education, incentives for small families or legal limits on births.
The boost to economic growth that can result when falling fertility makes the working-age population (15–64) larger relative to the dependent population of children and older people.
The number of children born to a couple or a woman; at national scale it is measured by the total fertility rate, the average number of births per woman over her reproductive life.
A situation in which women and men have equal rights, opportunities, resources and power in all areas of life, including education, work, health, politics and the family.
The knowledge, skills, health and experience of a population, which determine how productive its people can be; it is increased by investment in education, training and healthcare.
The recruitment, transport, transfer or holding of people by force, coercion, fraud or abuse of vulnerability, for the purpose of exploitation such as forced labour, sexual exploitation or slavery.
Describe global and regional trends in family size, sex ratios and ageing, using fertility rates, sex ratios, median ages and the share of people aged 65 and over.
Explain why fertility, sex ratios and ageing vary between regions and countries.
Examine the challenges and opportunities that ageing creates for societies, including the silver economy.
Evaluate policies for ageing societies, using Japan, Germany, Singapore and China as examples.
Distinguish between pro-natalist and anti-natalist policies, and evaluate examples of each, including China’s one-child policy.
Explain how gender equality policies and anti-trafficking policies affect populations, and distinguish human trafficking from people smuggling.
Explain the demographic dividend and the conditions needed to achieve it, using Vietnam as a case study.
Discuss how population can be considered a resource, and how population change may shift the balance of power between groups at local, national and international scales.
World population is still growing, but more slowly, and in many countries it has started to fall. Families are getting smaller in almost every country, many populations are ageing quickly, and in some places the balance between males and females has been distorted. These trends create challenges, such as paying for pensions or finding enough workers, and opportunities, such as the faster growth that can follow when a large share of the population is of working age.
The topic is about possibility and power. Possibility, because population projections describe several possible futures, each with its own uncertainty, and because a changing age structure opens or closes windows for development. Power, because governments, families, employers and international organisations all try to influence how many children are born, who migrates and how long people work, and because population change itself shifts power between generations, between women and men, and between world regions.
115 exam-style questions on this subtopic, written in the style of the IB papers. The first has its markscheme open. Counted on
Examine the extent to which the epidemiological transition model applies to countries at different stages of economic development.
10 marks
Marks should be allocated according to the markbands.
The epidemiological transition model (Omran, 1971) describes changes in the main causes of death as societies develop: an age of pestilence and famine, an age of receding pandemics, and an age of degenerative and human-made diseases; a fourth stage of delayed degenerative diseases (Olshansky and Ault, 1986) has been added, and some suggest a fifth stage of re-emerging infectious diseases. It parallels the demographic transition model. Credit answers that use the diseases continuum (from diseases of poverty to diseases of affluence).
Possible applied themes (AO2) demonstrating knowledge and understanding (AO1):
High-income countries broadly fit the model: in western Europe, infectious disease deaths fell from the 19th century with better nutrition, sanitation and later vaccines and antibiotics; today cardiovascular disease, cancers and dementia dominate, and Japan fits the delayed degenerative stage.
Emerging economies such as China and Brazil have moved through the transition much faster than Europe did, because medical technology was imported rather than developed slowly.
Many low- and middle-income countries do not move from one stage to the next but face a double burden of infectious and non-communicable diseases at the same time (eg India and South Africa); about 86% of premature deaths from non-communicable diseases occur in low- and middle-income countries.
Reversals: HIV/AIDS reduced life expectancy sharply in southern Africa in the 1990s and 2000s (eg Botswana, Lesotho); in Russia, male life expectancy fell in the 1990s, linked to alcohol and economic collapse; in the USA, life expectancy fell between 2015 and 2017 with drug overdoses.
With a free account, Augment remembers where you stopped and what you have practiced.
The age that divides a population into two equal halves, so that half the people are younger and half are older.
China’s anti-natalist policy from 1980 to 2015, which limited most urban couples to one child using fines, workplace sanctions, contraception and sterilisation, with exemptions for many rural families and minorities.
The facilitation, for financial gain, of a person’s irregular entry into a country of which they are not a citizen or resident; the person usually consents and the relationship ends on arrival.
An estimate of the future size and structure of a population calculated from assumptions about fertility, mortality and migration, usually given in several variants to show uncertainty.
A government policy that aims to increase the birth rate and family size, for example through child benefits, tax relief, paid parental leave, subsidised childcare and housing support.
The number of males per 100 females in a population or age group; the sex ratio at birth is the number of male births per 100 female births, naturally about 105.
The economic activity generated by the needs and spending of people aged about 50 and over, including healthcare, care services, assistive technology, housing adaptation, leisure and travel.
The period, usually several decades, during which the working-age share of a population is highest and the dependency ratio lowest, so that conditions for a demographic dividend are most favourable.
Family size is the number of children in a family. Geographers usually measure it at the scale of a whole population with the total fertility rate (TFR): the average number of children a woman would have over her lifetime if she experienced the current age-specific birth rates. A TFR of about 2.1 is replacement-level fertility, the level at which each generation replaces itself in the long run, without migration.
Replacement level is slightly above 2.0 because a little more than half of all babies are boys and because some girls die before they can have children of their own. Where child mortality is high, replacement-level fertility is higher, closer to 2.5 or 3.0 in some low-income countries.
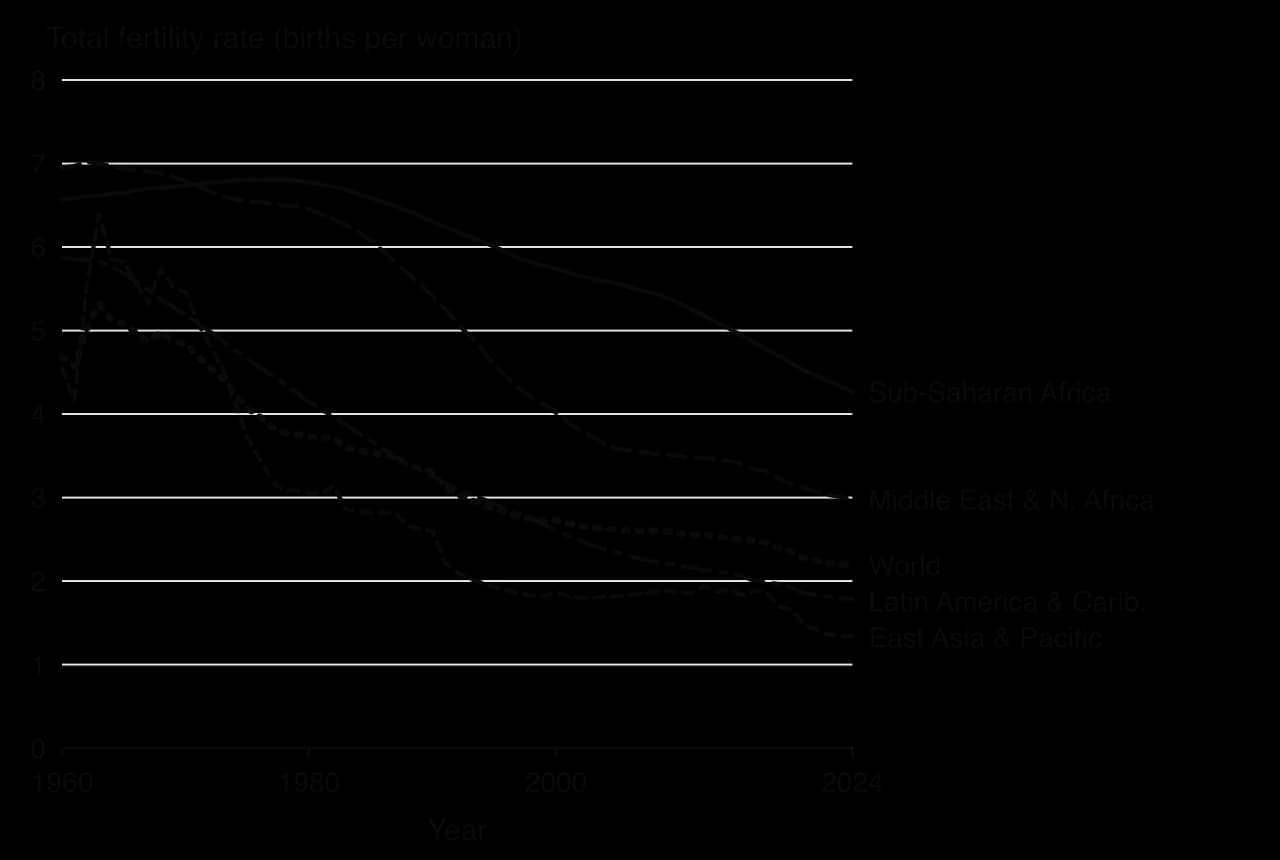
World TFR fell from 4.7 in 1960 to 2.2 in 2024. Women today have on average one child fewer than around 1990, and more than half of the world’s countries and areas now have fertility below replacement level. Nearly a fifth have “ultra-low” fertility, below 1.4 births per woman: examples include China, Italy, Spain and South Korea.
The graph and wider World Bank data show three groups of regions. East Asia and the Pacific, Europe and North America have had fertility below 2.1 for decades; East Asia fell fastest, from about 5.5 in 1970 to 1.3 in 2024. Latin America and South Asia have fallen to just below replacement (1.8 and 2.0). The Middle East and North Africa (3.0) and sub-Saharan Africa (4.3) still have well above replacement fertility, although both are falling.
The same set of factors explains why fertility falls, but they combine differently from place to place. They can be grouped into economic, social, health, cultural and political factors.
Factor | How it reduces family size | Example |
|---|---|---|
Falling child mortality | When most children survive, parents no longer have extra births as insurance against child deaths. | Bangladesh: child mortality fell sharply after the 1980s and TFR fell from 6.3 (1980) to 2.1 (2024). |
Education of girls | Women who stay longer in school marry later, know more about contraception and have more paid work opportunities, so the opportunity cost of children rises. | Iran: rapid expansion of girls’ schooling after 1980 helped TFR fall from 6.6 (1980) to 2.0 (2000). |
Women’s paid employment | Time spent raising children means lost earnings, so women in paid work tend to have fewer children, especially where childcare is scarce. | South Korea and Japan, where long working hours make combining work and children difficult. |
Urbanisation | In cities children cost more (housing, schooling) and contribute less labour than on farms. | Ho Chi Minh City’s TFR (1.39 in 2024) is far below Vietnam’s national 1.91. |
Access to contraception | Allows couples to have the number of children they want, when they want them. | Family planning programmes in Bangladesh, Iran and Thailand. |
Religion and culture | Some traditions value large families or oppose contraception; others value smaller families. | High fertility persists in parts of the Sahel; strong son preference affected fertility choices in East and South Asia. |
Policy | Governments may restrict or encourage births. | China’s one-child policy (1980–2015); France’s family benefits. |
Sources: World Bank WDI (UN World Population Prospects 2024), 2026; Al Jazeera, 5 June 2025 (Vietnam).
Economic development is the background to almost all of these factors. As countries urbanise and industrialise, children change from being an economic asset (labour on the farm, support in old age) to being an economic cost (school fees, housing). This is one of the processes that the demographic transition model describes, with fertility falling some decades after mortality.
East Asia now has the lowest fertility in the world. South Korea’s TFR fell from 1.24 in 2015 to a world-record low of 0.72 in 2023, then rose slightly to 0.75 in 2024, its first rise in nine years, as marriages delayed by the COVID-19 pandemic took place. China’s TFR was about 1.0 in 2024, Singapore’s 0.97 and Japan’s 1.15.
Several causes reinforce each other: very expensive housing in Seoul, Tokyo and Shanghai, heavy spending on private tutoring, long working hours, and women doing most of the childcare even when they work full time. Births outside marriage are rare in East Asia, so fertility falls as people marry later or not at all.
Within countries, the lowest fertility is in the largest cities: in 2022 Seoul’s TFR was 0.59, while Sejong, a planned administrative city with secure public-sector jobs and cheaper housing, had 1.12.
The highest fertility rates are in the Sahel and Central Africa: Chad (6.0), Somalia (6.0), the Democratic Republic of the Congo (DRC; 6.0) and Niger (5.9) in 2024. Most people farm, many girls marry before 18, child mortality is still high and modern contraception is hard to obtain in rural areas. Large families are also desired: in Niger the number of children women say is ideal is higher than the TFR itself.
Even here, fertility is falling. Rwanda’s TFR fell from 8.1 in 1980 to 3.6 in 2024, helped by community health workers and a strong national family planning programme. Because most of the world’s future population growth is projected to take place in sub-Saharan Africa, its pace of decline matters globally.
The sex ratio is the number of males for every 100 females in a population. It can be measured at birth, for an age group or for the whole population, and each measure reflects different processes.
Without human interference, about 105 boys are born for every 100 girls (a natural range of roughly 103–107). Because males have slightly higher death rates at every age, the ratio falls with age: it is about equal in early adulthood, and women outnumber men among older people. In Japan, where 29.8% of people are over 65, males make up 48.8% of the whole population, a sex ratio of about 95.
Sex ratios at birth rose far above the natural level in parts of Asia from the 1980s. Three conditions came together: a long-standing son preference, smaller desired families, and cheap ultrasound scanning that allowed parents to learn the sex of a foetus and end a pregnancy. Son preference has roots in inheritance customs (land passing to sons), in old-age support (sons expected to care for parents while daughters join their husband’s family) and, in South Asia, in the cost of dowry.
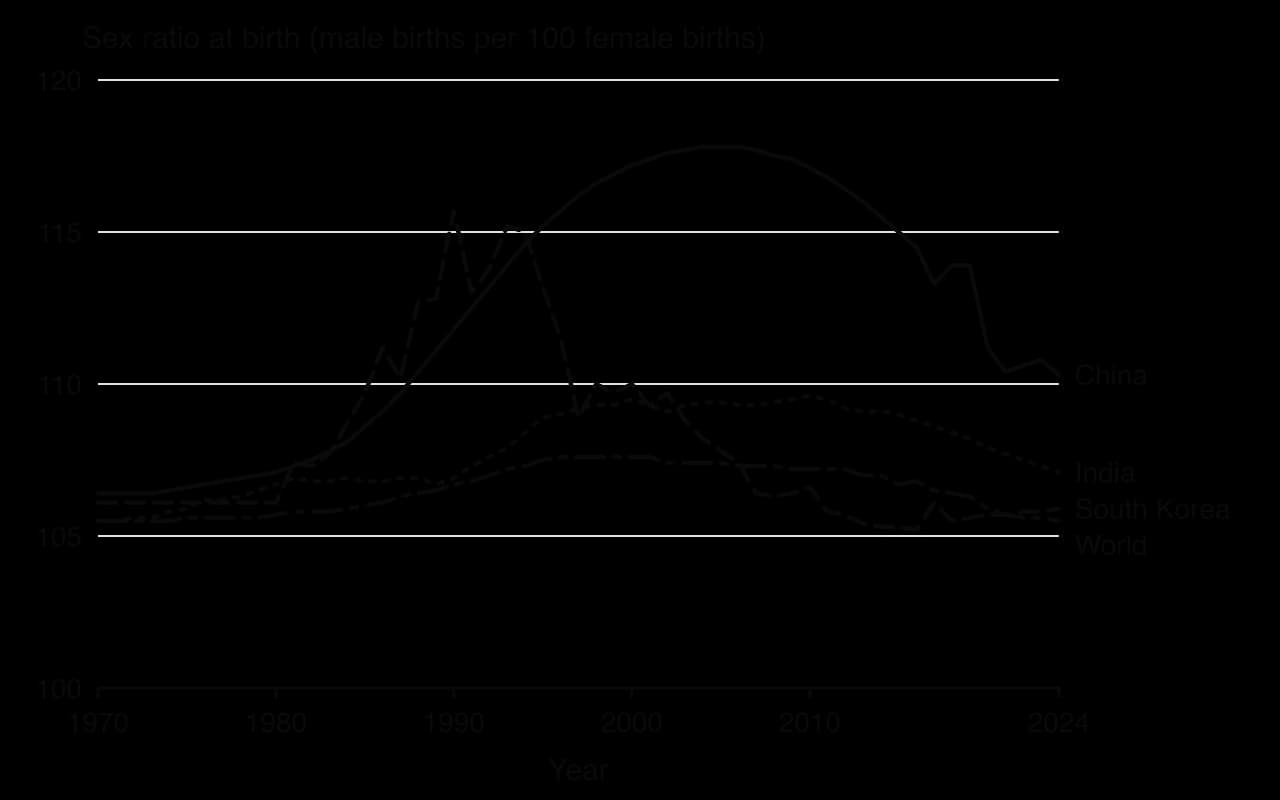
The chart shows three paths. South Korea reached about 116 in 1990 but returned to about 106 by 2015, as urbanisation, women’s education and changing attitudes weakened son preference. China’s ratio rose from about 107 in 1980 to about 118 in the mid-2000s, during the one-child policy, and was still 110 in 2024. India’s peaked at about 110 and is now 107, with the highest ratios in the north-west (Haryana, Punjab).
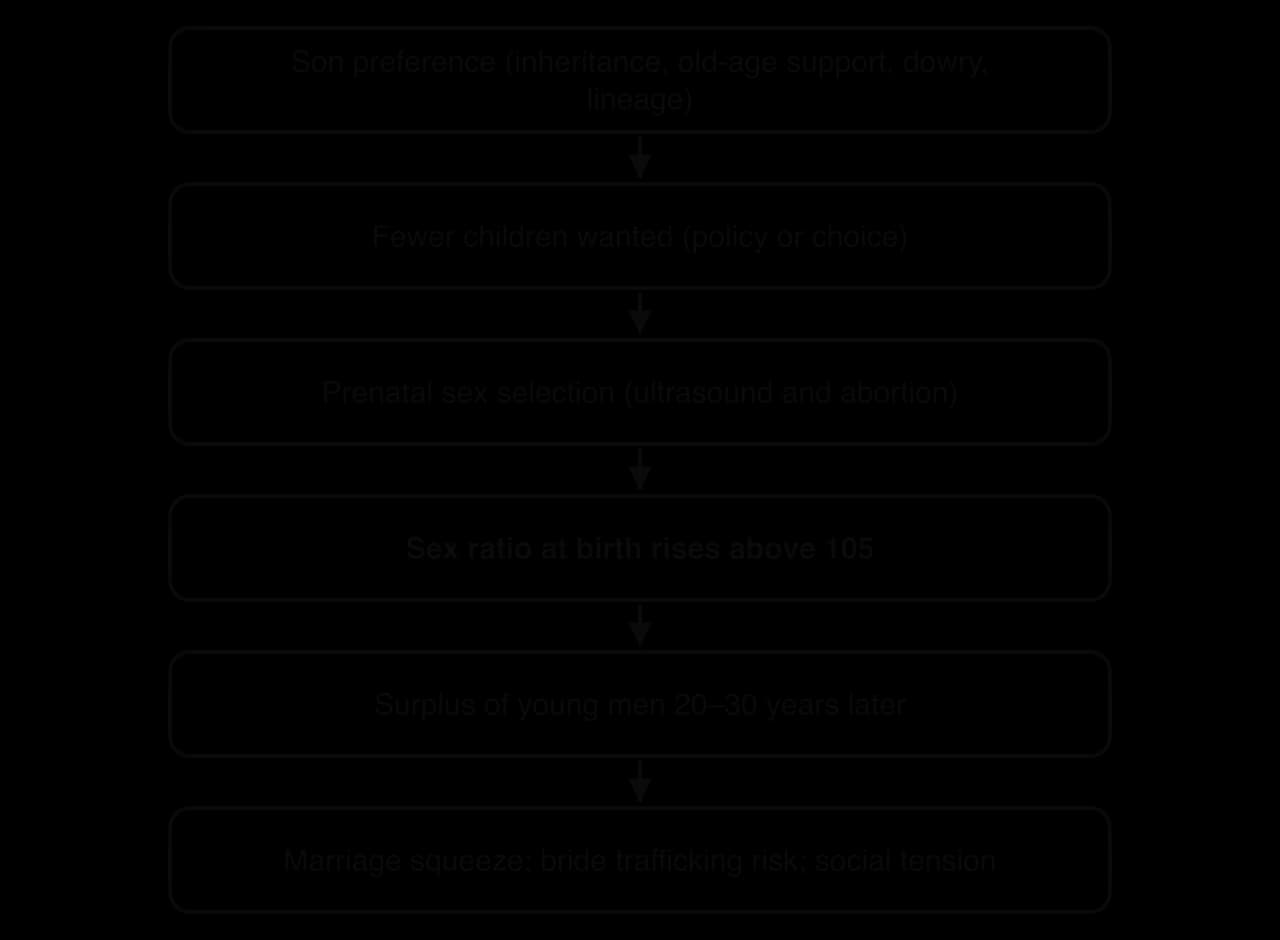
A marriage squeeze: in 2015 China had an estimated 32–36 million more males than females, and official projections expected about 30 million more men than women by 2020. Many men, especially poorer rural men with little education, cannot find a wife.
Trafficking risk: a shortage of brides creates demand for women from poorer regions or neighbouring countries (Myanmar, Laos, Vietnam, Cambodia, Nepal) who may be trafficked or deceived into marriage.
Social effects: concerns about instability among unmarried young men, though the evidence is mixed.
Lower fertility in the next generation, because fewer women means fewer potential mothers, reinforcing population ageing.
Governments have responded with bans and campaigns. India’s Pre-Conception and Pre-Natal Diagnostic Techniques Act (1994) made it illegal to use scans to determine sex, and the Beti Bachao, Beti Padhao (“Save the daughter, educate the daughter”) campaign began in 2015; Vietnam bans doctors from revealing a foetus’s sex. Enforcement is difficult where demand for sons remains strong, so South Korea’s recovery is usually credited more to social change than to law.
In the whole population, migration can distort the sex ratio far more than births. The Gulf states employ millions of temporary migrant workers, most of them men from South Asia working in construction, transport and services. In 2024, 71.3% of Qatar’s population and 63.9% of the United Arab Emirates’ population were male.
The opposite pattern appears where many men emigrate, as in rural Nepal and Kerala in India: women outnumber men of working age and take on more farming and household decisions. Places receiving female domestic or care workers, such as Hong Kong, show female-skewed ratios in the working ages.
An ageing population is one in which the proportion of older people is rising and the median age is increasing. Population ageing is the most certain of all population trends, because the people who will be old in 2060 are already alive.
The clearest single measure of the age of a population is its median age. A median age below 20 indicates a very young population with many children; one above 40 indicates an aged population.
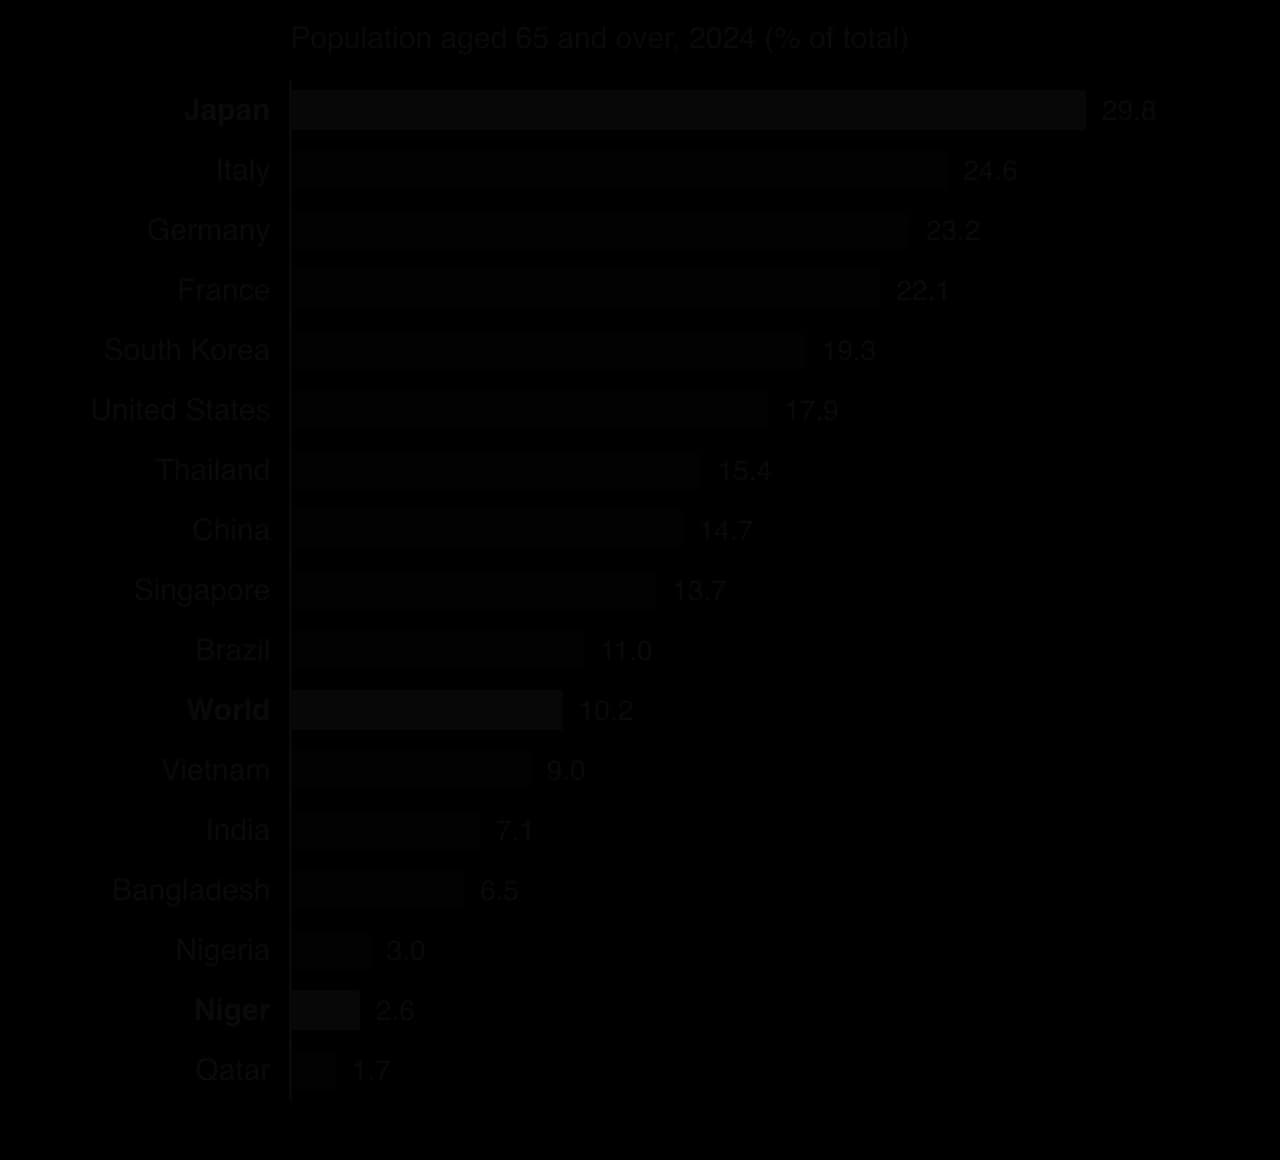
Geographers measure ageing in several ways: the share of people aged 65 and over (or 80 and over), the median age, and the old-age part of the dependency ratio (people aged 65 and over per 100 people aged 15–64). A widely used classification calls a society “ageing” when 7% of people are over 65, “aged” at 14% and “super-aged” at about 20–21%.
Low fertility is the main cause. When fewer children are born, each new generation is smaller than the one before, so the base of the population pyramid narrows and the share of older people rises even if no one lives longer.
Rising life expectancy: better healthcare, nutrition and living standards mean more people reach old age and live longer once they get there. Japan had 107,677 centenarians in September 2026, the first count above 100,000; there were 153 in 1963.
Emigration of young adults speeds up ageing in the places they leave: rural Japan, eastern Germany, Bulgaria and Romania have aged faster than their national averages.
The ageing of large cohorts: baby-boom generations born after 1945 in Europe and North America, and in the 1960s in China, are now reaching retirement age.
Japan has the oldest population of any large country (median age 49.4 in 2024), and South Korea is ageing fastest: its median age was 30.7 in 2000 and is projected to be 56.7 in 2050. Europe and East Asia are now aged; Latin America, South-East Asia and South Asia will age rapidly next, while sub-Saharan Africa remains very young.
Country | Median age, 2000 | Median age, 2024 | Median age, 2050 (projected) |
|---|---|---|---|
Japan | 40.8 | 49.4 | 52.8 |
South Korea | 30.7 | 45.1 | 56.7 |
China | 29.0 | 39.6 | 52.1 |
United States | 34.3 | 38.3 | 41.9 |
Vietnam | 22.7 | 32.9 | 40.2 |
India | 21.2 | 28.4 | 38.3 |
Nigeria | 16.8 | 17.9 | 23.9 |
Niger | 15.2 | 15.4 | 21.2 |
World | 25.1 | 30.6 | 36.1 |
Sources: UN World Population Prospects 2024 (medium variant), via Our World in Data, 2026.
By the late 2070s, people aged 65 and over are projected to outnumber children under 18 worldwide, and by the late 2050s more than half of all deaths will be of people aged 80 or over, up from 17% in 1995. The scale is global, but the timing differs by place: Japan reached the 14% threshold in 1994, China and Thailand in 2023 and 2022, while in Nigeria only 3.0% of people were 65 or over in 2024.
Today’s high-income countries became aged societies after they were wealthy. Japan reached 14% aged 65 and over in 1994, when its GDP per capita was about US$29,900 (constant 2015 US$); China reached the same share in 2023 with less than half that income (about US$13,100 in 2024), and Thailand (15.4% aged 65 and over, about US$6,600) is in a similar position. They must build pension and care systems while incomes are still middle-level: they are “getting old before getting rich”.
Sources: World Bank WDI (indicators SP.POP.65UP.TO.ZS and NY.GDP.PCAP.KD), 2026.
Pensions: in unfunded state pension systems, today’s workers pay for today’s pensioners, so a falling ratio of workers to retirees forces higher taxes, lower pensions or a later retirement age.
Healthcare and long-term care: chronic conditions such as dementia, heart disease and diabetes rise with age, and so does the need for nursing care, which is labour-intensive and expensive.
Labour shortages: Japan has had more job vacancies than job seekers every year since 2014; the average Japanese farmer is close to 70, and about a third of construction workers are over 55.
Rural decline and isolation: schools close and empty houses (akiya) spread in rural Japan; in the first half of 2024, 37,227 people living alone were found dead at home in Japan about three-quarters of them aged 65 or over.
Political effects: older voters are a growing share of electorates, so policy can favour pensions and healthcare over education, childcare or housing for the young.
Ageing also creates opportunities. Older people today are healthier and often wealthier than earlier generations, and their spending supports what is called the silver economy. Many keep working, volunteer, care for grandchildren (allowing parents to work) and pass on skills and experience.
Japanese firms lead in products for older people, from care robots to accessible housing, and export some of them; tourism on Spain’s Costa del Sol and in Florida depends heavily on retired residents. The opportunity is greatest where older people have savings and good health; where pensions are low, as in many middle-income countries, ageing brings more costs than spending power.
Governments cannot reverse ageing quickly: even a sudden rise in births would take 15–20 years to add workers. Policies therefore aim to adapt to an older population by keeping more people in work, paying for pensions and care, and using technology and migration to fill gaps. Most countries combine several approaches.
Approach | How it works | Examples |
|---|---|---|
Raising the retirement or pension age | People work longer, pay taxes for longer and draw a pension for fewer years. | Japan’s public pension age rising from 60 to 65 (men by 2025, women by 2030); Germany’s rising from 65 to 67 by 2031; China from 2025. |
Pension reform | Higher contributions, lower benefits or a shift from unfunded state pensions to personal savings accounts. | Singapore’s Central Provident Fund, a compulsory savings scheme for each worker. |
Employing older workers | Laws or incentives to keep older people in jobs, often part-time or re-employed on new terms. | Japan requires employers to offer work to 65 and, since 2021, to make efforts to employ people to 70; Singapore’s re-employment age of 68 (2022). |
Immigration of workers | Young migrants fill labour shortages, especially in care, construction and farming. | Japan’s Specified Skilled Worker visa (2019), including nursing care; Germany’s Skilled Immigration Act (2020). |
Automation and technology | Robots, digital health and adapted housing reduce the labour needed per older person. | Care robots and monitoring sensors in Japanese care homes. |
Healthy-ageing and care systems | Prevention keeps people healthy and independent for longer; insurance pays for care. | Japan’s long-term care insurance (2000); Singapore’s Healthier SG programme. |
Pro-natalist measures | More births in the long run, so a younger population later. | South Korea, Hungary, France (explained with pro-natalist policies). |
Japan has used almost every approach. Its long-term care insurance (2000) requires everyone over 40 to contribute and gives people over 65 access to home help, day centres and nursing homes. A retirement age of at least 60 became compulsory for employers in 1998; since 2013 employers have had to offer continued work up to 65, and since 2021 they have been asked to make efforts to keep people working to 70. Many Japanese people now work into their seventies, often in part-time or lower-paid roles.
Japan has also opened up, cautiously, to immigration: the Specified Skilled Worker visa (2019) admits foreign workers in sectors with shortages, including nursing care, many from Vietnam, Indonesia and the Philippines. Numbers remain small relative to the shortage, so Japan relies heavily on automation and on more women and older people working.
Germany is raising its standard pension age gradually from 65 to 67 between 2012 and 2031, and relies on immigration more than Japan: from other EU countries, refugees from Syria and Ukraine, and skilled workers under the Skilled Immigration Act (2020). Singapore raised its re-employment age, up to which employers must offer continued work, to 68 in 2022, and its compulsory savings scheme means each worker builds a personal retirement fund rather than depending on younger taxpayers.
China faces ageing at a lower income level. From January 2025 the retirement age is being raised gradually over 15 years, from 60 to 63 for men and from 50 or 55 to 55 or 58 for women. The change is unpopular with workers who expected to retire early, and it reduces the time grandparents can give to childcare.
Policy | Strengths | Limitations | Who gains and who loses |
|---|---|---|---|
Later retirement | Quick and cheap for governments; reflects longer healthy lives. | Unfair to manual workers in poor health, whose life expectancy is often shorter; politically unpopular. | Gains: taxpayers, younger workers. Loses: older manual workers. |
Immigration | Adds young workers immediately; often pays more in tax than it costs. | Migrants also age; political opposition; brain drain from origin countries. | Gains: employers, older people needing care. Loses: origin countries losing nurses and carers. |
Automation | Raises productivity; avoids political problems of migration. | Expensive; cannot replace human contact in care. | Gains: technology firms, exporters. Loses: low-skilled workers. |
Savings-based pensions | Sustainable whatever the age structure. | Low earners and people with interrupted careers (often women) save less. | Gains: high earners. Loses: people with low or irregular incomes. |
The most effective strategies combine measures, because each one deals with only part of the problem. Japan shows that a society can function with a very old population, but at the cost of slow economic growth, heavy public debt and a shrinking rural population. The power to choose the mix lies with governments, but its effects fall unevenly: young workers pay higher contributions, women often provide unpaid care, and migrant care workers fill the gaps on temporary contracts with limited rights.
Governments that think their population is growing too fast or too slowly may try to change the number of births. An anti-natalist policy aims to reduce fertility; a pro-natalist policy aims to raise it. Both can use incentives (rewards and services that make the desired choice easier) or coercion (restrictions and penalties).
Pro-natalist policy is the reverse, and is now the more common aim, especially in Europe and East Asia.
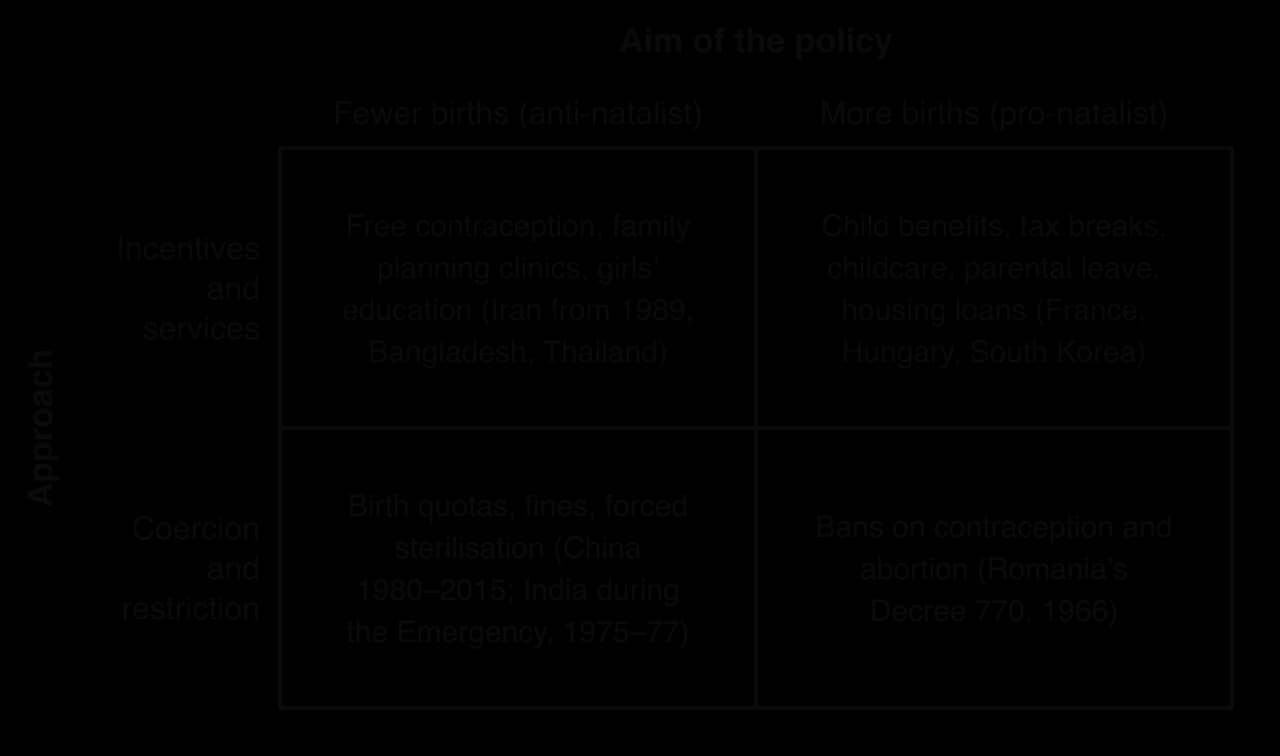
The one-child policy was the most far-reaching population policy ever introduced. China’s leaders feared that rapid population growth would prevent economic development: the population was about 980 million in 1980 and growing. The policy was formally introduced on 18 September 1980 and written into the constitution in 1982.
Rules: most urban couples could have one child. From the mid-1980s rural couples in many provinces could have a second child if the first was a girl, and ethnic minorities could have two or more. In 2007, 36% of the population faced a strict one-child limit and 53% could have a second child if the first was a daughter.
Enforcement: “social maintenance fees” of several times a family’s annual income, loss of jobs in state employment, and denial of household registration (hukou) to unauthorised children, which blocked access to schools and healthcare. Between 1980 and 2014, 324 million women were fitted with IUDs and 108 million were sterilised; in the early years many abortions were carried out under pressure.
Rewards: “one-child certificates” brought extra pay, better housing and priority in schooling for families who complied.
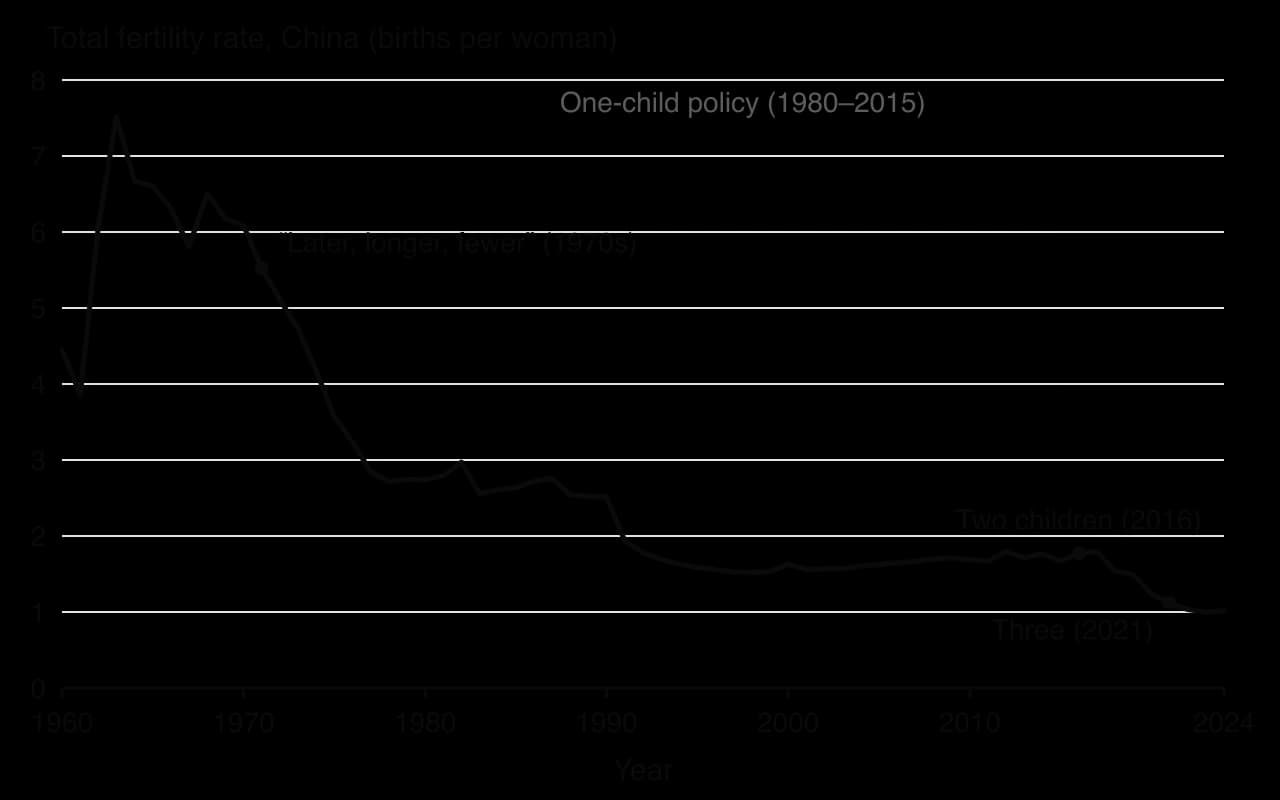
The government credits the policy with preventing about 400 million births. Many demographers dispute this: the chart shows that China’s TFR had already fallen from about 6 to 2.7 between 1970 and 1980, under the voluntary “later, longer, fewer” campaign (later marriage, longer gaps between births, fewer children), and that similar falls happened in countries without a one-child rule, such as Thailand and South Korea. A 2017 study concluded that the policy speeded up an existing decline for only a few years and that economic development was the more fundamental cause.
The side effects were large and long-lasting. The sex ratio at birth rose to about 117–118 and an estimated 30 million more men than women of marriageable age were expected by 2020. Many families now have a “4–2–1” structure: four grandparents, two parents and one child, who may one day have to support them all. Ageing has accelerated: births fell to 9.02 million in 2023, the lowest since the 1940s, and China’s population has fallen every year since 2022.
Relaxation came too late to reverse the trend. Couples could have two children from January 2016, three from May 2021, and all limits were lifted in July 2021. The government expected about 21.9 million births in 2018; there were 15.2 million. The reasons for low fertility had changed: high housing and education costs and long working hours, rather than the law, now limit family size.
Sources: Wikipedia, “One-child policy”, citing China’s National Bureau of Statistics and the National Health Commission, 2026; World Bank WDI, 2026.
Iran shows that a voluntary programme can lower fertility as fast as a coercive one. After the 1979 revolution the government at first encouraged large families, and TFR was about 6.6 in 1980. In 1989 it reversed course: it launched a national family planning programme with free contraception, mobile clinics in rural areas, compulsory pre-marriage classes on family planning, and religious leaders’ support. With rapid growth in girls’ education and literacy, TFR fell to 2.0 by 2000, one of the fastest falls ever recorded. Since the 2010s the government has again turned pro-natalist, but TFR remains about 1.7.
Bangladesh reduced fertility from 6.3 in 1980 to 2.1 in 2024 while it was still a low-income country. Its programme relied on thousands of female community workers who visited women at home, supplying contraception and advice, together with falling child mortality, microcredit and the growth of women’s employment in the garment industry.
India adopted the world’s first national family planning programme in 1952. During the Emergency of 1975–77, sterilisation targets led to millions of men being sterilised, many against their will, and the backlash contributed to the government’s defeat in 1977. India’s TFR fell below replacement (1.96) by 2024, mainly through education, urbanisation and voluntary contraception.
Pro-natalist policies are now far more common than anti-natalist ones. The share of countries with policies to raise fertility rose from 20% in 2005 to 28% in 2019, almost all of them in Europe and East Asia.
France has encouraged births for more than a century, first because of fears about its military strength against a faster-growing Germany.
Today its policy is a broad family policy: family allowances paid from the second child, an income tax system that lowers the tax paid as the number of children rises, long-standing subsidised childcare and free nursery school from age 3. France had the highest TFR in the European Union, 1.83 in 2020, which is often credited to making it easier for women to combine work and children.
Even so, its TFR fell to 1.61 in 2024 and about 1.56 in 2025, the lowest since the end of the First World War. In 2025 deaths (about 651,000) exceeded births (about 645,000) for the first time since the Second World War, so generous support has not held fertility at replacement level.
Hungary has spent heavily on family policy since 2010, explicitly as an alternative to immigration. Measures include large subsidised loans for young married couples that are partly or fully written off as more children are born, housing grants, extended childcare, and a lifetime income tax exemption for mothers of four or more children (from 2020). TFR rose from 1.23 in 2011 to 1.63 in 2021, one of the largest rises in Europe, but fell again to 1.41 in 2024. Critics argue that part of the rise came from couples having children earlier, not more children, and that the benefits favour married, better-off families.
South Korea shows the limits of pro-natalism. Since its first Basic Plan for Low Fertility and Aged Society in 2006 it has funded childcare, cash payments, fertility treatment and parental leave, planning to spend 19.7 trillion won (about US$13.8 billion) on its priorities in 2025, yet TFR fell from 1.13 in 2006 to 0.72 in 2023. Cash does not easily fix the causes: housing costs, competition in education, long working hours and unequal sharing of childcare.
 YouTube
China has moved from restricting to encouraging births within a decade: local governments offer cash payments, longer maternity leave and housing benefits, and in 2025 a national childcare subsidy for children under 3 began. Births have kept falling, because the generation of potential mothers is smaller (a result of the one-child policy) and young adults face high costs and insecure jobs.
Romania’s Decree 770 of 1966 banned abortion and contraception for most women. TFR almost doubled, from 1.90 in 1966 to 3.66 in 1967, but fell back to 2.44 by 1973 as women turned to illegal abortions, and maternal deaths rose sharply. The policy is the clearest example of how coercion can change behaviour briefly, at great human cost, without changing the underlying reasons for small families.
The table brings the pro-natalist examples together, so that their methods and results can be compared.
Country | Main measures | Change in TFR | Judgment |
|---|---|---|---|
France | Family allowances, tax relief for larger families, subsidised childcare, nursery school from age 3 | 1.83 (2020) to 1.61 (2024) | Kept fertility the highest in the EU for years, but has not held it at replacement |
Hungary (from 2010) | Loans written off as children are born, housing grants, income tax exemption for mothers of four or more | 1.23 (2011) to 1.63 (2021), then 1.41 (2024) | A real rise, partly births brought forward; favours married, better-off couples |
South Korea (from 2006) | Childcare, cash payments, fertility treatment, parental leave | 1.13 (2006) to 0.72 (2023), 0.75 (2024) | Large spending with little effect, because the causes (costs, work culture) are untouched |
China (from 2016) | Two-, then three-child limits, then no limits; local cash and leave; national childcare subsidy (2025) | About 1.8 (2016) to 1.0 (2024) | Births kept falling; the generation of potential mothers is smaller |
Romania (1966) | Ban on abortion and contraception | 1.90 (1966) to 3.66 (1967), then 2.44 (1973) | A brief rise at great human cost |
Sources: World Bank WDI (UN World Population Prospects 2024), 2026; Wikipedia, “Natalism” (UN World Population Policies), 2026; Al Jazeera, 26 February 2025 (South Korea); INSEE, Bilan démographique 2025, January 2026 (France).
Fertility depends mainly on the costs and benefits of children as families see them: housing, education, jobs, gender roles. Policies that do not change these have small effects.
Payments are small relative to the cost of raising a child to adulthood, so they may change the timing of births more than their number.
Population momentum: a large or small generation of parents keeps births high or low for decades whatever the policy.
Trust and timing: a policy reversal (China, Iran, Vietnam) takes years to change expectations that earlier policies helped to create.
Coercive policies can work quickly but violate human rights, cause lasting side effects (sex ratios, ageing) and often provoke resistance.
Anti-natalist policies usually work with the forces that already reduce fertility (urbanisation, girls’ education, falling child mortality) by giving people the means to have the smaller families they want. Pro-natalist policies work against those forces, which is why even generous programmes in France, Hungary and South Korea have not restored replacement-level fertility.
Gender equality means that women and men have equal rights, responsibilities and opportunities. It is a goal in itself, a matter of equity, and it also has strong demographic effects, because women’s education, health and work shape family size, the sex ratio and the success of a demographic dividend.
Type of policy | Examples | Demographic effects |
|---|---|---|
Girls’ education | Bangladesh’s Female Secondary School Stipend Programme (from 1994); free secondary schooling | Later marriage and first births, lower fertility, lower child mortality |
Legal reform | Raising the minimum age of marriage; equal inheritance rights; laws against sex-selective abortion in India from 1994 | Less child marriage, weaker son preference, more balanced sex ratios |
Political representation | Rwanda’s constitution (2003) reserves at least 30% of parliamentary seats for women; women held 63.75% of seats in 2024 | More attention to health, education and family policy |
Equal pay and work | Iceland’s equal pay certification law (2018) requires employers to prove they pay women and men equally | Women can combine work and family; can support fertility in HICs |
Shared parental leave | Paid leave reserved for fathers in Sweden and Norway; South Korea’s 2025 parental leave pay | Fathers share childcare, which is associated with higher fertility in low-fertility HICs |
Sources: World Bank WDI (SG.GEN.PARL.ZS), 2026.
The effect of gender equality on fertility depends on the stage of development. In high-fertility countries, education and paid work for women lower fertility, because they raise the opportunity cost of children and give women more say in decisions. In very low-fertility countries, greater equality at home may raise fertility: where women work full time and also do most of the childcare, as in South Korea and Japan, many delay or avoid having children, while countries where men share care, such as Sweden and France, have higher fertility.
Gender equality policies also change the balance of power. Women’s representation in Rwanda’s parliament, which was 48.75% in 2003, rose to a majority from 2008; the world average in 2024 was 27%. Gender inequality as a measure of development, including the Gender Inequality Index, is studied in detail as part of human development.
Human trafficking is a form of forced migration and exploitation. It is linked to population change in several ways: skewed sex ratios create demand for trafficked brides, labour shortages in ageing countries create demand for cheap labour, and poverty and conflict in places of origin make people vulnerable to deception.
The international definition, in the UN Palermo Protocol, has three parts: an act (recruiting, moving or holding a person), a means (force, fraud, deception, coercion or abuse of vulnerability) and a purpose (exploitation). A victim’s consent does not matter if any of these means was used, and for a child no means need be shown at all. Trafficking does not require crossing a border: much of it happens within countries. It is a different crime from people smuggling, with which it is often confused.
Human trafficking | People smuggling | |
|---|---|---|
Consent | No real consent (force, fraud or coercion) | The migrant agrees and usually pays |
Purpose | Exploitation of the person | Profit from moving the person |
Border | Not needed: can be within one country | Always involves crossing an international border irregularly |
After arrival | Exploitation continues | Relationship usually ends |
Crime against | The person | The state (its border laws) |
Because trafficking is hidden, only a small fraction of victims are detected. The UN Office on Drugs and Crime’s (UNODC) Global Report on Trafficking in Persons 2024 found victims of at least 162 nationalities in 128 countries. Forced labour (42% of detected victims) has overtaken sexual exploitation (36%); children made up 38%, and detected child victims had risen by 31% since 2019. Most victims are women and girls, while about 70% of convicted traffickers are men.
Sources: UNODC, Global Report on Trafficking in Persons 2024, via Wikipedia, “Human trafficking”, 2026.
Anti-trafficking policies follow the “3Ps” of the Palermo Protocol: prevention, protection of victims and prosecution of traffickers, with partnership between governments, NGOs and businesses often added as a fourth.
International law: the Palermo Protocol, adopted by the UN General Assembly in 2000 as part of the UN Convention against Transnational Organized Crime, had 185 parties by 2025. It requires states to make trafficking a crime and to protect victims.
National laws: the United States’ Trafficking Victims Protection Act (2000) and the United Kingdom’s Modern Slavery Act (2015), which also requires large companies to report on forced labour in their supply chains.
Monitoring and pressure: the US State Department’s annual Trafficking in Persons Report places every country in a tier (Tier 1, Tier 2, Tier 2 Watch List, Tier 3) according to its efforts; Tier 3 countries, such as Belarus, Iran, Russia and Turkmenistan in recent editions, can face restrictions on some US aid.
NGOs and civil society: awareness campaigns in source areas, hotlines, shelters and legal help for victims, and work with employers to remove forced labour from supply chains.
Anti-trafficking policies face major limits. Victims, especially undocumented migrants who fear deportation, are often afraid to come forward, and convictions are few compared with estimated victims. Some campaigns focus on sexual exploitation and neglect forced labour in farming, fishing and domestic work, and policies that restrict legal migration can push people towards smugglers who may become traffickers. Trafficking as an illegal global flow is studied further as part of global networks and flows.
On balance, anti-trafficking policy has been most effective in law and least effective in practice. Almost every country now treats trafficking as a crime, and supply-chain reporting rules have made companies look for forced labour, but the number of victims identified remains small compared with estimates of the hidden total. Policies work best where prevention (safe, legal routes for migrant workers and fair recruitment) is combined with protection, so that victims can come forward without fear of being deported.
When fertility falls, a country’s age structure changes in a predictable sequence. First the number of children stops growing while the large generations born earlier reach working age. For several decades the working-age population grows faster than the dependent population, and the dependency ratio falls. This creates the possibility of a demographic dividend.
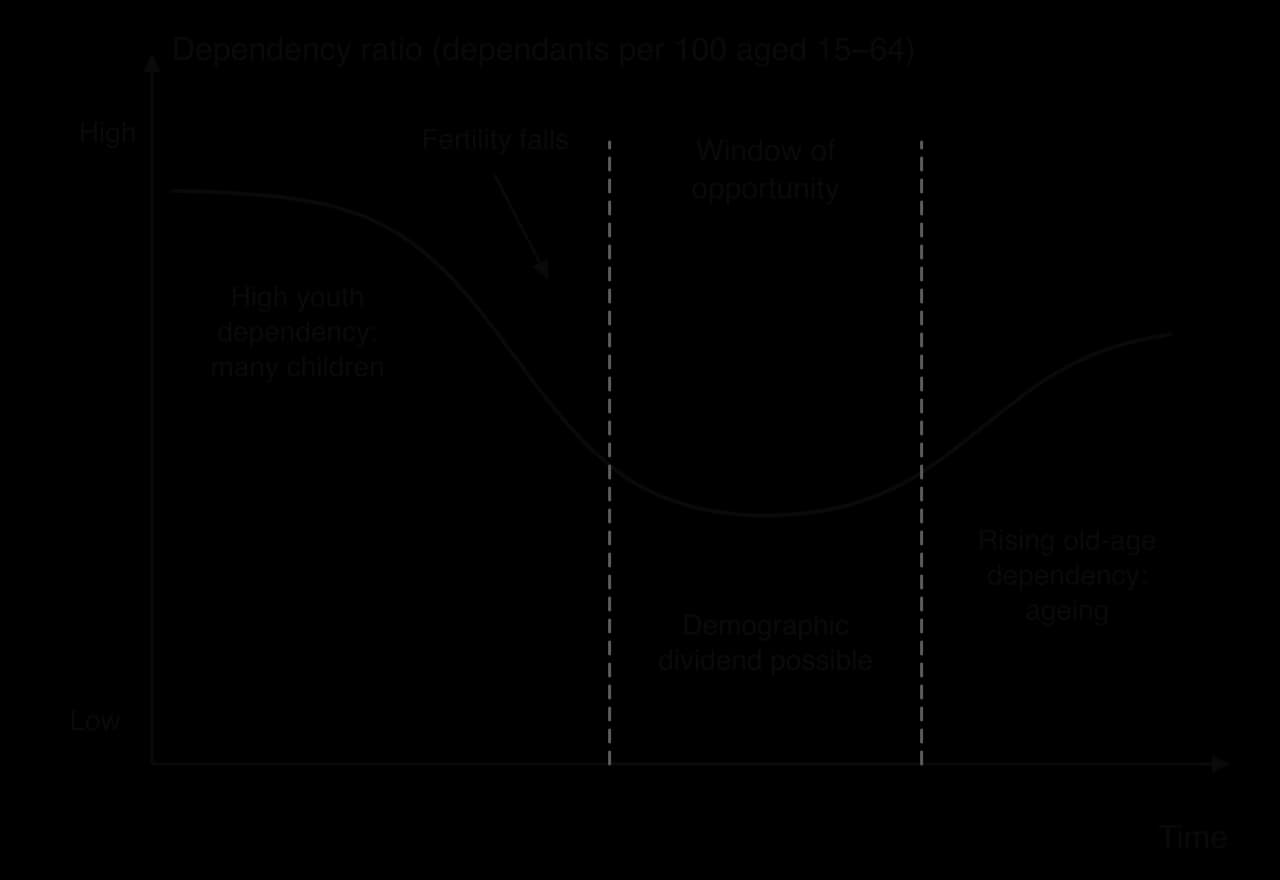
The period during which the dependency ratio is at its lowest is the demographic window of opportunity. It opens when the share of children falls (a common marker is when the total dependency ratio drops below about 50, or when under-15s fall below 30% of the population) and closes when the share of older people rises again. It usually lasts about 30–50 years, and it happens only once.
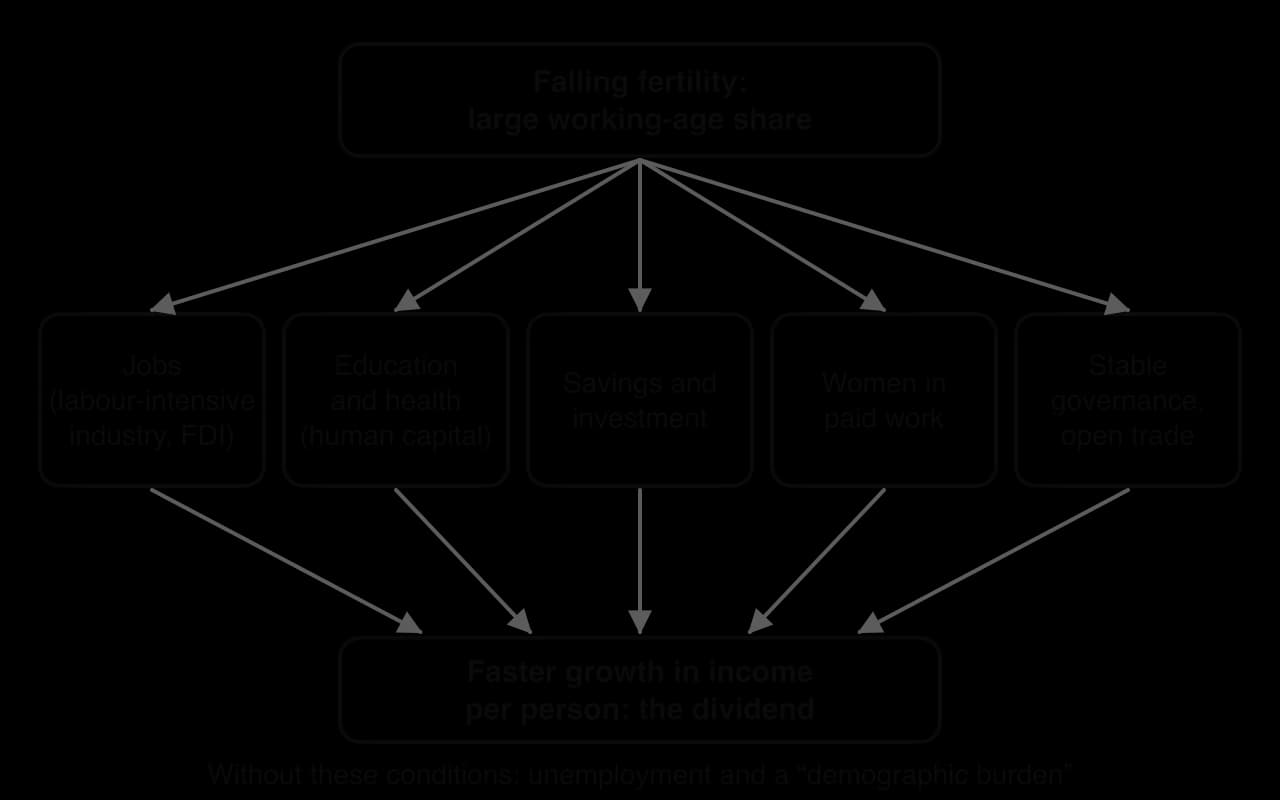
A larger working-age share does not automatically produce growth. The dividend works through four mechanisms, each of which depends on policy.
Labour supply: more people are of working age, and women with fewer children are more able to take paid work. The extra workers raise output only if there are jobs for them.
Savings and investment: households with fewer dependants can save more, and governments spend less per person on schooling, so more money is available to invest in factories, infrastructure and housing.
Human capital: with fewer children, families and governments can spend more on each child’s health and education, so each worker becomes more productive.
Domestic demand: rising incomes per person increase spending on consumer goods and services, which supports further investment.
 YouTube
The East Asian economies are the classic example. Economists David Bloom and Jeffrey Williamson estimated that the demographic dividend accounted for about one-quarter to two-fifths of the rapid growth of the East Asian “tiger” economies (South Korea, Taiwan, Hong Kong and Singapore) between the 1960s and the 1990s. These economies combined falling fertility with mass education, high savings, export-led industrialisation and openness to trade and investment.
If the extra workers cannot find productive jobs, the same age structure becomes a burden. Large numbers of young adults without work can mean emigration, a large informal sector, frustration and political instability. Parts of North Africa and the Middle East had a “youth bulge” of 15- to 29-year-olds making up about 30% of the population in the 2000s and 2010s, and high youth unemployment was one of the underlying causes of the protests of 2010–2011.
The window also closes. As the large working-age generations retire, the dependency ratio rises again, sometimes called a “demographic tax”. China’s dependency ratio rose from 37 in 2011 to 45 in 2022 as its window began to close; Japan’s window closed in the 1990s. Some economists describe a possible second dividend: an older population that has saved for retirement can invest its savings, raising productivity, if pension systems encourage saving rather than relying only on taxes on younger workers.
Population growth is often presented as a problem, but people are also a resource: they are workers, consumers, inventors, taxpayers and carers. Whether a population is a resource or a pressure depends less on its size than on its human capital and on how well a society uses it.
Workers and skills: a young, educated population attracts investment, as India’s technically trained workforce has done for software and business services.
Markets: a large population is a large market: Nigeria had 233 million people in 2024.
Innovation: more people, and more people concentrated in cities, can mean more ideas. The economist Ester Boserup argued that population pressure drives agricultural innovation, an optimistic view of population and resources known as Boserup’s theory, in contrast with Malthusian pessimism.
Diaspora and remittances: emigrants send money home and spread skills and business links; the Philippines has turned the training of nurses and seafarers for work abroad into a national strategy.
Population becomes a pressure when it grows faster than jobs, services and infrastructure, or when it is concentrated where resources are scarce. The same number of people can be a resource in one place and a burden in another, which is why the key concept of place matters: Bangladesh’s large, young population is a strength for its garment industry but also increases its exposure to flooding and cyclones.
Ageing and youthful countries can exchange labour. Ageing countries need workers, especially in care, health, farming and construction; youthful countries need jobs for their growing working-age populations. International migration can therefore act as a balancing flow between places at different stages of the demographic transition.
Flow | Benefit to the destination | Benefit to the origin | Costs and concerns |
|---|---|---|---|
Filipino nurses to the UK, USA and Gulf | Fills shortages in ageing health systems | Remittances; training industry; skills on return | Brain drain from Philippine hospitals |
Vietnamese and Indonesian care workers to Japan | Care for an ageing population | Income and skills | Temporary contracts, language barriers, limited rights |
South Asian workers to the Gulf | Labour for construction and services | Remittances to Nepal, Bangladesh, India | Male-dominated sex ratios; abuse of workers; families separated |
Migration slows ageing but does not stop it, because migrants also grow old and their fertility usually falls to the level of the host country within a generation. A UN study of “replacement migration” in 2000 calculated that keeping Japan’s ratio of workers to older people constant through immigration alone would need migrant numbers far beyond anything politically likely, so migration can only be one part of a response to ageing.
Migration also shows power between places: origin countries depend on remittances and compete to supply labour, while destination countries set the rules on entry, rights and settlement.
A population projection estimates future population from assumptions about fertility, mortality and migration. Projections are not forecasts of certain outcomes: they show what would happen if the assumptions held, and different assumptions produce different futures.
The UN’s World Population Prospects 2024, the most widely used projections, estimated the world population at nearly 8.2 billion in mid-2024. In its medium variant, population grows by about 2 billion over the next 60 years to a peak of about 10.3 billion in the mid-2080s, then falls slightly to about 10.2 billion by 2100, about 700 million fewer than projected a decade earlier. In 2024, 63 countries and areas, including China, Germany, Japan and Russia, had already passed their population peak, and their combined population is projected to fall by 14% over the next 30 years.
Projection | Peak world population | Year of peak | Population in 2100 |
|---|---|---|---|
UN World Population Prospects 2024 (medium variant) | About 10.3 billion | Mid-2080s | About 10.2 billion |
IHME, University of Washington (2020) | 9.73 billion | 2064 | 8.8 billion |
IIASA / Wittgenstein Centre (earlier projection) | 9.4 billion | 2070 | 9.0 billion |
Sources: UN News, 11 July 2024 (World Population Prospects 2024); Wikipedia, “Projections of population growth”, 2026.
The projections differ mainly in their assumptions about how fast fertility will fall in sub-Saharan Africa. IHME assumes faster progress in girls’ education and access to contraception, so it projects about 3.1 billion people in sub-Saharan Africa in 2100, fewer than the UN’s medium variant. The further ahead a projection looks, the wider the uncertainty: almost everyone who will be over 65 in 2050 is already alive, but the size of the generation born after 2050 depends on decisions not yet made.
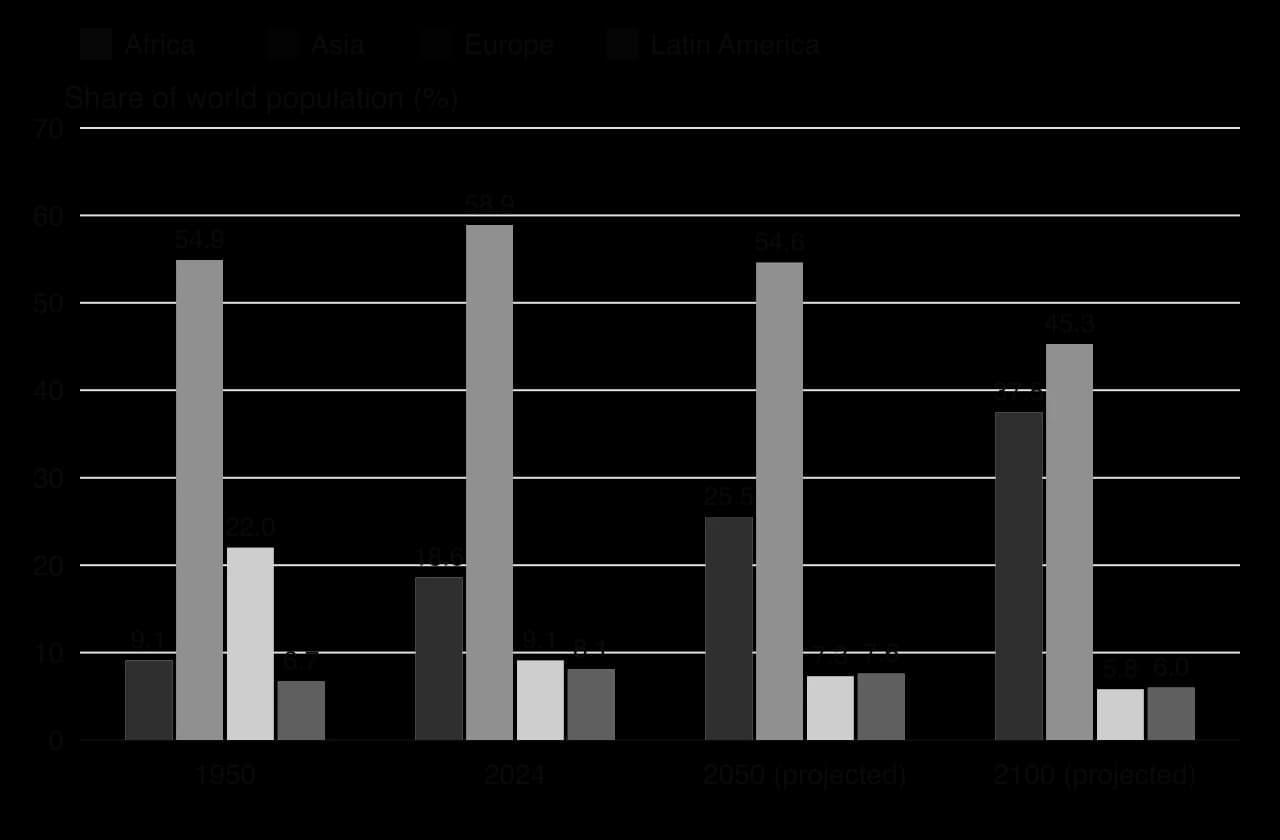
The chart shows a large shift in the global distribution of people. In 1950 Europe held more than one-fifth of the world’s population; by 2100 it is projected to hold under 6%. Asia’s share peaks around now and declines as China’s population falls, from 1.42 billion in 2024 to a projected 633 million in 2100. Africa’s share rises from 18.6% in 2024 to 37.5% in 2100, and Nigeria alone may have 477 million people.
Population size is one source of power: it provides workers, soldiers, consumers and influence in international organisations. India passed China as the world’s most populous country in 2023, and countries such as Nigeria, the DRC and Ethiopia will have larger shares of the world’s young workers and consumers. Power does not follow population automatically, though: it also depends on human capital, technology and wealth, so Africa’s growing share becomes power only if its young people are educated and employed.
Between generations: in ageing democracies, older voters are a growing majority. In Japan more than half of the adult population is over 50, which increases the political weight of pensions and healthcare compared with childcare and education.
Between women and men: falling fertility and more education give women more choice and economic power; skewed sex ratios can reduce some women’s security and increase trafficking risk.
Between regions within a country: young people migrate to cities, so rural regions age, shrink and lose political representation and services, while cities gain.
Between ethnic or religious groups: different fertility or migration rates change the relative size of groups, which can become politically sensitive where power-sharing is based on population, as in Lebanon, whose last full census was held in 1932.
These shifts appear at the local scale as closing rural schools and new care homes, at the national scale as pension reform and immigration debates, and at the international scale as changing economic weight and flows of workers.
Vietnam, a country of about 101 million people in South-East Asia, is one of the clearest recent examples of a country benefiting from a demographic dividend. In two generations it has moved from a poor, mainly rural economy recovering from war to a middle-income exporter of electronics and clothing, and it joined the World Bank’s upper-middle-income group in the July 2026 update. Its working-age population is now close to its peak, so Vietnam also shows how a window of opportunity begins to close.
Vietnam’s TFR fell from 5.6 in 1975 to 2.7 in 1995 and 1.9 by 2005, and stayed about 2 until the early 2020s. The decline was helped by a two-child policy introduced in 1988, which penalised Communist Party members and public employees with larger families and removed some subsidies from families with a third or fourth child, but also by rapid falls in child mortality, girls’ education and, after 1986, economic reform.
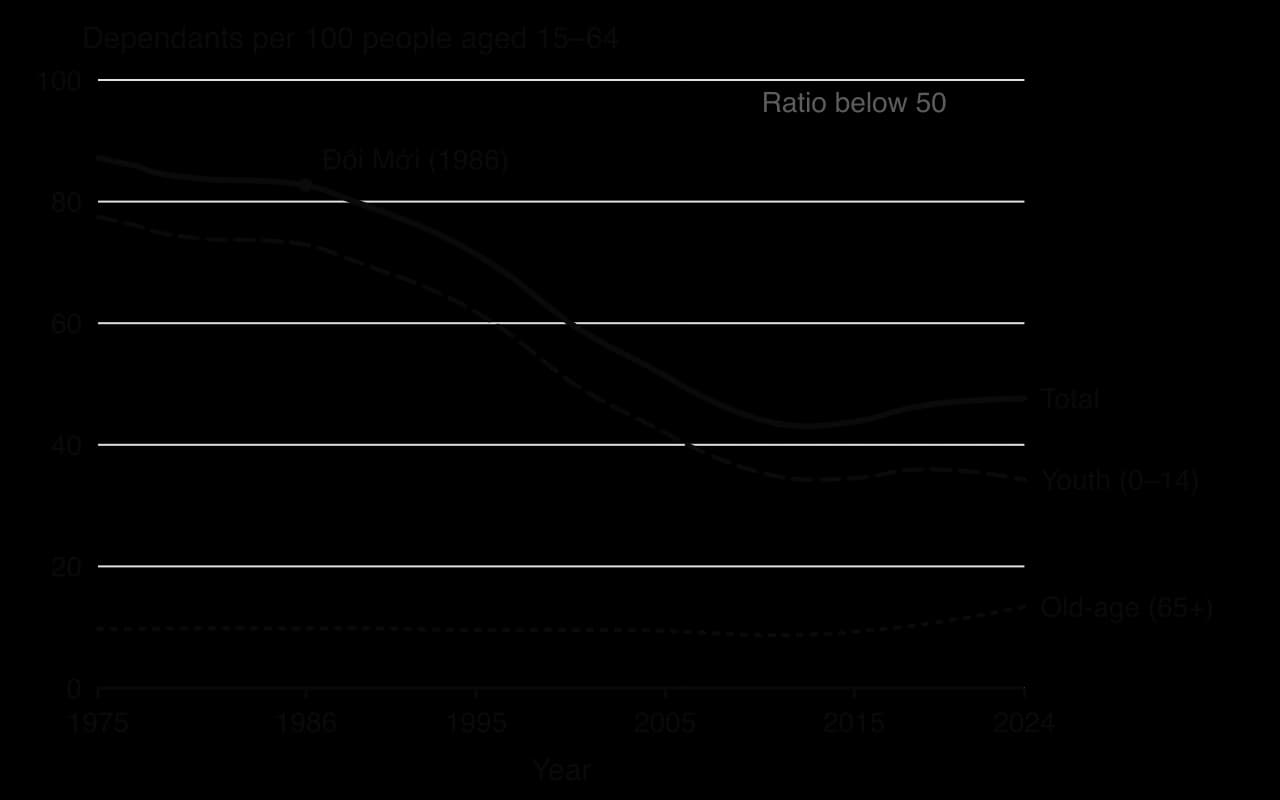
As fertility fell, the dependency ratio fell from 87 dependants per 100 people of working age in 1975 to 43 in 2012, and it has stayed below 50 since 2006. The working-age share of the population rose from 53% in 1975 to about 70% in 2010, and the labour force grew from 31.5 million in 1990 to 56.7 million in 2024. This large, young and increasingly educated workforce coincided with a period of economic reform.
The Đổi Mới (“renovation”) reforms of 1986 moved Vietnam from a centrally planned economy towards a “socialist-oriented market economy”, allowing private businesses, opening the country to foreign investment and encouraging exports. Vietnam joined ASEAN’s free trade area, normalised relations with the United States in 1995 and joined the World Trade Organization in 2007. Net inflows of foreign direct investment rose from US$180 million in 1990 to US$20.2 billion in 2024, much of it from TNCs from South Korea, Japan, Taiwan and China building factories for electronics, clothing and footwear.
These factories needed exactly what the age structure offered: millions of young, literate workers, many of them women who were having fewer children. Electronics rose from 14% of exports in 2010 to 38% in 2020, and exports of goods and services rose from 36% of GDP in 1990 to 90% in 2024. Gross secondary school enrolment reached about 93% by 2020, and about 69% of women were in the labour force in 2024, one of the highest rates in the world.

Economic growth averaged about 7% a year from the 1990s, and GDP per capita (constant 2015 US$) rose from US$688 in 1990 to US$4,013 in 2024. The share of people living below the international poverty line of US$3.00 a day (2021 PPP) fell from 57.5% in 1992 to 1.6% in 2022. Life expectancy rose from 69 years in 1990 to about 75.
Indicator | Around 1990 | Latest | Change |
|---|---|---|---|
Total fertility rate (births per woman) | 3.6 (1990) | 1.9 (2024) | Below replacement |
Dependency ratio (per 100 aged 15–64) | 78 (1990) | 48 (2024) | −30 points |
Labour force (million) | 31.5 (1990) | 56.7 (2024) | × 1.8 |
GDP per capita, constant 2015 US$ | 688 (1990) | 4,013 (2024) | × 5.8 |
Poverty at US$3.00 a day (% of population) | 57.5 (1992) | 1.6 (2022) | −55.9 points |
Exports (% of GDP) | 36 (1990) | 90 (2024) | × 2.5 |
Sources: World Bank WDI, 2026 (indicators SP.DYN.TFRT.IN, SP.POP.DPND, SL.TLF.TOTL.IN, NY.GDP.PCAP.KD, SI.POV.DDAY, NE.EXP.GNFS.ZS).
The benefits have been large but uneven. Industrial growth has been concentrated in and around Ho Chi Minh City, Hanoi and the provinces of the Red River Delta and the south-east, which attract internal migrants from the Mekong Delta and the northern uplands. Poverty remains highest among ethnic minority groups in the northern mountains and the Central Highlands. Many factory jobs are low-paid assembly work for foreign-owned firms, and a large share of the value of Vietnam’s electronics exports comes from imported components, so the country depends on decisions made by TNCs and on access to markets such as the United States, which took 29.5% of its exports.
Vietnam is now ageing quickly. Its median age rose from 22.7 in 2000 to 32.9 in 2024 and is projected to reach 40.2 by 2050, and 9.0% of the population was aged 65 and over in 2024. The World Bank expects the working-age population to peak around 2040. TFR fell to a record low of 1.91 in 2024, and to 1.39 in Ho Chi Minh City, where housing and education costs are highest. The sex ratio at birth was about 111 boys per 100 girls, and the General Statistics Office’s population forecast of 2026 projects 711,700 more men than women aged 20–39 by 2034.
In early June 2025 the government scrapped the two-child policy so that couples can have as many children as they choose, an attempt to avoid “getting old before getting rich”. Like China, South Korea and Thailand before it, Vietnam is moving from limiting births to encouraging them, and it must build pension and care systems for a much older population while incomes are still middle-level.
Key concept | How Vietnam’s case shows it |
|---|---|
Possibility | The falling dependency ratio opened a window that could have led to growth or to unemployment; policy and investment decided which. |
Power | The state set fertility policy (two-child policy 1988–2025) and economic policy (Đổi Mới); foreign TNCs decide where factories go; ethnic minorities and rural areas have less influence over the benefits. |
Process | Fertility decline → falling dependency → more workers and savings → FDI and exports → rising incomes → further fertility decline and ageing. |
Place | Gains are concentrated in the Red River Delta and around Ho Chi Minh City; the uplands and Mekong Delta lag behind. |
Sources: World Bank WDI, 2026; Al Jazeera, 5 June 2025; General Statistics Office, Vietnam Population Forecast 2024–2074, via VietNamNet, 7 July 2026; Wikipedia, “Economy of Vietnam”, 2026; UN World Population Prospects 2024 via Our World in Data, 2026.
To what extent was Vietnam’s economic growth caused by its changing age structure rather than by the Đổi Mới reforms and foreign investment?
Suggest why Vietnam’s government removed the two-child policy in 2025 although TFR (1.91) was only slightly below replacement level.
Examine which groups and places in Vietnam have gained most from the demographic dividend, and why.
Population trends, policies and the demographic dividend appear in Paper 2 as a Section A structured question on Unit 1 ([2], [2+2], [2+2]), possibly in the Section B infographic, and in Section C essays, where the best answers link population to resources and climate change.
Structured parts are marked point by point, so the number of marks shows how many separate, developed points are needed.
The table shows population indicators for six countries in 2024.
Country | Total fertility rate (births per woman) | Population aged 65 and over (%) | Median age (years) |
|---|---|---|---|
Niger | 5.9 | 2.6 | 15.4 |
Nigeria | 4.4 | 3.0 | 17.9 |
India | 2.0 | 7.1 | 28.4 |
Vietnam | 1.9 | 9.0 | 32.9 |
South Korea | 0.75 | 19.3 | 45.1 |
Japan | 1.15 | 29.8 | 49.4 |
Sources: World Bank WDI (UN World Population Prospects 2024), 2026; UN World Population Prospects 2024 via Our World in Data, 2026.
Part (b) asks for suggestions; the reasons need not be in the table but must fit the countries named.
Part (c) usually moves beyond the stimulus to the wider topic.
An infographic titled “East Asia: from too many children to too few” shows:
a line graph of the total fertility rate for China (2.7 in 1980, 1.0 in 2024), South Korea (2.8 in 1980, 0.75 in 2024) and Japan (1.75 in 1980, 1.15 in 2024);
icons showing the share of people aged 65 and over in 2024: Japan 29.8%, South Korea 19.3%, China 14.7%;
a timeline of policy changes: China’s one-child policy 1980, two children 2016, three children and then no limits 2021; South Korea’s first Basic Plan on low fertility 2006; Japan’s long-term care insurance 2000;
a photograph of an elderly man working as a car-park attendant in Tokyo (described for this exercise).
Sources: Infographic data: World Bank WDI (UN World Population Prospects 2024), 2026.
Part (b) needs a point linked to the infographic and a development.
Part (c) needs evidence from the infographic on both sides of the argument, then an overall judgment.
Section C essays reward a clear argument on both sides, detailed examples and synthesis with other parts of the course, ending in a judgment that answers the question at the extent asked.
Family size is falling almost everywhere: world TFR fell from 4.7 in 1960 to 2.2 in 2024, and more than half of countries are below replacement level (2.1); sub-Saharan Africa (4.3) remains the main exception.
Fertility falls with lower child mortality, girls’ education, women’s paid work, urbanisation and access to contraception; East Asia now has ultra-low fertility (South Korea 0.75).
The natural sex ratio at birth is about 105; son preference and sex-selective abortion raised it to about 118 in China; migration distorts whole-population ratios, as in Qatar (about 248 males per 100 females).
Ageing results from low fertility and longer lives; it strains pensions, care and labour supply but creates a silver economy. Middle-income countries such as China and Vietnam are ageing before they are rich.
Ageing policies include later retirement, pension reform, immigration, automation and care insurance (Japan, Germany, Singapore, China); none reverses ageing, so countries combine them.
Anti-natalist policies (China 1980–2015, Iran from 1989, Bangladesh) have usually met their aims, especially voluntary ones; pro-natalist policies (France, Hungary, South Korea, China since 2016) have had limited effects.
Gender equality policies change fertility and power; anti-trafficking policies follow the Palermo Protocol’s prevention, protection and prosecution. Trafficking exploits people; smuggling moves consenting people across borders.
A demographic dividend is possible when falling fertility lowers the dependency ratio, but it depends on jobs, human capital, savings and governance; Vietnam earned one after Đổi Mới and its window is now closing.
Population projections show possible futures with uncertainty (UN: a peak of about 10.3 billion in the mid-2080s); Africa’s rising share and ageing electorates are shifting power between regions and generations.
I can describe global and regional trends in family size, sex ratios and ageing, quoting TFRs, sex ratios, median ages and the share aged 65 and over.
I can explain why fertility, sex ratios and ageing differ between regions, with named examples.
I can determine a sex ratio, a dependency ratio and a percentage change, with units and steps.
I can examine the challenges and opportunities of ageing, including the silver economy.
I can evaluate policies for ageing societies in Japan, Germany, Singapore and China.
I can distinguish pro-natalist from anti-natalist policies and evaluate China’s one-child policy, Iran’s family planning and South Korea’s pro-natalism.
I can explain gender equality and anti-trafficking policies, and distinguish human trafficking from people smuggling.
I can explain the demographic dividend and its conditions, using Vietnam as a case study.
I can discuss how population is a resource and how population change shifts power at local, national and international scales.
In low-income countries such as Niger or Chad, infectious, maternal and nutritional causes still dominate, consistent with early stages, but non-communicable diseases are rising in their cities.
Good answers may be well structured (AO4) and may additionally offer a critical evaluation (AO3) which concludes that the model describes the general direction of change well, especially for high-income countries, but is less useful for predicting the timing or sequence of change elsewhere, because it is based on the historical experience of Western countries. Another approach might be to consider scale, as different groups within one country may be at different stages, or time, as the pace of transition has accelerated.
For 5–6 marks, expect some weakly-evidenced outlining of the model and one or more countries.
For 7–8 marks, expect a structured account which includes:
either well-evidenced explanation of how far the model applies to countries at contrasting stages of development
or a discursive conclusion (or ongoing evaluation) grounded in geographical concepts and/or perspectives.
For 9–10 marks, expect both of these traits.
NB. Maximum [5] if countries at only one stage of development are considered.
Marks | Level descriptor |
|---|---|
0 | The response does not reach a standard described by the descriptors below. |
1–2 | Too brief, lists unconnected information, not focused on the question and lacks structure. Knowledge is very general, with large gaps or errors; examples or case studies are missing or only listed. No analysis; terminology is missing or used incorrectly. |
3–4 | Too general, lacks detail, not focused on the question and largely unstructured. Outlines examples, statistics and facts, both relevant and irrelevant, with links to the question only listed. Basic terminology is used, with errors or inconsistently. No critical evaluation of evidence; any conclusion is irrelevant. |
5–6 | Partially addresses the question, with a narrow argument, an unsubstantiated conclusion and limited evaluation. Describes relevant supporting evidence (examples, case studies) and outlines links to the question. The argument repeats one point or covers only part of the question. Other perspectives, or strengths and weaknesses of evidence, are listed. |
7–8 | Addresses the whole question; the analysis is evaluated and the conclusion is relevant but lacks balance. Relevant evidence is described correctly and covers all the main points. The argument is clear but one-sided or unbalanced. Complex terminology is used correctly but not consistently. Other perspectives, or strengths and weaknesses of evidence, are described. |
9–10 | In-depth and specific to the question (topic and command term). Correct, relevant examples, statistics and detail are integrated and their link to the question explained. The argument is balanced, explaining complexity, exceptions and comparisons. Evaluation of evidence and perspectives is well developed, and the conclusion is balanced and aligned with the evidence. Logically structured and easy to follow. |
Examine the implications of a global ageing population for the burden of disease at different scales.
10 marks
Evaluate the view that the growing disease burden of ageing populations will be a greater challenge for middle-income countries than for high-income countries.
10 marks