1 Changing population
See how the three parts of the unit fit together, from where people live to the policies and possibilities of population change, with the case studies, key concepts, SL/HL arrangement and Paper 2 questions.
- IB Geography
- SL and HL
What 1 covers
From the subject guide: what you need to know and be able to do.
Core: population patterns, migration and the challenges and opportunities of population change.
3 subtopics in Changing population
Each one has its own page once something is published for it.
- 1.1Population and economic development patterns159 questions · notes
- 1.2Changing populations and places177 questions · notes
- 1.3Challenges and opportunities115 questions · notes
An overview of 1 Changing population
The changing population unit studies how the world’s 8.2 billion people are distributed, why their numbers and structure change, and what those changes make possible. Population sits at the base of the whole core: how many people there are, where they live and how old they are shape the demand for resources and who is most exposed to climate change.
Questions that frame the unit
Each subtopic answers one broad geographic question. The first asks how population varies between places, and how flows of people and money connect them. The second asks how the processes of population change affect people and places, from a megacity to a refugee camp. The third asks what population futures are possible and who holds power over the decisions that shape them.
Behind these inquiries lie real questions about real places:
Why do about two-thirds of Australians live in the eight state and territory capitals, all but Canberra on the coast, while Java holds about 56% of Indonesia’s people on 7% of its land?
Why would Niger’s population double in about 21 years at its 2024 rate of natural increase, while Japan’s is already shrinking?
Why do most of the people who have fled the war in Sudan since 2023 remain inside the country or in its low- and lower-middle-income neighbours, Chad, South Sudan and Egypt?
Why has South Korea’s fertility fallen to 0.75 children per woman despite almost twenty years of spending to raise it?
Can Vietnam become rich before it grows old?
What the unit covers
Subtopic | Main question | Case study and detailed examples |
|---|---|---|
1.1 Population and economic development patterns | Why is population distributed so unevenly, and how do income and development vary between and within countries? | Case study: Australia, an arid interior and a coastal, metropolitan core. Detailed example: Indonesia, Java’s core and the transmigration programme. Short examples: Egypt’s Nile, China’s Hu line and hukou, Brazil’s core–periphery pattern |
1.2 Changing populations and places | How do births, deaths and migration change populations, and with what consequences for people and places? | Case study: Dhaka, a megacity growing faster than its services. Contrasting countries: Niger and Japan. Forced movements: the war in Sudan since 2023 and the Horn of Africa drought, 2020–2023 |
1.3 Challenges and opportunities | What do falling fertility, skewed sex ratios and ageing mean for societies, and can policy change them? | Case study: Vietnam’s demographic dividend. Detailed examples: China’s one-child policy; Iran and Bangladesh; France, Hungary and South Korea; ageing policy in Japan, Germany, Singapore and China |
How the subtopics connect
The three subtopics form a chain, from where people live and how countries are classified by development, through the births, deaths and migration that change populations and places, to the challenges and opportunities of smaller families and older populations. The uneven distribution of people and wealth described in the first subtopic is the starting point; the processes of the second, natural change, rural–urban migration, megacity growth and forced displacement, constantly redraw it; and the trends that result, smaller families, ageing and a changing balance between generations and regions, are the challenges and opportunities of the third.
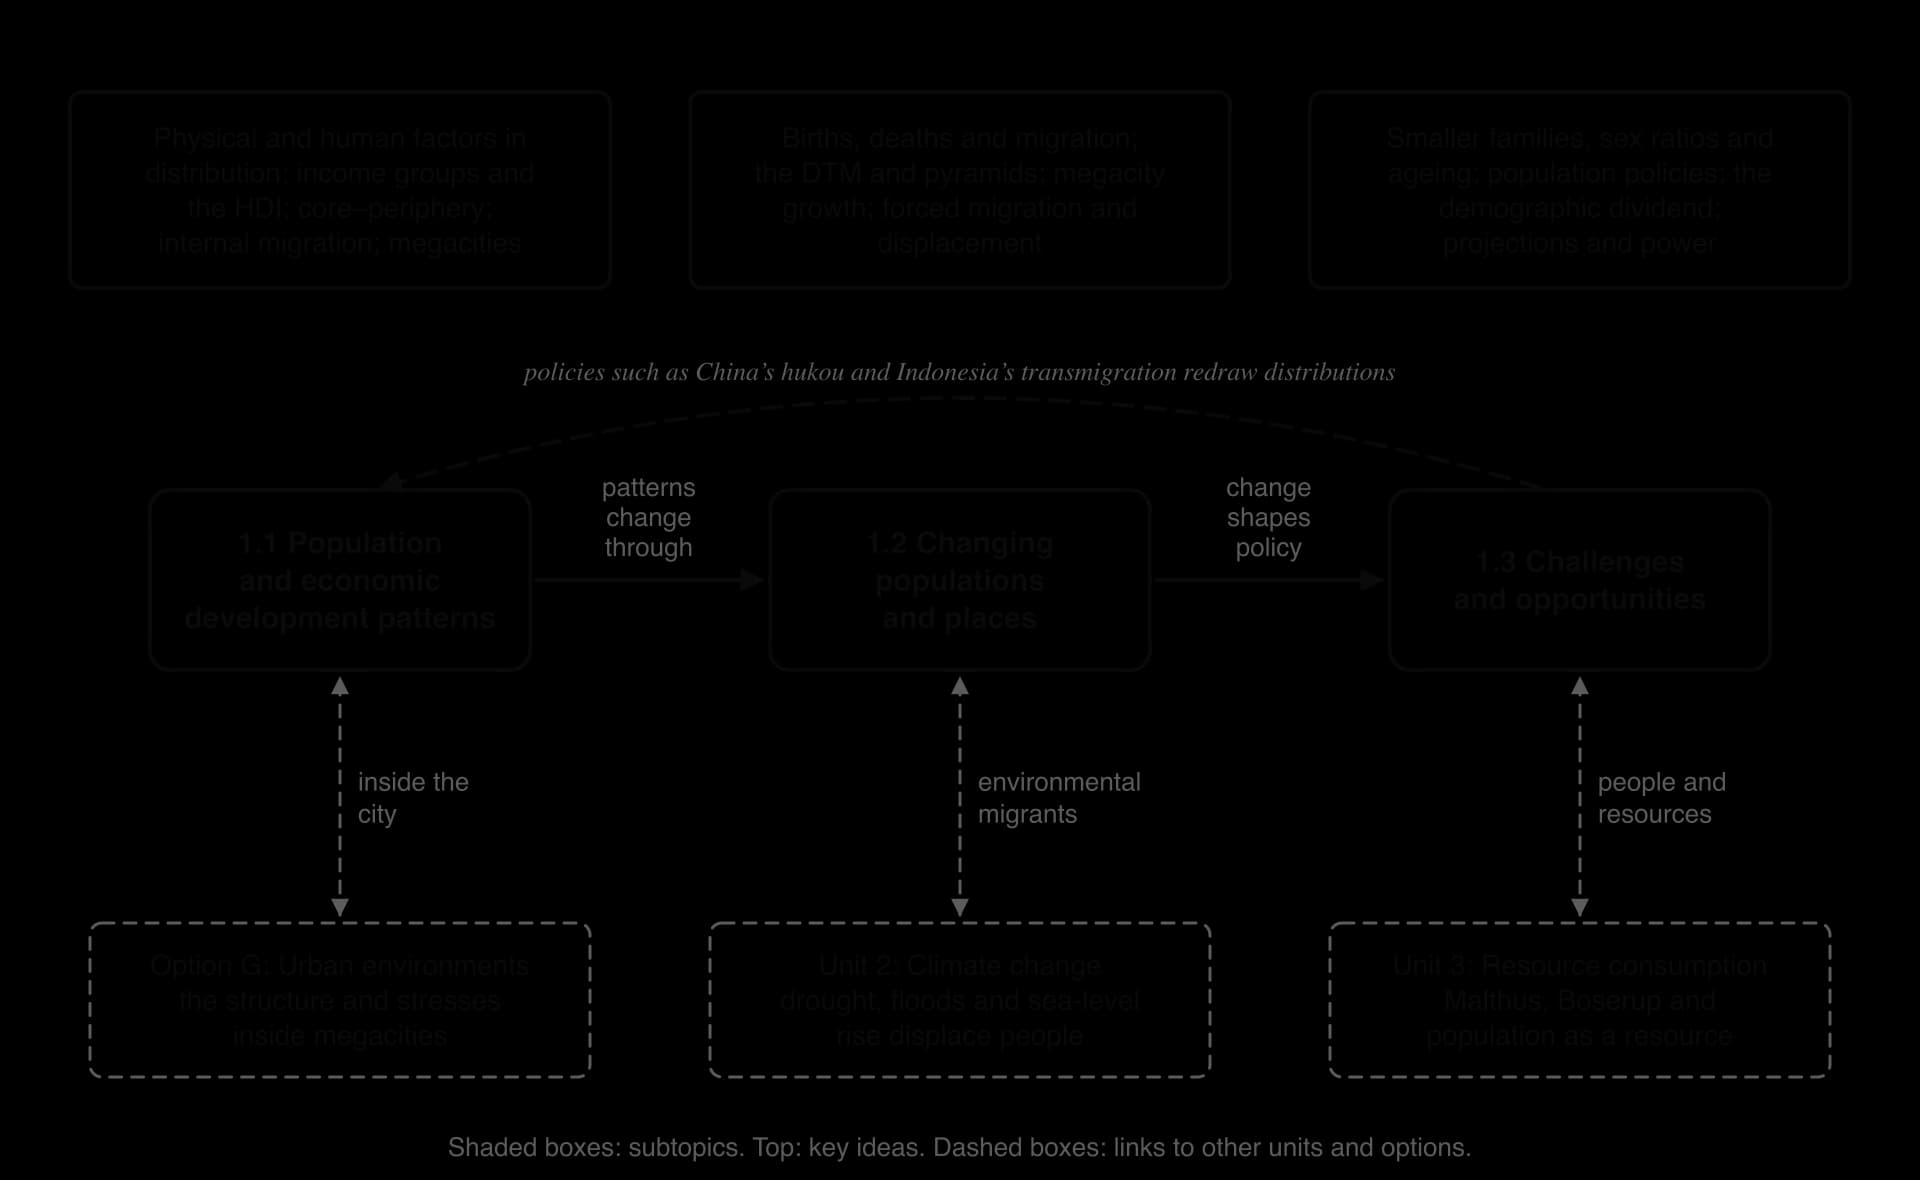
The concept map shows the loop that makes population geography a matter of power. Governments shape population change as well as responding to it. China’s hukou system limited who could settle in its cities, Indonesia’s transmigration programme resettled about 2.5 million people in five years, and the one-child policy changed China’s sex ratio and age structure for generations. The demographic transition model links all three subtopics, because a country’s stage is linked to its distribution of ages, its rate of growth and the policies it adopts.
The dashed links show where the unit meets the rest of the course. Option G studies the inside of the megacity that the unit treats as a whole. Global climate change adds drought, floods and sea-level rise to the causes of displacement, creating environmental migrants. Resource consumption asks whether a growing population is a pressure or a resource, the debate between Malthusian theory and Boserup’s theory.
Key concepts in changing population
The unit is built on place and process at its start and on possibility and power at its end.
Concept | How it appears in the unit |
|---|---|
Place | Physical and human factors make some places dense and others empty; a core–periphery pattern concentrates people and wealth in Sydney, Java or coastal China. |
Process | Natural increase, the demographic transition model and rural–urban migration explain how populations grow, age and move. |
Power | States set population policies, from China’s one-child policy to Hungary’s family loans; the displaced have least power, and refugees mostly stay in poor neighbouring countries. |
Possibility | UN projections give a range of futures, peaking at about 10.3 billion in the 2080s; a demographic dividend is possible only while the dependency ratio is low. |
Spatial interactions | Migration, remittances and refugee flows link origins and destinations; Dhaka’s migrants send money to villages across Bangladesh. |
Equity | Income classes, the HDI and gender equality show who gains from development; son preference and trafficking show who loses. |
Change | Positive change is as important as negative: Bangladesh’s fertility fell from 6.3 to 2.1 and Vietnam’s output per person rose almost six-fold. |
Scale runs through the unit. The same trend looks different for a household, a city and a nation: migration can lift a family out of poverty while widening the gap between a core and its periphery, and an ageing population strains pensions nationally while emptying villages locally. Perspectives differ too, between generations, between women and men, and between governments that want more births and families who want fewer.
How SL and HL differ
Changing population is one of the three core units, studied in full by both SL and HL students and examined in Paper 2, which is the same paper at both levels. Nothing in the unit is HL only, and its pages are identical for SL and HL readers.
HL students later build on the unit in the HL extension, where migration, remittances and diasporas reappear as global flows, but the core content itself does not change.
Assessment
The unit is examined in Paper 2. Section A has one structured question on each core unit, built on a stimulus: (a) a description of a pattern or trend [2], which must be quantified for full marks, (b) two suggested reasons or ways [2+2] and (c) two explained points [2+2]. Section B is an infographic or visual stimulus that may draw on any core unit, with two readings [1] each, one suggestion [2] and a judgment on how far the evidence supports a view [6]. Section C is an extended answer of 10 marks chosen from two, which rewards synthesis across population, climate and resources.
Population questions rely heavily on graphical and calculation skills. Stimuli are often a population pyramid, a choropleth map of fertility or median age, a flow map of migration or a table of rates, and short calculations of natural increase, doubling time, dependency ratios and percentage change are common. Typical essays ask whether government policy can manage population change, whether megacity growth brings more benefits than costs, or whether physical factors still decide where people live.
Carry on with 1 in Augment
With a free account, Augment remembers where you stopped and what you have practiced.