Explain how births, deaths and migration change populations, apply the DTM, pyramids and dependency ratios to Niger and Japan, and analyse megacity growth in Dhaka and forced displacement from Sudan and Somalia.
Each is in the Geography glossary, with every other term in the subject.
The clustering of people and economic activity in one place; agglomeration economies are the cost savings and productivity gains firms obtain from locating near each other.
A person who has left their country and applied for international protection as a refugee in another country, and is waiting for a decision on the claim.
The number of live births per 1,000 people in a population per year, also called the crude birth rate.
The emigration of highly educated or skilled people, such as doctors, engineers and teachers, from a place, which reduces its human capital and ability to develop.
The number of deaths per 1,000 people in a population per year, also called the crude death rate.
A model showing how a population moves from high to low birth and death rates as a country develops, in five stages, with the resulting changes in natural increase and total population.
The number of people aged 0–14 and 65 and over for every 100 people aged 15–64, split into youth and old-age dependency ratios.
The number of years a population would take to double at its current growth rate, estimated as 70 divided by the growth rate in % per year.
Describe how a population changes through births, deaths and migration, and determine natural increase, doubling time and dependency ratios from data.
Explain why fertility and mortality have fallen, and why they remain high in some countries.
Describe each stage of the demographic transition model and place real countries on it.
Evaluate the strengths and limitations of the demographic transition model.
Construct and analyse population pyramids, explaining their shapes, bulges and notches.
Compare population change in two contrasting countries, Niger and Japan.
Examine the consequences of rapid megacity growth for different individuals and groups, using Dhaka as a case study.
Distinguish between refugees, asylum seekers, internally displaced persons and stateless persons.
Explain the environmental and political causes of forced migration and its consequences for people and places, using two contrasting examples.
Every population changes in only three ways: people are born, people die, and people move. The balance between these processes explains why Niger’s population is doubling in about a generation while Japan’s is shrinking, why cities such as Dhaka have grown into some of the largest urban areas on Earth, and why more than 120 million people were living away from their homes because of conflict and disaster at the end of 2024.
The emphasis is on process: the mechanisms of demographic transition, urban growth and displacement, and how they change places. Population change also links to other parts of the course, from the demographic dividend of a falling birth rate to the
177 exam-style questions on this subtopic, written in the style of the IB papers. The first has its markscheme open. Counted on
Examine the relative importance of natural increase and rural–urban migration in the growth of cities in industrializing countries.
10 marks
Marks should be allocated according to the markbands.
Urban growth is an increase in the absolute number of people living in urban areas; urbanization is an increase in the proportion of a population living in urban areas. Natural increase is the excess of births over deaths within the urban population. Rural–urban migration is a centripetal movement of people from the countryside into towns and cities. Industrializing countries are low- and middle-income countries and emerging economies where manufacturing and services are expanding. Credit reference to reclassification of rural settlements as urban, and to international migration, where it is used to judge the relative importance of the two named processes.
Possible applied themes (AO2) demonstrating knowledge and understanding (AO1):
Push factors behind rural–urban migration: rural poverty, landlessness, mechanization of farming, drought or land degradation, conflict; pull factors: factory and service jobs, higher wages, schools and health care, perceived opportunity (eg migrants to Dhaka's garment factories, which employ around 4 million workers, most of them women from rural Bangladesh).
China's urban growth since the 1980s has been driven largely by migration: around 290 million rural migrant workers, many living in cities without urban hukou registration, moved to coastal manufacturing centres such as Shenzhen and Dongguan.
Migrants are selectively young adults of reproductive age, so migration adds to natural increase a few years later: migration and natural increase are linked rather than separate.
In many cities of sub-Saharan Africa and South Asia (eg Lagos, Kinshasa, Karachi) natural increase now contributes around half or more of urban growth, because fertility remains relatively high while urban death rates have fallen with better access to clean water, vaccination and health care.
With a free account, Augment remembers where you stopped and what you have practiced.
A person who moves within or across borders mainly because sudden or gradual environmental change has damaged their life or living conditions; “climate refugee” has no legal status.
The movement of people compelled to leave their homes, within or across borders, by threats such as conflict, persecution, natural disasters or development projects.
The number of deaths of infants under one year old per 1,000 live births in a year.
Economic activity that is not registered, taxed or regulated by government, such as street trading or casual labour, with low, irregular pay and no legal protection.
An area of housing built without legal title to the land or planning permission, usually lacking secure tenure, safe water, sanitation and drainage; often called a slum.
A person forced to leave their home by conflict, violence, human rights violations or disaster who has not crossed an internationally recognised border.
The average number of years a newborn baby would live if current age-specific death rates stayed the same throughout its life.
The growth of a population caused by births exceeding deaths, ignoring migration; the natural increase rate is (birth rate − death rate) ÷ 10, in % per year. Deaths exceeding births is natural decrease.
The difference between the number of people moving into an area and the number moving out over a period, usually a year; positive when more arrive than leave.
A pair of back-to-back horizontal bar charts showing the percentage or number of males and females in each five-year age group of a population.
The composition of a population by age and sex, usually shown as a population pyramid.
A person who has crossed an international border because of a well-founded fear of persecution, as defined by the 1951 Refugee Convention, or, under wider regional and UNHCR definitions, to escape armed conflict.
The total fertility rate at which a population exactly replaces itself from one generation to the next without migration, about 2.1 children per woman where child mortality is low.
A person who is not considered a national by any state under its law, and so lacks the rights of citizenship such as a passport, legal work or public services.
The average number of children a woman would have over her lifetime if she experienced the age-specific fertility rates of a given year.
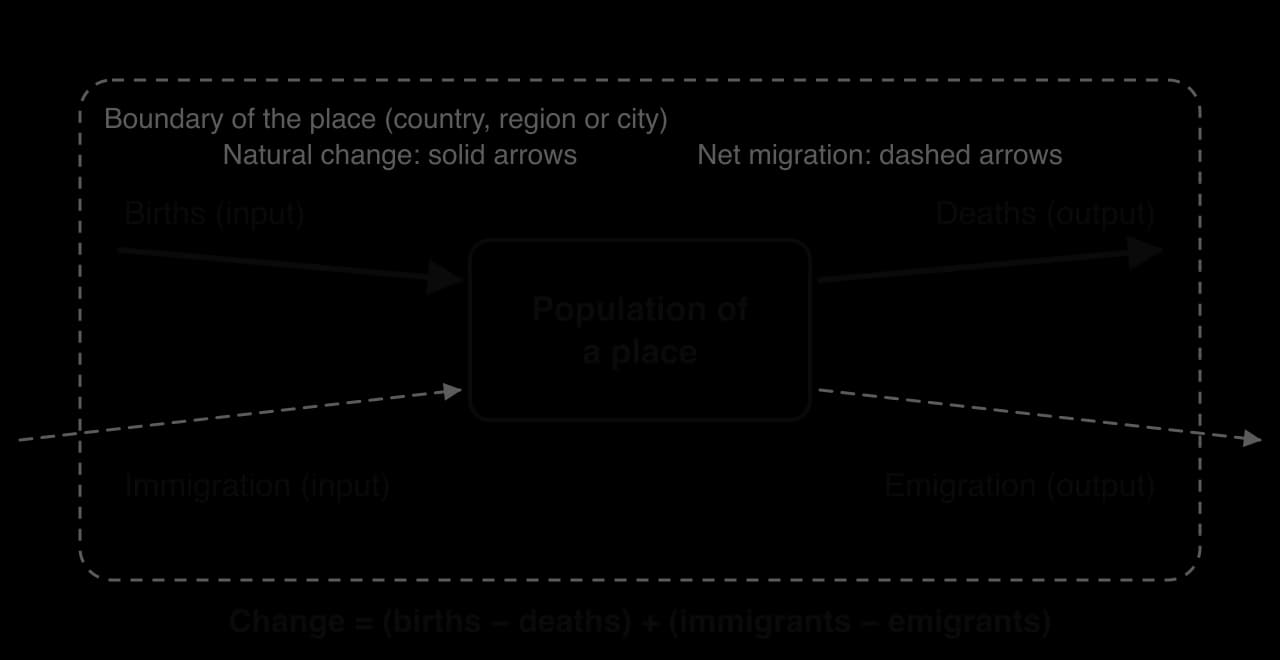
A population can be treated as a system with inputs and outputs. Births and immigrants add people; deaths and emigrants remove them. The difference between births and deaths is natural change; the difference between people arriving and leaving is net migration.
Because countries differ in size, births and deaths are expressed as rates. The birth rate (crude birth rate) is the number of live births per 1,000 people per year; the death rate (crude death rate) is the number of deaths per 1,000 people per year. In 2024 Niger’s birth rate was 41.4 per 1,000 and Japan’s 5.7; their death rates were 8.7 and 13.3 per 1,000.
A crude death rate can mislead. Japan’s death rate is higher than Niger’s because Japan has many more old people, even though its people are healthier. Rates that compare like with like, such as life expectancy and infant mortality, are better measures of health.
Natural increase is the excess of births over deaths. When deaths exceed births, as in Japan, the population is in natural decrease. The natural increase rate is given as a percentage per year, so the difference between the two rates (per 1,000) is divided by 10.
A useful quick estimate is the doubling time: the number of years a population would take to double if its growth rate stayed the same. Dividing 70 by the growth rate in % per year gives the answer (the “rule of 70”).
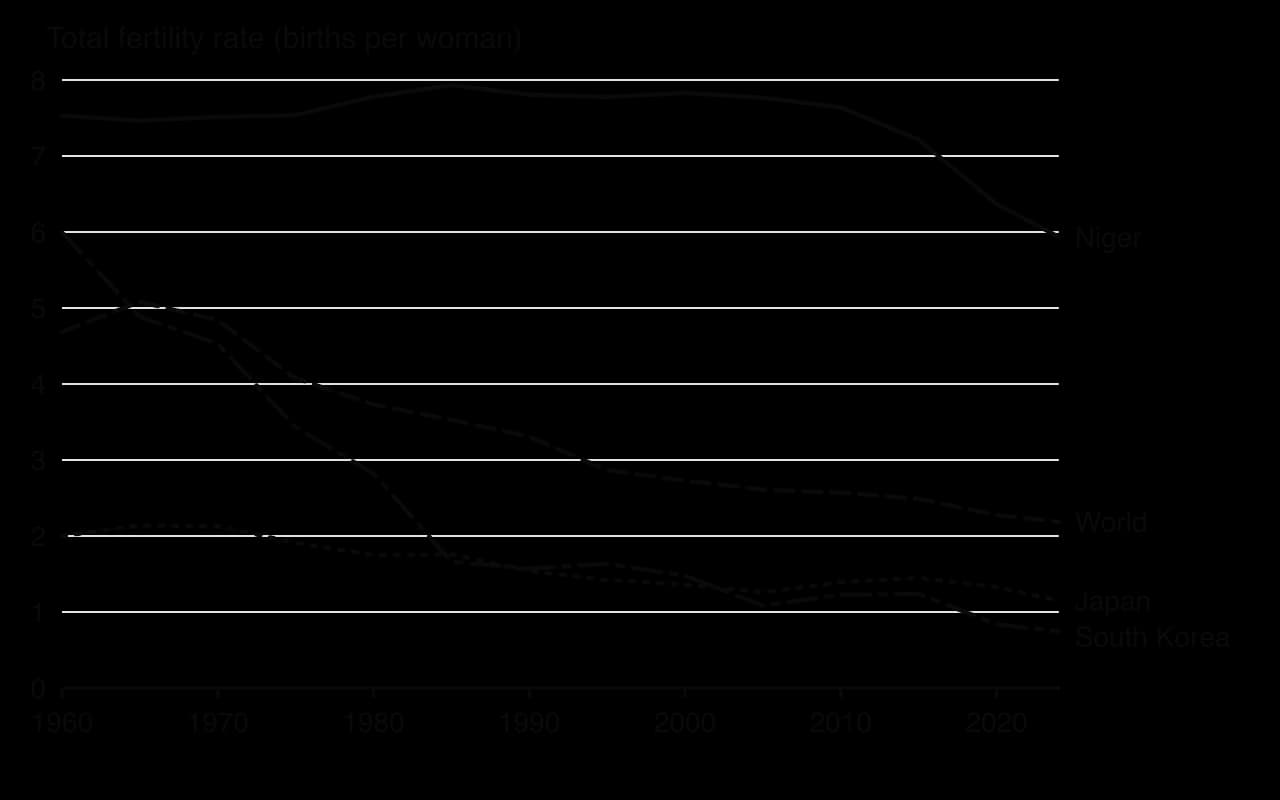
The birth rate depends partly on how many young adults a population contains. The total fertility rate (TFR) removes this effect: it is the average number of children a woman would have during her lifetime if she experienced the current fertility rates at each age. It is the best single measure of family size.
A TFR of about 2.1 is replacement-level fertility: the level at which each generation exactly replaces itself in the long run, without migration. It is slightly above 2 because some children die before adulthood and slightly more boys than girls are born. Where child mortality is high, replacement level is higher, about 2.5–3.
World fertility has fallen from about 4.7 children per woman in 1960 to 2.2 in 2024. The fall has been fastest in East Asia: South Korea’s TFR fell from 6.0 in 1960 to 0.75 in 2024, the lowest in the world. In Niger, fertility stayed above 7 for half a century and was still 5.9 in 2024. In 2024 fertility was 1.15 in Japan, 1.18 in Italy and 1.55 in the United Kingdom, but 4.4 in Nigeria and, unusually for a high-income country, 2.9 in Israel.
Factor | How it lowers fertility | Example |
|---|---|---|
Education of girls | Women who stay in school marry later, know more about contraception and have more choice of work | Bangladesh’s girls’ secondary school stipends from the 1990s |
Women’s paid employment | Raises the cost of time spent out of work, so women choose smaller families | Garment work in Bangladesh, mostly done by women |
Access to contraception | Allows couples to have the number of children they want | Family planning programmes in Iran from 1989 |
Falling child mortality | Parents no longer need many births to ensure some children survive | Global under-five mortality fell sharply after 1990 |
Urbanisation | Children cost more in cities (housing, schooling) and contribute less labour than on farms | Urban fertility below rural fertility almost everywhere |
Cost of children | Expensive housing and education push couples to have fewer children or delay them | South Korea and Japan |
Religion, culture, policy | Can keep fertility high (value placed on large families) or push it down (anti-natalist policy) | High fertility among Israel’s religious communities; China’s former one-child policy |
Fertility stays high where most of these conditions are absent. In Niger, most people farm, many girls marry before 18, few women have secondary education, child mortality is high and children help with farm work and support parents in old age. Large families remain a rational choice for many households in such conditions.
Life expectancy at birth is the average number of years a newborn baby would live if the death rates of the current year stayed the same throughout its life. It is not the same as lifespan, the maximum age humans can reach. A low life expectancy usually means that many babies and children die, not that adults die young: in a population where many infants die, the average is pulled down even if adults commonly reach 70.
The infant mortality rate measures the number of babies who die before their first birthday per 1,000 live births. It is one of the most sensitive indicators of health and living conditions. In 2024 it was 65.6 per 1,000 in Niger and 69.8 in Nigeria, against 1.8 in Japan; the world average was 27.7.
World life expectancy rose from about 51 years in 1960 to 73.5 years in 2024. Mortality falls when people gain clean water and sanitation (which stop diarrhoeal diseases), vaccination, a reliable food supply, antibiotics and healthcare, and education, especially of mothers. These changes spread quickly to low-income countries in the twentieth century, so death rates there fell much faster than they had in Europe.
 YouTube
Sources: World Bank, World Development Indicators (from UN World Population Prospects and WHO), 2024.
The demographic transition model (DTM) describes how birth and death rates change as a country develops, and the effect on its total population. It was based on the experience of western Europe and North America, where death rates began to fall in the eighteenth and nineteenth centuries and birth rates followed decades later. It is a model, not a law: it describes a common sequence, not a path every country must follow.
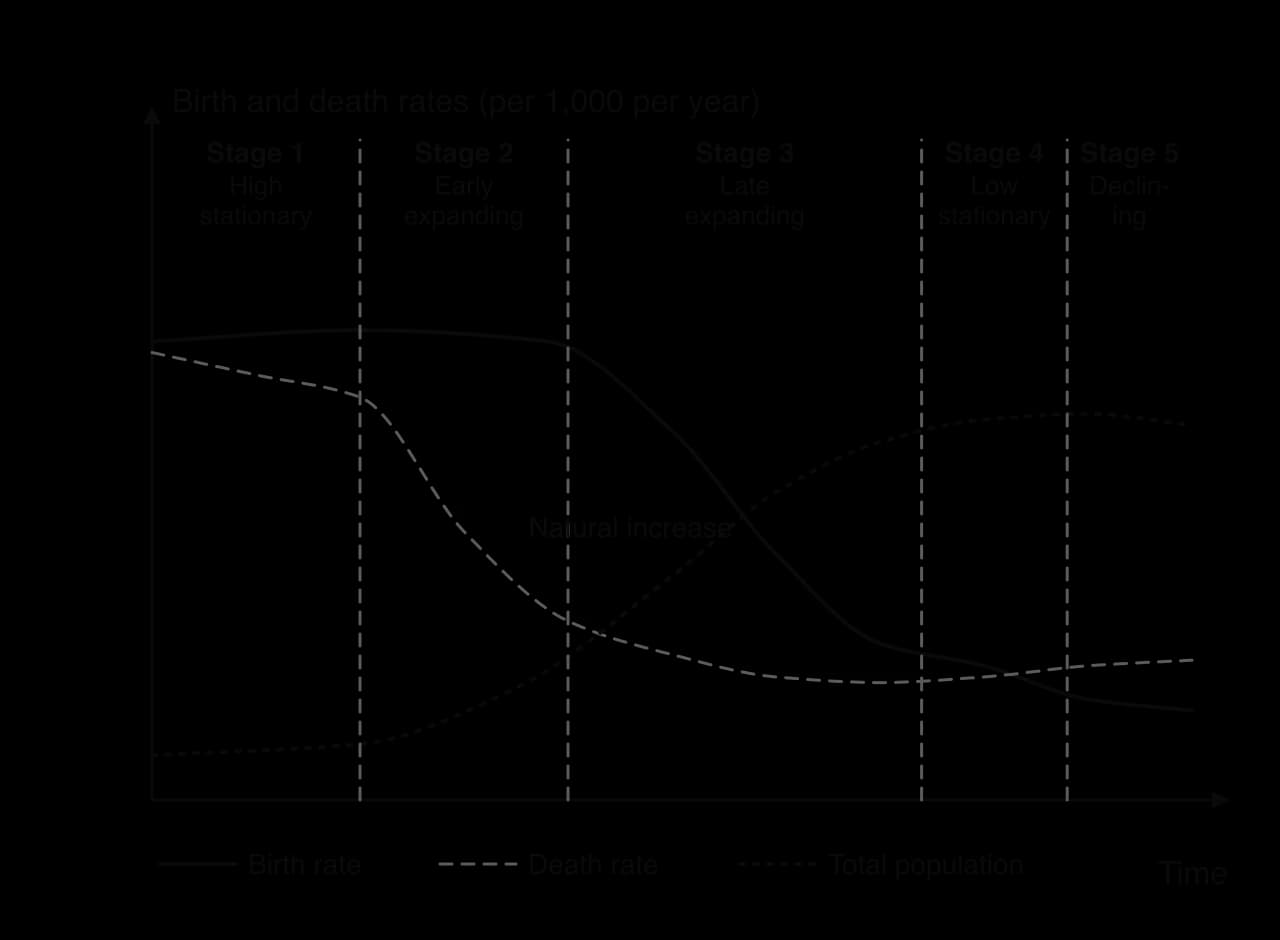
Stage | Birth rate | Death rate | Natural increase | Typical pyramid | Examples today |
|---|---|---|---|---|---|
1 High stationary | High (35–50 per 1,000) | High and fluctuating | Low, with famines and epidemics | Wide base, very narrow top | No country; some isolated groups |
2 Early expanding | High | Falling rapidly | Rapid | Very wide base (expansive) | Niger (late stage 2), Chad, Somalia |
3 Late expanding | Falling | Low, still falling | Slowing | Base narrowing | India, Bangladesh, Kenya |
4 Low stationary | Low | Low | Very low or zero | Straight sides (stationary) | United Kingdom, United States, China |
5 Declining | Very low, below the death rate | Low, rising slowly as people age | Negative (natural decrease) | Narrow base, wide top (constrictive) | Japan, Italy, South Korea |
In stage 1, birth rates are high because there is no reliable contraception, children work on farms and support their parents, and many die young. Death rates are high because of poor food supply, disease and lack of medical care, and they fluctuate with harvests and epidemics. The population grows slowly, if at all.
Stage 2 begins when death rates fall because of better food supply, clean water, sanitation and vaccination, while birth rates stay high because attitudes and family needs change more slowly than mortality. The result is very rapid growth, often called a population explosion: Niger’s natural increase of 3.3% a year in 2024 is typical of late stage 2.
During stage 3, birth rates fall as children survive, cities grow, girls stay in school and contraception spreads. Population growth slows but continues, partly because of population momentum: the many young people born in stage 2 now have children of their own.
By stage 4, birth and death rates are both low and the population is roughly stable. In stage 5, fertility stays below replacement level for long enough that deaths exceed births and the population declines unless immigration makes up the difference.
Strengths | Limitations |
|---|---|
Describes a sequence that most countries have followed or are following, and links it to development | Based on European and North American experience; transitions elsewhere have been much faster (South Korea’s TFR fell from 6.0 to below 2 in about 25 years, against about a century in Britain) |
Allows countries to be compared and future changes to be predicted | Ignores migration, which drives population change in many countries (the Gulf states, Germany) |
Explains the population explosion of the twentieth century as a time lag between falling deaths and falling births | Stage 5 was added later, and the model does not say what happens next or how low fertility will go |
Simple and easy to apply with birth and death rate data | Does not fit reversals: death rates rose with HIV/AIDS in southern Africa in the 1990s and with war in Syria |
Death rates in today’s low-income countries fell because medicine was imported, not because of internal development, so the stages are less tied to economic change |
The DTM remains a useful framework for describing where a country is and why, but it is weak as a predictive tool. It assumes that fertility falls as a country develops, yet Niger’s fertility has fallen only slowly despite falling mortality, while South Korea’s has fallen far below replacement level and kept falling. Cultural, political and economic factors that the model leaves out, such as the status of women, government policy and the cost of housing, explain much of the variation between places.
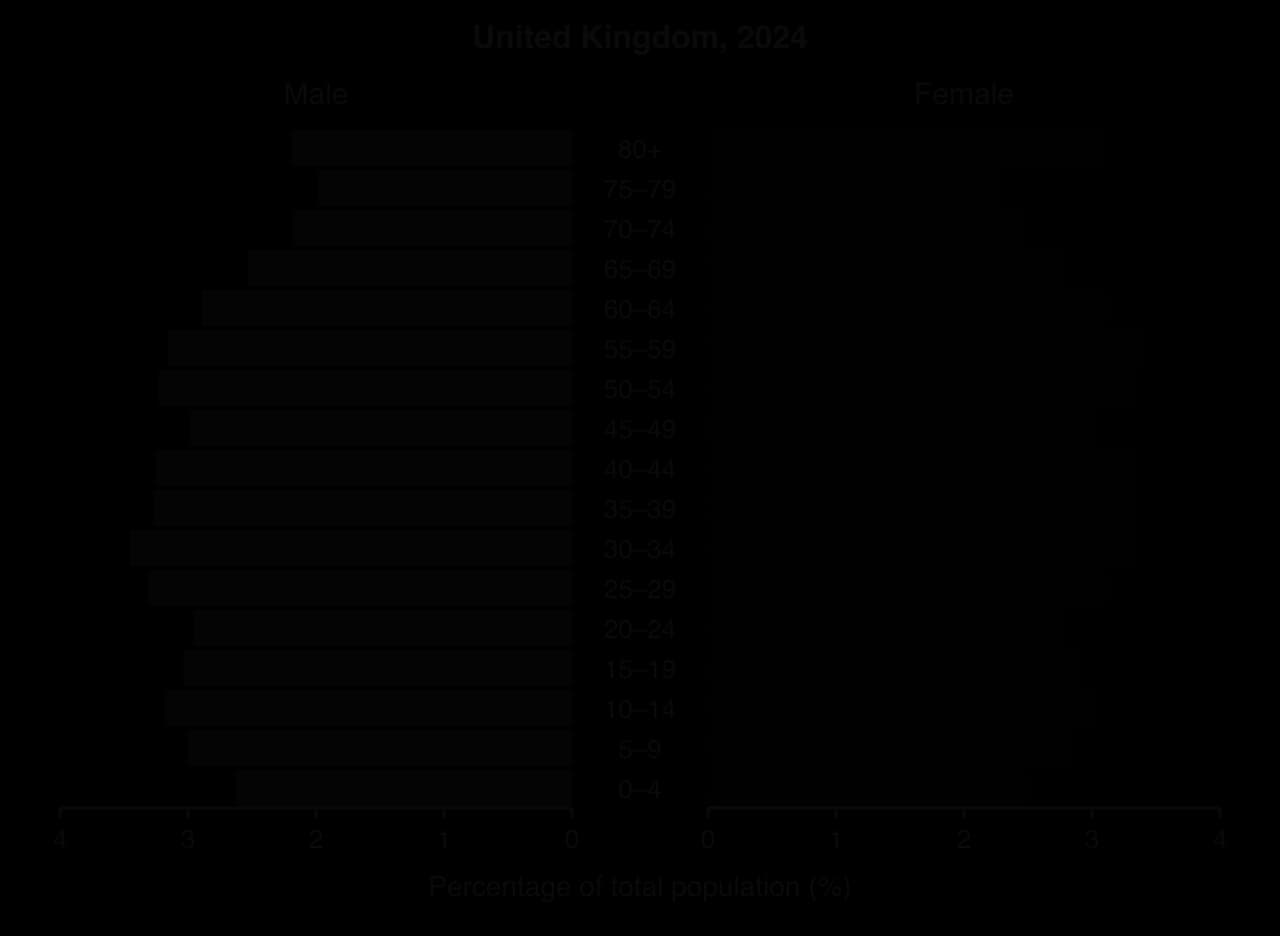
Population structure is the composition of a population by age and sex. It is shown with a population pyramid (also called an age–sex pyramid): a pair of horizontal bar charts back to back, with males on the left, females on the right, five-year age groups up the centre, and each bar showing the percentage of the total population (or the number of people) in that group.
The pyramid is the standard way of showing it.
Three general shapes match the stages of the DTM. An expansive pyramid has a very wide base that narrows quickly: high birth rates, many young dependants and low life expectancy. A stationary pyramid has nearly vertical sides: low birth and death rates and a stable population. A constrictive pyramid is narrower at the base than in the middle: birth rates have fallen below earlier levels and the population is ageing.
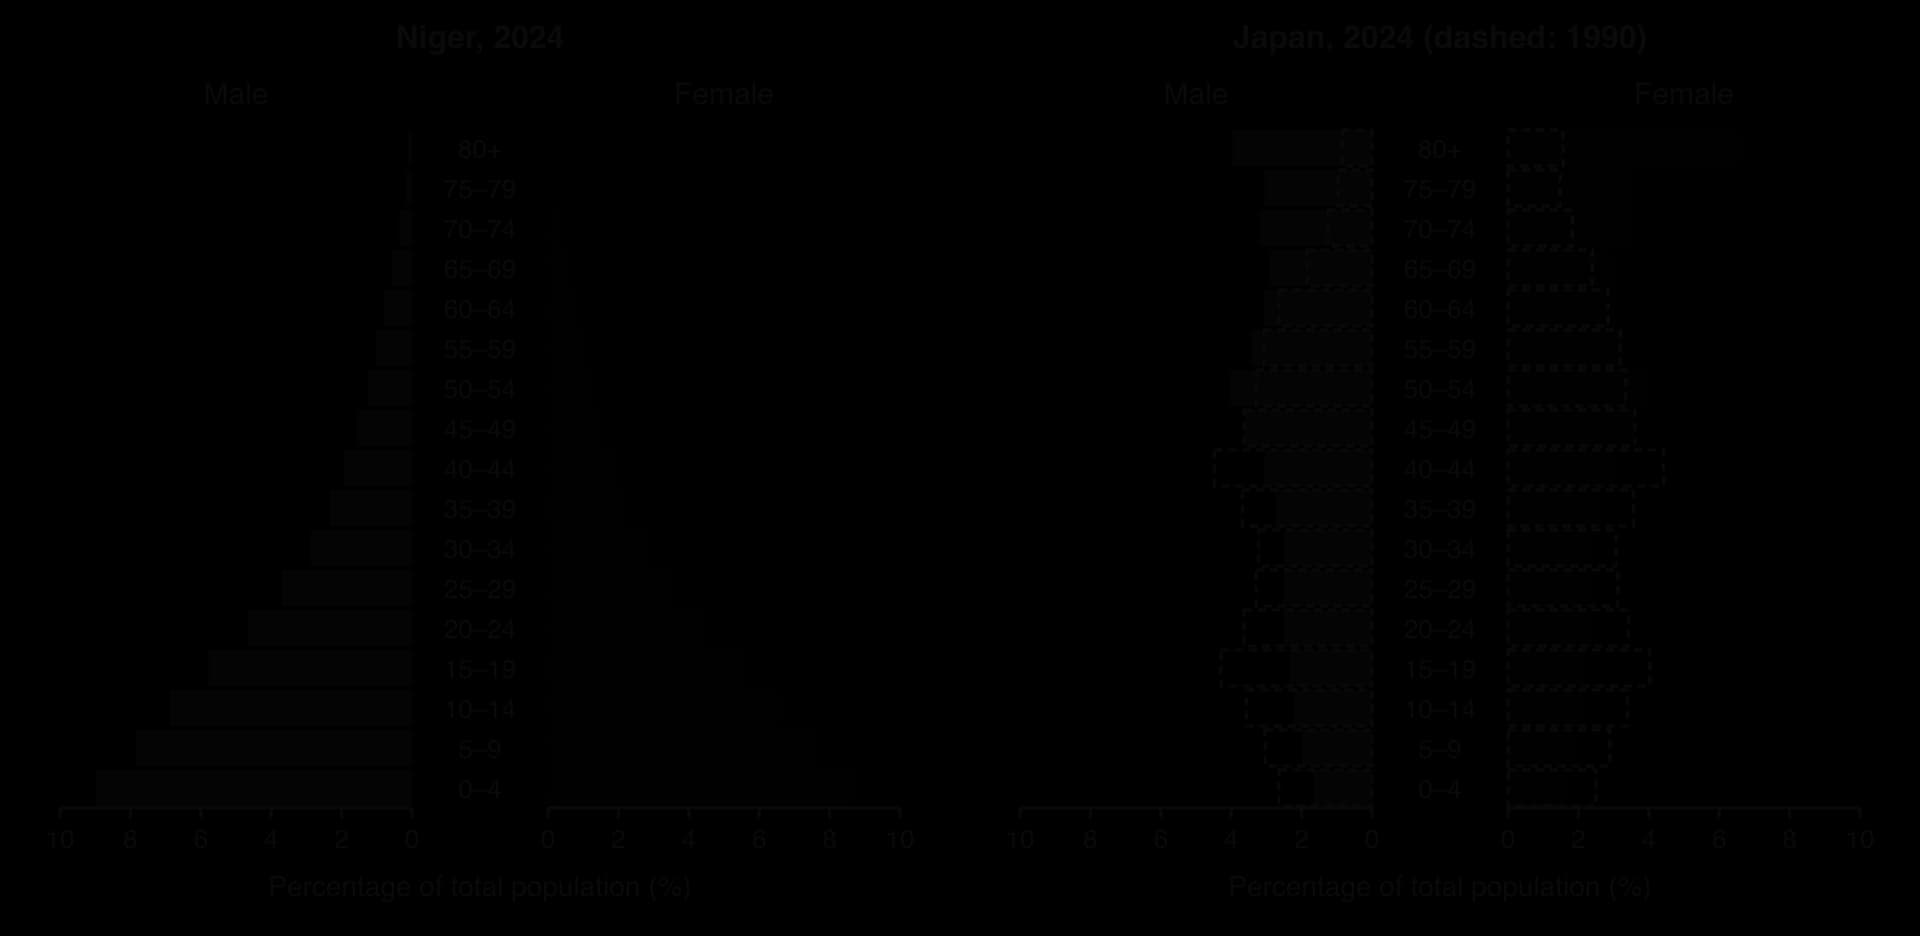
Bulges and notches show the effects of particular events. In Japan’s pyramid, the bars at ages 70–79 are the post-war baby boom of 1947–1949, and the widest bars, at 50–54, are their children, born in the early 1970s. Comparing the dashed outline for 1990 shows the change: in 1990 the base was much wider, and the over-65s were a small group.
Other common features include a notch for a war or a fall in births during a crisis, a wider band of young adult men where migrant workers arrive (as in Qatar or the United Arab Emirates), and a narrower one where they leave, and more women than men at the oldest ages because women live longer.
The dependency ratio compares the number of people of non-working age (dependants) with the number of working age. It uses the UN’s age bands: children aged 0–14 and older people aged 65 and over are counted as dependants, and people aged 15–64 as the working-age population. The ratio can be split into a youth dependency ratio and an old-age dependency ratio.
The ratio is a useful summary, but it has limits. Age does not equal economic activity: many 15–19-year-olds are in school and not working, many adults are unemployed or care for family, and many people over 65 still work. In Japan, about a quarter of people aged 65 and over (25.2% in 2023) were in work, while in Niger many children work on family farms. The ratio also ignores the wealth of a society: a dependency ratio of 70 is easier to support in Japan than one of 97 in Niger.
Niger and Japan stand at opposite ends of the demographic transition. Niger, a low-income, landlocked country in the Sahel, had the highest fertility in the world for decades. Japan, a high-income island country in East Asia, was one of the first countries outside Europe and North America to complete the transition and is now in stage 5.
Indicator (2024) | Niger | Japan |
|---|---|---|
Total fertility rate (births per woman) | 5.94 | 1.15 |
Birth rate / death rate (per 1,000) | 41.4 / 8.7 | 5.7 / 13.3 |
Population growth (% per year) | 3.28 | −0.44 |
Life expectancy at birth (years) | 61.4 | 84.0 |
Infant mortality (per 1,000 live births) | 65.6 | 1.8 |
Aged 0–14 / 65 and over (% of population) | 46.6 / 2.6 | 11.4 / 29.8 |
Dependency ratio | 96.8 | 70.1 |
DTM stage | Late stage 2 | Stage 5 |
Sources: World Bank, World Development Indicators (from UN World Population Prospects), 2024.
Niger’s death rate has fallen steeply since the 1960s as vaccination, health centres and food aid reduced deaths among children, but its birth rate has stayed very high. Most people depend on rain-fed farming and herding in a semi-arid environment, many girls marry young, and few women complete secondary school. Children are an important source of farm labour and of support for parents in old age, so large families make economic sense to many households. The result is growth of more than 3% a year: a population that doubles in about 21 years.
Rapid growth creates challenges for place: more land is cleared for farming in a fragile environment, and the government must expand schools, clinics and jobs for a population in which almost every second person is a child. It also creates possibilities: if fertility falls, Niger could later benefit from a demographic dividend as these children reach working age.
Japan’s birth rate fell after the post-war baby boom and has been below replacement level since the 1970s; by 2024 the TFR was only 1.15. Explanations include the high cost of housing and education, long working hours, the difficulty for women of combining a career with child-rearing, and later marriage. At the same time, life expectancy has risen to 84 years, among the highest in the world. The result is an ageing population: Japan’s population peaked at about 128 million around 2008–2010 and had fallen to 124.0 million by 2024, and 29.8% of its people were aged 65 and over.
Japan has accepted relatively few immigrants, so migration has done little to offset the decline. Its rural areas are emptying fastest: many villages have mainly elderly residents and empty houses, while Tokyo continues to attract young adults. Ageing raises the cost of pensions and healthcare and reduces the labour force, but it has also encouraged innovation in robotics and care for the elderly. Managing ageing has become a central aim of Japanese government policy.
A megacity grows through rural–urban migration and natural increase, often by hundreds of thousands of people a year. Growth on this scale changes the lives of everyone in the city, but not in the same way: the consequences depend on who a person is, where they live in the city and what work they do.
Cities concentrate jobs, customers, suppliers, universities and government. The benefits that firms gain from locating close to each other are called agglomeration economies: shared pools of skilled workers, specialist suppliers, faster exchange of ideas and access to large markets. They explain why productivity and wages are usually far higher in megacities than in the countryside, and why firms keep investing there despite congestion and high rents.
For migrants, a city offers wages several times higher than farm incomes, access to secondary schools, hospitals and electricity, and greater personal freedom. Many send part of their earnings home as remittances, which pay for food, school fees and housing in rural areas, so megacity growth also affects the places migrants leave. Fertility usually falls in cities, which over time slows population growth.
When a city grows faster than the government can build housing, roads, water pipes and sewers, many newcomers live in informal settlements (slums): areas of housing built without planning permission or legal ownership of the land, usually lacking secure tenure, safe water, sanitation and durable buildings. Many also work in the informal sector: unregistered work such as street vending, rickshaw driving, domestic service or recycling, which is untaxed and unprotected by labour law.
Informal housing and informal work usually go together.
Group | Opportunities | Challenges |
|---|---|---|
New rural migrants | Jobs, higher wages, remittances home, access to services | Informal housing, eviction, insecure informal work, discrimination |
Women | Paid work (garment and service jobs), education, later marriage, lower fertility | Low wages, long hours, harassment, unsafe transport, the double burden of paid and domestic work |
Children | Better access to schools and clinics than in rural areas | Child labour, disease from polluted water and air, overcrowding |
Middle-class residents | Professional jobs, universities, consumer goods | Congestion, air pollution, rising housing costs, flooding |
City governments | A large tax base and investment from firms | Huge infrastructure demands, informal growth beyond their control |
The environment also suffers. Megacities generate air pollution from vehicles, brick kilns and industry, enormous quantities of waste, and untreated sewage that pollutes rivers. Paving over land increases flood risk, and in coastal and delta megacities such as Dhaka, Jakarta and Lagos, growth places millions of people on low-lying land exposed to floods and storms.
City governments respond in many ways. Slum upgrading improves water, sanitation, paths and drainage in informal settlements and gives residents legal tenure, rather than demolishing them. Mass transit such as metro railways and bus rapid transit reduces congestion. Satellite cities and new towns try to divert growth away from the core. How far these succeed depends heavily on the power and resources of city governments.
Migration lies on a spectrum from voluntary to forced. Forced migration occurs when people are compelled to leave their homes by threats to their lives or livelihoods, such as conflict, persecution, disasters or development projects, with little or no choice. Many movements fall between the two ends: a farmer who leaves after three failed harvests has some choice, but very little.

Forcibly displaced people are counted and protected according to their legal status. The four main categories are refugees, asylum seekers, internally displaced persons and stateless persons, and they matter because they decide what rights people have and which organisations are responsible for them.
A refugee cannot lawfully be returned to a country where they face serious threats (the principle of non-refoulement). Before that status is granted, a person may be an asylum seeker.
Most people who flee never cross a border. They remain inside their own country, where their government is responsible for them, even if it is also the cause of their displacement.
Some displaced people have no country at all that recognises them as citizens.
The Rohingya of Myanmar are the largest stateless group: Myanmar’s 1982 citizenship law excluded most of them, and after the violence of August 2017 most fled to camps around Cox’s Bazar in Bangladesh. At the end of 2024 the UNHCR counted 1.32 million refugees from Myanmar. People who leave because of environmental change are sometimes called “climate refugees” in the media, but the term has no legal status under the 1951 Convention, which covers persecution and not environmental hazards. Geographers use the term environmental migrant.
At the end of 2024, a record 123.2 million people were forcibly displaced worldwide, 7 million more than a year earlier: about 73.5 million IDPs, 31 million refugees under UNHCR’s mandate, 5.9 million Palestine refugees under UNRWA, 8.4 million asylum seekers and 5.9 million other people in need of international protection. The largest displacement situations were Sudan (14.3 million), Syria (13.5 million), Afghanistan (10.3 million) and Ukraine (8.8 million).
Contrary to a common perception, most refugees do not travel to high-income countries. Two-thirds stay in neighbouring countries, and the largest hosts in 2024 were Iran (3.5 million), Türkiye (2.9 million), Colombia (2.8 million), Germany (2.7 million) and Uganda (1.8 million). Most hosts are low- and middle-income countries, which bear much of the cost of displacement with limited resources.
Sources: UNHCR, Global Trends: Forced Displacement in 2024 (June 2025), via Arab News, 12 June 2025; UNHCR Refugee Data Finder (population statistics API), 2024.
Type of push factor | Rapid-onset or sudden | Slow-onset or long-term | Examples |
|---|---|---|---|
Environmental | Floods, tropical cyclones, earthquakes, volcanic eruptions | Drought, desertification, sea-level rise, river erosion | Horn of Africa drought 2020–2023; Pakistan floods 2022 |
Political | War, armed attacks, ethnic violence, persecution | Discrimination, denial of citizenship, economic collapse | Sudan since 2023; Ukraine since 2022; Rohingya since 2017 |
Development projects | Forced eviction for a dam, airport or road | Gradual loss of land to mines or plantations | Three Gorges Dam, China: more than a million people relocated |
Environmental and political causes often combine. A drought becomes a displacement crisis where people have no savings, no insurance and no government support, and where conflict prevents aid from reaching them; conflict itself can be worsened by competition for scarce water and pasture. Most forced movements therefore have several causes, and the Somali drought and the war in Sudan differ mainly in which cause came first.
Who or where | Consequences |
|---|---|
Displaced people | Loss of homes, land, savings and livelihoods; family separation; trauma and violence, especially against women and children; interrupted education; poor health in crowded camps; for some, statelessness |
Places of origin | Depopulation and abandoned farmland; brain drain as doctors, teachers and other skilled people leave; loss of tax revenue and labour; destroyed infrastructure that makes return difficult |
Places of destination | Rapid growth of camps and informal settlements; pressure on water, food, housing, schools and health services; competition for jobs and possible tension with hosts; but also new labour and skills, aid flows and new businesses |
The UNHCR recognises three durable solutions: voluntary return to the place of origin when it is safe, local integration in the host country, and resettlement to a third country. In 2024, 9.8 million displaced people returned home, 1.6 million of them refugees and 8.2 million IDPs, many of them to Syria after the fall of the Assad government in December 2024. Resettlement helps only a small fraction of refugees each year, so most remain in neighbouring countries for many years.
On 15 April 2023, fighting broke out in Khartoum between Sudan’s army, the Sudanese Armed Forces (SAF), and a paramilitary force, the Rapid Support Forces (RSF), which had shared power after a coup in 2021. The war spread quickly to Darfur in the west, where the RSF and allied militias were accused of ethnic violence against non-Arab communities such as the Masalit in El Geneina in 2023.
The RSF besieged El Fasher, the last army-held city in Darfur, from 2024 until it fell on 26 October 2025. By July 2026 more than 14 million people had been forcibly displaced, about 4.5 million of them as refugees in other countries, one of the largest displacement crises in the world.
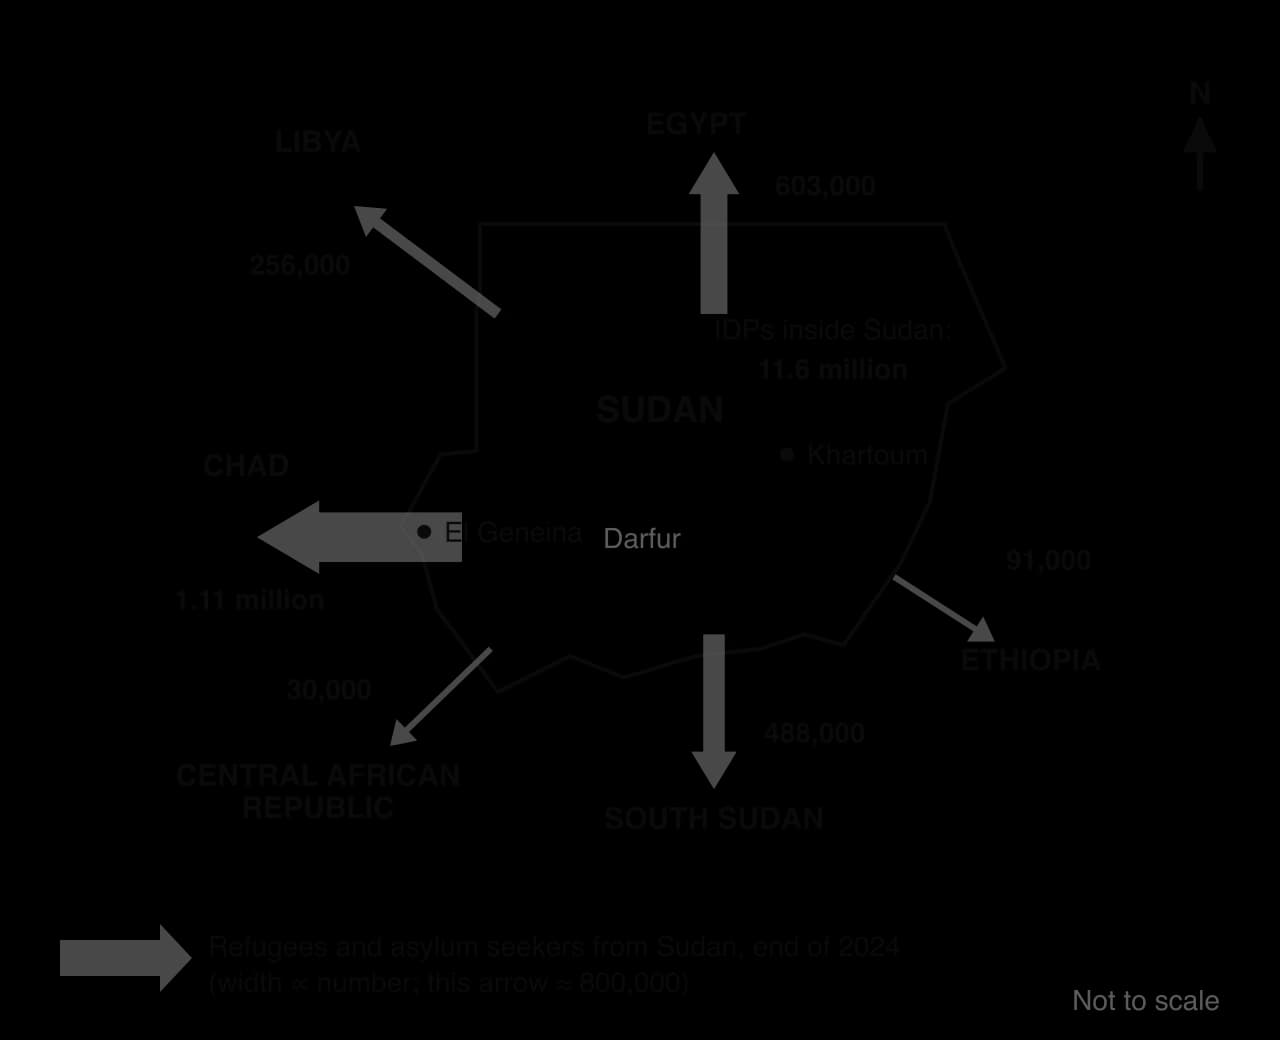
At the end of 2024, UNHCR counted 11.6 million internally displaced people inside Sudan, and 2.1 million refugees and 0.7 million asylum seekers from Sudan abroad. Eastern Chad, one of the poorest regions of a low-income country, hosted 1.1 million refugees from Sudan, many of them women and children from Darfur living in camps near the border; South Sudan, itself recovering from civil war, hosted almost 490,000. In Egypt, more than 570,000 Sudanese were registered as asylum seekers, many of them in Cairo and other cities rather than camps.
The consequences for these places include pressure on scarce water and food in eastern Chad, rising rents and service demands in Egyptian cities, and the arrival of skilled Sudanese professionals, while in Sudan the loss of doctors, farmers and traders has deepened the economic collapse and food crisis.
 YouTube
Sources: UNHCR Refugee Data Finder (refugees, asylum seekers and IDPs from Sudan, end of 2024); Wikipedia, “Sudanese civil war (2023–present)”, accessed October 2026.
Between late 2020 and early 2023, parts of Somalia, Ethiopia and Kenya suffered their worst drought in decades: the rainy season of 2022 was the driest in more than 40 years. The drought hit hardest in southern Somalia, where most people depend on herding and rain-fed farming; about 9.5 million livestock died across the region, harvests failed, and food and water prices rose. An estimated 43,000 excess deaths occurred in Somalia in 2022, about half of them children under five. A World Weather Attribution study in April 2023 found that climate change had made a drought of this severity about 100 times more likely, mainly by raising temperatures and evaporation.
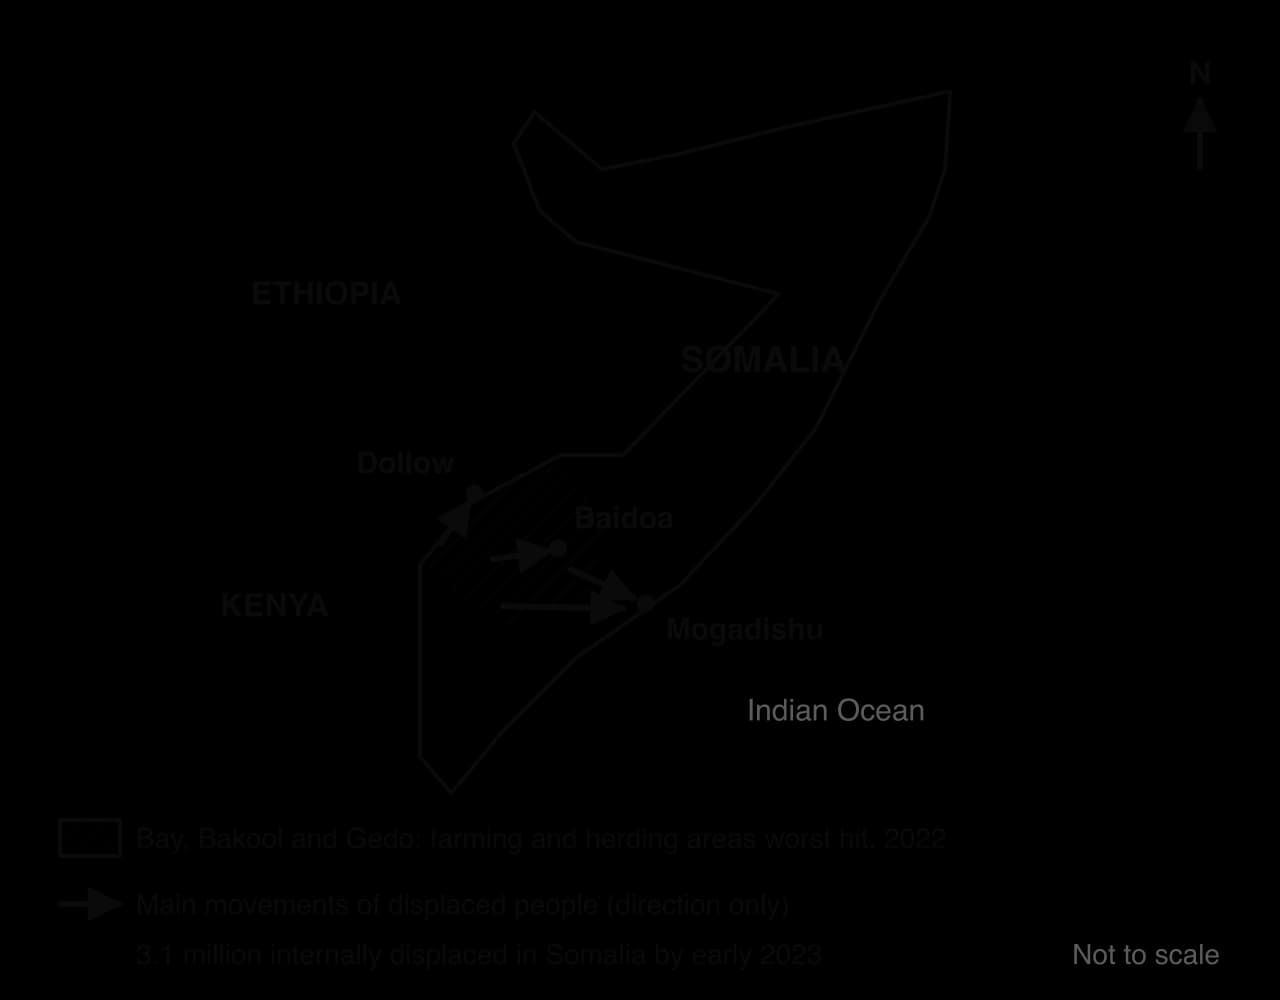
By early 2023, 3.1 million people were internally displaced in Somalia, while only about 51,400 had crossed a border. Families walked from rural areas of Bay, Bakool and Gedo to Baidoa, which UN officials reported was sheltering hundreds of thousands of displaced people in 2022, and to camps on the outskirts of Mogadishu. Pastoralists who had lost their herds lost their livelihood and their savings at the same time, so returning to herding was not possible for many of them.
The towns that received them faced shortages of water, shelter and sanitation and outbreaks of cholera and measles. Conflict made the crisis worse, because insecurity in rural areas held by the armed group al-Shabaab restricted aid deliveries.
Sudan (political) | Somalia drought (environmental) | |
|---|---|---|
Type of onset | Rapid (war from April 2023) | Slow (several failed rainy seasons) |
Main movement | Internal and cross-border, to neighbouring countries | Mostly internal, rural to urban |
Scale | 11.6 million IDPs, 2.8 million refugees and asylum seekers abroad (end of 2024) | 3.1 million IDPs (early 2023) |
Main consequence for destinations | Camps in eastern Chad; urban pressure in Egypt | Overcrowded camps in Baidoa and Mogadishu, disease |
Role of power | Armed groups control territory, aid and borders | Insecurity and weak government limit aid; climate change linked to high-emitting countries |
Sources: Wikipedia, “2020–2023 Horn of Africa drought”, 2026; World Weather Attribution, 27 April 2023; UN and NRC reports via VOA, 2022.
Dhaka, the capital of Bangladesh, stands on the Buriganga River near the centre of the Ganges–Brahmaputra delta, on low, flat land crossed by rivers and canals and flooded by monsoon rains. The city proper had 10.3 million people at the 2022 census, but the continuous urban area is far larger: the UN’s World Urbanization Prospects 2025 estimated 36.6 million people in the Dhaka urban agglomeration, the second largest in the world after Jakarta. The city proper has an average density of about 33,600 people per km², and Dhaka is often described as the most densely populated large built-up area on Earth.

Dhaka is the primate city of Bangladesh, the centre of government, finance and industry for a country of 174 million people (2024) in which only about a third live in urban areas. Rural–urban migration has been the main driver: in the 1960s and 1970s about 60% of the city’s growth came from migrants.
Rural push factors include small and fragmented farms, landlessness, low farm wages, and environmental hazards such as river-bank erosion, floods and cyclones in the coastal south. The main pull is work. Bangladesh’s ready-made garment industry employed about 4.2 million people in 2025, 54% of them women, in large clusters around Dhaka, Gazipur and Narayanganj, and garments earned about 80.6% of the country’s US$48 billion of merchandise exports in 2025–26.
Natural increase adds to the growth, because most migrants are young adults. Together, migration and natural increase have pushed Dhaka’s growth far ahead of the government’s capacity to provide housing, transport, water and drainage.
For many migrants, the city has brought real gains. A factory job pays a regular cash wage, with a minimum monthly wage for garment workers of Tk 12,500 from November 2023, far above typical rural earnings for women. Women’s employment in the garment industry has been linked to later marriage, more schooling for girls and smaller families, so the growth of Dhaka has contributed to the fall in Bangladesh’s fertility to 2.1 in 2024. Remittances from urban workers support families in villages across the country.
The costs fall most heavily on the poor. About 30% of Dhaka’s population lived in informal settlements in 2016. Kamrangirchar, on a low island in the Buriganga, had about 600,000 people living in slum conditions in 2021, and the Korail settlement sits on government land beside a lake, overlooked by the towers of the wealthy Gulshan district. Residents face insecure tenure and the risk of eviction, fires, flooding, and shared toilets and water points. Many work in the informal sector as rickshaw pullers, street vendors or domestic workers.

Some problems affect every group. Average traffic speeds by car have fallen below 7 km per hour, and congestion was estimated to cost the economy US$6.5 billion a year in 2020. About 87% of the city’s water came from groundwater in 2021, and the water table was falling by 2–3 m a year. About 70% of the two million cubic metres of sewage produced each day is discharged untreated into rivers, and Dhaka was among the world’s 20 most polluted cities for air quality in 2024.
Group | Main benefits of Dhaka’s growth | Main costs |
|---|---|---|
Garment workers (mostly young women) | Cash wages, independence, later marriage | Low pay, long hours, unsafe workplaces, insecure housing |
Residents of informal settlements | Access to jobs and city services | Eviction risk, fires, flooding, poor sanitation |
Middle-class and wealthy residents | Professional jobs, education, consumer goods | Congestion, air pollution, high land prices |
Rural families of migrants | Remittances, information, links to the city | Loss of young workers; ageing villages |
City and national government | Export earnings and tax revenue | Infrastructure demands that grow faster than budgets |
The government has invested heavily in transport. The first section of Dhaka’s Metro Rail, MRT Line 6 from Uttara to Agargaon, began commercial service on 28 December 2022, and further lines are planned; an elevated expressway and a 20.5 km bus rapid transit corridor to Gazipur aim to cut journey times. The Dasherkandi sewage treatment plant, opened in 2023, can treat 500 million litres a day, but the city produces about 2,000 million. Slum upgrading by NGOs has improved water points, paths and toilets in some settlements, but evictions continue elsewhere.
These responses show both the possibilities and the limits of management. The metro offers fast, reliable journeys to the people along its route, but it serves only a small share of a city of more than 30 million, and fares can be too high for the poorest. Sewage treatment capacity covers about a quarter of the need. A common proposal is to ease Dhaka’s problems by spreading growth to other cities, such as Chattogram, through decentralised investment, so that the primate city stops absorbing almost all new urban jobs.
Sources: UN DESA, World Urbanization Prospects 2025 (via Wikipedia, “Megacity”); Bangladesh Bureau of Statistics census 2022 and other sources via Wikipedia, “Dhaka” and “Textile industry in Bangladesh”, 2026; World Bank WDI, 2024.
Analysis questions
To what extent have women gained from the growth of Dhaka?
Examine why Dhaka’s infrastructure has not kept pace with its population growth.
Evaluate the Metro Rail as a response to the challenges of megacity growth.
This subtopic appears in Paper 2 through structured questions on a stimulus (often a population pyramid, a line graph of rates or a map of displacement), the Section B infographic and Section C essays. Calculations are short: a natural increase rate, a dependency ratio, a percentage or a difference read from a graph.
The table shows fertility and life expectancy for six countries in 2024 (World Bank).
Country | Total fertility rate (births per woman) | Life expectancy (years) | Infant mortality (per 1,000 live births) |
|---|---|---|---|
Niger | 5.94 | 61.4 | 65.6 |
Nigeria | 4.38 | 54.6 | 69.8 |
Bangladesh | 2.14 | 74.9 | 24.4 |
India | 1.96 | 72.2 | 23.3 |
United Kingdom | 1.55 | 81.4 | 4.1 |
Japan | 1.15 | 84.0 | 1.8 |
Part (b) asks for suggestions, which must be linked to the stimulus country.
Part (c) draws on the wider subtopic.
The infographic “Forced to flee, 2024” shows: a headline total of 123.2 million forcibly displaced people at the end of 2024; a bar chart of the largest displacement situations (Sudan 14.3 million, Syria 13.5 million, Afghanistan 10.3 million, Ukraine 8.8 million); a map of the largest refugee hosts as proportional circles (Iran 3.5 million, Türkiye 2.9 million, Colombia 2.8 million, Germany 2.7 million, Uganda 1.8 million); a pie chart showing that about 60% of the displaced (73.5 million) are IDPs; and the statement “Two-thirds of refugees stay in neighbouring countries”.
Sources: Infographic data from UNHCR, Global Trends 2024.
Part (b) needs a link to the infographic and one development.
Part (c) needs evidence from the infographic on both sides and an overall judgment.
Population change = (births − deaths) + net migration. The natural increase rate is (birth rate − death rate) ÷ 10, in % per year; doubling time ≈ 70 ÷ growth rate.
The total fertility rate measures family size; replacement level is about 2.1. World TFR fell from 4.7 (1960) to 2.2 (2024), and life expectancy rose from 51 to 73.5 years.
Fertility falls with girls’ education, women’s work, contraception, falling child mortality, urbanisation and the rising cost of children.
The DTM has five stages, from high birth and death rates to natural decrease; it describes many countries well but ignores migration and predicts poorly.
Population pyramids are expansive, stationary or constrictive; bulges and notches record baby booms, wars and migration.
The dependency ratio is (0–14 + 65+) ÷ 15–64 × 100; Niger (96.8) and Japan (70.1) both have high dependency, but of children and older people respectively.
Megacity growth brings agglomeration economies, jobs and services, but also informal settlements, informal work, congestion and pollution, with costs and benefits unequal between groups (Dhaka).
Refugees have crossed a border; IDPs have not; asylum seekers await a decision; stateless people have no nationality. Environmental migrants have no legal refugee status.
At the end of 2024, 123.2 million people were forcibly displaced, mostly within their own countries or in neighbouring low- and middle-income countries.
Sudan (political, since 2023) and the Horn of Africa drought (environmental, 2020–2023) show contrasting causes, movements and consequences for people and places.
I can determine natural increase, doubling time and dependency ratios from data, with units.
I can explain why fertility and mortality fall, and why fertility remains high in countries such as Niger.
I can draw the DTM and describe and explain each of its five stages with a real country.
I can evaluate the strengths and limitations of the DTM.
I can construct and analyse a population pyramid, naming its shape and explaining bulges and notches.
I can compare population change in Niger and Japan using real data.
I can examine the consequences of Dhaka’s growth for different groups, and evaluate the responses.
I can distinguish refugees, asylum seekers, IDPs, stateless persons and environmental migrants.
I can explain the causes and consequences of two contrasting forced movements, Sudan and the Horn of Africa drought.
As cities mature, their share of growth from natural increase rises: fertility falls more slowly than mortality, and the large base of young urban-born residents sustains growth even if migration slows.
Where fertility has fallen to low levels (eg Chinese cities, where it is well below replacement), natural increase is small or negative and migration is the main source of growth.
Government policy can change the balance, eg hukou reform in China easing migration into smaller cities, or past restrictions on movement (apartheid-era influx control in South Africa).
Shocks may reverse migration temporarily, eg migrant workers leaving Indian cities during the COVID-19 lockdown of 2020.
Good answers may be well structured (AO4) and may additionally offer a critical evaluation (AO3) which examines how the relative importance of the two processes varies between places (contrasting stages of the demographic transition, East Asian versus African cities) and over time (migration-led growth in early industrialization giving way to natural-increase-led growth later). Another approach might be to argue that the two cannot be fully separated, since migrants' children are counted as natural increase, or to question the reliability of the data (informal settlements are undercounted; boundary changes and reclassification inflate apparent growth). Some answers may conclude that migration explains the rate of urbanization while natural increase increasingly explains the scale of urban growth.
For 5–6 marks, expect some weakly-evidenced outlining of natural increase and/or rural–urban migration as causes of urban growth.
For 7–8 marks, expect a structured account which includes:
either well-evidenced explanation of both natural increase and rural–urban migration, supported by located examples (do not expect perfect balance)
or a discursive conclusion (or ongoing evaluation) of their relative importance, grounded in geographical concepts and/or perspectives, such as how it varies between places or over time.
For 9–10 marks, expect both of these traits.
NB. Maximum [6] if the response refers only to cities in high-income countries, or explains only one of the two processes.
Marks | Level descriptor |
|---|---|
0 | The response does not reach a standard described by the descriptors below. |
1–2 | Too brief, lists unconnected information, not focused on the question and lacks structure. Knowledge is very general, with large gaps or errors; examples or case studies are missing or only listed. No analysis; terminology is missing or used incorrectly. |
3–4 | Too general, lacks detail, not focused on the question and largely unstructured. Outlines examples, statistics and facts, both relevant and irrelevant, with links to the question only listed. Basic terminology is used, with errors or inconsistently. No critical evaluation of evidence; any conclusion is irrelevant. |
5–6 | Partially addresses the question, with a narrow argument, an unsubstantiated conclusion and limited evaluation. Describes relevant supporting evidence (examples, case studies) and outlines links to the question. The argument repeats one point or covers only part of the question. Other perspectives, or strengths and weaknesses of evidence, are listed. |
7–8 | Addresses the whole question; the analysis is evaluated and the conclusion is relevant but lacks balance. Relevant evidence is described correctly and covers all the main points. The argument is clear but one-sided or unbalanced. Complex terminology is used correctly but not consistently. Other perspectives, or strengths and weaknesses of evidence, are described. |
9–10 | In-depth and specific to the question (topic and command term). Correct, relevant examples, statistics and detail are integrated and their link to the question explained. The argument is balanced, explaining complexity, exceptions and comparisons. Evaluation of evidence and perspectives is well developed, and the conclusion is balanced and aligned with the evidence. Logically structured and easy to follow. |
“The global distribution of population is explained more by the history of farming and settlement than by present-day economic opportunities.” To what extent do you agree with this statement?
10 marks
“Voluntary internal migration always widens the gap between core and periphery regions.” To what extent do you agree with this statement?
10 marks