Explain where and why people live where they do, classify countries by income and human development, and analyse core–periphery patterns, internal migration and megacity growth using Australia and Indonesia.
Each is in the Geography glossary, with every other term in the subject.
An intergovernmental group of major emerging economies, founded as BRIC by Brazil, Russia, India and China in 2009, joined by South Africa in 2010 and enlarged from 2024.
A region with a concentration of people, economic activity, investment and political power, usually centred on a capital city, port or industrial area.
A spatial pattern in which a dominant core region, holding most of a country’s wealth, investment and power, is surrounded by less developed peripheral regions that depend on it.
A multidimensional process of positive change in the economic, social, political, environmental and cultural conditions of people’s lives, improving their wellbeing and choices.
A person who moves voluntarily, within a country or between countries, mainly to find work or earn higher wages.
A middle-income country with rapid economic growth, industrialisation and a growing role in world trade and investment, such as China, India, Brazil, Indonesia or Mexico.
A broad term for the wealthier, mainly high-income countries of North America, Europe, East Asia and Australasia, describing their shared economic and political position rather than their location.
A broad term for the lower-income countries of Africa, Latin America, Asia and Oceania, many of them former colonies, describing their shared economic and political position in the world.
Distinguish between population distribution and density, and determine density from a population and an area.
Describe the global pattern of population distribution, locating the main clusters and sparse areas.
Explain how physical factors and human factors affect where people live, and why their relative importance varies with scale and over time.
Distinguish between GDP, GNI and purchasing power parity, and explain why one measure cannot capture development.
Classify countries as low-, middle- or high-income using the World Bank thresholds, and describe the global pattern of income groups and emerging economies.
Analyse a scatter graph of income against life expectancy, and use the HDI to identify countries whose wellbeing differs from their income.
Explain core–periphery patterns, voluntary internal migration and megacity growth, and evaluate whether migration reduces regional inequality.
Examine two contrasting examples of uneven population distribution: Australia and Indonesia.
About 8.2 billion people lived on Earth in 2025, but they are spread very unevenly. Some places hold more than a thousand people on every square kilometre, while vast deserts, ice sheets and mountain ranges are almost empty. Where people live is closely linked to how wealthy places are, because people move towards jobs and investment, and investment follows people.
The topic is about place above all: why one place attracts millions of people and another very few. It is also about process, because migration and economic growth constantly redraw the map, and about the spatial interactions (flows of people, money and goods) that connect rich core regions with poorer peripheries.
159 exam-style questions on this subtopic, written in the style of the IB papers. The first has its markscheme open. Counted on
To what extent is population size a good indicator of a city’s position in the urban hierarchy?
10 marks
Marks should be allocated according to the markbands.
The urban hierarchy ranks settlements by their size and importance, from hamlets and villages through towns and cities to conurbations, megacities (cities of 10 million people or more) and global or world cities. Traditionally, rank is based on population and on the range and number of functions and services a place provides (higher-order places serve larger spheres of influence). The question asks whether population alone places a city correctly in the hierarchy, so answers should consider other measures such as functions, economic power, connectivity and influence.
Possible applied themes (AO2) demonstrating knowledge and understanding (AO1):
Population size broadly correlates with the number and order of services: a megacity has more hospitals, universities, specialist shops and offices than a market town, so population is a quick and widely available measure.
The rank-size rule and primacy: in many countries the largest city dominates far beyond its population share (eg Bangkok, Lima or Paris as primate cities), while in others (eg Germany) the hierarchy is more even.
Megacities are now mostly in Asia and in low- and middle-income countries (eg Dhaka, Karachi, Kinshasa and Lagos), but several have less global economic influence than much smaller cities.
World cities are ranked by command and control functions (TNC headquarters, stock exchanges, global finance, media, culture): London or New York rank above far larger megacities, and smaller cities such as Zurich, Geneva or Singapore have influence well above their size.
Capital and administrative functions can raise a city's position: Washington DC, Canberra and Brasília are not their countries' largest cities but hold national political power.
With a free account, Augment remembers where you stopped and what you have practiced.
The total value of all goods and services produced within a country’s borders in one year, regardless of who owns the businesses producing them.
The total income earned by a country’s residents and businesses in a year, including income from abroad and excluding income paid to non-residents; GNI per capita divides it by the population.
A country whose GNI per capita (World Bank Atlas method) is above the high-income threshold, US$14,375 in the classification published in July 2026.
A composite index published by the UNDP that combines life expectancy, education (mean and expected years of schooling) and GNI per capita (PPP) into a value between 0 and 1.
Migration within the borders of one country, such as from a rural area to a city or from one region to another.
Migration across an international border, from one country to another, to live there for at least a year.
A barrier between a place of origin and a destination, such as distance, travel cost, a border, immigration laws or language, that makes migration more difficult.
A country whose GNI per capita (World Bank Atlas method) is at or below the low-income threshold, US$1,175 in the classification published in July 2026.
An urban area (urban agglomeration) with a population of 10 million or more.
A country whose GNI per capita (Atlas method) lies between the low- and high-income thresholds (US$1,176–14,375 in July 2026), split into lower-middle and upper-middle income at US$4,635.
The movement of people from one place to another with the intention of settling, temporarily or permanently, usually for at least a year.
A region with lower levels of economic development, investment and services than the core, which often loses young people and resources to the core.
The number of people living in a unit of area, calculated as total population divided by land area and usually given in people per km².
The way in which people are spread across an area, describing where they are concentrated and where they are sparse or absent.
A city that is much larger than any other in its country, usually more than twice the size of the second city, and dominates its economic, political and cultural life.
A positive feature of a destination, such as jobs, higher wages, services or safety, that attracts migrants to it.
An adjustment that converts incomes into a common currency according to what they can buy locally, so that differences in the cost of living between countries are taken into account.
A negative feature of a place of origin, such as unemployment, poverty, conflict or environmental hazard, that encourages people to leave it.
The movement of people from rural areas to towns and cities, usually in search of work, higher incomes and better services.
An increase in the proportion of a population living in urban areas, caused by rural–urban migration, natural increase in towns and cities, and the reclassification of rural settlements.
Migration in which people choose to move, usually to improve their economic or social opportunities, rather than being forced to leave.
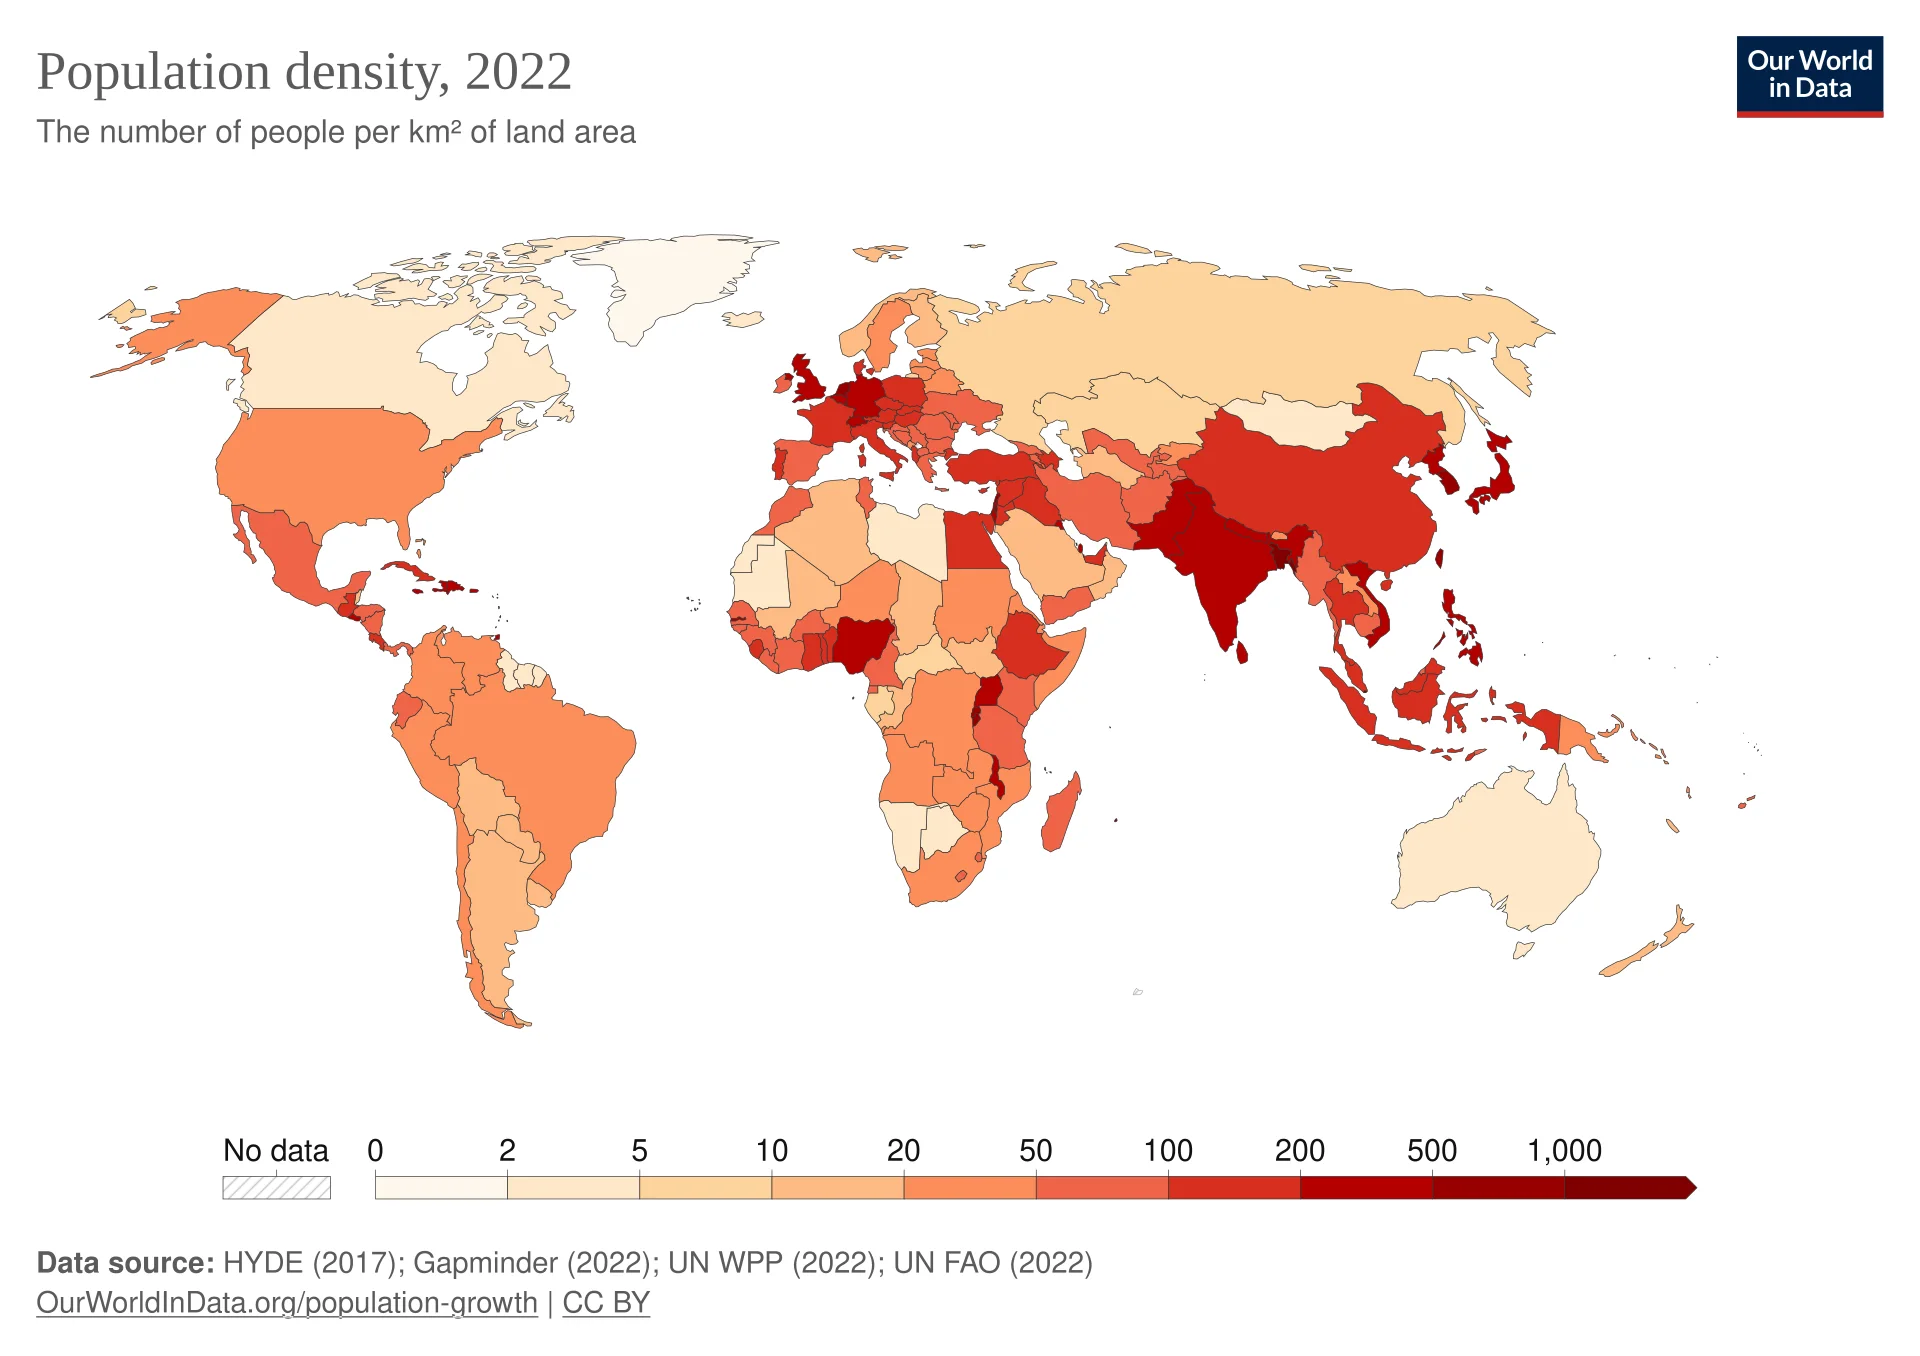
Two terms describe where people live. Population distribution is the pattern of where people are found and absent; population density is a measurement of how many people live in a given area, usually in people per square kilometre (people per km²).
Distribution is described in words and maps: Egypt’s population is concentrated along the Nile, and Canada’s is linear, strung out along its southern border. Density puts a number on crowding, so that places of different sizes can be compared.
World population reached about 8.2 billion in 2025. Its distribution is highly uneven at every scale. Almost 90% of people live in the Northern Hemisphere, which holds about two-thirds of the world’s land. Asia alone holds about 4.8 billion people, close to 59% of the total, on about 30% of the land area.
Four large clusters stand out on a map of density: East Asia (eastern China, Korea and Japan), South Asia (the Ganges–Brahmaputra plain of India and Bangladesh, and Pakistan’s Indus valley), Europe, and north-eastern North America. Smaller dense clusters include the Nile valley, coastal West Africa, Java and the East African highlands. The sparse areas are hot deserts (the Sahara, central Australia), cold lands (northern Canada, Siberia), high mountains (the Tibetan Plateau, the Andes) and dense tropical forest (the Amazon and Congo basins).
The map is a choropleth map: each country is shaded according to its average density, in classes from 0–2 to over 1,000 people per km². Choropleth maps show broad patterns well but have two weaknesses: large units hide internal variation (China looks uniformly dense although its west is almost empty), and countries with 21 and 49 people per km² fall in the same class. A dot map, on which each dot stands for a fixed number of people, shows the distribution within countries more faithfully.
Physical factors are the natural features of an environment. Each makes a place easier or harder to live in, mainly by affecting how much food can be grown. Areas that favour settlement are sometimes called positive areas; those that discourage it are negative areas.
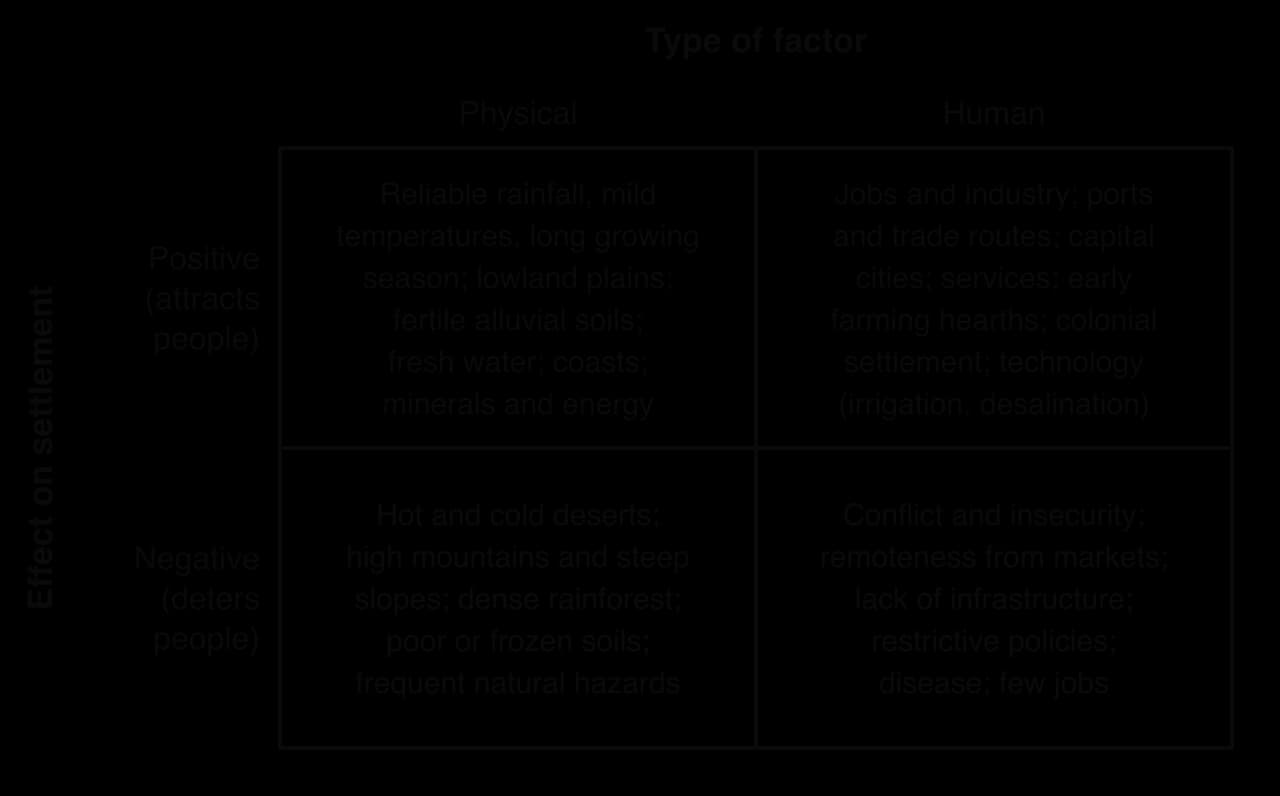
Climate is the most important physical factor at the global scale. Farming needs reliable rainfall and a growing season long enough for crops to ripen. The monsoon lands of South and East Asia support very high densities because summer rains allow two or even three rice harvests a year.
Climates that are too dry or too cold deter settlement. Hot deserts such as the Sahara receive little and unreliable rain; in northern Siberia the ground is frozen for most of the year and the growing season is too short for most crops. Reliability matters as much as the total, because frequent droughts make farming risky.
Lowland plains are easier to farm, build on and cross than mountains, so river plains such as the Ganges, the Yangtze and the North European Plain are densely populated. Steep slopes have thin soils that erode when cleared and make transport expensive, and high altitude brings cold and thin air, so the Tibetan Plateau is among the emptiest places in Asia.
In the tropics, however, altitude can attract people, because highlands are cooler and less affected by malaria: Ethiopia’s highlands, the Andean valleys around Quito and the Mexican plateau are densely settled.
Temperature falls by roughly 6 °C for every 1,000 m of height. In the tropics this turns hot, humid lowlands into mild highlands where mosquitoes that carry malaria breed less, and where the tsetse fly, which spreads sleeping sickness to people and a similar disease to cattle, is rare. Highlands also often receive more reliable rain, because air is forced to rise over them, and in East Africa many have fertile volcanic soils.
The result is the opposite of the pattern in temperate latitudes. The highlands of Ethiopia, Kenya, Rwanda and Burundi are among the most densely farmed parts of Africa, while many nearby lowlands are thinly settled.
Fertile soils give high yields and support more people per km². The most fertile are often alluvial soils, deposited by rivers on floodplains and deltas, and mineral-rich volcanic soils, which support Java’s dense population. Thin, leached or waterlogged soils support far fewer people.
Fresh water is needed for drinking, farming and industry, so in dry regions people concentrate wherever it is available: along rivers, around oases or above aquifers. Egypt is the clearest example. The Nile valley and delta cover only about 5% of Egypt’s area but hold almost all of its people, and only about 3.5% of the country is cultivated and permanently settled.
Dense tropical rainforest is difficult to clear, farm and cross, and its soils lose fertility quickly once the forest is removed, so the Amazon and Congo basins have low densities outside their river corridors and cities. Grasslands and temperate forests were easier to clear.
Minerals and energy attract people even to hostile environments, because they create jobs and incomes high enough to pay for imported food, water and housing. Johannesburg grew from almost nothing after gold was found on the Witwatersrand in 1886; the Ruhr in Germany became one of Europe’s densest industrial regions because it sat on a coalfield; and oil and gas turned small settlements in the Gulf deserts into large cities. Fort McMurray in northern Canada grew with the Alberta oil sands. Settlements that depend on one resource can shrink just as quickly when it is exhausted or its price falls.
Coasts attract people for fishing, trade and, in many latitudes, a milder climate than the interior. Sea transport is cheap, so ports became centres of industry and commerce, and many of the world’s largest cities, from Shanghai and Mumbai to New York and Lagos, are on coasts or estuaries. Coastal lowlands and deltas also tend to have flat land and fertile alluvial soils, so several physical advantages often occur together.
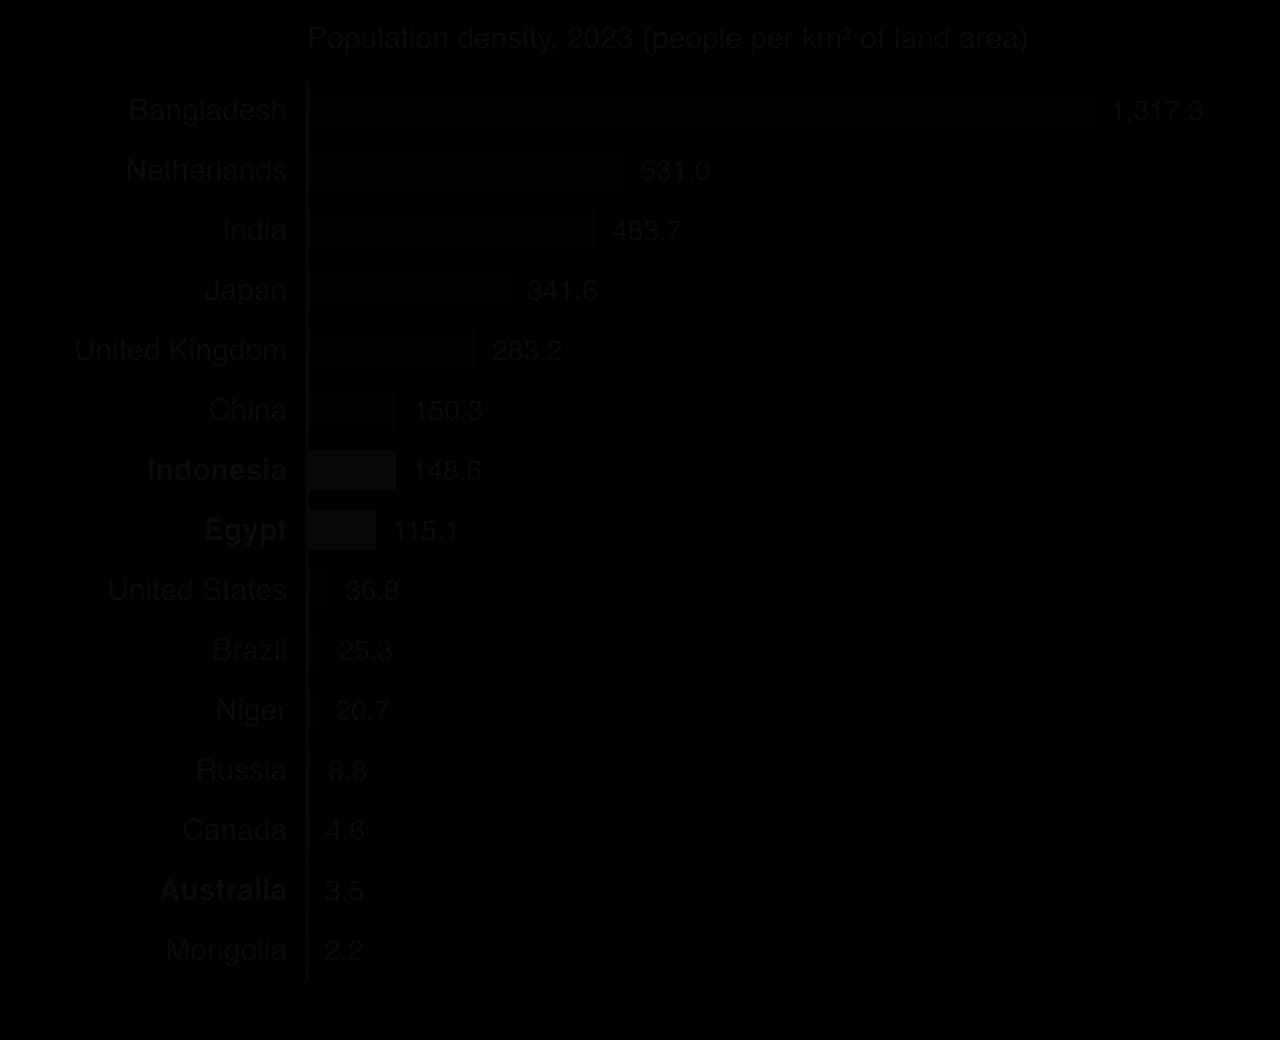
Natural hazards can deter settlement, but often they do not, because the processes that create a hazard also create benefits: volcanoes produce fertile soils and floods deposit alluvium. Bangladesh, with about 1,317 people per km² in 2023, is one of the most flood- and cyclone-prone countries in the world, yet the fertility of the Ganges–Brahmaputra delta has supported dense farming populations for centuries.
Human factors are the economic, political, social, historical and technological features that people create. They have become more important over the last two centuries, as industry and services replaced farming and technology weakened physical limits.
People move to where work and incomes are. Factories, offices and services cluster in a few places because firms gain from being near customers, suppliers and skilled workers, and each new firm makes the place more attractive to the next. Urban regions such as the Pearl River Delta in southern China are clusters of jobs as much as of people. Trade has the same effect: many of the biggest cities, from Shanghai to Lagos, grew as ports, and the cheapest places to export from attract the most investment.
Economic change can also empty places. When coal mining, steelmaking or textiles decline, as in parts of northern England and the Rust Belt of the north-eastern United States from the 1970s, young adults leave for regions with growing industries, and populations fall or age. Economic factors therefore explain change in distribution as well as the pattern at one time.
Governments influence distribution in several ways. Capital cities concentrate government jobs and investment, and planned capitals such as Brasília (1960) were built to draw settlement inland. Policies can encourage or restrict migration, as China’s household registration system and Indonesia’s transmigration programme show, and conflict pushes people out while stability attracts investment.
Present-day patterns often reflect history. Early agricultural hearths, such as the Fertile Crescent, the Yellow River valley and the Indus valley, have been densely settled for thousands of years. Colonial settlement shaped the population of many former colonies: in Australia, Canada, Brazil and much of Africa, colonial powers built ports and administrative centres on the coast, and those cities still dominate today.
Technology allows people to overcome physical limits. Irrigation turns dry land into farmland, as in California’s Central Valley. Desalination supplies drinking water to Gulf cities such as Dubai and Doha. Air conditioning has made hot cities such as Phoenix and Riyadh comfortable to live in. Each of these technologies costs energy and money, so the physical limits remain in the form of a higher cost of living, and wealthier societies can settle places that poorer ones cannot.
In 1935 the Chinese geographer Hu Huanyong drew a line from Heihe in the north-east to Tengchong in the south-west. East of the line live about 94% of China’s people on about 43% of its land; west of it, 6% of the people live on 57% of the land. The line roughly follows the 400 mm annual rainfall line (isohyet), which separates humid land suited to crop farming from dry grassland, desert and high plateau. The pattern has hardly changed in 90 years, because the provinces east of the line also became the centre of industry and trade.
Sources: Hu line figures from Naughton (2007) via Wikipedia, “Heihe–Tengchong Line”, 2026; Egypt from Wikipedia, “Geography of Egypt”, 2026; World Bank WDI (population 2025, agricultural employment 2023).
A dense cluster usually exists because physical advantages attracted people first and human factors then reinforced them. The relative importance of each depends on the scale of study and on time.
Scale | Physical factors | Human factors | Example |
|---|---|---|---|
Global | Usually dominant: climate, relief and water explain where the great clusters and empty areas are | Reinforce the pattern through trade, industry and history | Monsoon Asia is dense; the Sahara, Siberia and Antarctica are almost empty |
National | Set the broad limits | Often decisive: capitals, ports, industrial regions, policy and colonial history | Australia’s coastal capitals; China’s coastal provinces |
Local | Site factors such as flood risk, slope and water supply | Usually dominant: jobs, housing costs, transport, planning rules | Growth along a new metro line or a motorway corridor |
Over time, human factors have gained importance. Before industrialisation most people were farmers, so the land’s capacity to grow food largely set density. In high-income countries today, only about 3% of workers are in farming (2023), against about 61% in low-income countries, and people live where service jobs are, which may be on poor soil in a cold or arid climate.
The balance also varies between places: in Niger, rainfall and access to the Niger River still largely determine where people live, while in the Netherlands land reclamation, planning and ports explain most of the pattern. A balanced judgment is that physical factors explain most of the global pattern at the broad scale, while human factors increasingly explain it at national and local scales, especially in wealthier countries.
Development is a process of change that improves people’s lives. It has economic, social (health, education, housing), political (rights, security), environmental and cultural dimensions. Because these dimensions do not always move together, no single number can measure development completely.
The most common economic measures add up the value of everything an economy produces in a year. Gross domestic product (GDP) counts all goods and services produced inside a country’s borders, whoever owns the business. Gross national income (GNI) counts the income earned by a country’s residents and businesses, wherever in the world they earn it. GNI is GDP plus income received from abroad minus income paid to foreigners, such as profits sent home by foreign-owned companies.
GNI is the measure the World Bank uses to classify countries, because it reflects the income that residents can actually use.
The difference matters in countries with a lot of foreign ownership. Ireland hosts the European headquarters of many technology and pharmaceutical transnational corporations (TNCs), whose profits are counted in Irish GDP but largely belong to shareholders abroad. In 2024 Ireland’s GDP per capita was about US$112,900, but its GNI per capita was US$80,650.
Both measures are given per capita (per person), by dividing the total by the population. Otherwise large countries would always look richer: India’s total GDP is far larger than Norway’s, but its income per person is far lower.
Incomes are first measured in each country’s own currency and then converted into US dollars. The World Bank uses the Atlas method, which converts at market exchange rates averaged over three years. However, the same dollar buys much more food, housing and transport in India than in the United States. Purchasing power parity (PPP) adjusts incomes for these differences in the cost of living, using the prices of a common basket of goods and services.
The World Bank classifies every economy into four income groups according to its GNI per capita, Atlas method, in the previous year. The thresholds are revised every 1 July. They are adjusted for inflation, so a country changes group when its real income per person, its exchange rate or its population estimate changes.
Income group | GNI per capita, Atlas method (US$), FY2027 | Number of economies | Examples |
|---|---|---|---|
Low income | 1,175 or less | 25 | Afghanistan, Chad, DRC, Ethiopia, Niger, Sudan, Yemen |
Lower-middle income | 1,176–4,635 | 47 | Bangladesh, Egypt, India, Kenya, Nigeria, Pakistan |
Upper-middle income | 4,636–14,375 | 59 | Brazil, China, Indonesia, Mexico, South Africa, Vietnam |
High income | more than 14,375 | 87 | Australia, Chile, Japan, Russia, Saudi Arabia, United Kingdom |
Sources: World Bank, “World Bank Country and Lending Groups”, FY2027 classification based on 2025 GNI, published 1 July 2026.
The middle-income band is very wide, from US$1,176 to US$14,375, so it is split in two.
Above the upper-middle band lie the high-income countries.
Countries move between groups as their economies change. Bangladesh became a lower-middle-income country in 2015 after decades of growth in garment exports. In July 2024 Bulgaria, Palau and Russia moved up to high income and Algeria, Iran, Mongolia and Ukraine to upper-middle income. In the July 2026 update five economies, Vietnam, the Philippines, Sri Lanka, Jordan and the Federated States of Micronesia, moved up to upper-middle income and Togo moved up from low to lower-middle income; no country moved down. Moves downwards follow wars, economic crises or currency collapses.
The UN still writes “developing country”, but geographers prefer the income groups, which are precise and updated yearly, although they measure only income.
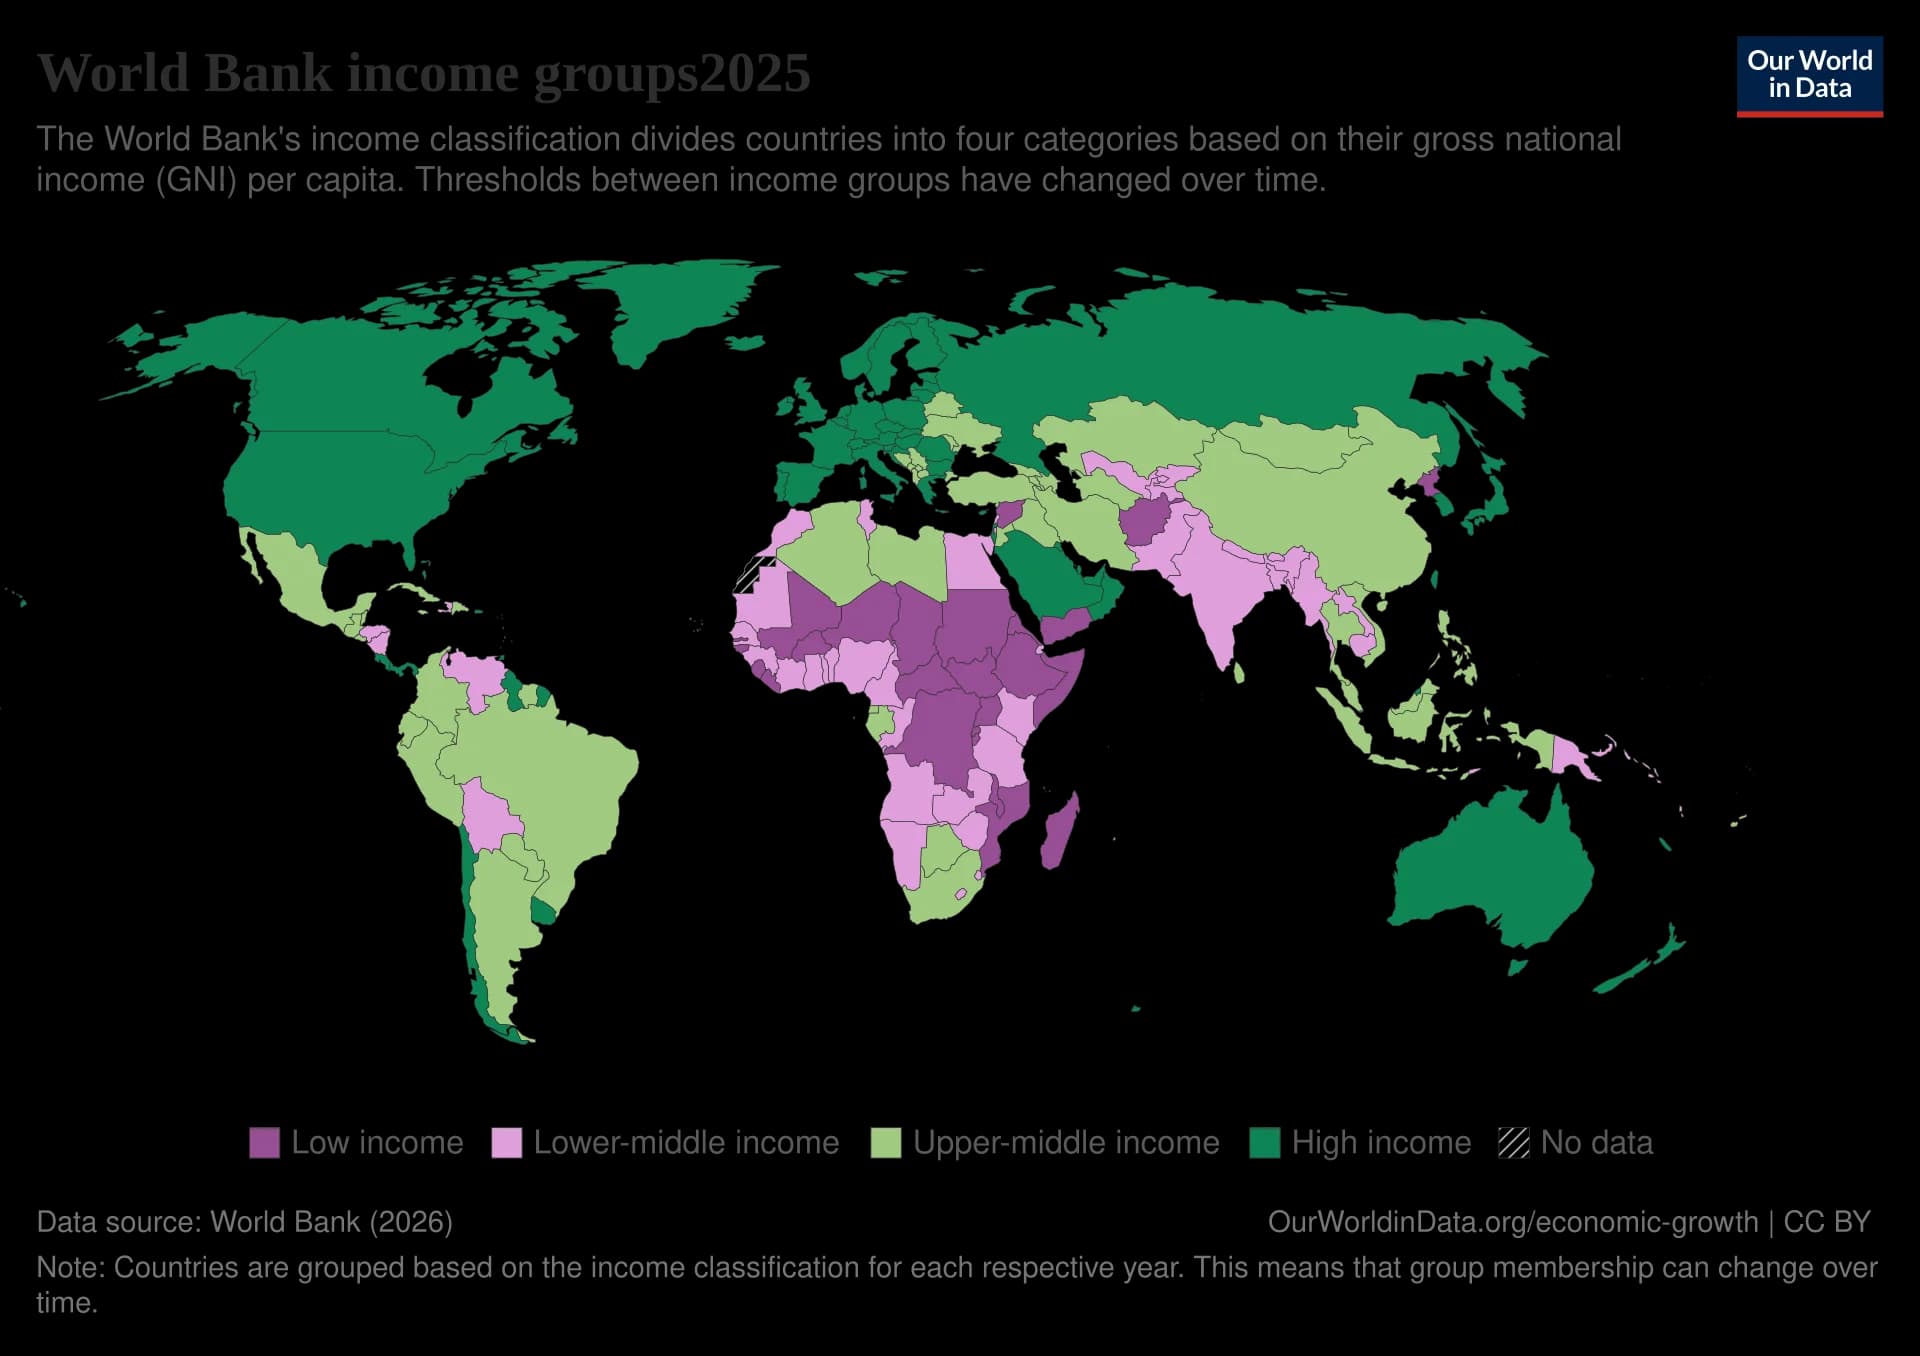
Almost all low-income countries are in sub-Saharan Africa, especially the Sahel, the Horn of Africa and Central Africa; outside Africa only Afghanistan, Syria, Yemen and North Korea, all affected by conflict or isolation, are in the group. Middle-income countries cover most of Asia, Latin America and North Africa. High-income countries are in North America, Europe, Russia, the Gulf states, East Asia (Japan, South Korea), Australia and New Zealand, with a few in Latin America such as Chile, Uruguay and Panama.
The terms Global North and Global South are broad shorthand for this divide. They come from the Brandt line, drawn in a 1980 report chaired by the former German chancellor Willy Brandt, which separated a rich North (including Australia) from a poorer South. They are useful in discussions of power, trade and colonialism, but too crude to describe data: China, Brazil and Saudi Arabia are all “South” on the Brandt line but are now upper-middle- or high-income.
The opposite term groups the countries that were poorer and, in most cases, colonised.
Within the middle-income group, some countries have grown so quickly and become so important in world trade that they are called emerging economies. Typical features are rapid GDP growth (often 5–10% a year for long periods), fast industrialisation and urbanisation, a rising share of world exports, large inflows of foreign direct investment and a growing middle class. China, India, Brazil, Indonesia, Mexico, Vietnam and Türkiye (Turkey) are common examples. An older term is “newly industrialised country”.
BRICS is a named group of such countries, not a category of development. It began as BRIC (Brazil, Russia, India and China), whose leaders first met in 2009; South Africa joined in 2010, and Egypt, Ethiopia, Iran and the United Arab Emirates joined in 2024, followed by Indonesia in January 2025. Saudi Arabia was invited but its membership is disputed. It shows emerging economies seeking more power in world affairs, but its members differ widely: the UAE is high-income, Ethiopia low-income.
Income measures what people earn, not how well they live. The United Nations Development Programme (UNDP) publishes the Human Development Index (HDI), a composite index that combines three dimensions of development: a long and healthy life (life expectancy at birth), knowledge (mean years of schooling of adults and expected years of schooling for children) and a decent standard of living (GNI per capita, PPP). Each becomes an index from 0 to 1, and the HDI is their geometric mean.
Countries are grouped as very high (0.800 and above), high (0.700–0.799), medium (0.550–0.699) and low (below 0.550) human development. In 2023 it ranged from 0.972 in Iceland to 0.388 in South Sudan.
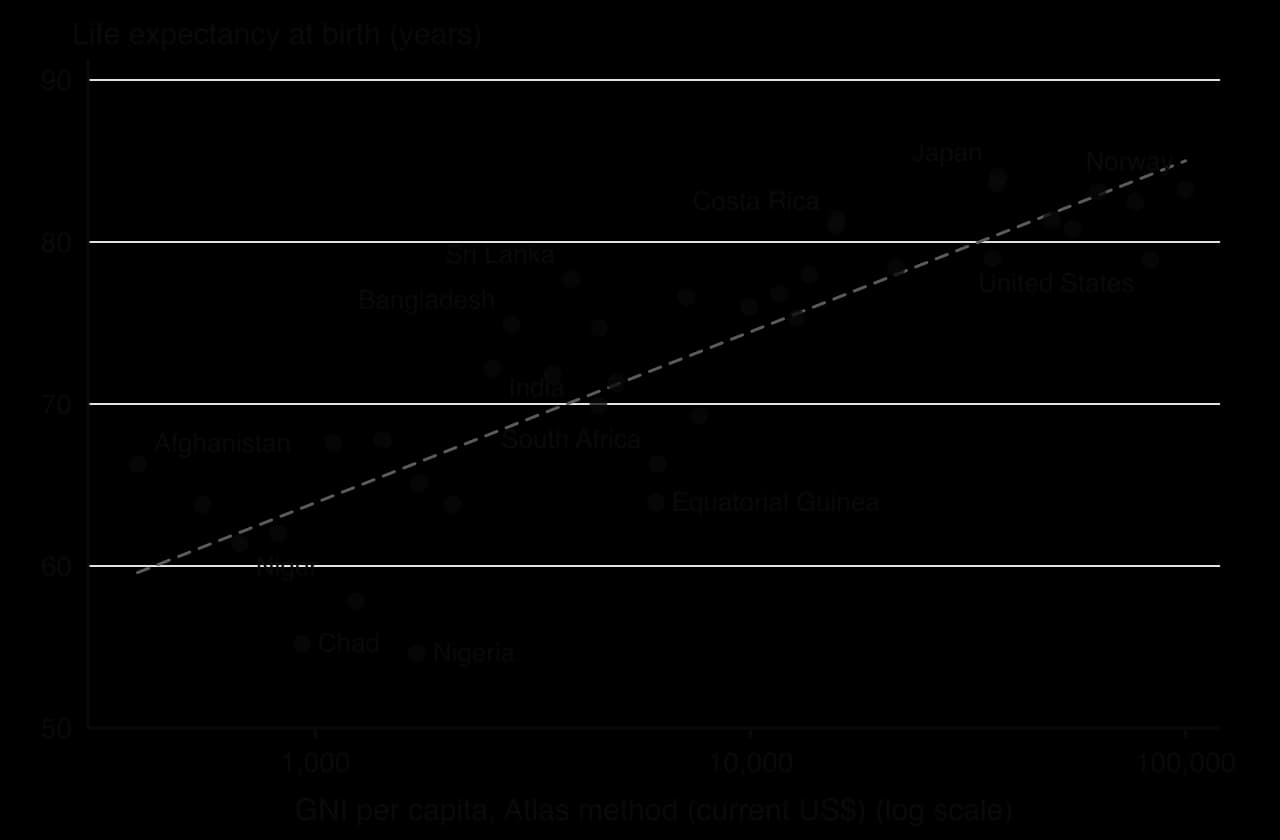
Comparing a country’s income rank with its HDI rank shows how well it turns income into wellbeing. In 2023 Qatar had the fourth-highest GNI per capita (PPP) of 193 countries but ranked 43rd for HDI, because its expected and mean years of schooling are lower than in other rich countries. Sri Lanka ranked about 111th for income but 89th for HDI, and Cuba about 127th for income but 97th for HDI, because both have long invested in free healthcare and education. Equatorial Guinea, an oil exporter, ranked about 109th for income but 133rd for HDI, with a life expectancy of only 64 years.
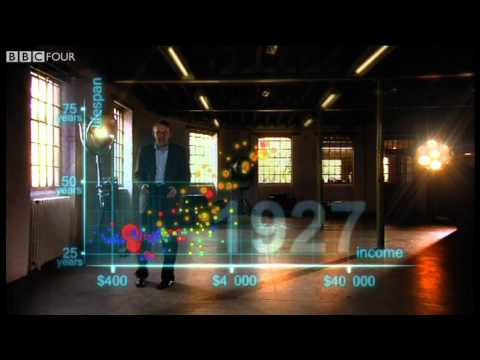 YouTube
Sources: UNDP, Human Development Report 2025 (data for 2023); World Bank WDI (GNI and life expectancy, 2024).
Inside almost every country, people and wealth are concentrated in one or a few regions. A core region is a prosperous area with a high density of people, investment, jobs and political influence: usually the capital city, a major port or an industrial region. A periphery is a region that is less developed, with lower incomes, fewer services and often a declining or slowly growing population. The relationship between the two is called a core–periphery pattern.
The two parts of the pattern are defined separately.
Its opposite is the periphery.
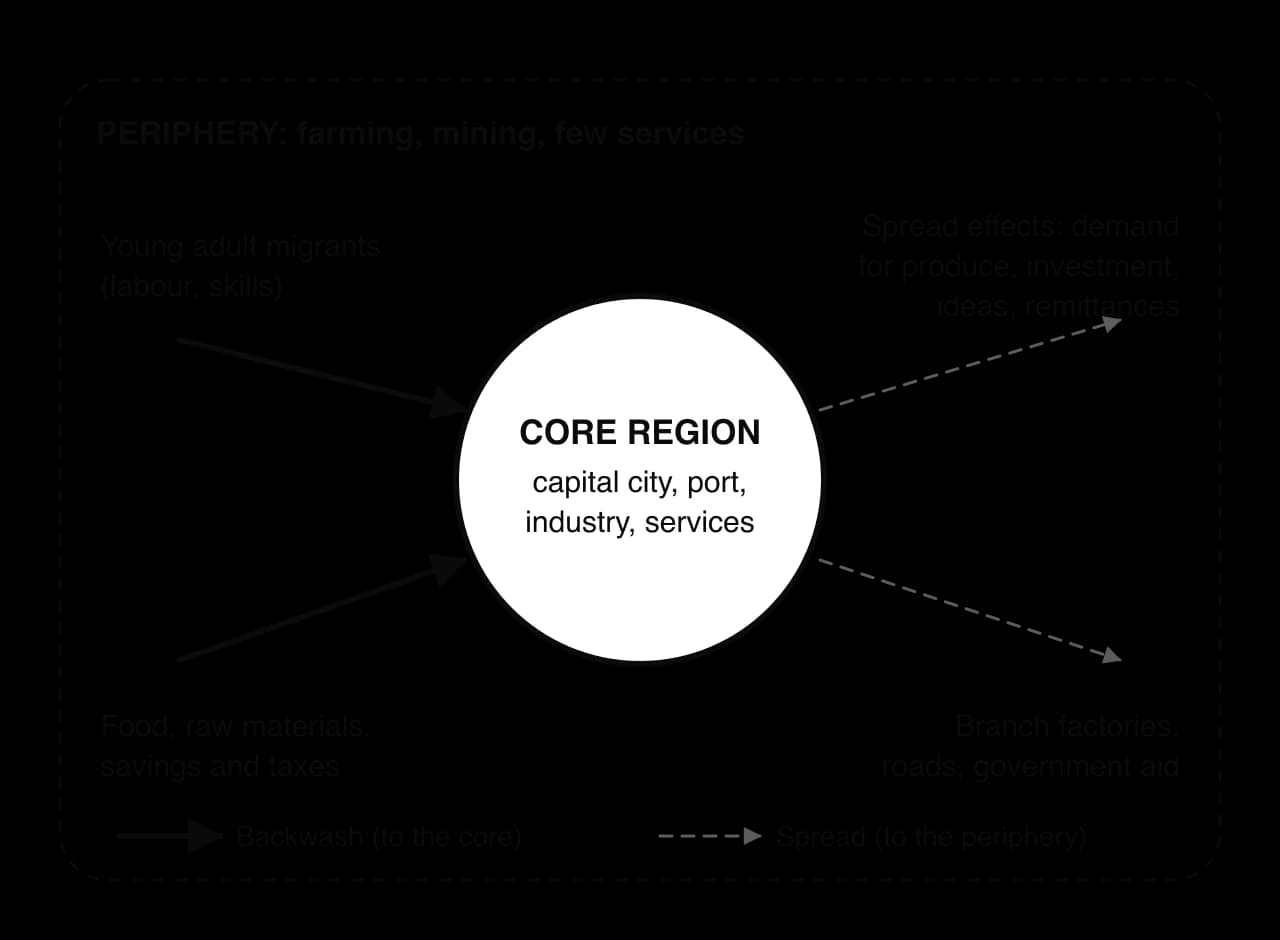
A core grows because it already has advantages. Firms locate where there are customers, workers, suppliers and transport links; new firms bring jobs, which attract migrants, who create more demand, which attracts further firms. This self-reinforcing process is called cumulative causation, and in a core region it works as an upward spiral.
The periphery experiences the opposite. Its young and educated adults move to the core, savings are invested there, and the core’s cheaper products undercut local businesses. These negative effects are called backwash effects, and they explain why regional inequality usually increases in the early stages of growth.
As the core becomes crowded and expensive, some growth spreads outwards. Its demand for food and raw materials benefits peripheral producers, firms open branch factories where land and labour are cheaper, migrants send money home, and governments build roads and schools in the periphery. These are spread effects, and whether they outweigh backwash depends heavily on policy.
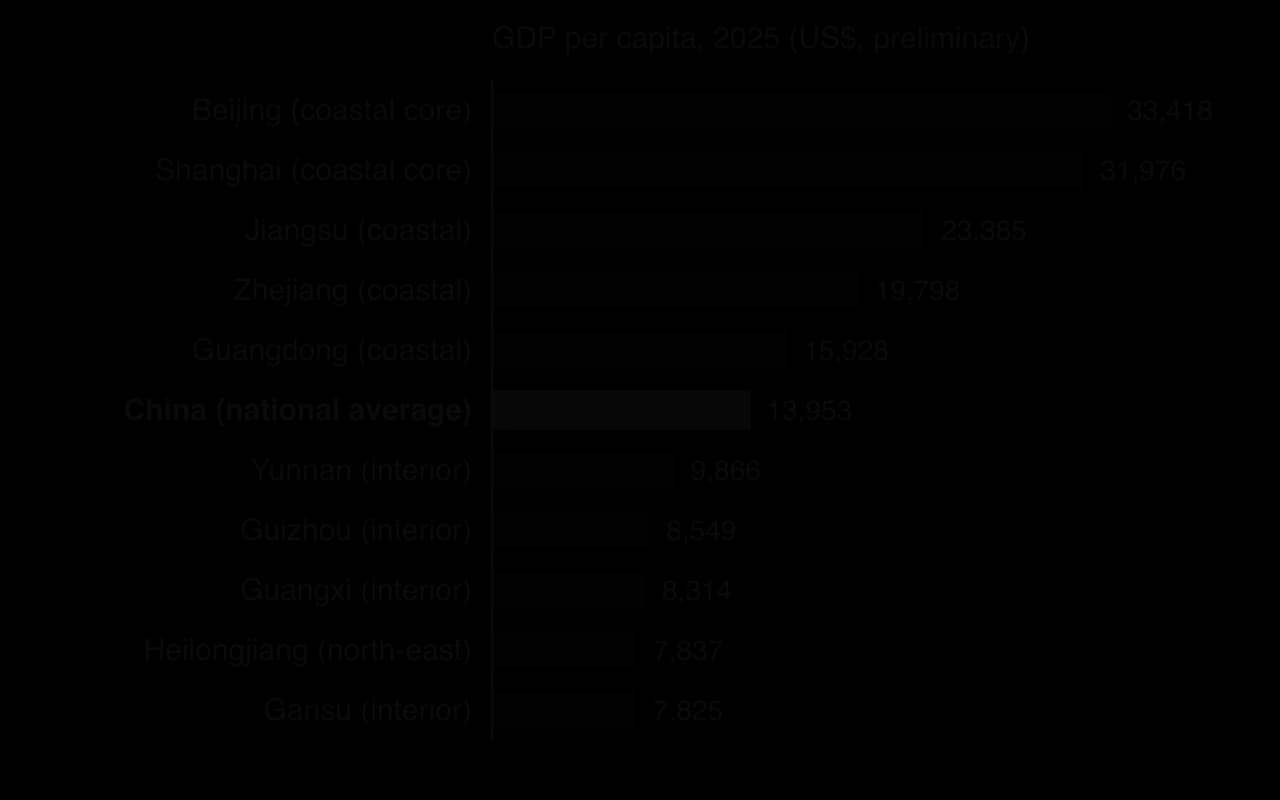
China: the coastal provinces, opened to foreign investment from 1978 and especially after the creation of special economic zones such as Shenzhen in 1980, became the industrial core. In 2025 GDP per capita was about US$33,400 in Beijing and US$32,000 in Shanghai but under US$8,000 in Gansu and Heilongjiang. Since 2000 the government has tried to spread growth inland.
Brazil: the south-east (São Paulo, Rio de Janeiro and Minas Gerais) is the core of industry, finance and population, while the north and the interior were long a periphery of forest, ranching and mining. The new capital, Brasília, opened in 1960 partly to pull development inland.
Migration is the movement of people to live in another place. When the move is within one country it is internal migration; when people cross an international border to live in another country for at least a year it is international migration. Through migration, differences in jobs and incomes between regions become differences in population.
Migration can be placed on a spectrum from voluntary to forced. In voluntary migration people choose to move to improve their lives. People who move voluntarily, mainly to find work or earn higher wages, are called economic migrants. At the other end of the spectrum, forced migration occurs when people have little or no choice, because of conflict, persecution or disaster.
In low- and middle-income countries, the largest internal flow is rural–urban migration: the movement of people from the countryside to towns and cities. It is the main reason for rapid urbanisation in Asia and Africa. Migrants respond to push factors, negative features of the place of origin such as unemployment or hazards that encourage people to leave, and pull factors, positive features of a destination, real or perceived, that attract them.
Push factors from rural areas | Pull factors of cities |
|---|---|
Low and unreliable farm incomes; small plots divided between heirs | More jobs, in factories, construction, services and the informal sector |
Mechanisation of farming, which reduces the need for labour | Higher wages, even for unskilled work |
Drought, floods, river erosion and land degradation | Better schools, hospitals, electricity and water supply |
Lack of land ownership or rising land prices | The “bright lights”: entertainment, freedom from village traditions |
Migrants are rarely a random sample of the population. Migration is selective: it is usually young adults aged about 18–35 who move, because they have the fewest ties and the most to gain. Men have often moved first, although in Bangladesh’s garment industry most new migrants have been young women.
Many migrants move in stages, from village to town to city (step migration), and many follow relatives who provide information, housing and contacts (chain migration).
In 1966 the American demographer Everett Lee proposed a model in which every migration decision weighs the factors at the origin against those at the destination. Each place has positive (+), negative (−) and neutral (0) factors. Between the two lie intervening obstacles: anything that makes the move harder, such as distance, transport costs, a border or a language barrier. Personal factors such as age, family and skills decide how each person perceives the balance.
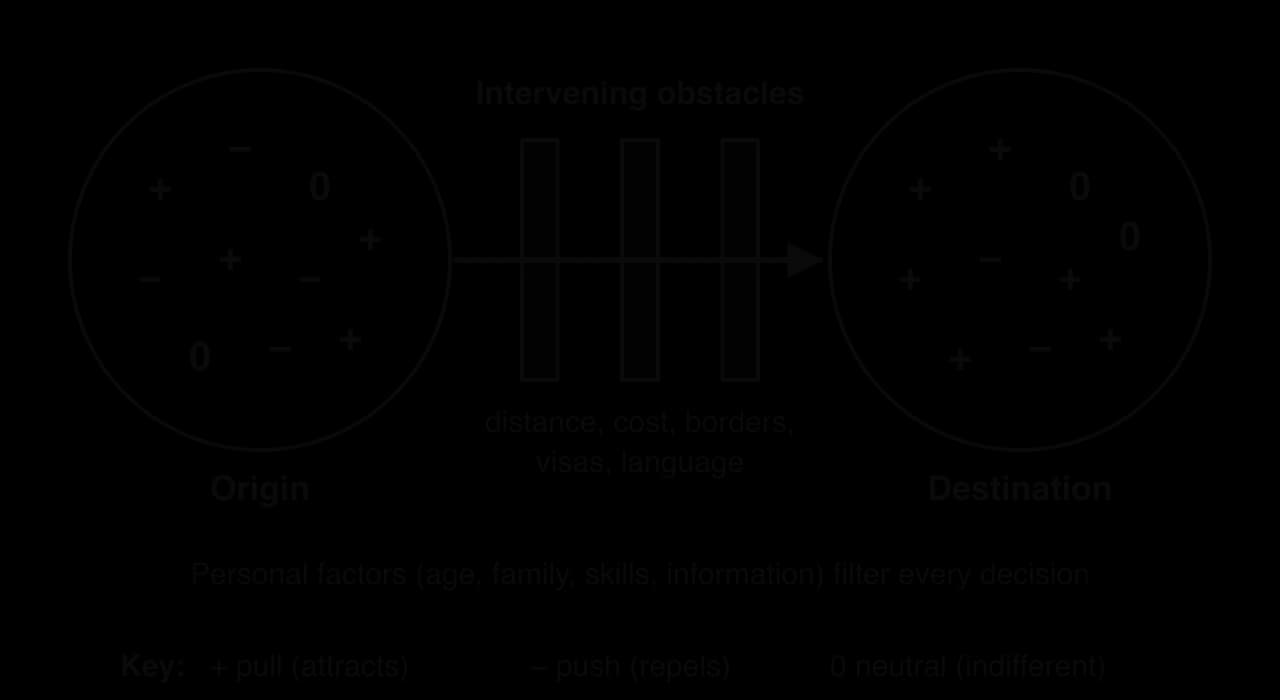
Strengths | Limitations |
|---|---|
Simple and applies to any scale, from a village–town move to international migration | Assumes migrants make rational, informed choices; many act on rumour or family pressure |
Recognises that the same place is seen differently by different people (personal factors) | Does not explain forced migration, where there is little choice |
Includes the origin as well as the destination | Says nothing about the effects of migration on either place |
In high-income countries most people are already urban, so other flows matter more. In the United States, people have moved for decades from the industrial north-east and Midwest to the Sun Belt states of the south and west, such as Texas and Florida, for jobs, lower living costs and the climate. Retirees and commuters also move from cities to small towns and the countryside, described as counter-urbanisation.
Governments can control internal migration. China’s household registration (hukou) system, introduced in its present form in 1958, registers every citizen in a place and as rural or urban. It tied housing, schooling and healthcare to a person’s registered home, so rural migrants could work in cities but not settle there with full rights, and many left their children in the village: in 2010 about 61 million children, 38% of all rural children, were living without one or both parents.
Reforms since 2014 have relaxed the system, and a 2024 plan called for removing settlement restrictions in cities of fewer than 3 million people, but the largest cities still restrict entry. The hukou shows the power of a state over where people live: it slowed the growth of China’s largest cities, but it also kept millions of workers in a second-class position.
Sources: Wikipedia, “Hukou”, citing China’s population censuses (2010) and State Council plans (2014, 2024), 2026.
Migration widens regional inequality when… | Migration reduces regional inequality when… |
|---|---|
the young and skilled leave, so the periphery’s workforce ages and its services close (brain drain from regions) | migrants send remittances home, which pay for housing, schooling and small businesses |
investment and taxes follow migrants to the core (backwash) | rural labour shortages raise wages for those who stay |
the core’s growth attracts still more firms (cumulative causation) | returning migrants bring skills, savings and ideas |
Migration usually widens regional gaps at first and can narrow them later, but only if peripheral regions gain investment. In China, the coastal–interior gap widened in the 1990s and 2000s, then narrowed slightly as coastal wages rose and factories moved inland. For individual households, migration often reduces poverty even while regional gaps persist, so the effect of migration on inequality depends on the scale studied, the time span and government policy.
Urbanisation is the increase in the proportion of a country’s population that lives in urban areas. It differs from urban growth, an increase in the number of urban dwellers, which can happen without urbanisation if the rural population grows as fast.
Measuring urbanisation is not straightforward, because countries define “urban” differently. Using national definitions, the World Bank estimated that 57.6% of the world’s people were urban in 2024. The UN’s World Urbanization Prospects 2025 uses a single harmonised method, the Degree of Urbanisation, which separates cities, towns and rural areas by population size and density. On that basis, 45% of the world’s 8.2 billion people lived in cities in 2025, against 20% of 2.5 billion in 1950, and many more lived in towns.
A megacity is an urban area with 10 million or more inhabitants. The UN counts urban agglomerations: continuous built-up areas that often cross city boundaries. In 1975 there were 8 megacities; by 2025 there were 33, of which 19 were in Asia, and the UN projects 37 by 2050, with Addis Ababa, Dar es Salaam, Hajipur in India and Kuala Lumpur expected to pass 10 million.
Rank (2025) | Urban agglomeration | Country (income group) | Population (millions) |
|---|---|---|---|
1 | Jakarta | Indonesia (upper-middle) | 41.9 |
2 | Dhaka | Bangladesh (lower-middle) | 36.6 |
3 | Tokyo | Japan (high) | 33.4 |
4 | Delhi | India (lower-middle) | 30.2 |
5 | Shanghai | China (upper-middle) | 29.6 |
6 | Guangzhou | China (upper-middle) | 27.6 |
7 | Cairo | Egypt (lower-middle) | 25.6 |
8 | Metro Manila | Philippines (upper-middle) | 24.7 |
9 | Kolkata | India (lower-middle) | 22.6 |
10 | Seoul | South Korea (high) | 22.5 |
Sources: UN DESA, World Urbanization Prospects 2025: Summary of Results (18 November 2025), city figures via Wikipedia, “Megacity”, 2026; income groups from the World Bank, July 2026.
The table shows a major shift. In the 1970s the largest cities were in high-income countries, such as Tokyo and New York. By 2025 eight of the ten largest were in middle-income countries, Tokyo had fallen to third, and the fastest growth was in South Asia and sub-Saharan Africa, in cities such as Dhaka, Lagos and Kinshasa.
Megacities grow through two processes: rural–urban migration and natural increase, the excess of births over deaths in the city. Natural increase is often the larger source, because migrants are mostly young adults who have children after they arrive, and urban death rates are usually low. A third, smaller source is the reclassification of villages swallowed by the spreading city.
In many countries one city is far larger than any other and dominates the country’s economy, politics and culture. This is a primate city. Bangkok, Lima, Dhaka and Ulaanbaatar are examples: in 2024 Ulaanbaatar held about 68% of Mongolia’s urban population. Primacy is often a legacy of colonial rule, when one port became the centre of administration and trade. Primacy is measured by dividing the population of the largest city by that of the second: a ratio well above 2 indicates a primate city, whereas the rank-size rule predicts a second city half the size of the first.
Indonesia, an upper-middle-income country of more than 17,000 islands, shows an uneven distribution shaped both by physical geography and by policy. Java holds about 56% of Indonesia’s people on only about 7% of its land: 158 million people in mid-2025, at an average density of 1,192 per km². Volcanic soils and its history as the centre of kingdoms and of Dutch rule made it the core, and Jakarta, the world’s largest urban agglomeration, concentrates government, finance and industry. Outer islands such as Kalimantan and Papua form a thinly populated resource periphery of forests, plantations and mines.
From the colonial period onwards, governments tried to redistribute people through the transmigration programme, which resettled families from Java, Bali, Lombok and Madura on the outer islands. At its peak, in 1979–1984, about 535,000 families (almost 2.5 million people) moved; by 1981 about 60% of the 3 million people of Lampung province in Sumatra were transmigrants. The programme was sharply cut in 2000 after the Asian financial crisis, and halted for Papua in 2015.
Transmigration reduced pressure on Java only slightly, and was criticised for clearing rainforest, ignoring the customary land rights of Indigenous peoples such as the Dayak, and contributing to conflicts such as the violence in Sampit, Kalimantan, in 2001. A new capital, Nusantara in East Kalimantan (approved in 2022), is the latest attempt to shift development away from Java.
Java | Indonesia as a whole | |
|---|---|---|
Share of population | about 56% | 100% |
Share of land area | about 7% | 100% |
Population density | 1,192 per km² (2025) | 148.6 per km² (2023) |
Main factors | Volcanic soils, rice farming, historic core, capital region | Mountains, rainforest, distance from Java on outer islands |
Sources: Statistics Indonesia (BPS) via Wikipedia, “Java”, 2025; Wikipedia, “Transmigration program”, 2026; World Bank WDI, 2023.
Australia, a high-income country of 27.6 million people (June 2025), has one of the most uneven population distributions in the world. On an area of 7.7 million km², its average density is only 3.6 people per km². Yet most Australians live not in the open landscapes of the “outback” but in a handful of large coastal cities: in June 2025, 67.9% of the population lived in the eight state and territory capitals, and 40.1% in just two of them, Sydney (5.64 million) and Melbourne (5.44 million).
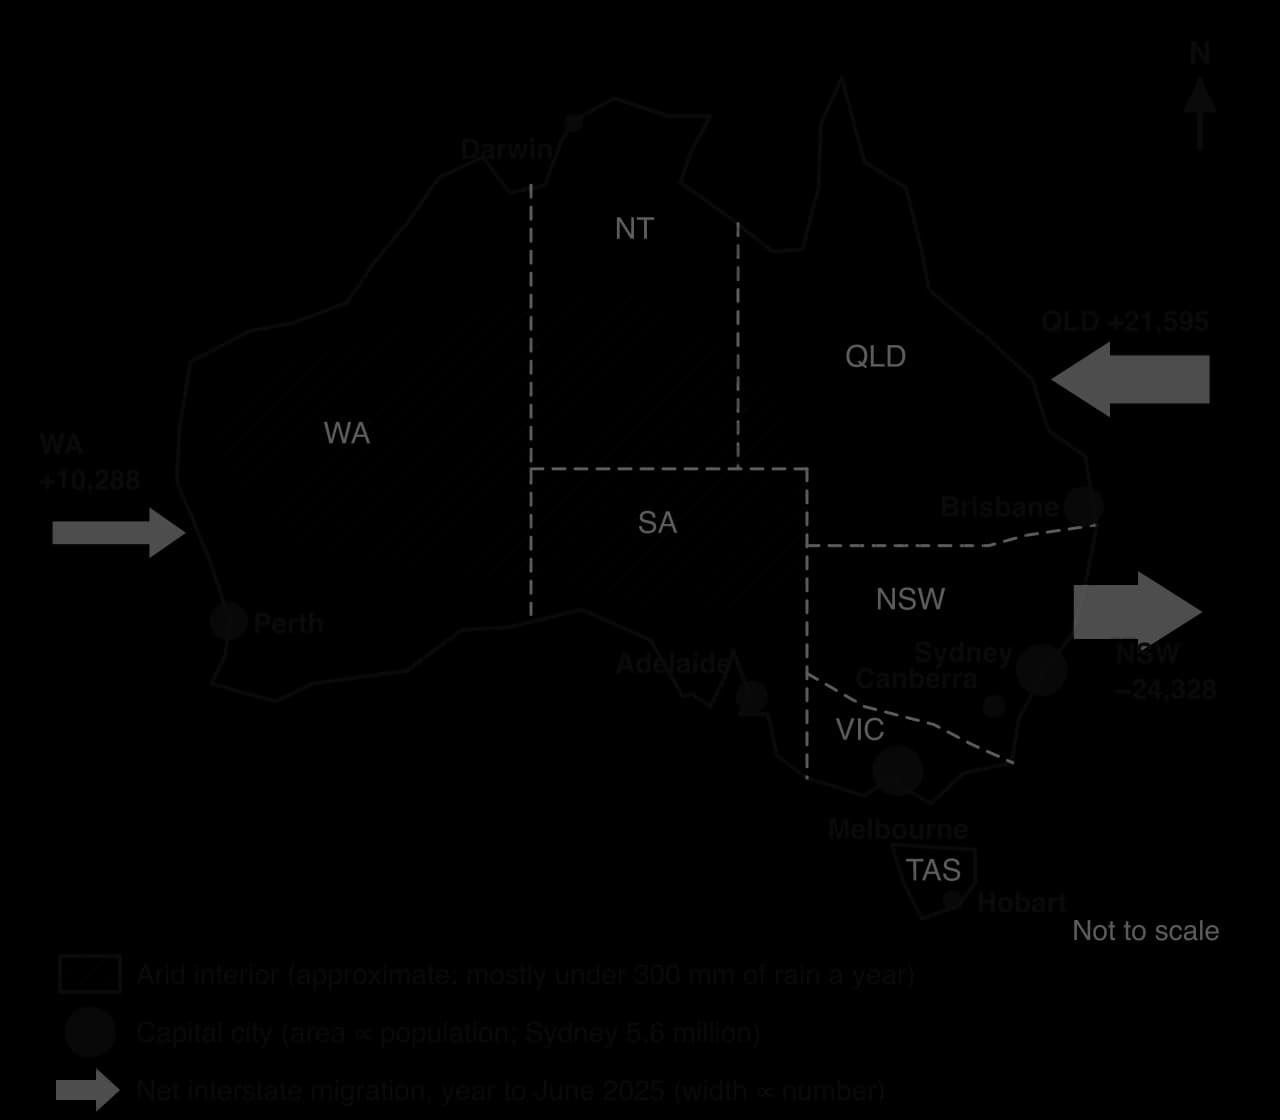
Australia is the driest inhabited continent. Its mean annual rainfall is only about 419 mm; 80% of the land receives less than 600 mm a year and half receives less than 300 mm. The interior lies under the subtropical high-pressure belt, where sinking air suppresses rainfall, and much of it is desert or semi-arid grassland with old, infertile soils.
The wetter and cooler margins are the exception. The south-east, between the Great Dividing Range and the sea, receives reliable rain from onshore winds, and the south-west around Perth has a Mediterranean climate of wet winters and dry summers. Farming and cities developed there. Almost 80% of Australians live within 25 km of the coast. The physical pattern therefore explains the broad division between a nearly empty interior and a settled rim.
Physical factors do not explain why the population is concentrated in a few very large cities rather than spread along the whole wetter coast. That pattern is mainly historical and economic. Aboriginal and Torres Strait Islander peoples have lived across the whole continent, including its deserts, for at least 50,000 years. British colonisation from 1788 created six separate colonies, each governed from a port capital (Sydney, Hobart, Perth, Melbourne, Adelaide and Brisbane) through which wool, wheat and gold were exported and immigrants arrived. Railways radiated inland from each port, so each capital became the core of its own colony.
After federation in 1901, the capitals kept their advantages through cumulative causation: state governments, universities, ports, head offices and most jobs. Canberra was built as a planned national capital from 1913.
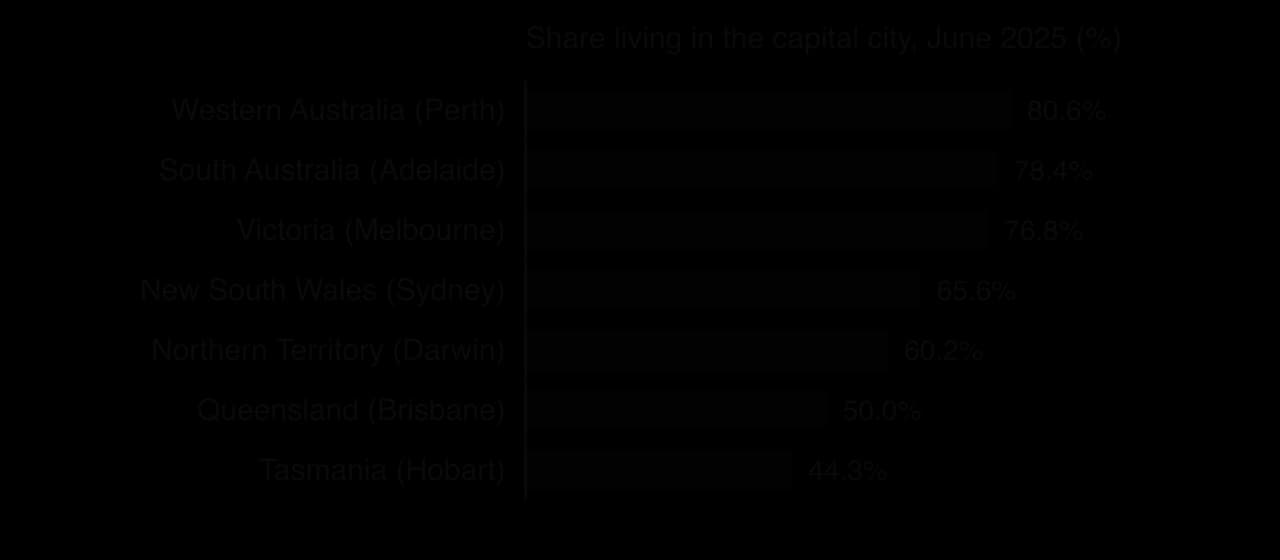
Australia’s population grew by 420,100 (1.5%) in the year to June 2025. Net overseas migration added 305,600 and natural increase 114,600. Immigrants settle mainly in the capitals, which gained 258,100 from overseas migration but lost 29,800 through internal migration, so immigration reinforces the concentration in the largest cities.
Internal migration redistributes people between states. In the year to June 2025 Queensland gained 21,595 people through net interstate migration and Western Australia 10,288, while New South Wales lost 24,328. People leave Sydney mainly because of its housing costs, for cheaper homes and a warm climate in south-east Queensland, or for jobs linked to iron ore and gas in Western Australia’s Pilbara. Many Pilbara mining jobs are filled by “fly-in fly-out” workers who live in Perth, so the resource boom has strengthened the capital rather than inland towns.
Component of change, year to 30 June 2025 | New South Wales | Queensland | Western Australia |
|---|---|---|---|
Natural increase | +34,576 | +20,606 | +14,890 |
Net overseas migration | +91,573 | +55,743 | +40,406 |
Net interstate migration | −24,328 | +21,595 | +10,288 |
Population, 30 June 2025 | 8.59 million | 5.67 million | 3.04 million |
The concentration gives Australians access to high-paid service jobs, universities and specialist hospitals, and the agglomeration of firms makes Sydney and Melbourne competitive, but they face high housing costs and long commutes. Rural and remote towns, meanwhile, find it hard to keep young adults, doctors and teachers.
The pattern also has an equity dimension. At the 2021 census, 983,700 Aboriginal and Torres Strait Islander people made up 3.8% of Australia’s population. They are more widely distributed than other Australians: 15.4% lived in remote or very remote areas, and they formed 30.8% of the population of the Northern Territory. Services in remote communities, from healthcare to schooling and internet access, are much harder to provide, which contributes to gaps in health and education between Indigenous and non-Indigenous Australians.
Governments have tried to influence the distribution: some skilled visas require migrants to live in regional areas for several years, and states offer incentives for doctors and teachers to work in the country. These measures have had limited effect: the jobs, services and migrant networks that attract people remain in the capitals, and the fastest-growing regional cities, such as the Gold Coast and Geelong, sit close to the largest ones.
Key concept | How the Australian case shows it |
|---|---|
Place | An arid interior and a well-watered south-east give a sharp contrast between empty and crowded land |
Process | Immigration and interstate migration concentrate growth in the capitals and Queensland |
Power | Colonial governments chose the port capitals; visa rules and state planning now shape where people settle |
Possibility | Whether regional cities can relieve Sydney and Melbourne depends on housing, transport and jobs policy |
Sources: Australian Bureau of Statistics, Regional population 2024–25 (released 31 March 2026), National, state and territory population, June 2025, and Estimates of Aboriginal and Torres Strait Islander Australians, June 2021; Wikipedia, “Geography of Australia”, 2026.
Analysis questions
Examine the relative importance of physical and human factors in explaining why so many Australians live in the eight capital cities.
To what extent is internal migration in Australia reducing the dominance of the largest cities?
Compare the distribution of Australia’s population with Indonesia’s, and suggest why policy has done little to change either pattern.
Unit 1 appears in Paper 2 as a Section A structured question on a stimulus ([2], [2+2], [2+2]), possibly in the Section B infographic, and in Section C essays that reward synthesis across the core.
The table shows income and human development for six countries (World Bank, 2024; UNDP, 2023).
Country | GNI per capita, Atlas (US$, 2024) | Life expectancy (years, 2024) | HDI (2023) |
|---|---|---|---|
Niger | 670 | 61.4 | 0.419 |
Bangladesh | 2,820 | 74.9 | 0.685 |
Sri Lanka | 3,870 | 77.7 | 0.776 |
Equatorial Guinea | 6,050 | 63.9 | 0.674 |
China | 13,660 | 78.0 | 0.797 |
Norway | 100,030 | 83.2 | 0.970 |
Part (b) asks for suggestions: the reasons need not appear in the table, but they must fit the countries named.
Part (c) moves away from the stimulus to knowledge of the wider unit.
The infographic, “The world’s megacities”, shows: a timeline of the number of urban agglomerations with 10 million or more people (8 in 1975, 33 in 2025, 37 projected for 2050); a map of the 33 megacities of 2025, 19 of them in Asia; a bar chart of the ten largest (Jakarta 41.9 million, Dhaka 36.6, Tokyo 33.4, Delhi 30.2, Shanghai 29.6, Guangzhou 27.6, Cairo 25.6, Metro Manila 24.7, Kolkata 22.6, Seoul 22.5); and a note that small and medium cities are growing faster than megacities, especially in Africa and Asia.
Sources: Infographic data from UN DESA, World Urbanization Prospects 2025.
Part (b) needs a point linked to the infographic and one development.
Part (c) carries most of the marks and needs evidence on both sides, followed by a judgment.
Distribution is the pattern of where people live; density is people per km². About 59% of the 8.2 billion people of 2025 lived in Asia.
Physical factors explain the main global clusters and empty areas; human factors (jobs, ports, capitals, history, policy, technology) increasingly explain national and local patterns.
Development is multidimensional; GDP measures production within borders, GNI residents’ income, and PPP adjusts for living costs.
The World Bank classifies economies by GNI per capita (Atlas method): low income (US$1,175 or less), lower-middle, upper-middle and high income (over US$14,375), thresholds as published in July 2026.
The HDI combines life expectancy, schooling and GNI per capita (PPP); countries such as Sri Lanka and Cuba rank higher for HDI than for income, while Qatar and Equatorial Guinea rank lower.
Core regions attract migrants and investment through cumulative causation (backwash); spread effects can later reduce the gap, often only with government policy.
Voluntary internal migration, mainly rural–urban in LICs and MICs, responds to push and pull factors and intervening obstacles (Lee’s model).
Megacities (10 million or more) rose from 8 in 1975 to 33 in 2025, mostly in Asia, growing through rural–urban migration and natural increase.
Australia (coastal capitals, arid interior) and Indonesia (Java’s core) show how physical and human factors combine to produce uneven distributions.
I can distinguish population distribution from population density and determine density in people per km².
I can describe the global pattern of population, naming the four main clusters and the main sparse areas.
I can explain at least five physical and four human factors, each with a mechanism and a located example.
I can evaluate the relative importance of physical and human factors at different scales and over time.
I can classify countries using the World Bank income thresholds and describe the global pattern of income groups.
I can use the HDI and a scatter graph of income and life expectancy to identify and explain anomalies.
I can explain core–periphery patterns, rural–urban migration, Lee’s model and megacity growth, and evaluate the effect of migration on inequality.
I can use Australia and Indonesia as two contrasting examples of uneven population distribution.
Problems with population data: varying definitions of the city (city proper, urban agglomeration, metropolitan area) and uncertain counts in informal settlements make population rankings inconsistent (eg UN estimates that changed which city is ranked largest).
Specialized functions can place small cities high in a functional hierarchy (eg university towns, pilgrimage centres, high-technology clusters).
Good answers may be well structured (AO4) and may additionally offer a critical evaluation (AO3) which recognizes that population size is a reasonable indicator at the lower end of the hierarchy (village, town, city) but becomes less reliable at the top, where economic and political power, global connectivity and functions matter more (power, scale). Another approach might be to distinguish between a national hierarchy, where population and administrative status dominate, and a global hierarchy of world cities. Some responses may question whether there is a single hierarchy at all (perspectives).
For 5–6 marks, expect some weakly-evidenced outlining of the urban hierarchy and of the role of population size.
For 7–8 marks, expect a structured account which includes:
either well-evidenced explanation of population size and at least one other indicator, using named cities
or a discursive conclusion (or ongoing evaluation) grounded in geographical concepts and/or perspectives, such as how the usefulness of population size varies with scale.
For 9–10 marks, expect both of these traits.
Marks | Level descriptor |
|---|---|
0 | The response does not reach a standard described by the descriptors below. |
1–2 | Too brief, lists unconnected information, not focused on the question and lacks structure. Knowledge is very general, with large gaps or errors; examples or case studies are missing or only listed. No analysis; terminology is missing or used incorrectly. |
3–4 | Too general, lacks detail, not focused on the question and largely unstructured. Outlines examples, statistics and facts, both relevant and irrelevant, with links to the question only listed. Basic terminology is used, with errors or inconsistently. No critical evaluation of evidence; any conclusion is irrelevant. |
5–6 | Partially addresses the question, with a narrow argument, an unsubstantiated conclusion and limited evaluation. Describes relevant supporting evidence (examples, case studies) and outlines links to the question. The argument repeats one point or covers only part of the question. Other perspectives, or strengths and weaknesses of evidence, are listed. |
7–8 | Addresses the whole question; the analysis is evaluated and the conclusion is relevant but lacks balance. Relevant evidence is described correctly and covers all the main points. The argument is clear but one-sided or unbalanced. Complex terminology is used correctly but not consistently. Other perspectives, or strengths and weaknesses of evidence, are described. |
9–10 | In-depth and specific to the question (topic and command term). Correct, relevant examples, statistics and detail are integrated and their link to the question explained. The argument is balanced, explaining complexity, exceptions and comparisons. Evaluation of evidence and perspectives is well developed, and the conclusion is balanced and aligned with the evidence. Logically structured and easy to follow. |
Examine the relative importance of natural increase and rural–urban migration in the growth of cities in industrializing countries.
10 marks
Examine why rural–urban migration continues in industrializing countries despite the difficult living conditions many migrants face in cities.
10 marks