Interpret urban growth projections to 2050 and evaluate resilient, eco- and smart city strategies, using Copenhagen, Tokyo, Masdar City, Vauban and Songdo.
Each is in the Geography glossary, with every other term in the subject.
A sudden, sharp event that threatens a city, such as a flood, earthquake, heatwave, terrorist attack, cyber attack or disease outbreak.
A residential area designed so that most households do not own or need a car, with streets reserved for walking, cycling and access, and any parking placed at the edge.
A slow-moving, long-term pressure that weakens a city over time, such as poverty, inequality, ageing infrastructure, water scarcity or sea-level rise.
An urban metabolism in which outputs such as waste, wastewater and heat are reused or recycled as inputs, so the city uses fewer resources and produces less waste.
An urban form with relatively high residential density and mixed land uses, which reduces travel distances and the amount of land built on.
The systems and assets, such as energy, water, transport, telecommunications and health services, that are essential to a city’s functioning and whose loss would cause severe disruption.
A system that supplies heat to many buildings from a central source, such as waste heat, biomass or a heat pump, through a network of insulated pipes.
The delivery of public services and information through digital channels, such as online applications, digital identity and electronic voting.
Describe the regional and continental patterns of urban growth projected to 2050, using the UN’s World Urbanization Prospects.
Explain projected trends in rural–urban migration and in the size and age structure of urban populations, and examine why projections are uncertain.
Explain what makes a city resilient, distinguishing acute shocks from chronic stresses.
Evaluate strategies to manage escalating climatic risks to cities, using Copenhagen and Tokyo as contrasting examples.
Evaluate strategies to manage geopolitical risks to cities, including terrorism, conflict and cyber attacks.
Explain the urban ecological footprint and the difference between linear and circular urban metabolism.
Compare and contrast purpose-built and retrofitted eco-cities, using Masdar City and Vauban in Freiburg.
Evaluate the use of smart technology to run city services, in purpose-built settlements and in older cities.
By 2050 about two-thirds of the world’s people are projected to live in urban areas, and most of the extra urban residents will be in Asia and Africa. Those cities will face rising climatic risks, new security threats and the need to use far fewer resources per person than cities do today. Planning for that future is the subject of sustainable urban management.
The topic is driven by possibility: projections give a range of futures, and different city designs (resilient, eco- and smart cities) offer different ways of reaching a sustainable one. It also links to power, because who designs, pays for and benefits from a resilient or smart city decides whether its gains are shared, and to sustainability
75 exam-style questions on this subtopic, written in the style of the IB papers. The first has its markscheme open. Counted on
Examine the extent to which vertical farming can make food production more sustainable in the future.
10 marks
Marks should be allocated according to the markbands.
Vertical farming grows crops in stacked layers, usually indoors in controlled environments, using hydroponic or aeroponic systems and LED lighting. It is often located in or near cities. Sustainability may be considered environmentally (land, water, energy, chemicals, food miles), economically (costs, viability, jobs) and socially (food security, access, diets). The question asks how far it can contribute in the future, so evaluation of its potential and its limits is expected.
Possible applied themes (AO2) demonstrating knowledge and understanding (AO1):
Land efficiency: stacked layers give very high yields per square metre, so food can be grown in cities where land is scarce, reducing pressure to clear new farmland.
Water and chemicals: recirculating hydroponic systems use a small fraction of the water of field farming (often quoted at around 90–95% less), and the closed environment means few or no pesticides.
Reliability: year-round production unaffected by drought, floods or seasons, which supports stability of supply as the climate changes.
Shorter supply chains: production close to consumers reduces transport and food losses; Singapore, which imports over 90% of its food, supports vertical farms such as Sky Greens as part of its “30 by 30” goal for local production.
Energy is the main drawback: artificial lighting and climate control need large amounts of electricity, so the carbon footprint depends on the energy source.
Limited crop range: viable mainly for leafy greens, herbs and some fruit such as strawberries, not for staple cereals that provide most of the world’s calories.
Economic viability: high capital and running costs have caused well-known failures, eg AeroFarms filed for bankruptcy protection in 2023 and Bowery closed in 2024.
With a free account, Augment remembers where you stopped and what you have practiced.
A city or urban district planned or redeveloped to minimise its ecological footprint, through renewable energy, efficient buildings, low-car transport, recycling, green space and compact, mixed-use development.
A city or regional plan to reduce deaths and illness in heatwaves, combining early warnings, public information, cooling centres, protection of vulnerable groups and long-term cooling measures.
Physical measures such as bollards, barriers, planters and street furniture placed to stop vehicles being driven into crowds or buildings.
The use of sensors, communications and data to manage traffic and public transport in real time, for example through adaptive signals, live passenger information and road pricing.
A medium-sized city, usually of about 50,000 to 1 million people, that links rural regions with larger cities and holds a large and growing share of the world’s urban population.
A network of physical objects, such as sensors, meters, vehicles and appliances, connected to the internet so that they can collect and exchange data without human input.
An urban metabolism in which resources flow into the city, are used once and leave as waste and pollution, with little reuse or recycling.
Development that combines housing, shops, offices, services and leisure in the same area or building, so that people can meet daily needs within a short distance.
A town or city planned and built from the beginning on an undeveloped site, with its layout, infrastructure and technology designed in advance.
The inclusion of spare or duplicate capacity in a system, such as back-up power or alternative routes, so that it keeps functioning if one part fails.
A global network of cities, successor to the Rockefeller Foundation’s 100 Resilient Cities programme (2013–2019), that shares methods for planning urban resilience to shocks and stresses.
Adding new technology, materials or design features to existing buildings, infrastructure or urban areas to improve their performance, such as smart sensors, insulation or flood protection.
A city that uses digital technology, sensors and data analysis to manage its infrastructure and services, such as transport, energy, water and waste, more efficiently and improve residents’ quality of life.
An electricity network that uses digital communication, smart meters and automated control to balance supply and demand, integrate renewable sources and respond to faults.
A city designed, as in China’s national programme from 2015, to absorb, store, clean and reuse rainwater through green spaces, wetlands, permeable surfaces and green roofs instead of draining it rapidly away.
An estimate of the future size of an urban population, calculated from present data and assumptions about natural increase, migration and the reclassification of settlements as urban.
A model of the city as a system of flows, in which resources such as energy, water, food and materials enter, are used and transformed, and leave as products, wastes and emissions.
The capacity of a city’s people, communities, institutions, businesses and systems to survive, adapt and keep developing despite the chronic stresses and acute shocks they experience.
A public square built below the level of surrounding streets that is used for recreation in dry weather and temporarily stores stormwater during heavy rain, releasing it slowly.
The UN Population Division’s regular estimates and projections of urban and rural populations and city sizes for every country, the main source of global urbanisation data.
An urban growth projection estimates how many people will live in urban areas in the future, based on current populations and assumptions about fertility, mortality, migration and the reclassification of rural areas as urban. The main global source is the World Urbanization Prospects (WUP), published by the Population Division of the UN Department of Economic and Social Affairs (UN DESA) every few years.
The 2018 revision of WUP projected that the share of the world’s population living in urban areas would rise from 55% in 2018 to 68% by 2050, adding about 2.5 billion urban residents, almost 90% of them in Asia and Africa, and that India, China and Nigeria together would account for over a third of that growth. These are the figures most often quoted.
The 2025 revision, published in November 2025, did two things. It updated the projections using each country’s own definition of "urban", which gives a world urban share of 57.8% in 2025 and 67.3% in 2050. It also introduced a single international method, the Degree of Urbanisation, which classifies every settlement as a city, a town or a rural area by population size and density. By that method only 45% of the world’s 8.2 billion people lived in cities in 2025, up from 20% of 2.5 billion in 1950, and many more lived in towns.
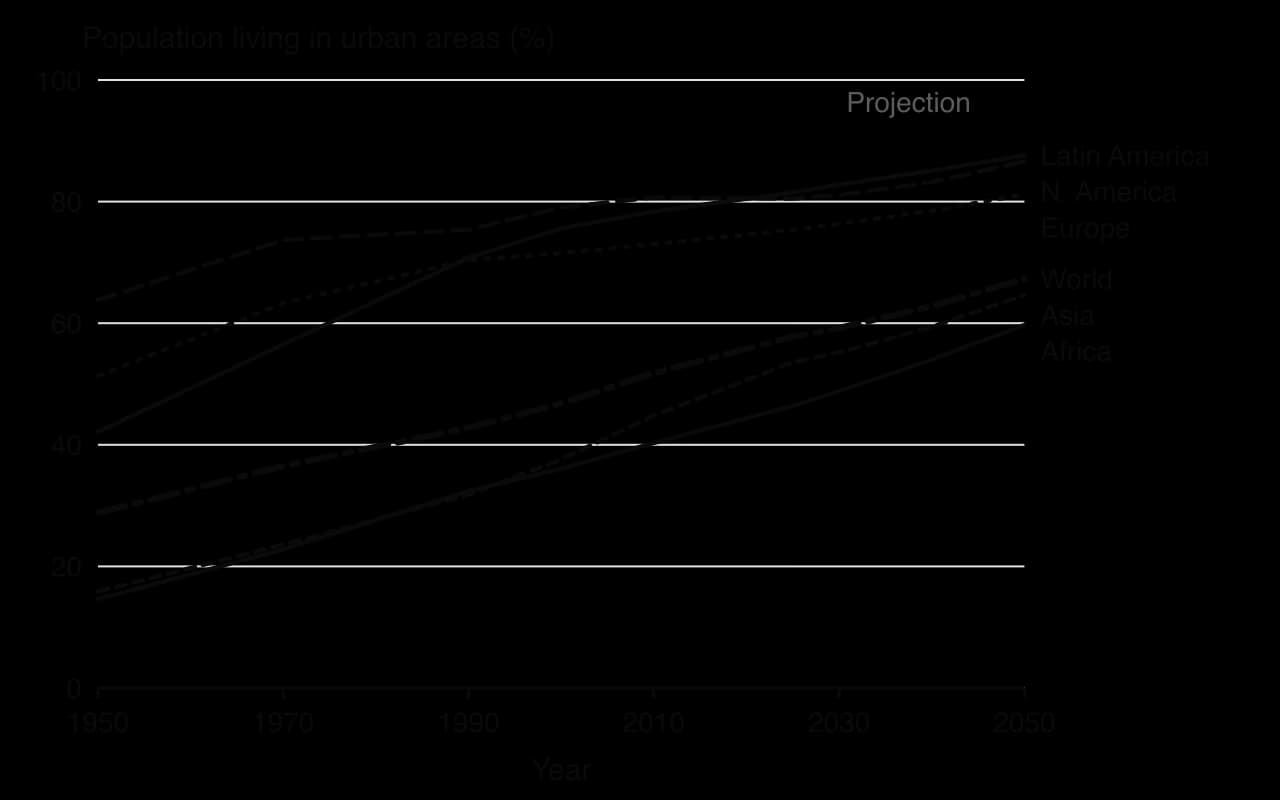
The graph shows two groups of regions. Latin America and the Caribbean (81.5% urban in 2025), Northern America (80.5%) and Europe (75.4%) urbanised mainly in the 20th century and are projected to reach about 81–88% by 2050, so their urban share changes little. Asia (53.6%) and Africa (46.4%) are urbanising rapidly from a lower base, and Africa’s share is projected to rise by about 13 percentage points to 59.7% by 2050.
Shares hide the size of the change. Because Asia and Africa have the largest and fastest-growing populations, they account for almost all the projected increase in urban population.
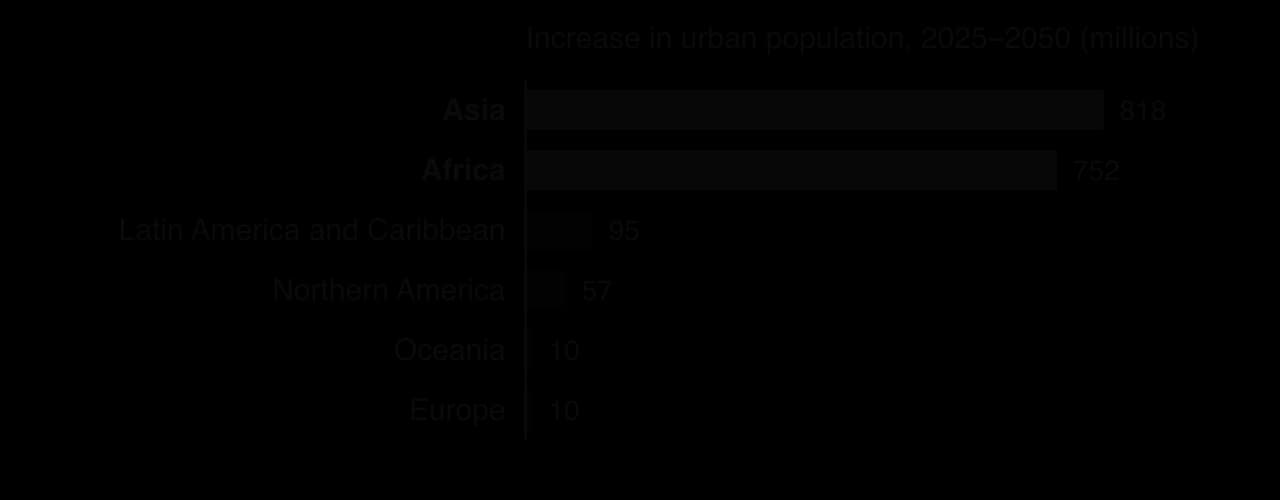
At the national scale, three countries dominate. India’s urban population is projected to grow by about 201 million between 2025 and 2050, China’s by about 191 million and Nigeria’s by about 148 million, almost doubling from 151 million to 299 million. Together they account for about 31% of world urban growth. Pakistan (74 million) and the Democratic Republic of the Congo (66 million) follow. Among large cities, the fastest growth is projected for sub-Saharan Africa, in cities such as Lagos, Kinshasa, Dar es Salaam and Luanda.
Rural–urban migration will continue to feed city growth, but its importance varies by region. In China, the largest internal migration in history has slowed since the 2010s as the rural population has aged and shrunk; in 2050 China’s rural population is projected to be only about 130 million, against 477 million in 2025. In most African cities, natural increase now adds more people than migration, because urban populations are young and fertility is still above replacement level. Sub-Saharan Africa is the only region where the rural population is still growing.
New drivers are emerging. Environmental change, including drought, floods, sea-level rise and river erosion, is pushing people from rural areas into cities in countries such as Bangladesh, where many environmental migrants settle in informal areas of Dhaka. Conflict drives sudden migration into cities too, as it has into Kabul, Goma and Maiduguri. Most of these migrants move within their own country.
The number of megacities (urban areas of 10 million or more) rose from 8 in 1975 to 33 in 2025, 19 of them in Asia, and is projected to reach 37 by 2050, with Addis Ababa, Dar es Salaam, Hajipur in India and Kuala Lumpur projected to pass 10 million. Yet most urban residents do not live in megacities. Of the roughly 12,000 cities identified by the UN in 2025, 96% had fewer than 1 million inhabitants and 81% fewer than 250,000, and it is these small and intermediate cities that are growing fastest, especially in Africa and Asia.
At the same time some cities are shrinking even where national populations grow. Most shrinking cities have fewer than 250,000 people; more than a third are in China and 17% in India, and very large cities including Mexico City and Chengdu also lost population in the UN’s 2025 estimates. In Japan, where the national population is falling, the urban population is projected to drop from about 114 million in 2025 to 101 million in 2050.
Urban populations are changing in structure as well as size. Cities in sub-Saharan Africa are youthful: most residents are under 25, so the main needs are schools, housing and millions of new jobs each year. Cities in East Asia and Europe are ageing quickly, as low fertility and long life expectancy raise the share of people over 65. Tokyo and Seoul, for example, need step-free transport, care services and housing adapted for older residents living alone. Across most regions households are becoming smaller and the number of single-person households is rising, which increases the demand for homes faster than population alone would.
Trend to 2050 | Where it is strongest | Implications for cities |
|---|---|---|
Rapid urban growth | Sub-Saharan Africa, South Asia | Housing, water, sanitation and transport must expand faster than budgets allow; informal settlements grow |
Youthful urban populations | Lagos, Kinshasa, Dar es Salaam | Demand for schools and jobs; potential demographic dividend |
Ageing urban populations | Tokyo, Seoul, European cities | Health and care services, accessible transport, fewer workers |
Shrinking cities | Japan, eastern Europe, parts of China | Empty housing, falling tax base, infrastructure too large for the population |
Smaller households | Most regions | More homes needed per 1,000 people; more land or higher density |
Projections are only as reliable as their assumptions. Fertility may fall faster or slower than expected, migration responds to economic shocks, pandemics and conflict, and governments redraw city boundaries. Projections for 2050 are therefore more certain for regions with good census data and stable trends than for countries where the last reliable census is decades old: Nigeria has not held a full census since 2006. Changing the definition of "urban", as the 2025 revision of WUP shows, changes the numbers more than many real demographic trends do.
Sources: UN DESA, World Urbanization Prospects 2018 (key facts) and World Urbanization Prospects 2025: Summary of Results, via UN News (18 November 2025) and Our World in Data, accessed 2026.
Resilience is the capacity of people, places and systems to absorb, recover from and adapt to shocks and stresses. Applied to a whole city, urban resilience is the ability of its residents, communities, institutions, businesses and infrastructure to survive, adapt and keep developing whatever disturbances they experience. A resilient city still experiences hazards, but its essential services keep working when one strikes and it recovers quickly, often with improvements.
Resilience planners distinguish two kinds of pressure. An acute shock is a sudden, sharp event: a flood, heatwave, earthquake, terrorist attack, cyber attack or disease outbreak. A chronic stress is a slow, continuing pressure that weakens a city from day to day: poverty and inequality, ageing infrastructure, water scarcity, an inadequate public transport system or gradual sea-level rise. Stresses make shocks worse, because a city with poor housing and weak services suffers more when a flood arrives.
The two often combine. Cape Town’s near-failure of its water supply in 2018 was an acute crisis, but it grew out of chronic stresses: a fast-growing population dependent on rain-fed reservoirs.
The idea spread through the Resilient Cities Network. In December 2013 the Rockefeller Foundation launched 100 Resilient Cities, which funded a chief resilience officer in each of 100 member cities on six continents to write a city resilience strategy; after the programme ended in 2019 its members continued as the Resilient Cities Network.
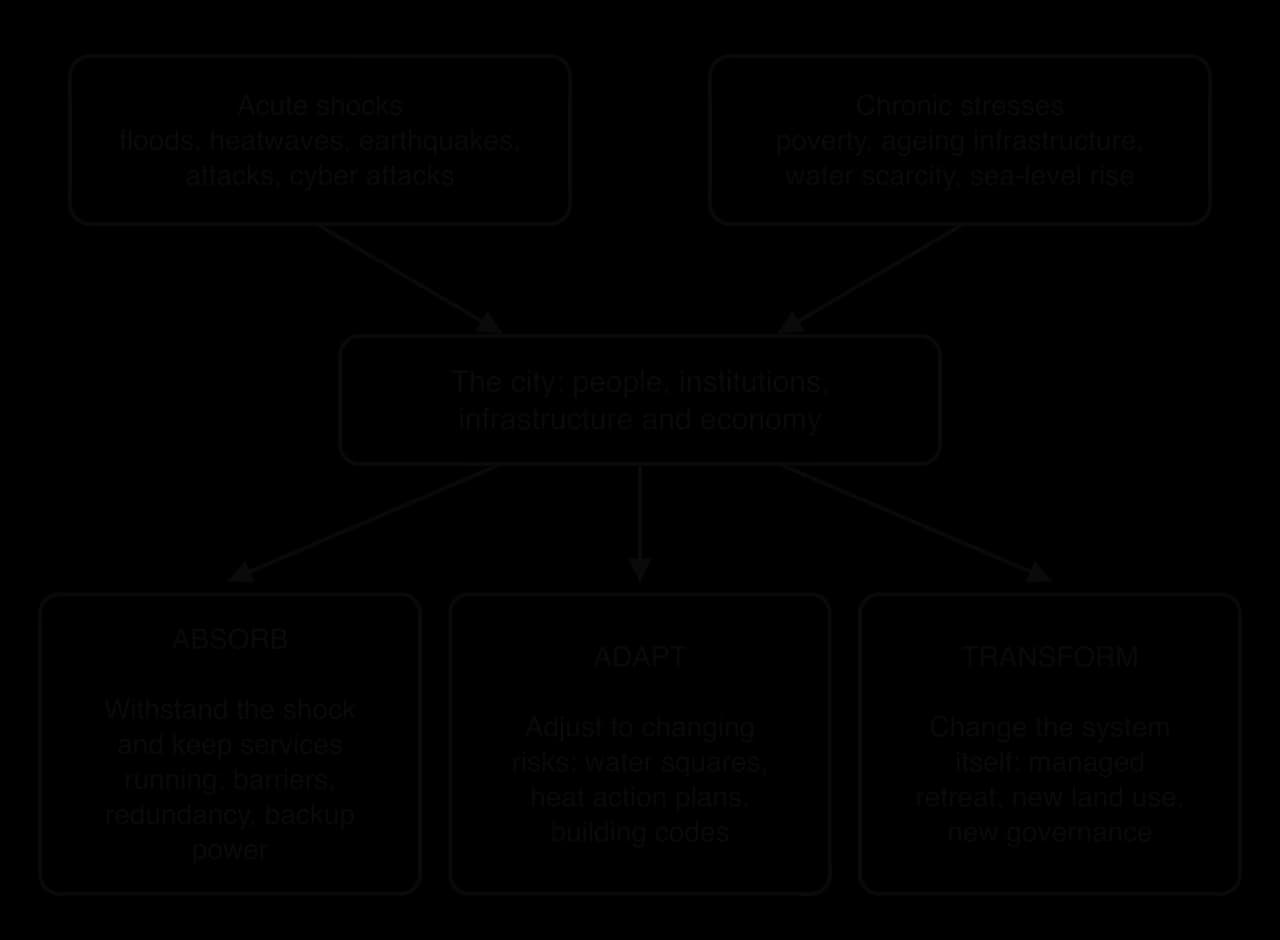
Resilience has three levels. A city absorbs a shock when its systems keep working, for example because it has back-up power or a flood barrier. It adapts when it changes how it works to cope with a changing risk, such as building squares that can store floodwater. It transforms when the risk is so great that the system itself must change: moving people away from the coast, changing land use or reorganising government. The most resilient cities combine all three.
Climatic risks to cities are escalating because global climate change makes heatwaves, extreme rainfall and coastal flooding more frequent and intense, while urban growth puts more people and assets in the way. Cities manage them by reducing exposure, reducing vulnerability and planning for recovery.
About one in ten people live in low-lying coastal zones, including many of the world’s largest cities: Jakarta, Shanghai, Dhaka, Lagos, Mumbai and New York.
Sea-level rise raises the base on which storm surges and high tides act. Engineered responses include sea walls and the storm surge barrier, a movable gate across an estuary that is closed when a surge is forecast; London’s Thames Barrier has protected the city since 1982 and Rotterdam’s Maeslantkering since 1997. In Lagos, the Eko Atlantic development is protected by a sea wall, but neighbouring coastal communities are not. Where defence becomes too costly, governments consider managed retreat; Indonesia’s decision to move its capital from sinking Jakarta to Nusantara on Borneo is the largest example.
Surface-water flooding happens when intense rain overwhelms drains, and it is becoming more frequent as rainfall extremes grow. The traditional response was to build larger sewers. Newer strategies "live with water", using public space to store and slow it on the surface:
A water square is a public square built below street level that is used for sport and recreation in dry weather and fills with rainwater during storms, releasing it slowly afterwards. Rotterdam’s Benthemplein, opened in 2013, has three basins that store rainwater from the surrounding streets and roofs.
China’s sponge city programme, national policy from 2014 with the first 16 pilot cities in 2015, aims for cities to absorb or reuse 70% of rainfall through wetlands, rain gardens, green roofs and permeable paving, on 80% of urban land by 2030.
Copenhagen’s Cloudburst Management Plan uses streets, parks and squares as channels and temporary lakes.
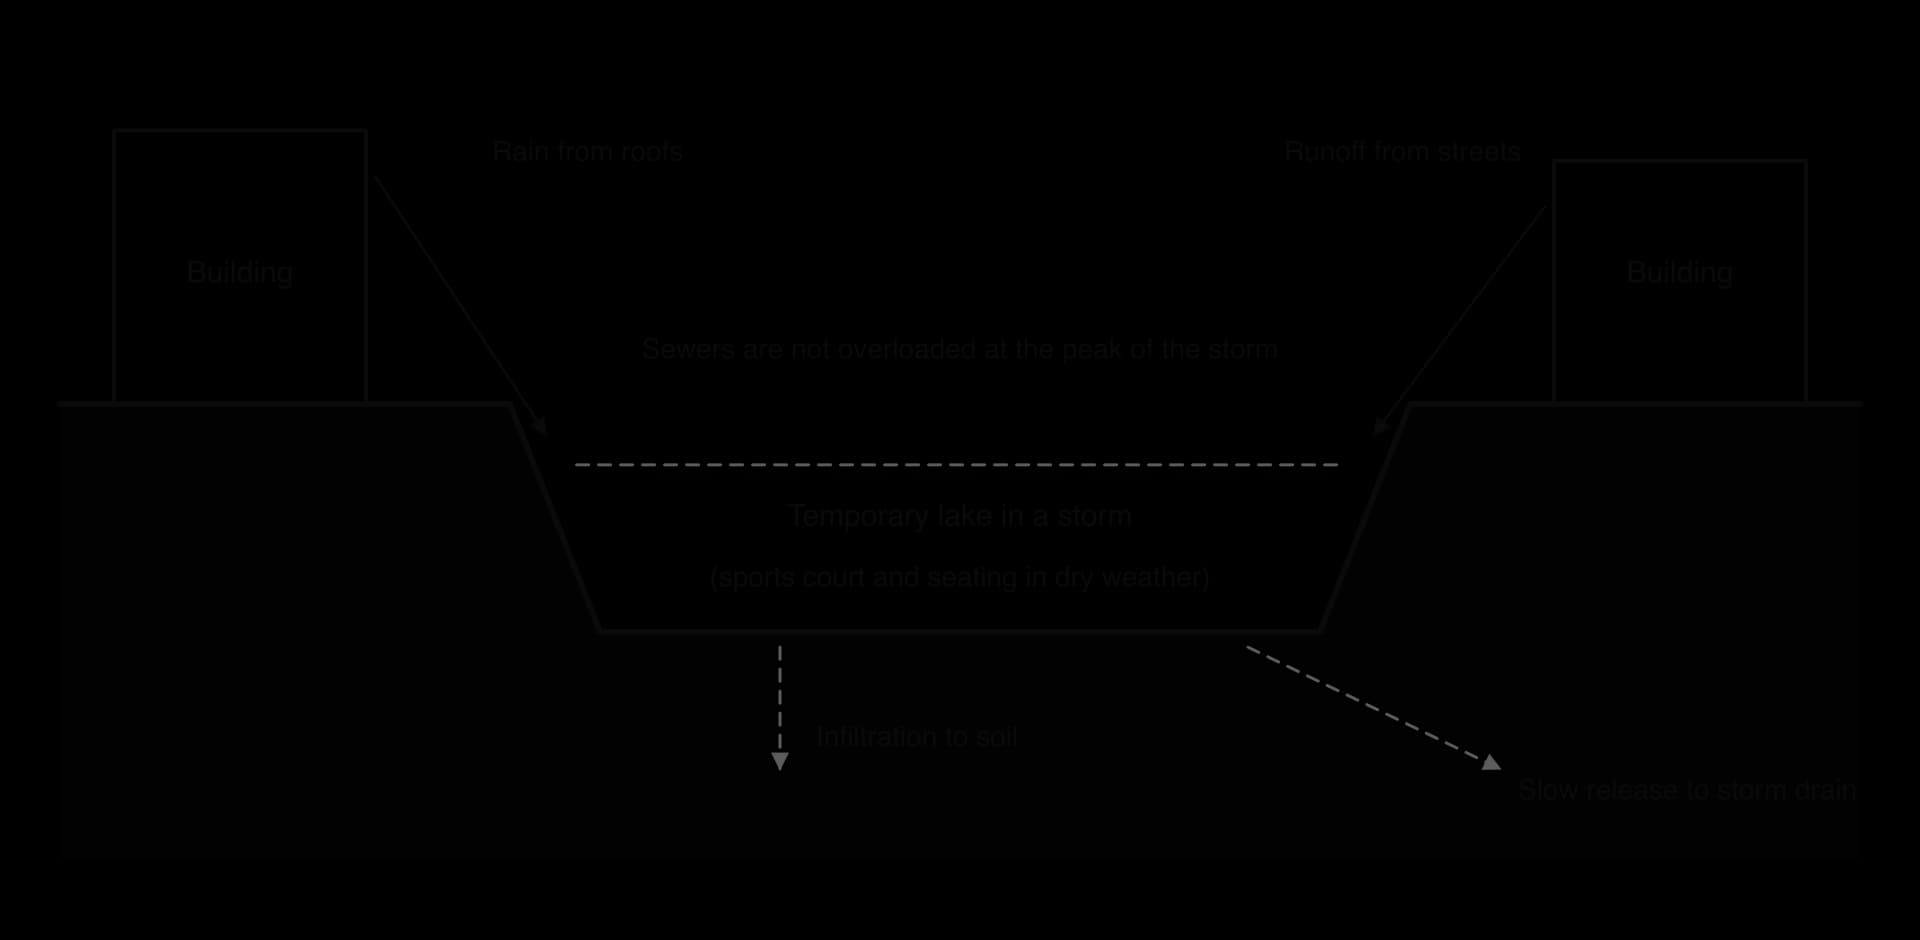
The sponge city programme shows the limits of these designs. Of 30 pilot cities, 19 have flooded since the work began, although retrofitted districts within them flooded less. The programme is expensive (estimated at US$230 billion by 2030, of which central government pays about one-fifth), and some local governments have used the label for ordinary projects. Blue-green designs reduce the frequent, moderate floods, but no sponge can absorb an extreme event such as the record rainfall of July 2021 in Zhengzhou, a city that had invested heavily in sponge-city projects.
Heat kills more people than any other weather hazard in many countries, and the urban heat island makes cities hotter still. A heat action plan prepares a city for heatwaves through forecasts and colour-coded warnings, public information, cooling centres, changes to working hours, training for health workers and long-term measures such as cool roofs. Ahmedabad in India launched South Asia’s first heat action plan in 2013 after a heatwave in May 2010, with temperatures of 46.8 °C, caused 1,344 more deaths than normal in that month.
A peer-reviewed study estimated that the plan avoided about 1,190 deaths a year in 2014–2015, though with wide uncertainty, and dozens of Indian cities and states have since adopted similar plans.
Wildfire is a growing risk where cities spread into dry, vegetated land, a zone called the wildland–urban interface. In January 2025 a series of fires in the Los Angeles area, led by the Palisades and Eaton fires, was driven by Santa Ana winds of up to about 160 km per hour after a dry winter. At least 31 people died, more than 200,000 were evacuated and more than 18,000 homes and other structures were destroyed or damaged. Shortfalls in the water supply also hampered firefighting in the Palisades.
Strategies include building codes that require fire-resistant roofs, vents and cladding, clearing vegetation around homes, limiting new building in the most exposed areas, and early warning and evacuation planning. The Los Angeles fires showed the limits of protection once homes have been built deep into fire-prone land: rebuilding in the same places restores the exposure, while planning restrictions are unpopular with landowners.
Cities that depend on a single source of water are vulnerable to drought. Cape Town came close to "Day Zero", the day municipal taps would be turned off, in 2018, after three dry years; it avoided it by cutting use to 50 litres per person a day and has since added groundwater, desalination and water reuse to its supply. Diversifying sources, cutting leaks and reusing wastewater are now part of most resilience strategies.
Across all climatic risks, two low-cost measures support the engineered ones. Building codes set minimum standards for new and refurbished buildings, such as raised floor levels, flood-resistant materials and shading, so that resilience grows as the city is rebuilt. Early warning systems, linked to emergency plans and to community groups that check on older or isolated neighbours, turn a forecast into action, which matters most for people with the fewest resources to protect themselves.
Cities also face risks created by people: terrorism, war, cyber attacks, sudden arrivals of refugees and disruption to the supply of food, energy and goods. They concentrate people, wealth, government and symbols, which makes them targets, and they depend on networks that can be cut.
After Irish republican bombs in the City of London in 1992 and 1993, the City created a security cordon known as the "ring of steel" in 1993: roads into the financial district were narrowed or closed, checkpoints set up and hundreds of CCTV cameras installed. After vehicle attacks on crowds in cities such as Nice in 2016 and London in 2017, many cities added hostile vehicle mitigation: bollards, planters, barriers and street furniture designed to stop vehicles reaching pedestrian areas.
Since late 2022, Russian missile and drone strikes on Ukraine’s power stations and grid have caused long blackouts in Kyiv in winter. The city responded with decentralised generators and batteries for hospitals, water pumps and heating plants, and with heated "Invincibility Points" in schools and public buildings that offer power, water, internet access and warmth during outages. The strategy rests on redundancy: having more than one way of providing each essential service, so that the loss of one does not stop it.
Power, water, sanitation, transport, telecommunications, health care and emergency services make up a city’s critical infrastructure, the systems whose failure would cause serious harm. Protecting it means mapping how each system depends on the others: water pumps need electricity, electricity control needs telecommunications, and hospitals need all three.
Smart city systems create a new kind of risk. In April 2007, during a dispute with Russia over the relocation of a Soviet war memorial in Tallinn, Estonia suffered weeks of cyber attacks on the websites of its parliament, ministries, banks and media. Estonia responded by building one of the most secure digital governments in the world, and NATO opened its cyber defence centre of excellence in Tallinn. Cybersecurity is now part of urban resilience planning, alongside plans for sudden refugee arrivals (Polish cities received hundreds of thousands of Ukrainians in 2022) and for disruption to food and fuel supplies.
Geopolitical strategies share a set of principles: protecting critical infrastructure, building redundancy into it, decentralising services so that no single site is a point of failure, and preparing people as well as systems. Emergency plans that are rehearsed, stocks of fuel, food and medicines, and community preparedness, such as volunteers trained in first aid and neighbourhood shelters, help a city keep functioning when national systems are disrupted.
Strategy | Strengths | Limitations |
|---|---|---|
Hard defences: sea walls, storm surge barriers, flood tunnels | High, reliable protection up to the design standard; protect dense, valuable areas | Very expensive; can fail catastrophically when exceeded; encourage building behind them; may move risk to unprotected neighbours |
Blue-green infrastructure: water squares, sponge cities, parks that flood | Multiple benefits (cooling, recreation, biodiversity); flexible; cheaper than pipes alone (Copenhagen) | Cannot cope with extreme events alone; needs land; long programmes; maintenance |
Heat action plans and early warning systems | Low cost; save lives quickly (Ahmedabad) | Depend on people being able to act on warnings; do not reduce heat itself |
Managed retreat and relocation | Removes people from risk permanently | Costly, slow and socially disruptive; the poor may be left behind (Jakarta and Nusantara) |
Security measures: barriers, CCTV, cordons | Deter and reduce attacks on high-value targets | Displace threats to unprotected places; raise concerns about surveillance and civil liberties |
Redundancy and decentralised systems | Keep services running in many kinds of shock (Kyiv) | Spare capacity is expensive and unused most of the time |
Two questions run through every evaluation. Who is protected? Defences and security measures usually protect the most valuable central districts, while informal settlements on floodplains or at the urban edge remain exposed. And is the strategy maladaptive? A measure that reduces risk now can raise it later, for example by encouraging development behind a barrier that will one day be overtopped, or by building air-conditioned cities that add to the emissions driving heat. Surveillance raises a further issue: cameras and data collected for security can also be used to monitor protest and private life.
Tokyo offers a contrasting strategy to Copenhagen’s surface approach: engineering on a vast scale underground. The low-lying basins of small rivers north of the city, in Saitama Prefecture, flooded repeatedly as farmland was urbanised in the late 20th century, and typhoon rains could raise the rivers within hours. The Metropolitan Area Outer Underground Discharge Channel, known in English as G-Cans, was built between 1992 and 2006 near Kasukabe to divert floodwater from these rivers into the much larger Edo River.
Component | Detail |
|---|---|
Intake silos | Five concrete shafts, each 65 m deep and 32 m in diameter, take water from the overflowing rivers |
Tunnel | 6.4 km long, 50 m below ground, linking the silos |
Pressure-control tank | 177 m long, 78 m wide and 25.4 m high, with 59 pillars, slows the water before it is pumped out |
Pumps | Discharge up to 200 tonnes of water a second into the Edo River |
The system shows the strengths and limits of grey infrastructure. It protects a large, densely built area without taking any land at the surface, and it can handle very large volumes when typhoons strike. But it is extremely expensive, it serves one function only, it depends on electricity for its pumps, and it does nothing to cool the city or create public space. The contrast with Copenhagen is one of approach rather than of success: Tokyo’s risk is typhoon-swollen rivers in a densely built plain with little open land, while Copenhagen’s is short cloudbursts in a city with streets and parks that can be redesigned.
Sources: Wikipedia, “100 Resilient Cities”, “Sponge city”, “Metropolitan Area Outer Underground Discharge Channel”, “January 2025 Southern California wildfires” and “2007 cyberattacks on Estonia”, accessed 2026; Hess et al., Journal of Environmental and Public Health, 2018 (Ahmedabad).
An ecological footprint is the area of biologically productive land and water needed to supply the resources a population uses and absorb its wastes, measured in global hectares (gha). A city’s footprint is far larger than the city itself, because its food, timber, water, energy and the capacity to absorb its carbon dioxide come from far beyond its boundary. Studies of London in the 1990s and 2000s estimated its footprint at well over 100 times the area of the city.
Urban metabolism describes the city as a system with inputs, throughputs and outputs, like a living organism. Food, water, energy, building materials and goods flow in; people use and transform them; waste, sewage, heat and emissions flow out. Herbert Girardet contrasted two kinds of urban metabolism in the 1990s.
A linear metabolism takes resources in and sends wastes out with little reuse, as most cities do today: fossil fuels are burnt, food is eaten and its waste landfilled, water is used once and discharged.
A circular metabolism reuses and recycles as many outputs as possible as inputs: organic waste becomes compost or biogas, wastewater is treated and reused, heat from industry warms homes, and energy comes from renewable sources. It applies the idea of the circular economy to a whole city.
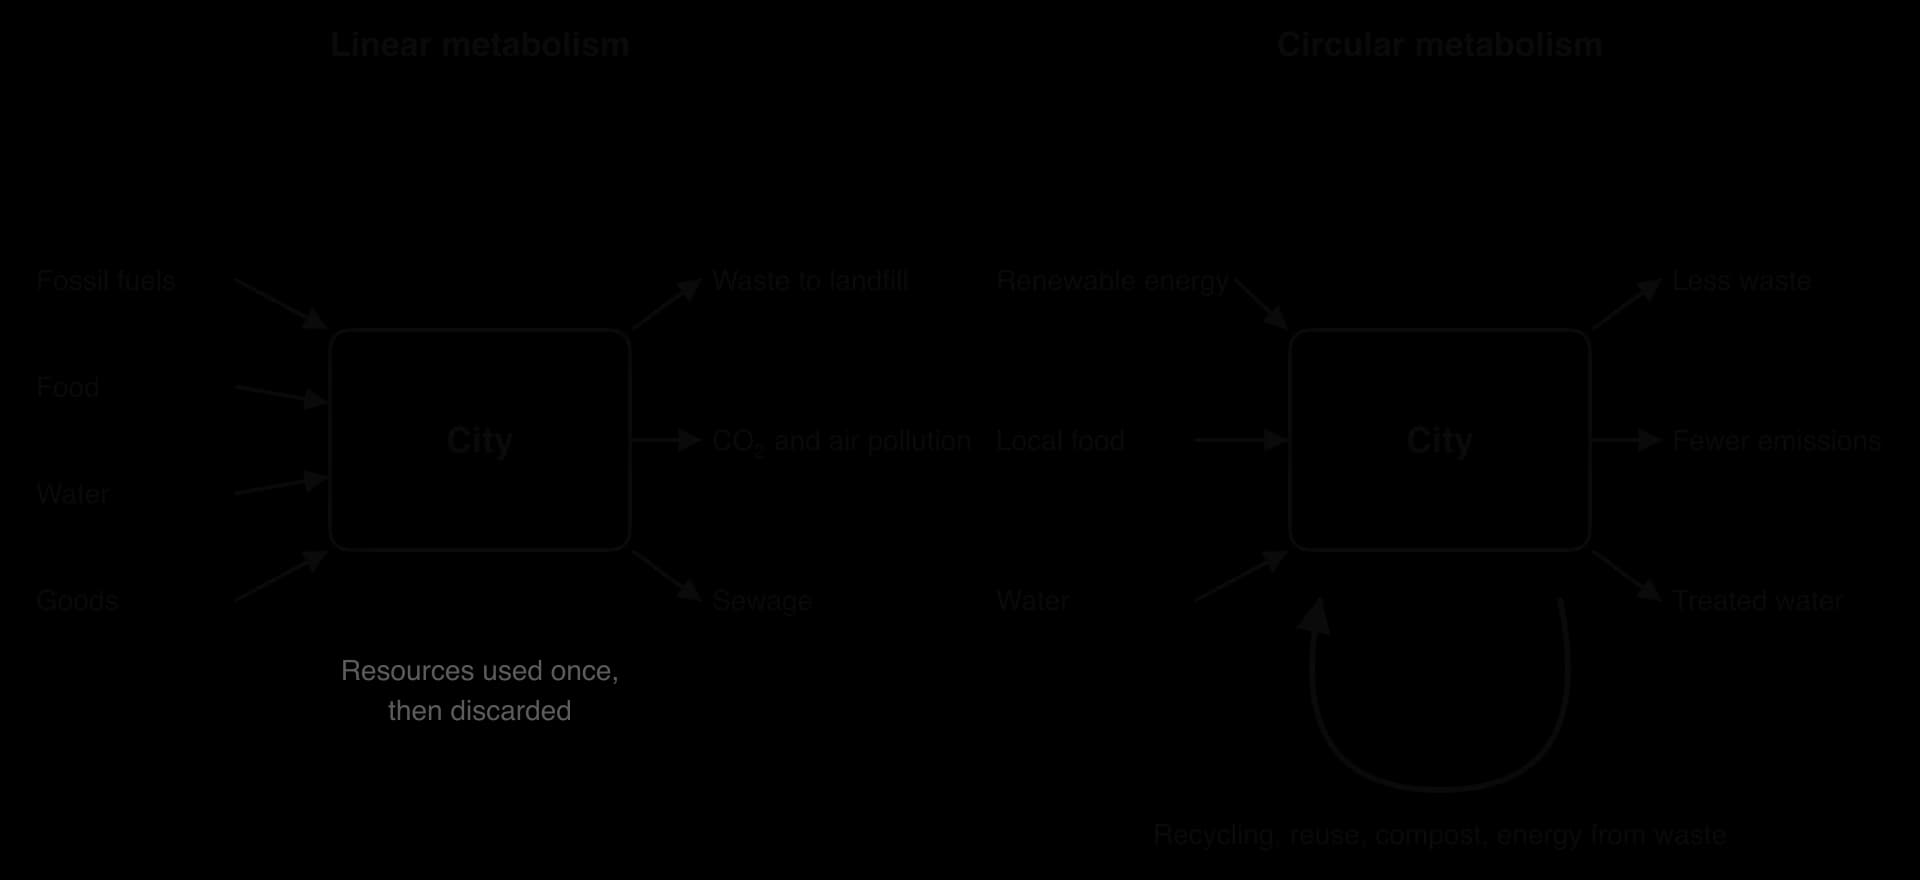
An eco-city is a city or district designed to minimise its ecological footprint and environmental impact while providing a good quality of life. No eco-city has yet achieved a truly circular metabolism, but they share a set of design principles.

Principle | How it reduces the footprint | Example |
|---|---|---|
Compact city | Higher densities shorten journeys, reduce the land built on and make public transport and district heating viable | Vauban, Freiburg; Hammarby Sjöstad, Stockholm |
Mixed-use development | Homes, shops, services and jobs close together mean more trips on foot | Most European eco-districts |
Car-free development and public transport | Removes most car journeys; BRT, tram, cycling and walking replace them | Vauban’s car-free streets; Curitiba’s BRT |
Renewable energy and efficient buildings | Solar, wind and heat pumps; insulated, passive buildings cut demand | Masdar City’s solar plant; Vauban’s Passivhaus and PlusEnergy homes |
District heating | One central plant using waste heat or biomass warms many buildings efficiently | Copenhagen; Vauban’s wood-chip plant |
Water recycling and rainwater harvesting | Reduce demand for imported water and treat wastewater locally | Sino-Singapore Tianjin Eco-city |
Waste reduction and recycling | Turn waste into energy, compost and materials | Curitiba’s recycling programmes; Hammarby Sjöstad’s waste system |
Green space and urban agriculture | Cooling, drainage, biodiversity and local food | Green corridors and allotments in many eco-districts |
Compactness works best when combined with a mix of uses, so that the short distances it creates are between homes and the places people need to reach.
A car-free development is a neighbourhood designed so that most residents do not need a car, with streets for walking, cycling and play, and parking, where allowed, concentrated at the edge.
District heating distributes heat from a central source, often waste heat from power generation or industry, through insulated pipes to many buildings, and is the backbone of low-carbon heating in Scandinavian cities.
Eco-cities are built in two ways. Purpose-built eco-cities are new settlements designed from scratch on an empty site, usually by governments and large developers. Examples include Masdar City in Abu Dhabi (begun 2008), the Sino-Singapore Tianjin Eco-city in China (2008) and Dongtan near Shanghai, announced in 2005 for up to 500,000 people and never built. Retrofitted eco-cities and eco-districts apply eco-city principles to existing places: redeveloping brownfield land, as at Vauban in Freiburg and Hammarby Sjöstad in Stockholm, or changing how a whole city works, as Curitiba in Brazil did with its BRT, parks and recycling from the 1970s.
Masdar City was launched in 2006 by the government of Abu Dhabi as a US$22 billion project to build the world’s first carbon-neutral city in the desert, for 45,000–50,000 residents and 60,000 daily commuters. Its design, by Foster and Partners, uses traditional Arab methods for a hot climate: narrow, shaded streets; a raised base that keeps the district cooler; and a wind tower that draws breezes through the public square. Buildings use about 40% less energy than the Abu Dhabi average.
By 2023, however, only about 15,000 people lived and worked there, about 5,000 of them residents, on less than a sixth of the planned site. The planned network of driverless electric pods was cut back to a pilot, the city was connected to the national grid in 2016 instead of running on its own renewable power, and the carbon-neutral target was abandoned.
Vauban is a district of about 38 hectares on a former French army barracks in Freiburg, south-west Germany, vacated in 1992. Building began in 1998 after a residents’ group, Forum Vauban, persuaded the city council to develop it as a sustainable model district and ran the public consultation.
Most plots were sold to groups of future residents who designed their own buildings. All houses meet a low-energy standard, 100 units are Passivhaus homes, and the 59 homes of the Solar Settlement each produce more energy than they use. Most streets are free of parking: car owners must buy a space in a car park at the edge (€17,500 in 2006), a tram runs through the district, and studies found that over 40% of households had no car. In 2020 it had 5,267 residents.
Masdar City, Abu Dhabi (UAE) | Vauban, Freiburg (Germany) | |
|---|---|---|
Type | Purpose-built new city on a desert site | Retrofitted brownfield district of an existing city |
Who planned it | State company (top-down), international architects | City council with a residents’ forum; residents’ building groups (bottom-up) |
Size | Planned 45,000–50,000 residents; about 5,000 by 2023 | About 5,300 residents on 38 ha (2020) |
Energy | 10 MW solar plant and rooftop solar; connected to the grid in 2016; 40% less energy than the local average | Low-energy standard for all homes; 100 Passivhaus units; 59 PlusEnergy homes; wood-chip district heating |
Transport | No petrol cars inside; driverless pods only a prototype | Tram to the city centre; most streets without parking; over 40% of households car-free |
Climate design | Narrow shaded streets, wind tower, raised base | Green spaces, solar orientation |
Main criticisms | Far below planned size; very high cost; carbon-neutral target dropped; called a symbol or showcase | Expensive housing; residents mostly young, educated families; small scale |
Purpose-built eco-cities show what design can achieve but face common problems. They are very expensive, they often attract far fewer residents than planned (the Tianjin Eco-city had about 100,000 people in 2019 against a target of 350,000 by 2020), and critics describe some as greenwashing: a sustainable image used to market real estate or national prestige. Their residents are usually well-off, so they do little for the low-income majority in fast-growing cities. Copenhagen, often held up as a model, abandoned its aim of becoming carbon-neutral by 2025 when a planned carbon-capture project at its waste incinerator was not funded.
Retrofitted districts such as Vauban have higher occupancy and community support, but they are small and depend on local conditions: a university city with a strong environmental movement, public land and a good tram network. The greatest gains may come from many smaller changes across existing cities (insulating buildings, district heating, cycling networks, recycling) rather than from showcase cities. For the cities of Africa and South Asia that will absorb most urban growth to 2050, the most relevant lessons are about low-cost, compact, transit-oriented design and waste systems that include informal recyclers, as Curitiba showed in a middle-income city.
A smart city uses digital technology and data to run its services and infrastructure more efficiently and to improve the lives of its residents. Sensors collect data on traffic, energy use, water, air quality and waste; networks transmit it; and software, increasingly using artificial intelligence, analyses it and adjusts systems automatically or informs decisions.
The basis of most smart systems is the Internet of Things (IoT): everyday objects such as street lights, bins, water meters, traffic signals and vehicles fitted with sensors and connected to the internet so that they can send and receive data.
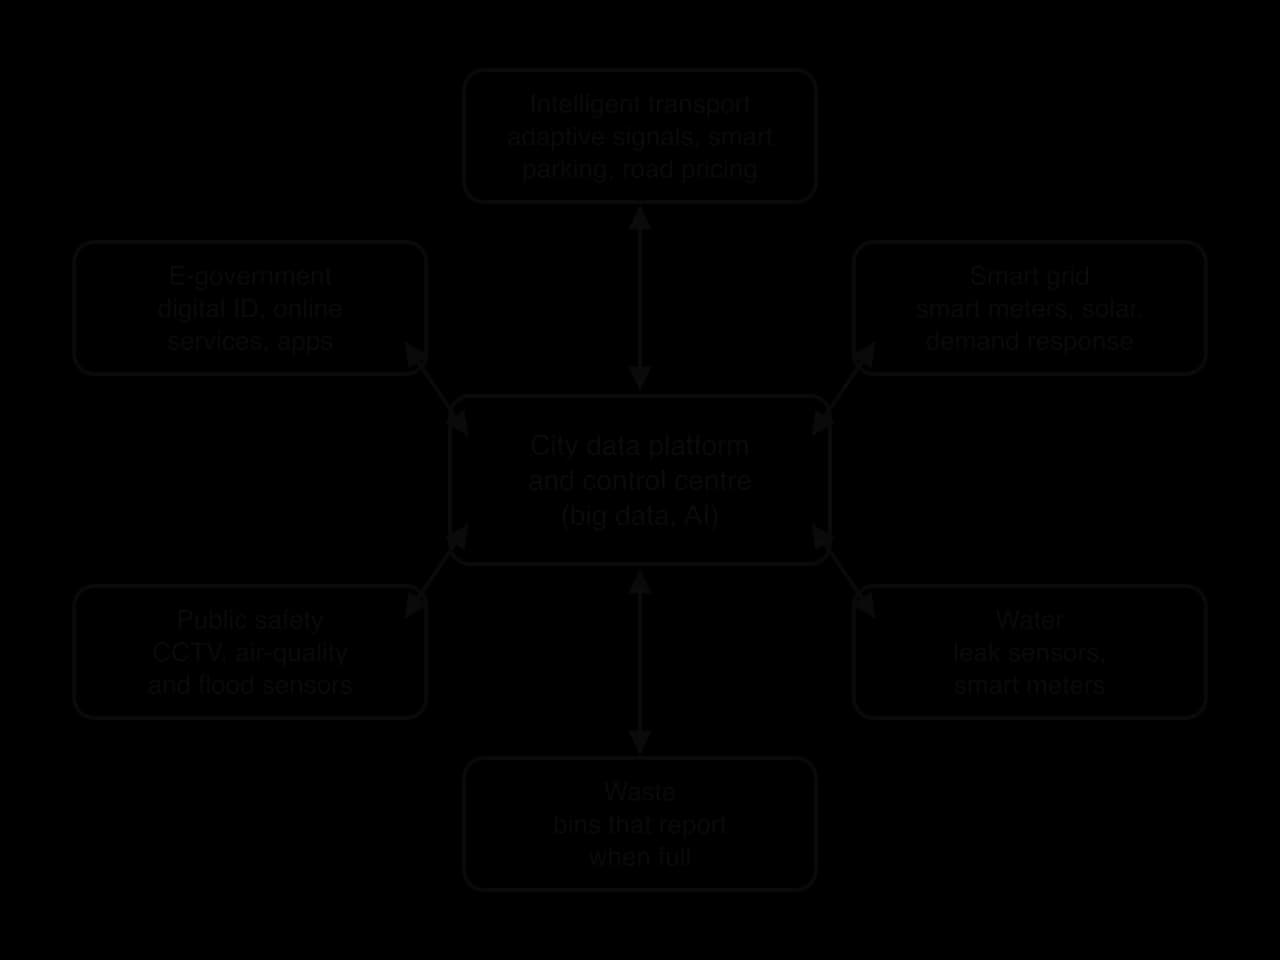
Typical smart city systems include:
An intelligent transport system (ITS): adaptive traffic signals that respond to queues, real-time bus information, smart parking that guides drivers to free spaces, and electronic road pricing.
A smart grid: an electricity network that uses smart meters and digital controls to match supply and demand, integrate solar and wind power and detect faults.
Water and waste: sensors that detect leaks in water mains, meters that report use, and bins that signal when they are full so that collection routes can be planned.
Public safety: networks of CCTV, air-quality and flood sensors, and smart street lights that dim when no one is near.
E-government: digital identity cards and online public services for tax, health, voting, licences and business registration.
Smart grids matter most where cities rely on solar and wind power, whose output varies with the weather, so supply must be balanced against demand minute by minute.
E-government changes how residents deal with the state: in the most digital cities, a tax return or a business licence takes minutes online rather than a visit to an office.
A purpose-built settlement is designed and built from scratch, which allows technology to be built in from the start. Songdo in South Korea, built from 2003 on 600 ha of land reclaimed from tidal flats near Incheon, has pneumatic pipes that suck household waste to a central plant (so there are no rubbish trucks or street bins), sensors throughout, over 40% of its area as green space and 106 buildings certified as energy-efficient. It had 167,346 residents in 2020, but critics describe it as car-centric and hard to walk around, and have dismissed some of its sustainability claims as greenwashing.
Saudi Arabia’s The Line, announced in 2021 as part of the NEOM project, was to be a 170 km linear city for 9 million people, with no cars or streets and all services within five minutes’ walk. Its first phase was reported to have been cut to a few kilometres, and by the end of 2025 construction had been suspended. Its critics pointed to unrealistic costs, environmental harm and the forced removal of local residents.
Most smart city work is retrofitting: adding technology to existing cities. Singapore launched its Smart Nation programme in 2014, linking government services, transport and sensors; its new satellite-based road pricing system, ERP 2.0, required on-board units that were fitted to more than half a million vehicles from November 2023. Barcelona has used sensors for street lighting, irrigation and parking, alongside its "superblocks", groups of nine city blocks whose interior streets are closed to through traffic. Estonia, building on its experience of the 2007 cyber attacks, provides almost all public services online through a secure national digital identity, and Tallinn is often cited as a model of e-government.
India’s Smart Cities Mission, launched in June 2015, combined both approaches in 100 cities, mostly by redeveloping or retrofitting selected areas. It funded command-and-control centres, smart roads, CCTV and water systems, but by the time the mission closed on 31 March 2025 only 18 of the 100 cities had declared all their projects complete, and reports found that about 1,500 of the 3,686 CCTV cameras installed in Nagpur were not working within a year.
Strengths | Limitations |
|---|---|
More efficient services: fewer wasted waste-truck trips, faster repairs of leaks, smoother traffic | High cost; benefits often smaller than promised; systems become out of date quickly |
Lower emissions and energy use where systems cut waste | Technology can be used to sell real estate or national prestige rather than to solve local problems |
Better information for residents and planners; faster public services (Estonia) | Surveillance and privacy: data on movement and behaviour can be misused |
Can support resilience, for example flood sensors and early warnings | More connected systems are more exposed to cyber attack (cybersecurity) |
Purpose-built cities can integrate systems from the start (Songdo) | Purpose-built cities are often under-occupied and expensive (Songdo, The Line) |
Retrofitting reaches existing residents (Singapore, Barcelona) | The digital divide: older, poorer and informal-settlement residents may be excluded |
The question of data ownership shows how power shapes smart cities. In Toronto, Sidewalk Labs, a sister company of Google, planned a smart district on 4.9 ha of waterfront land at Quayside from 2017, with sensors, self-driving vehicles and automated waste collection. Critics objected that a technology corporation would collect detailed data about residents’ lives, and the company withdrew in May 2020, citing economic uncertainty during the COVID-19 pandemic. Smart cities raise the question of whether technology serves residents or the companies and governments that control the data.
Sources: Wikipedia, “Masdar City”, “Vauban, Freiburg”, “Sino-Singapore Tianjin Eco-city”, “Songdo International Business District”, “The Line, Saudi Arabia”, “Smart Cities Mission”, “Sidewalk Toronto” and “Electronic Road Pricing”, accessed 2026.
Copenhagen, the capital of Denmark, is a high-income city of about 650,000 people in the municipality (and about 2 million in the wider metropolitan area) on the low-lying east coast of the island of Zealand, beside the Øresund strait. Much of the city centre is only a few metres above sea level, and its sewers, many of them built in the 19th and early 20th centuries, combine rainwater and wastewater in the same pipes and were designed for roughly a 1-in-10-year storm. Climate projections for Denmark show heavier rainfall extremes, with the intensity of a 10-year rainfall event projected to rise by about 30% by 2100.
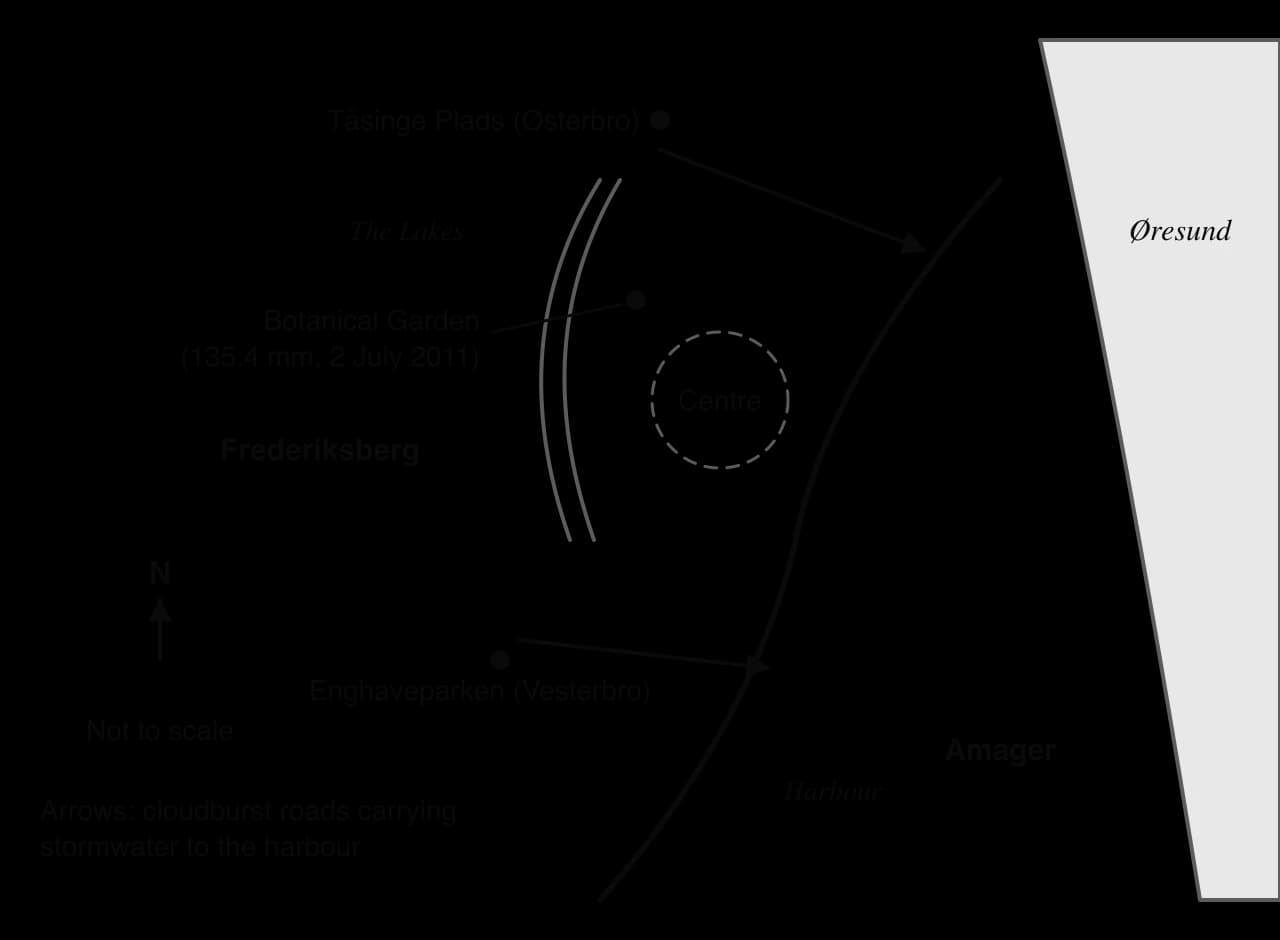
On the evening of 2 July 2011 a thunderstorm moved across Greater Copenhagen for about two hours. The city’s Botanical Garden recorded 135.4 mm of rain in a day, the most in 24 hours for 55 years, and 31 mm fell in ten minutes at Ishøj, south-west of the city. More than 5,000 lightning strikes were recorded in three hours. The sewers overflowed within minutes: basements filled with a mixture of rainwater and sewage, roads including the Helsingør motorway were closed, and water and mud entered Rigshospitalet, the main hospital, whose trauma centre had to move to another hospital.
Insurers received about 90,000 claims and paid out DKK 6.2 billion, making it Denmark’s most expensive natural disaster in years. A 2012 study found that over a fifth of 257 clean-up workers fell ill after contact with sewage, and one man died of leptospirosis. In 2022 researchers at the University of Copenhagen and the Danish Meteorological Institute concluded that global warming had roughly doubled the risk of such a cloudburst.
In 2012 the city adopted a Cloudburst Management Plan. Instead of relying only on larger sewers, it treats surface space as part of the drainage system. Its standard is that in a 100-year rainfall event, no more than 10 cm of water should stand on the surface, except in places designed to hold it. About 300 projects are planned across the city’s catchments, at a rate of about 15 a year over 20–30 years, of several types:
Cloudburst roads: streets reshaped with a V- or U-shaped profile and raised kerbs, so that in a storm they become channels carrying water to the harbour or the Lakes.
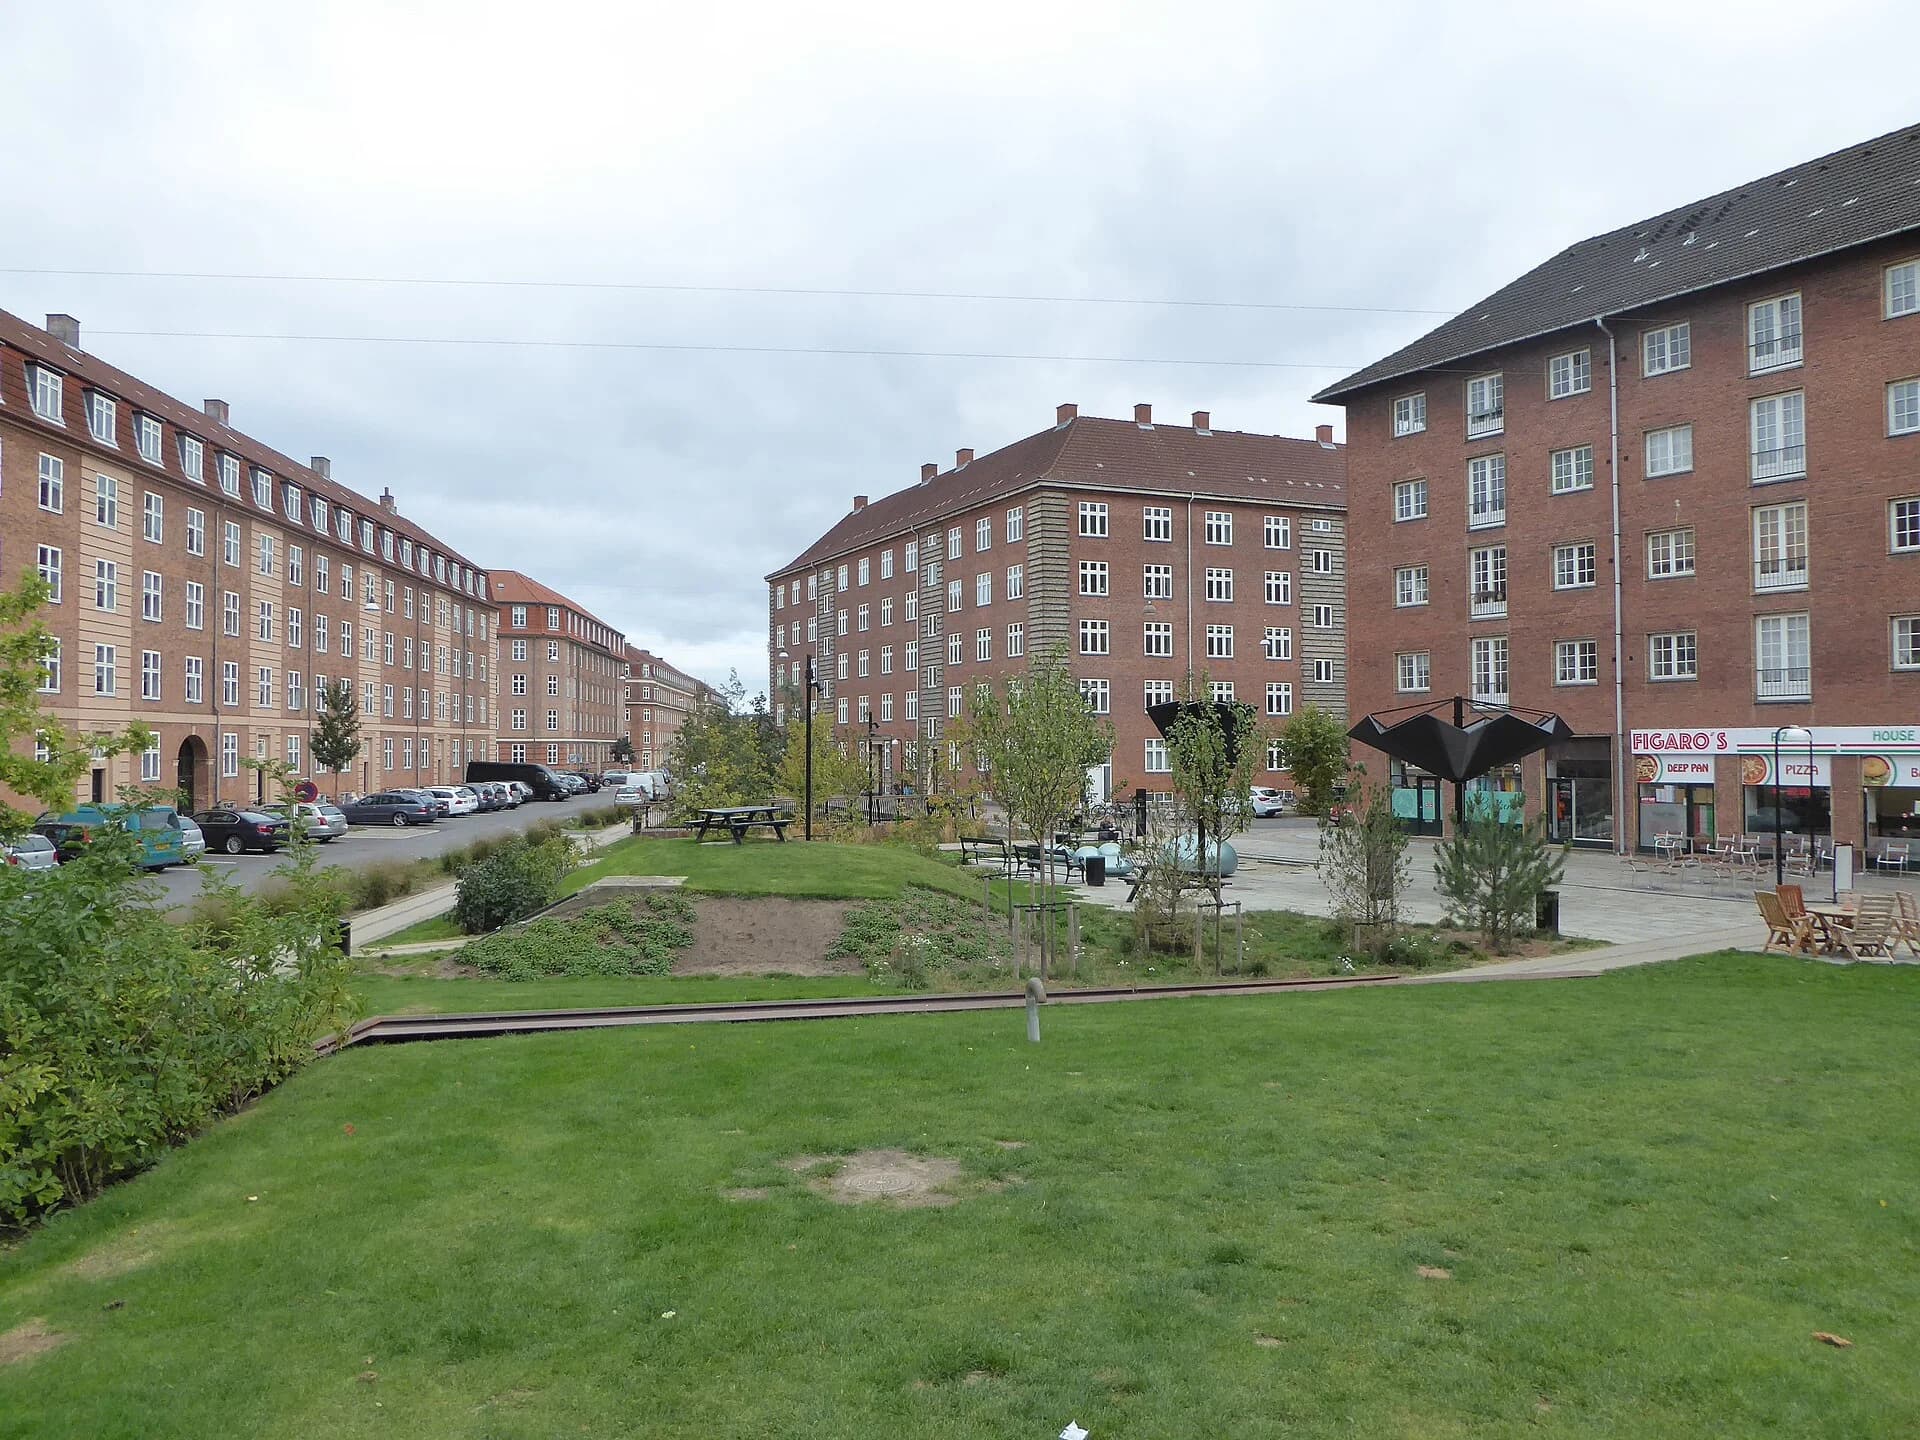
Retention spaces: parks, sports grounds and squares that can flood temporarily. Enghaveparken in Vesterbro, redesigned under the plan, can hold about 22,000 m³ of water for up to 24 hours behind low walls and flood gates; its sunken sports court doubles as a reservoir.
Green streets: side streets with planting beds, trees and permeable surfaces that absorb and slow rain where it falls. Tåsinge Plads in Østerbro, a former street converted into a green square, channels rain from roofs into planted beds.
Cloudburst tunnels and pipes: large pipes in the densest parts of the centre, where there is no room at the surface, take water straight to the harbour.
 YouTube
The city justified the plan with a cost–benefit analysis over 100 years, comparing a traditional solution of larger sewers with a combined solution using surface measures plus some pipes. Doing nothing was estimated to cause about DKK 16 billion of flood damage over the century; both solutions would avoid it.
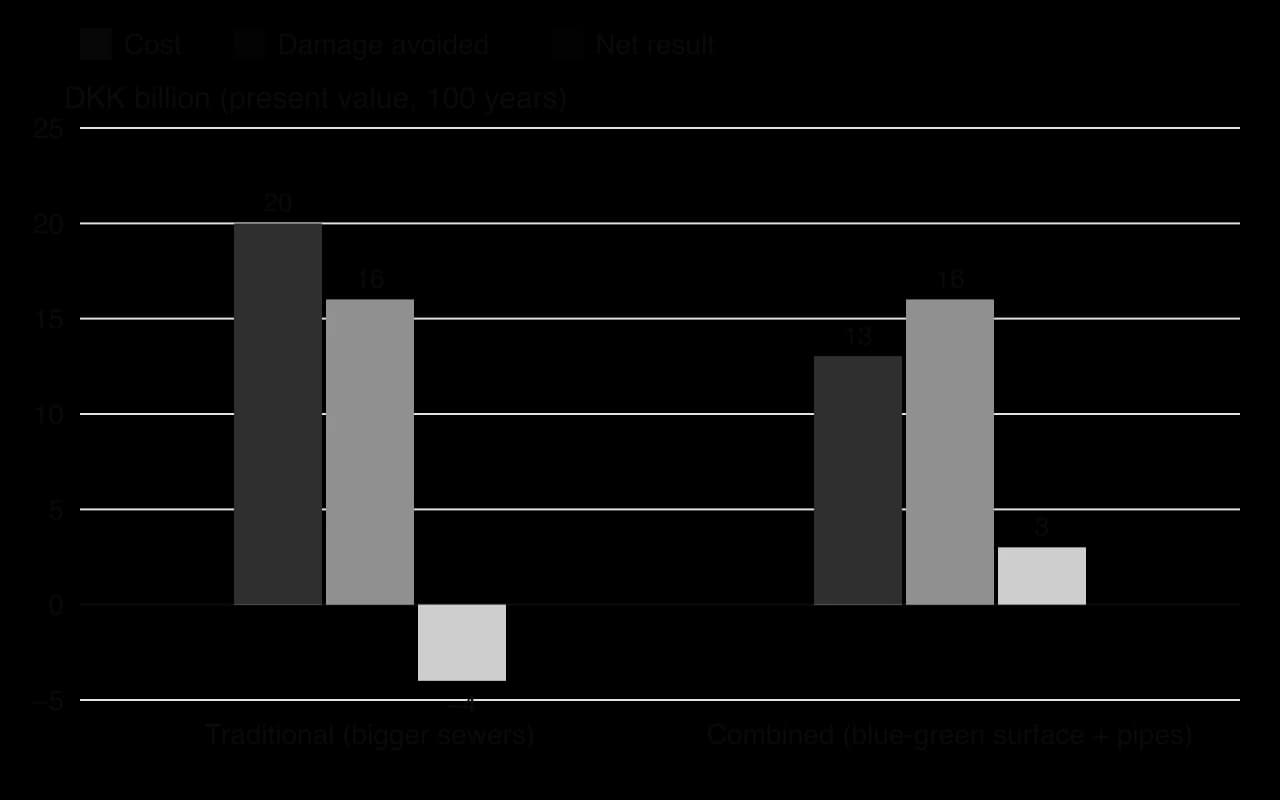
The traditional option would cost about DKK 20 billion, a net loss of DKK 4 billion. The combined option would cost about DKK 13 billion, a net gain of DKK 3 billion, before counting its other benefits: greener streets estimated to raise property values by about DKK 1.4 billion, cooling, recreation, biodiversity, and more than 13,000 full-time jobs during construction. Most of the cost is paid through household water charges, about DKK 890 a year for a typical household, with the city paying for improvements to public space and landowners paying for protection of their own buildings, such as backflow valves.
The plan has strengths as a resilience strategy. It adapts the city to a changing risk instead of only defending it, it provides benefits every day rather than only during storms, and it was cheaper than the alternative. When heavy rain fell soon after Enghaveparken’s basins were completed, they filled as designed. It also shows possibility: the same budget can be spent on hidden pipes or on public spaces that make the city greener.
It also has limitations. The programme takes decades, so most of the city remains at risk until projects are finished. About 30% of the road length included in the plan (132 km) is private road, so its owners must agree to the work and share its cost. Measures designed for a 100-year event may be inadequate if rainfall increases faster than projected, and the approach depends on space that denser or poorer cities may not have. Water quality is a concern too, because stormwater from streets carries pollutants into the harbour.
Stakeholder | Perspective |
|---|---|
City of Copenhagen | Cheaper than pipes alone; makes the city greener and more attractive; supports its climate strategy |
HOFOR (the water utility) and households | Pay most of the cost through water charges; benefit from fewer flooded basements |
Private landowners | Must agree to work on private roads and pay to protect their own buildings |
Insurers | Lower future claims after DKK 6.2 billion of losses in 2011 |
Residents near new parks and green streets | Gain green space and higher property values; some worry about rising rents |
Why might Copenhagen’s approach be harder to apply in a fast-growing city in a low-income country?
Is the Cloudburst Management Plan an example of absorbing, adapting or transforming? Give reasons.
Who pays for the plan, and who benefits most from it?
Sources: Climate-ADAPT (European Environment Agency), “The economics of managing heavy rains and stormwater in Copenhagen: the Cloudburst Management Plan”; University of Copenhagen, Niels Bohr Institute news, 15 September 2022; Wikipedia, “2011 cloudburst in Denmark” and “Enghaveparken”, accessed 2026.
The UN projects that about two-thirds of the world’s people will be urban by 2050 (68% in WUP 2018; 67.3% in WUP 2025 by national definitions), with about 90% of urban growth in Asia and Africa.
India, China and Nigeria account for about 31% of urban growth to 2050; Africa’s urban population is projected to double; most growth is in small and intermediate cities, while some cities shrink.
Projections depend on assumptions and on the definition of “urban”: the UN’s Degree of Urbanisation gives 45% in cities in 2025 and makes Jakarta the largest city.
Urban resilience is the capacity to absorb, adapt to and transform in response to acute shocks and chronic stresses.
Climatic strategies include storm surge barriers, water squares, sponge cities, heat action plans and water diversification; geopolitical strategies include hostile vehicle mitigation, redundancy, protection of critical infrastructure and cybersecurity.
Copenhagen’s Cloudburst plan uses streets, parks and squares to store and channel rain, at DKK 13 billion against DKK 20 billion for bigger sewers; Tokyo’s G-Cans shows the grey, underground alternative.
Eco-cities aim to shrink the urban ecological footprint by moving from a linear to a circular metabolism; Masdar City (purpose-built) fell far short of its plans, while Vauban (retrofitted) works at small scale.
Smart cities use the Internet of Things, smart grids, intelligent transport and e-government; they raise efficiency but also concerns about cost, surveillance, cyber risk and the digital divide.
I can describe regional patterns of urban growth to 2050 using UN data, and explain why definitions change the figures.
I can explain trends in rural–urban migration, city sizes and urban population structures, and why projections are uncertain.
I can define urban resilience and distinguish acute shocks from chronic stresses, with examples.
I can evaluate strategies for climatic risks using Copenhagen’s Cloudburst plan and Tokyo’s G-Cans.
I can evaluate strategies for geopolitical risks such as terrorism, war and cyber attacks.
I can draw and explain linear and circular urban metabolism and link them to the urban ecological footprint.
I can compare Masdar City and Vauban as purpose-built and retrofitted eco-cities.
I can evaluate smart city technology in purpose-built settlements and retrofitted cities.
Social aspects: produce is often expensive and sold to affluent urban consumers, so it does little for food insecurity among the poor; it may also create skilled urban jobs.
Good answers may be well structured (AO4) and may additionally offer a critical evaluation (AO3) which recognizes that vertical farming may be sustainable in some places (land-scarce, energy-rich or renewable-powered cities such as Singapore or in the Gulf states) but not others. Another approach might be to consider how future possibilities (cheaper LEDs, renewable energy, automation) could change its sustainability over time, or to compare it with other contemporary approaches such as GMOs and in vitro meat.
For 5–6 marks, expect some weakly-evidenced outlining of advantages and/or disadvantages of vertical farming.
For 7–8 marks, expect a structured account which includes:
either well-evidenced explanation of how vertical farming does and does not support sustainability
or a discursive conclusion (or ongoing evaluation) grounded in geographical concepts and/or perspectives.
For 9–10 marks, expect both of these traits.
Marks | Level descriptor |
|---|---|
0 | The response does not reach a standard described by the descriptors below. |
1–2 | Too brief, lists unconnected information, not focused on the question and lacks structure. Knowledge is very general, with large gaps or errors; examples or case studies are missing or only listed. No analysis; terminology is missing or used incorrectly. |
3–4 | Too general, lacks detail, not focused on the question and largely unstructured. Outlines examples, statistics and facts, both relevant and irrelevant, with links to the question only listed. Basic terminology is used, with errors or inconsistently. No critical evaluation of evidence; any conclusion is irrelevant. |
5–6 | Partially addresses the question, with a narrow argument, an unsubstantiated conclusion and limited evaluation. Describes relevant supporting evidence (examples, case studies) and outlines links to the question. The argument repeats one point or covers only part of the question. Other perspectives, or strengths and weaknesses of evidence, are listed. |
7–8 | Addresses the whole question; the analysis is evaluated and the conclusion is relevant but lacks balance. Relevant evidence is described correctly and covers all the main points. The argument is clear but one-sided or unbalanced. Complex terminology is used correctly but not consistently. Other perspectives, or strengths and weaknesses of evidence, are described. |
9–10 | In-depth and specific to the question (topic and command term). Correct, relevant examples, statistics and detail are integrated and their link to the question explained. The argument is balanced, explaining complexity, exceptions and comparisons. Evaluation of evidence and perspectives is well developed, and the conclusion is balanced and aligned with the evidence. Logically structured and easy to follow. |
Evaluate the advantages and disadvantages of planned growth, compared with spontaneous growth, for urban places and their populations.
10 marks
Evaluate the strategies used to reduce the urban heat island effect in one or more named cities.
10 marks