Notes on 7.2 Energy sources—uses and management
Learning objectives
Distinguish between renewable and non-renewable energy sources, and outline how each main source is converted into electricity.
Describe the trends in global energy consumption and explain why consumption is rising and why fossil fuels still dominate.
Evaluate the relative sustainability of fossil fuels, rare earth elements, nuclear power, solar power and other renewable sources across their whole life cycle.
Discuss the factors that influence the energy choices of two contrasting named countries.
Explain why intermittent renewable sources need energy storage, and outline how batteries, pumped hydroelectric storage, fuel cells and thermal storage shave peaks in demand.
Distinguish between energy conservation and energy efficiency, and evaluate the effectiveness of two examples in reducing dependence on imports.
Explain what energy security means and how efficiency, fewer imports and diversification improve it, using data on changing energy sources. (HL)
Discuss the factors that affect how long the reserves of coal, oil and natural gas will last. (HL)
Evaluate nuclear fission as a non-renewable, low-carbon source of electricity, including mining, thermal pollution, accidents and radioactive waste. (HL)
Examine the environmental and sociopolitical costs of the minerals needed for large-scale battery storage, using lithium as an example. (HL)
Introduction
Energy is used to heat and cool buildings, cook food, move people and goods, light streets, run factories and power every electronic device. Almost all of it comes from the Earth’s natural capital, either as stored fuels such as coal, oil, gas and uranium, or as flows such as sunlight, wind and running water. How a society produces and uses energy affects its air quality, its emissions of greenhouse gases, its economy and its relations with other countries.
Energy production can be studied as a system: primary energy sources are the inputs, power stations and engines carry out transformations, electricity grids and pipelines carry out transfers, and waste heat, pollutants and spent fuel are the outputs. Choices between energy sources reflect different perspectives, from a technocentric faith in new reactors and batteries to an ecocentric emphasis on using less, and they are central to whether human societies can be sustainable.
Renewable and non-renewable energy sources
An energy source is any store or flow of energy that people can capture and use. The energy found in a source before it has been converted by people, such as the chemical energy in crude oil or the kinetic energy of wind, is called primary energy. Most primary energy is converted into other forms before use: crude oil is refined into petrol and diesel, and coal, gas, wind and sunlight are converted into electricity.
Energy sources are classified in the same way as other natural resources. A renewable resource is replaced by natural processes at least as fast as it is used, while a non-renewable resource exists as a fixed stock that is used up far faster than it forms. Fossil fuels formed from the remains of organisms buried and compressed over millions of years; at today’s rates of use they are effectively not replaced at all.
The non-renewable energy sources are the fossil fuels (coal, oil and natural gas) and the uranium used in nuclear power. The main sources of renewable energy are wind, solar, tidal, geothermal, hydropower and wood and other biomass. Wood is renewable only if trees are replanted and grow back as fast as they are cut; where forests are cleared for fuel faster than they regrow, wood behaves like a non-renewable resource.
How each source produces electricity
Most energy from these sources is converted to electricity, because electricity can be carried long distances through cables and used for almost any purpose. In a thermal power station, a fuel is burned (coal, gas, oil, wood) or undergoes nuclear fission (uranium) to release heat. The heat boils water to make high-pressure steam, the steam spins a turbine, and the turbine turns a generator that produces electricity.
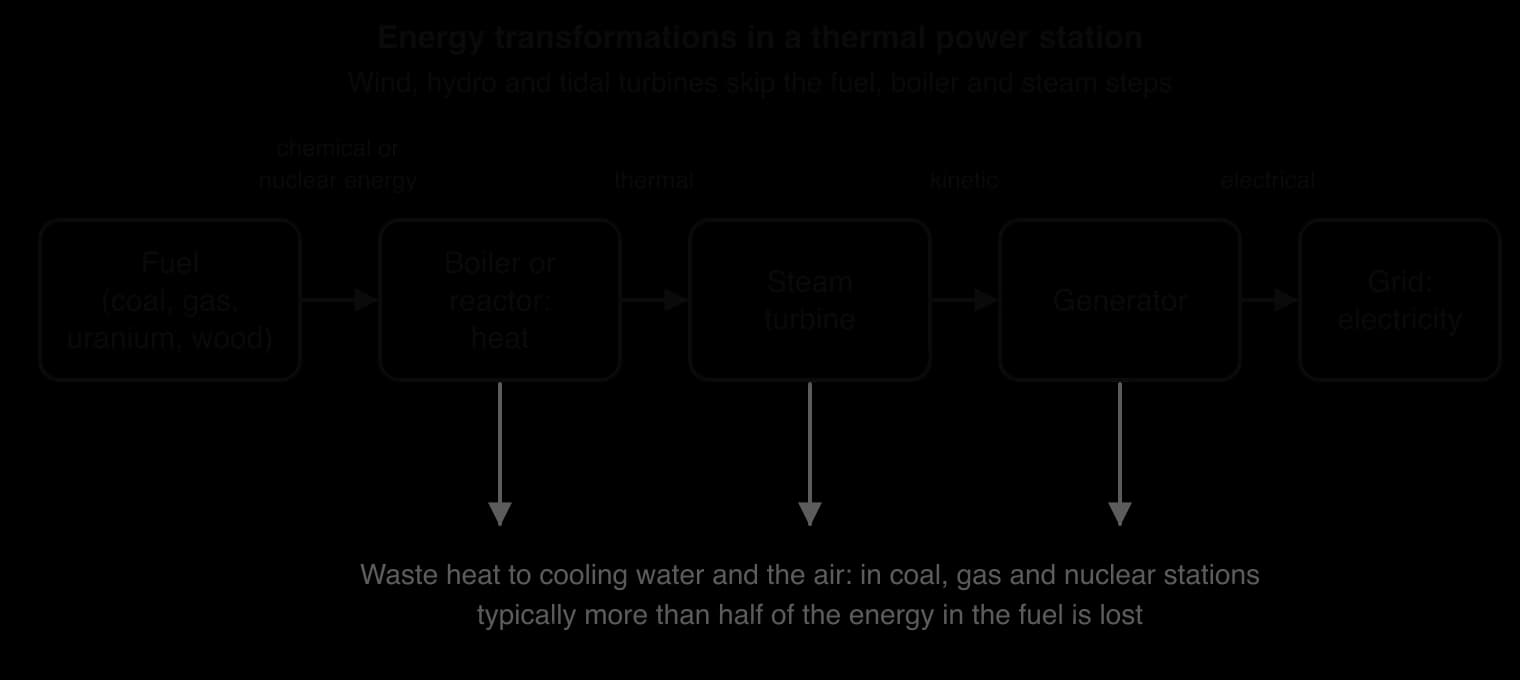
Each conversion obeys the second law of thermodynamics: some energy is always lost as low-grade heat that cannot do further useful work. Large amounts of waste heat leave a thermal power station through its cooling towers or in warmed river or sea water. Wind, hydroelectric and tidal turbines avoid the heat and steam steps altogether, because the moving air or water turns the turbine directly, and solar photovoltaic cells convert light straight into electricity with no moving parts.
Source | Type | How it is converted | Example |
|---|---|---|---|
Coal | Non-renewable (fossil fuel) | Burned to heat water into steam that drives a turbine | Coal supplied 74.5% of India’s electricity in 2024 |
Oil | Non-renewable (fossil fuel) | Refined into petrol, diesel and jet fuel for engines; sometimes burned in power stations | Oil generated 34.5% of Saudi Arabia’s electricity in 2024 |
Natural gas | Non-renewable (fossil fuel) | Burned in gas turbines and for heating and cooking | Gas generated 42.6% of electricity in the United States in 2024 |
Uranium (nuclear) | Non-renewable, low-carbon | Nuclear fission releases heat that makes steam | 67.7% of France’s electricity in 2024 |
Hydropower | Renewable | Water stored behind a dam falls through turbines | 88.8% of Norway’s electricity in 2024 |
Wind | Renewable | Moving air turns the blades of a turbine linked to a generator | 28.5% of Germany’s electricity in 2024 |
Solar | Renewable | Photovoltaic cells convert light directly to electricity; concentrated solar power uses mirrors to make steam | 17.8% of Australia’s electricity in 2024 |
Tidal | Renewable | Tidal currents or water held behind a barrage drive turbines | La Rance barrage, France (240 MW) |
Geothermal |
Sources: Electricity shares: Ember and Energy Institute, via Our World in Data (2025).
The renewable sources one by one
Wind power uses the kinetic energy of moving air. A modern turbine has three long blades on a tower; wind turns the blades, which turn a generator. Turbines are built on land (onshore) or at sea (offshore), where winds are stronger and steadier but construction is more expensive.
Solar power captures energy from sunlight. Photovoltaic (PV) panels contain layers of silicon that release electrons when light strikes them, producing an electric current directly. Concentrated solar power uses mirrors to focus sunlight onto a receiver, heating a fluid that makes steam for a turbine. Solar water heaters on roofs use sunlight to heat water without making electricity at all.
Hydroelectric power uses the gravitational potential energy of water held behind a dam. Water released through pipes falls onto turbines at the base of the dam. Hydropower was the first large renewable source of electricity and still supplied 14.3% of the world’s electricity in 2024, more than wind or solar.
Tidal power uses the rise and fall of the sea caused by the gravitational pull of the Moon and Sun. A tidal barrage is a dam across an estuary that traps water at high tide and releases it through turbines as the tide falls; tidal stream turbines sit on the sea floor and are turned by tidal currents. Tides are completely predictable, but very few coastlines have a large enough tidal range.
Geothermal energy is heat from the Earth’s interior, produced partly by the decay of radioactive elements in the rocks and partly left over from the formation of the planet. Where hot rocks lie close to the surface, as at plate boundaries in Iceland, Kenya, Indonesia and New Zealand, hot water and steam can be piped up to drive turbines or to heat buildings directly. Kenya had 891.8 MW of geothermal capacity in 2023, much of it at Olkaria in the Great Rift Valley.
Biofuels are fuels made from recently living organisms: firewood, charcoal, crop waste and dung, and liquid fuels such as ethanol fermented from sugar cane or maize and biodiesel made from vegetable oils. Burning them releases carbon dioxide, but the plants absorbed the same carbon from the air as they grew, so in principle they can be close to carbon-neutral. In practice the emissions from farming, processing and clearing land for fuel crops can be large.
Nuclear power is the one major low-carbon source that is not renewable. Its fuel, uranium, is mined from ore, enriched and made into fuel rods; inside the reactor, the nuclei of uranium atoms split and release heat. The heat makes steam to drive turbines, exactly as in a coal-fired station.
Global energy consumption
World primary energy consumption has risen almost every year for as long as records have been kept. It grew from about 43,000 TWh in 1965 to about 177,000 TWh in 2024, a fourfold increase in sixty years. Falls have been rare and short: consumption dipped after the oil price shocks of the late 1970s, in the 2009 financial crisis and in 2020, when COVID-19 lockdowns cut travel and industry, and then recovered each time.
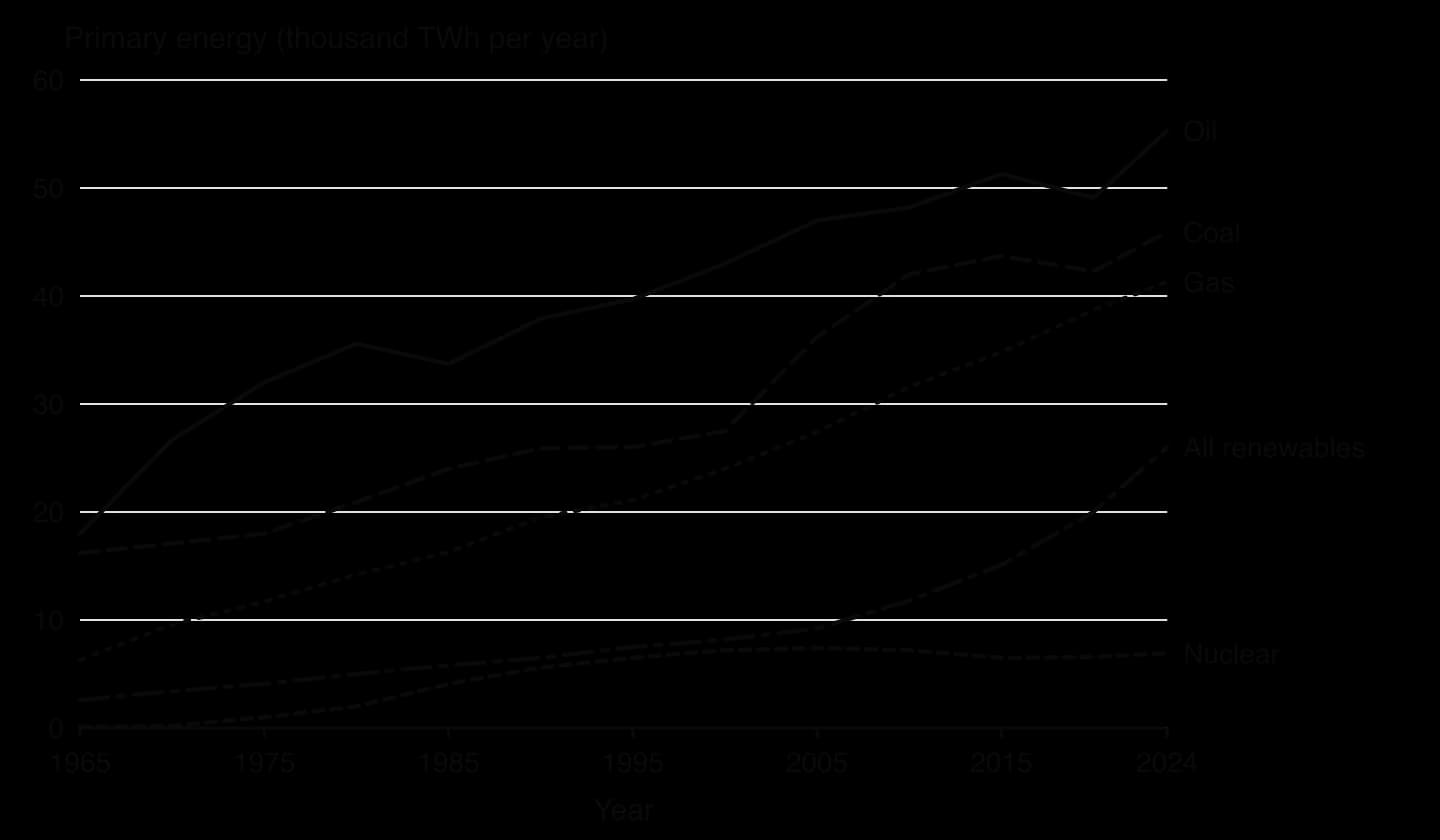
The chart shows two trends at once. Every fossil fuel was consumed in larger amounts in 2024 than ever before, and fossil fuels still supplied 81.3% of the world’s primary energy, down only slightly from 93.7% in 1965. At the same time, renewable sources grew from 8,200 TWh in 2000 to 26,000 TWh in 2024, and solar power alone grew about eightfold between 2015 and 2024.
The energy mix for electricity is changing faster than the energy mix as a whole. In 2024, renewables generated 31.9% of the world’s electricity (hydropower 14.3%, wind 8.1%, solar 6.9%) and nuclear power 9.0%, so 41% of electricity came from low-carbon sources. Fossil fuels still dominate transport, heating and heavy industry, which use far more energy than electricity generation and are harder to switch.
Sources: Our World in Data, energy dataset (Energy Institute Statistical Review of World Energy and Ember, 2025).
Why consumption keeps rising
Total energy use is the product of two quantities: the number of people and the energy each person uses. Both have grown. The world’s population rose from about 3.3 billion in 1965 to 8.2 billion in 2024, and average primary energy use per person rose from about 13,000 kWh to 21,700 kWh a year over the same period.
Energy use per person rises as countries industrialise and incomes grow. People move from farms to cities, buy refrigerators, air conditioners and cars, and eat more processed and transported food; factories make more steel, cement and plastics; and services such as data centres and air travel expand. Since about 2000 most of the growth in demand has come from middle-income countries, especially China and India, while use per person in many high-income countries has levelled off or fallen.
Unequal energy use
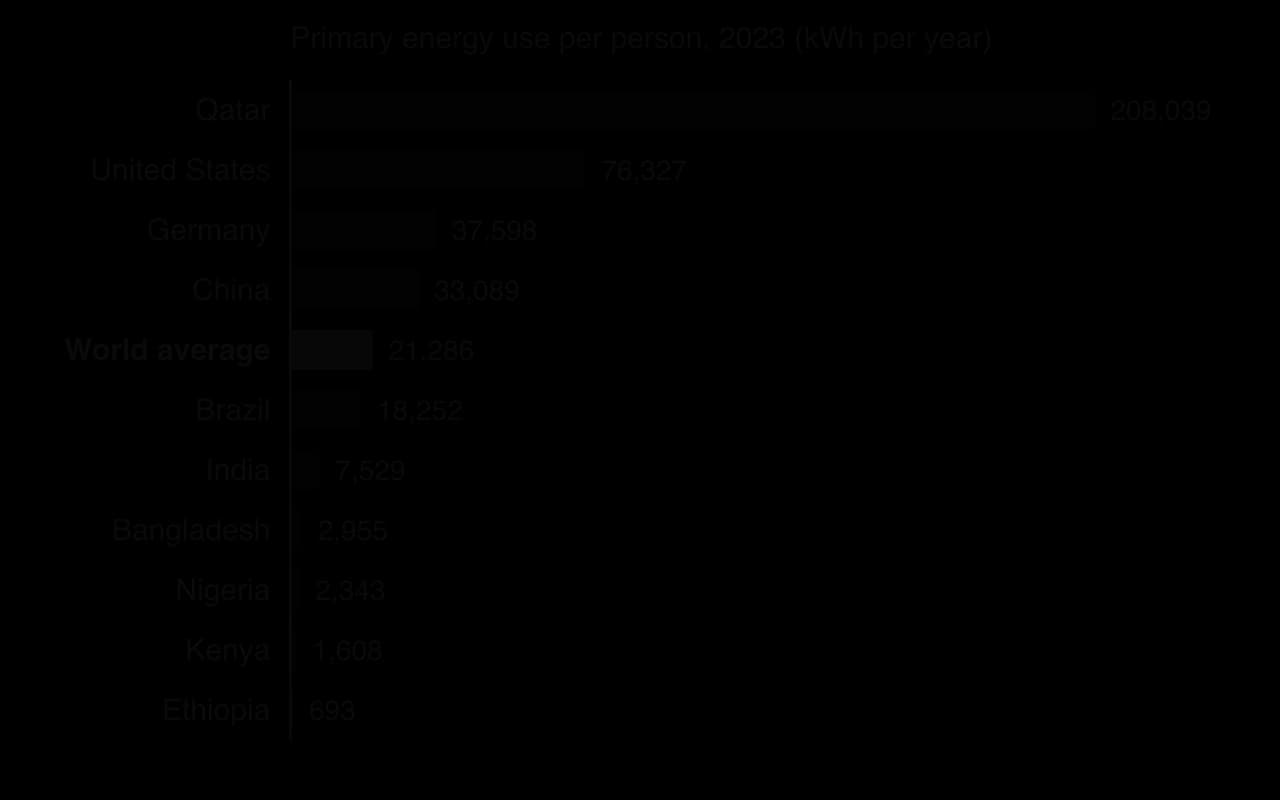
Energy use is very unequal. The bar chart shows that a person in Qatar or the United States uses many times the world average, while people in Ethiopia, Kenya and Nigeria use only a small fraction of it, mostly as firewood, charcoal and kerosene for cooking and lighting. Low-income countries need more energy, not less, to provide clean cooking, lighting, refrigeration of food and medicines, and jobs. This raises a question of environmental justice: the countries that have used least energy have contributed least to climate change, yet they are asked to develop without the cheap fossil fuels that powered the growth of high-income countries.
Why dependence on fossil fuels continues
Even if every power station were switched to renewable sources, fossil fuels would still be needed for three materials on which modern societies are built. Each of them uses fossil fuels as a raw material or for intense heat, not only as a source of electricity.
Steel. In a blast furnace, carbon from coal, in the form of coke, removes oxygen from iron ore to leave iron, releasing carbon dioxide. Making one tonne of steel emits about 1.8 tonnes of CO₂, and steelmaking produces roughly 7–11% of global CO₂ emissions.
Cement and concrete. Cement is made by heating limestone to about 1,500 °C in a kiln. About half of the CO₂ comes from the chemical breakdown of limestone (calcium carbonate) itself and about 40% from burning fuel to reach the temperature. Cement production is responsible for up to 8% of global CO₂ emissions.
Synthetic fertiliser. The Haber process makes ammonia for nitrogen fertiliser using hydrogen, most of which is made from natural gas. Ammonia production uses 1–2% of global energy and 3–5% of the world’s natural gas, and nearly half of the nitrogen in human bodies today originally came from the process.
Sources: Wikipedia, Green steel, Environmental impact of concrete and Haber process, citing industry and IEA data (2026).
Low-carbon alternatives exist but are not yet widespread: steel made with hydrogen instead of coal (tested in Sweden by the HYBRIT project), steel recycled from scrap in electric arc furnaces, cements that use less clinker, and ammonia made with hydrogen from renewable electricity. Each costs more today, so the shift depends on prices, regulation and investment as much as on technology.
Meeting future demand
Demand can be met sustainably only by changing how energy is produced and by reducing how much is consumed. On the production side, the main options are renewable sources, nuclear power and capturing carbon dioxide from fossil fuel plants. On the consumption side, the options are energy conservation (using less, for example by turning down heating) and energy efficiency (getting the same service from less energy, for example with LED lighting). Both sides are needed: growth in renewables since 2010 has been fast, but total demand has grown too.
Scale | Change | Main reasons |
|---|---|---|
Global | Fossil fuel use still rising slowly; renewables rising quickly | Population and income growth; falling costs of solar panels, wind turbines and batteries; climate policy after the Paris Agreement |
China | Largest energy user; coal still 57.8% of electricity in 2024, but wind and solar 18.2% | Rapid industrialisation; energy security; air pollution in cities; world-leading manufacture of solar panels |
India | Coal 74.5% of electricity in 2024; solar 7.0% and rising | Large domestic coal reserves; fast-growing demand; falling solar costs |
Germany | Renewables 58.6% of electricity in 2024; nuclear closed; total energy use falling | Political decision to leave nuclear power; feed-in tariffs; high prices encouraging efficiency |
Kenya | Over 90% renewable electricity, mainly geothermal and hydro | Rift Valley geology; no domestic coal or gas; expanding access to electricity |
Sources: Our World in Data, energy dataset (Ember and Energy Institute, 2025).
How sustainable are different energy sources?
No energy source is free of environmental cost. A fair comparison looks at the whole life of the source: extracting the fuel or the raw materials for the equipment, processing and transporting them, building the power station, operating it, and finally dismantling it, recycling the parts and restoring the land. Some sources do most of their damage during operation (burning coal), others mainly at the start (mining metals for solar panels) or at the end (storing radioactive waste).
The sustainability of a source can be judged by asking the same questions of each one:
How quickly is the resource used compared with how fast it is replaced?
How much greenhouse gas and other pollution does it release per unit of energy?
How much land, water and material does it need, and how safe is it for workers and the public?
Can the land and the equipment be restored or recycled at the end of their life?
Different sources score well on some of these questions and badly on others, so a judgement depends on which criteria are given most weight.
Comparing emissions and safety
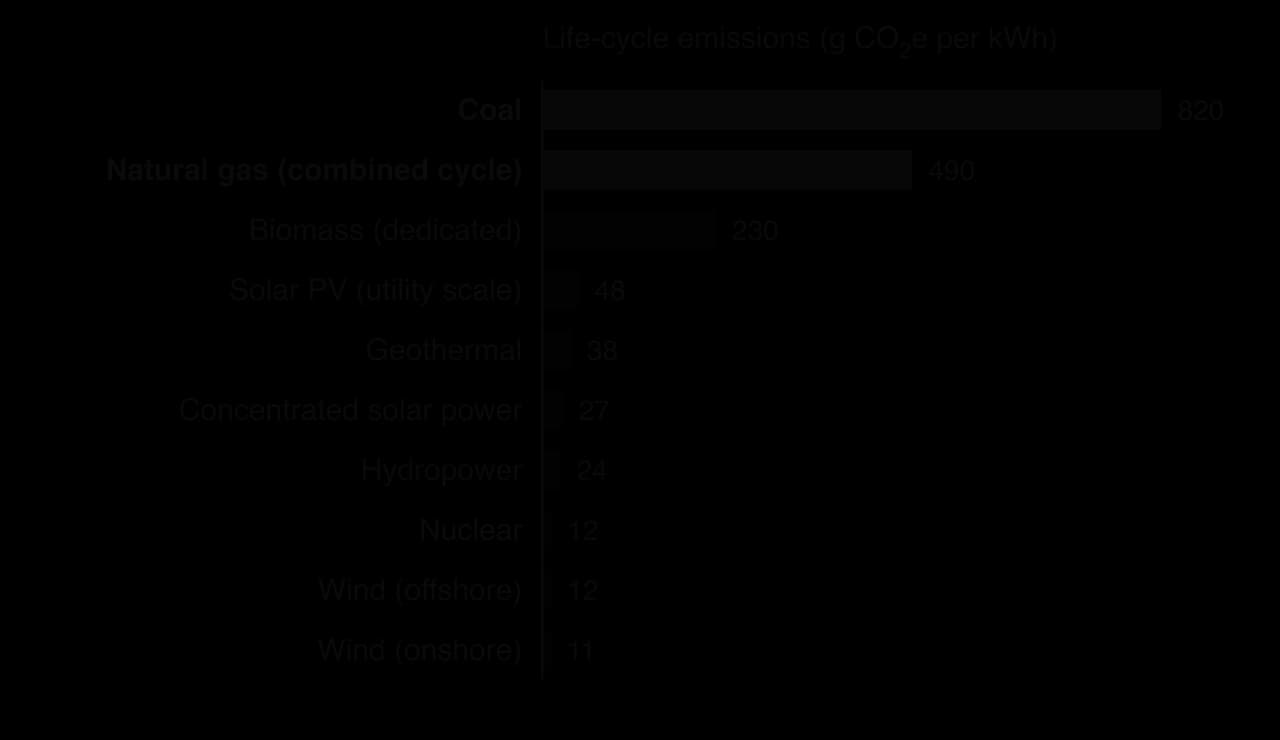
Life-cycle emissions include every stage, from mining to demolition, expressed in grams of CO₂-equivalent per kilowatt-hour of electricity. Coal emits about 820 g CO₂e kWh⁻¹ and gas about 490 g CO₂e kWh⁻¹, mainly from burning the fuel. Wind, nuclear, hydropower and solar power emit between 11 and 48 g CO₂e kWh⁻¹, almost all of it from making steel, concrete, glass and silicon for the equipment. Biomass sits in between, because growing, harvesting and transporting the fuel all use energy.
Source | Deaths per TWh of electricity | Main causes of death |
|---|---|---|
Brown coal (lignite) | 32.7 | Air pollution (particulates, sulfur dioxide), mining accidents |
Coal | 24.6 | Air pollution, mining accidents |
Oil | 18.4 | Air pollution, accidents |
Biomass | 4.6 | Air pollution from burning |
Gas | 2.8 | Air pollution, explosions |
Hydropower | 1.3 | Dam failures (mostly the Banqiao dam, China, 1975) |
Wind | 0.04 | Accidents during construction and maintenance |
Nuclear | 0.03 | Chernobyl and Fukushima, including evacuation |
Solar | 0.02 | Accidents during installation |
Sources: Our World in Data, “What are the safest and cleanest sources of energy?” (Markandya and Wilkinson, 2007; Sovacool et al., 2016; updated 2024).
The death rates show that the largest health cost of energy comes from ordinary air pollution from burning fossil fuels and biomass, not from rare disasters. They are estimates for European power stations, and the true rates for coal in countries with weaker pollution controls are probably several times higher. Accidents at nuclear plants and dams are rare but can affect very large areas and frighten the public, which strongly influences how people judge these sources.
The costs of fossil fuels
Fossil fuels cause harm at every stage. Extraction: coal is dug from open-pit mines that strip away whole landscapes, soils and villages, or from underground mines with risks of collapse, explosions and lung disease; oil and gas wells can leak and spill, and offshore drilling risks blowouts. Restoring mined land takes decades and is often incomplete.
Processing and transport: crude oil is a mixture that must be separated by fractional distillation in a refinery, which uses large amounts of energy and releases air pollutants. Natural gas is moved between continents as liquefied natural gas (LNG): it is cooled until it becomes a liquid that takes up about 1/600 of the volume of the gas. Liquefaction, shipping and turning the liquid back into gas use a considerable share of the energy in the gas, and leaks of methane, a powerful greenhouse gas, add to its climate impact.
Combustion: burning fossil fuels releases carbon dioxide, the main cause of the enhanced greenhouse effect, together with sulfur dioxide and nitrogen oxides that cause acid deposition and particulates that harm human lungs. Of all energy sources, fossil fuels have the highest life-cycle emissions and the highest death rates per unit of energy, and their reserves are finite.
The costs of nuclear fuel
Uranium is mined from open pits or underground, or dissolved out of the rock with chemicals pumped underground. Mining leaves large volumes of crushed rock (tailings) that are mildly radioactive and can release radon gas and contaminate water if they are not covered and contained. After mining, the uranium must be processed and enriched, which uses energy. Because a small mass of uranium releases a huge amount of energy, the land and material needed per unit of electricity are small, and life-cycle emissions are among the lowest of any source.
Rare earth elements and the metals of renewable technology
Rare earth elements are a group of 17 metals, including neodymium and dysprosium, that are used to make very strong permanent magnets. These magnets are found in many wind turbine generators (especially offshore turbines with direct-drive generators), in the electric motors of electric vehicles and in electronics. They are not especially rare in the Earth’s crust, but they are rarely found in concentrations worth mining, and separating them from one another needs large volumes of acids.
The Bayan Obo mining district in Inner Mongolia, China, holds the largest known deposits of rare earth elements and produced about 45% of the world’s rare earths in 2005. For every tonne of rare earth metals produced there, mining and processing release 9,600–12,000 m³ of waste gas containing hydrofluoric acid and sulfur dioxide, about 75 m³ of acidic wastewater and about a tonne of radioactive residue, much of it stored in tailings ponds. The low-carbon technologies that rely on these metals therefore move part of their environmental cost to mining regions far from where the electricity is used.
Sources: Wikipedia, Bayan Obo Mining District (2026).
The costs of solar, wind and tidal devices
Renewable devices have no fuel to mine, but they must be manufactured, transported, installed and eventually replaced. Solar panels are made of glass, aluminium frames, silicon cells, copper and silver contacts and small amounts of toxic materials such as lead. Purifying silicon requires very high temperatures, and much of the world’s silicon is refined in China using coal-fired electricity, which raises the panels’ life-cycle emissions.
Panels last 20–40 years. Annual solar panel waste was about 30,000 tonnes in 2021 and is projected to exceed 1 million tonnes by 2035 and 10 million tonnes by 2050. More than 80% of the mass of a silicon panel can be recovered, mostly the glass and aluminium frame, but the silver and silicon are harder to separate, and recycling is still more expensive than sending panels to landfill in many countries. European Union law requires manufacturers to make sure their panels are recycled.
Wind turbines last about 30 years, and their blades about 25. About 85% of a turbine’s material, mostly the steel tower and the copper and steel in the nacelle, is easily reused or recycled. The blades are the problem: they are made of glass or carbon fibre set in epoxy resin, a composite that cannot be melted down and remoulded. Old blades have been landfilled, ground up as fuel and raw material for cement kilns in Germany, and built into pedestrian bridges in Poland and Ireland; the turbine maker Vestas has developed a chemical process that separates the fibres from the resin so that both can be reused.
Large devices are also hard to build and transport. Turbine blades can be longer than 100 m and must travel on special trucks or ships; offshore turbines need large vessels, deep foundations and undersea cables. A tidal barrage is a dam across a whole estuary. The barrage at La Rance in Brittany, France, opened in 1966 with 240 MW of capacity and was the world’s largest tidal power station for 45 years, until South Korea’s 254 MW Sihwa Lake station opened in 2011. It changed the estuary: silt built up, sand-eels and plaice disappeared, and sea bass and cuttlefish later returned.
Sources: Wikipedia, Wind turbine, Solar panel and Rance Tidal Power Station (2026).
 YouTube
An overall evaluation
Source | Renewable? | Life-cycle emissions | Main environmental costs | Main advantages |
|---|---|---|---|---|
Coal | No | Very high | Mining scars, air pollution, acid deposition, highest death rate | Cheap where reserves are local; reliable; can follow demand |
Natural gas | No | High | Methane leaks, LNG energy losses, fracking impacts on water | Lower emissions than coal; flexible output; fast to start |
Nuclear | No (uranium is finite) | Very low | Uranium mining, radioactive waste, rare but severe accidents | Constant output; small land area; very low death rate |
Solar PV | Yes | Low | Mining and refining of silicon and metals, panel waste, land use | Falling cost; can be installed on roofs close to users |
Wind | Yes | Very low | Rare earths in some magnets, blade waste, bird and bat deaths, visual impact | Cheap electricity; quick to build; little land lost under turbines |
Hydropower | Yes | Low (high for some tropical reservoirs) | Flooded land, displaced people, blocked fish migration, trapped sediment | Reliable; can be stored in the reservoir; long life |
Tidal | Yes | Low | Changes to estuary ecosystems and sediment, high construction cost |
No single source is sustainable on every criterion. Fossil fuels are the least sustainable overall, because they combine finite reserves with the highest emissions and pollution. Solar, wind and nuclear power have much lower emissions and death rates, but each depends on mining and creates waste, and each has its own limits: solar and wind are variable, nuclear power is slow and expensive to build. Most energy plans therefore aim for a mix of low-carbon sources rather than relying on one.
Perspective | How it views energy choices | Typical preferred response |
|---|---|---|
Technocentric | Technology can solve the climate and resource problems if it is developed fast enough | New nuclear reactors, carbon capture, better batteries, eventually fusion |
Anthropocentric | Energy should be managed for long-term human well-being, balancing cost, jobs, health and the environment | A regulated mix of renewables and other low-carbon sources, carbon pricing, efficiency standards |
Ecocentric | Energy use itself drives the destruction of ecosystems; rich societies use too much | Lower consumption, small-scale local renewables, protecting land and rivers from new mines and dams |
Factors that shape a country’s energy choices
Every country has a different energy mix, and the differences are not accidental. A country’s choices reflect what resources it has, what it can afford, what its people and government value, and how far it trusts other countries to supply it.
Factor | What it means | Example of its influence |
|---|---|---|
Availability | Which fuels, rivers, winds, sunshine or geothermal heat the country has within its borders | Norway’s steep, wet mountains give it 88.8% hydroelectricity; Poland’s coalfields gave it 54.3% coal-fired electricity in 2024 |
Economic cost | The cost of building and running power stations and of buying fuel, and who pays | The cost of solar panels and wind turbines has fallen so far that they are now among the cheapest new sources in many countries |
Sustainability and emissions | How a source affects climate, resources and future generations; international commitments such as the Paris Agreement | Net-zero targets push countries to close coal plants |
Pollution | Air, water and land pollution, and its effects on health | Severe urban smog encouraged China to replace coal heating with gas and electricity |
Energy efficiency | How much useful energy each source delivers and how efficiently it is used | Combined heat and power stations use waste heat to warm homes |
Energy security | Whether supply is reliable and affordable, and how dependent the country is on imports | Japan, with almost no domestic fuels, imports most of its energy and has to balance nuclear risk against import dependence |
Public opinion and politics | Values, trust in technology, past disasters, the power of industries and regions | Germany closed its nuclear stations after public opposition grew following Fukushima |
Sources: Electricity shares: Ember and Energy Institute, via Our World in Data (2025).
These factors interact. A country with cheap domestic coal, such as Poland or South Africa, faces jobs and energy-security arguments for keeping it, health and climate arguments for closing it, and costs whichever way it chooses. Choices also change over time as technology, prices and values change: the fall in the cost of solar panels since 2010 has transformed the options open to sunny countries with no fossil fuels.
Two contrasting countries: Iceland and Saudi Arabia

Iceland
Iceland is a volcanic island on the Mid-Atlantic Ridge with heavy rainfall, glaciers and fast-flowing rivers. In 2024, 100% of its electricity came from renewable sources: 70.7% from hydropower and almost all of the rest from geothermal plants. Geothermal hot water also heats most buildings through district heating networks. The country has no coal, oil or gas of its own, so developing these local sources has also given it energy security.
Iceland’s energy use per person is among the highest in the world, about 160,000 kWh a year in 2024, because cheap renewable electricity has attracted energy-hungry industries such as aluminium smelting. Fossil fuels still supplied about 19.5% of its primary energy, almost all as oil for vehicles, ships, the fishing fleet and aircraft. Even a country with 100% renewable electricity therefore still depends on imported oil for transport.
Saudi Arabia
Saudi Arabia holds some of the largest oil reserves in the world and is one of the leading members of OPEC. In 2024, gas generated 63.3% of its electricity and oil 34.5%, and fossil fuels supplied 99.3% of its primary energy. Its hot desert climate means very high demand for air conditioning, and energy use per person, about 97,000 kWh a year, is several times the world average.
The same desert receives some of the strongest sunshine on Earth, yet solar power supplied only 1.8% of Saudi Arabia’s electricity in 2024. Abundant domestic oil and gas, low domestic fuel prices and an economy built on oil exports have made fossil fuels the obvious choice. Every barrel burned at home is a barrel not sold abroad, so the government has an economic reason to expand solar power, and large solar projects are being built.
Sources: Our World in Data, energy dataset (Ember and Energy Institute, 2025).
Factor | Iceland | Saudi Arabia |
|---|---|---|
Availability | Hydropower and geothermal heat; no fossil fuels | Very large oil and gas reserves; strong sunshine |
Economic cost | Very cheap renewable electricity once dams and wells are built | Very cheap domestic oil and gas; export income depends on oil |
Sustainability and pollution | Almost zero-carbon electricity; local impacts of dams on rivers and highlands | High emissions per person; air pollution |
Energy security | High for electricity; imports all its oil | High: self-sufficient, a major exporter |
Efficiency | Cheap power encourages high consumption by industry | Low fuel prices encourage high consumption |
Main future choices | Electrify transport and fishing fleet | Diversify into solar to save oil for export |
Other countries show other combinations. Costa Rica generated 99.9% of its electricity from renewable sources in 2024, mostly hydropower with geothermal and wind, using its mountains, rivers and volcanoes. France chose nuclear power after the oil crises of the 1970s, when it had little oil, gas or coal of its own, and generated 67.7% of its electricity from nuclear stations in 2024.
Intermittent renewables and energy storage
An electricity grid must match supply and demand every second. If demand is higher than supply, the frequency of the alternating current falls and, in the worst case, parts of the grid shut down to protect equipment; if supply is higher, the frequency rises. Coal, gas, nuclear and hydroelectric stations can be scheduled to run when they are needed. Wind and solar power cannot: they generate only when the wind blows or the sun shines.
Intermittency works on several timescales. Solar output follows a daily cycle, falls to zero at night and is lower in winter and on cloudy days. Wind output can change within minutes and can stay low for days during calm, settled weather. Tidal power is variable too, but its changes can be predicted years in advance from the movements of the Moon.
Demand also varies. In many countries it is lowest at night, rises in the morning and reaches a peak in the early evening, when people return home, cook, light their homes and switch on heating or air conditioning, just as solar output is falling. The highest peaks have traditionally been met by gas turbines and hydroelectric stations that can start quickly, often burning fossil fuels for only a few hours a day.
Peak shaving
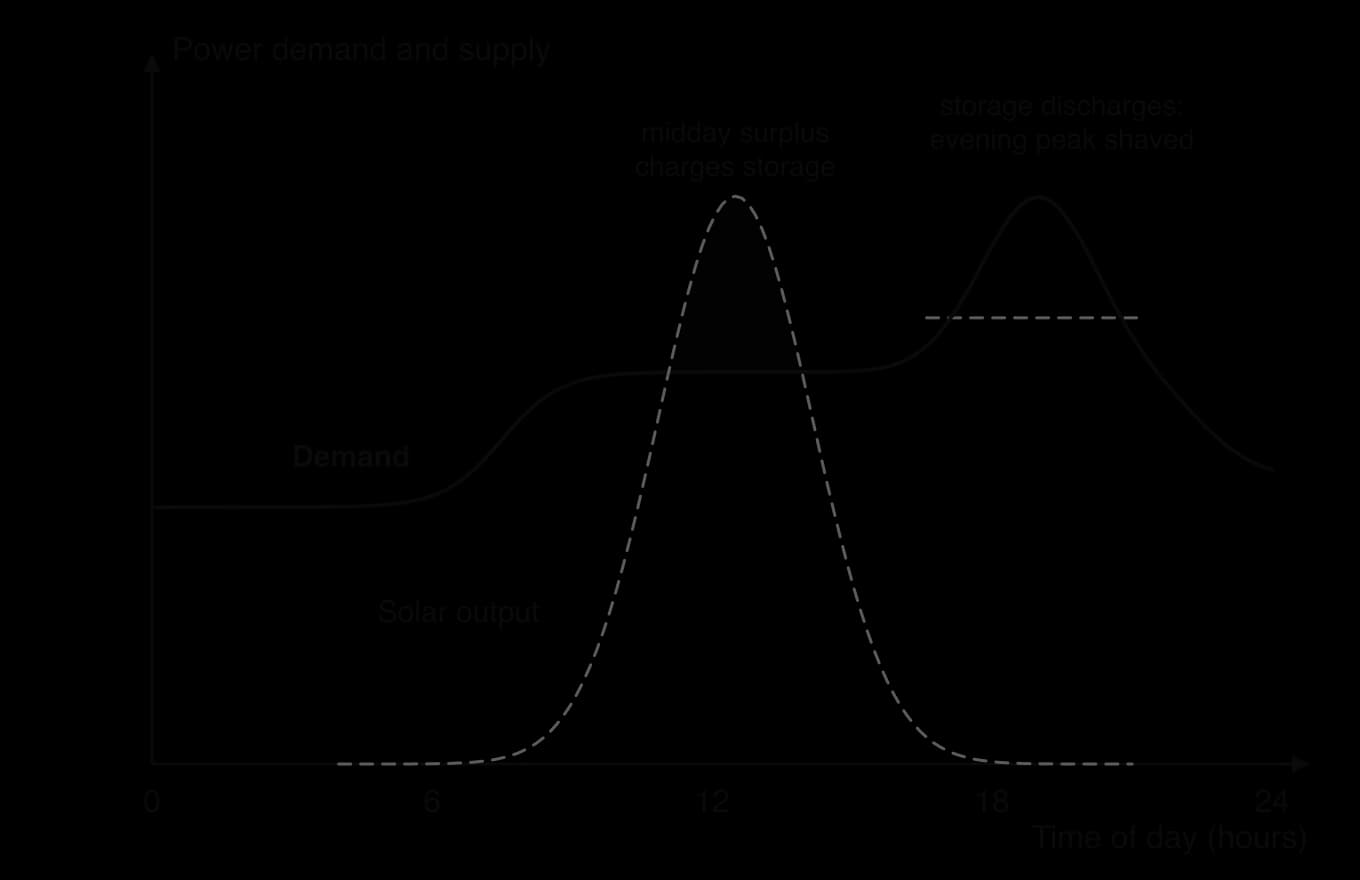
Energy storage solves both problems by moving electricity in time: it is charged when supply is greater than demand and discharged when demand is greater than supply. Using storage to cut the highest points of demand is known as peak shaving. In the model, surplus solar power at midday charges the store, and the store discharges in the evening, so the grid never has to supply the full evening peak from power stations.
Peak shaving brings several benefits. Fewer fossil-fuel “peaker” plants are needed; surplus renewable electricity is used instead of wasted when turbines would otherwise be switched off; and the grid can be built for a lower maximum load. Demand can also be shifted directly, for example with lower prices at night that encourage people to charge electric cars or run washing machines then.
Types of energy storage
Type | How it stores energy | Typical use | Strengths | Limitations |
|---|---|---|---|---|
Battery storage (mostly lithium-ion) | Chemical energy in cells | Seconds to a few hours; stabilising grid frequency; storing solar for the evening | Very fast response; can be built almost anywhere; falling cost | Short duration; mining of lithium and other metals; limited lifetime; fire risk |
Pumped hydroelectric storage | Gravitational potential energy of water pumped uphill | Several hours; daily peaks | Large capacity; long life; about three-quarters of the energy recovered | Needs two reservoirs at different heights; large construction; flooded land |
Fuel cells with hydrogen | Electricity splits water into hydrogen and oxygen (electrolysis); hydrogen is stored and later combined with oxygen in a fuel cell | Days to seasons; heavy transport and industry | Can store energy for long periods and large amounts | Large energy losses in conversion; hydrogen is hard to store and transport; expensive |
Thermal storage | Heat stored in molten salt, water or rocks | Hours; concentrated solar power, district heating | Cheap materials; works well with solar heat | Heat is gradually lost; best for heat, less efficient for electricity |
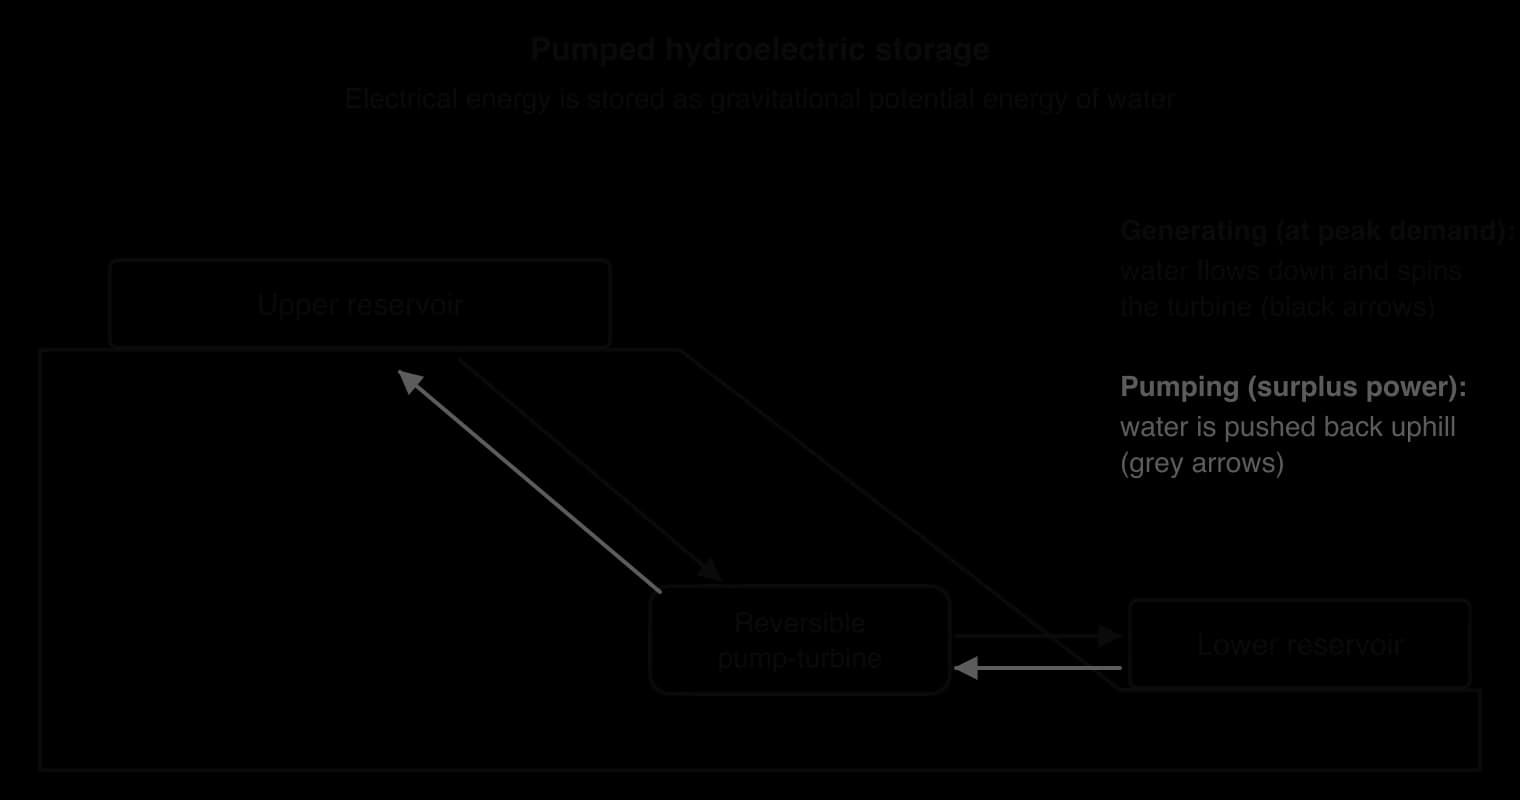
Pumped hydroelectric storage is the oldest and largest form of grid storage. Its reversible pump-turbines act as pumps when spare electricity is cheap and as turbines when it is needed. Some energy is lost in each direction through friction and heat, so the electricity recovered is less than the electricity used to pump the water up.
Batteries and fuel cells are both electrochemical, but they work differently. A battery stores its chemicals inside the cell and is recharged by reversing the reaction. A fuel cell is supplied with fuel from a separate tank, so the amount of energy it can deliver depends on the size of the tank, which makes hydrogen attractive for storing energy over weeks or seasons. At present, most hydrogen is made from natural gas, not by electrolysis, so it is low-carbon only when renewable electricity is used to make it.
Concentrated solar power plants can store heat directly. At the Noor Ouarzazate complex in southern Morocco, mirrors heat a fluid that is used to melt salt, and the hot molten salt is kept in insulated tanks. Noor I can keep generating for 3 hours after sunset, and Noor II and Noor III for 7 hours each, so the plant supplies electricity into the evening peak.
Sources: Wikipedia, Ouarzazate Solar Power Station (2026).
Two storage examples
Dinorwig pumped storage, Wales
The Dinorwig power station in Snowdonia, north Wales, opened in 1984 inside the mountain Elidir Fawr. Water is pumped from the lower reservoir, Llyn Peris, at about 100 m above sea level, to Marchlyn Mawr at 636 m. Its six turbines can supply up to about 1,800 MW, enough to meet a sudden surge in demand, and with all six units already spinning it can go from zero to full output in about 16 seconds. It stores about 9.1 GWh, enough to run at full power for up to six hours, and recovers about 74–76% of the energy used for pumping.
Dinorwig was built to support the inflexible coal and nuclear stations of the 1980s, but it now helps balance wind power. Its main role is short bursts: meeting peaks such as the moment millions of people switch on kettles at once during a break in a popular television programme, and keeping the grid frequency stable when a power station fails.
Sources: Wikipedia, Dinorwig Power Station (2026).
Hornsdale Power Reserve, South Australia
South Australia gets much of its electricity from wind and solar power. After storms caused a statewide blackout in September 2016, the state looked for ways to make its grid more stable, and the Hornsdale Power Reserve, a lithium-ion battery built by Tesla beside the Hornsdale wind farm, was connected to the grid on 1 December 2017 with 100 MW and 129 MWh; an expansion in 2020 raised it to 150 MW and 193.5 MWh.
On 14 December 2017, when a unit at the Loy Yang coal power station in Victoria suddenly tripped, the battery injected 7.3 MW to steady the grid frequency before the coal-fired Gladstone power station could respond.
The battery stores far less energy than Dinorwig and can discharge for only about an hour at full power, but it responds faster than any power station. It cut the price of the services that keep the grid’s frequency stable in South Australia by about 91%, from about A$470 to A$40 per MWh. Grid batteries like this are mainly used to stabilise frequency and shave short peaks, while longer storage still relies on pumped hydro and, in future, possibly hydrogen.
Sources: Wikipedia, Hornsdale Power Reserve (2026).
 YouTube
Energy conservation and energy efficiency
Reducing demand is often the cheapest way to cut the environmental costs of energy. It lowers emissions and pollution, delays the depletion of fossil fuels, saves money and, for a country that imports fuel, reduces its dependence on other countries. There are two ways to reduce demand, and they are easily confused.
Energy conservation means doing less of something that uses energy. It depends on choices made by people, households, businesses and governments, and it usually costs little or nothing, though it may mean some loss of comfort or convenience.
Energy efficiency means doing the same thing with less energy. It depends on technology and design and usually needs investment at the start, which is repaid by lower energy bills over time. Efficiency is the ratio of useful energy output to total energy input, so an efficient device wastes less energy as heat.
Energy conservation | Energy efficiency | |
|---|---|---|
What changes | Behaviour: less of the service is used | Technology: the same service uses less energy |
Examples | Turning lights off; setting thermostats lower in winter and higher in summer; walking, cycling or taking public transport; flying less | LED bulbs; insulated, airtight buildings; heat pumps; efficient car engines and electric vehicles; ships with sails |
Cost | Usually free; may reduce comfort | Investment needed at the start; saves money later |
Persistence | Can be reversed when habits change | Lasts as long as the equipment or building |
Efficiency in buildings, lighting, transport and goods
Buildings use a large share of the energy of most countries for heating, cooling and lighting. Thick insulation, airtight walls, triple-glazed windows and heat-recovery ventilation can keep a house warm with very little heating, while in hot climates shading, light-coloured roofs, thick walls and natural ventilation remove heat without air conditioning. Traditional buildings in many hot regions, such as the wind towers of Iran and the Gulf, used these principles long before electric cooling.
Lighting has become far more efficient. An old incandescent bulb turns most of its electricity into heat rather than light. A light-emitting diode (LED) gives the same light from a fraction of the power and lasts many times longer, and “intelligent” lighting systems use sensors to dim or switch off lights in empty rooms. Many countries, including the European Union members, have phased out sales of incandescent bulbs through efficiency standards.
Transport gains from more efficient engines, lighter vehicles and electric motors, which turn a much larger share of their energy into motion than petrol or diesel engines. Cargo ships, which burn heavy fuel oil, are being fitted with modern sails and rotor sails that use the wind to reduce fuel use. Goods can be designed to last longer and to be repaired and recycled, part of the circular economy; because recycled aluminium needs only about 5% of the energy needed to make new aluminium from ore, designing products for recycling also saves energy.
Conservation through behaviour: Cool Biz in Japan
In 2005, Japan’s Ministry of the Environment launched the Cool Biz campaign, which asked offices to set air conditioning no lower than 28 °C in summer and allowed workers to drop suits and ties. In its first year, 95.8% of people surveyed knew of the campaign, and the ministry estimated that it cut emissions by about 460,000 tonnes of CO₂; the estimate for 2006 was 1.14 million tonnes.
After the earthquake and tsunami of March 2011 led to the shutdown of most of Japan’s nuclear power stations, the government launched Super Cool Biz to avoid power cuts: it again recommended 28 °C, asked people to switch off unused computers and to start work earlier in the day, and allowed polo shirts and trainers in offices. Japan imports almost all of its fossil fuels, so every unit of electricity saved reduced the gas and oil it had to buy from abroad. Japan’s total primary energy consumption fell by about 22% between 2008 and 2024, through a combination of conservation, efficiency and a declining, ageing population.
Sources: Wikipedia, Cool Biz campaign (2026); Our World in Data, energy dataset (2025).
How effective are conservation and efficiency?
Both approaches reduce demand, but their effects are hard to measure and often smaller than expected. Conservation campaigns rely on voluntary action: in a 2009 survey, 91.8% of Japanese respondents knew of Cool Biz but only 57% practised it. Efficiency improvements can be partly cancelled by the rebound effect: when a device becomes cheaper to run, people may use it more, for example driving further in a fuel-efficient car or lighting gardens because LEDs are cheap to run.
Germany set a target in 2010 to cut primary energy consumption by 20% between 2008 and 2020. Consumption fell from about 3,930 TWh to 3,500 TWh, a fall of 11%, so the target was missed, even though the energy used per unit of GDP fell by about 22% over the same period. The economy grew while each unit of output needed less energy, so efficiency gains were partly absorbed by growth. Efficiency therefore works best when it is combined with conservation and with policies such as building standards, energy labels and energy prices that reflect environmental costs.
Sources: Wikipedia, Energiewende (2026); Our World in Data, energy dataset (2025).
Case study: Germany’s Energiewende
Context
Germany is Europe’s largest economy and one of its largest energy users, with about 84 million people and heavy industries such as steel, chemicals and car manufacturing. In 2000 its electricity came mainly from coal, much of it lignite (brown coal) dug from huge open-pit mines in the Rhineland and Lusatia, and from nuclear power, which supplied 29.8%. Germany has little oil or gas of its own and imported most of what it used.
The Energiewende (“energy transition”) is the long-term policy of moving Germany to an energy system based on renewable sources and greater efficiency, while also leaving nuclear power. It combines two goals that pull in different directions: cutting greenhouse gas emissions and phasing out a low-carbon source that many Germans regard as dangerous. Opposition to nuclear power has deep roots in Germany, strengthened by the Chernobyl disaster of 1986, which spread radioactive fallout across parts of the country.
What happened
2000: the Renewable Energy Sources Act (EEG) guaranteed producers of renewable electricity a fixed feed-in tariff for 20 years, paid for by a surcharge on electricity bills. Households, farmers and cooperatives installed solar panels and wind turbines in large numbers.
2010: a long-term energy plan set targets for emissions, renewables and efficiency, and allowed nuclear stations to run for longer as a “bridging technology”.
2011: after the Fukushima Daiichi accident in Japan in March, the government reversed this decision on 6 June 2011 and decided to close all nuclear power stations. Eight of its seventeen reactors closed permanently that year.
2014: a revised EEG replaced fixed tariffs with auctions, in which producers compete to offer the lowest price.
2019: a coal commission voted 27 to 1 to close all coal power stations by 2038 at the latest.
2022: after Russia’s invasion of Ukraine, Russian gas supplies were cut. Germany restarted 10 GW of coal capacity to save gas and approved the expansion of a lignite mine at the village of Lützerath as “necessary for energy security”.
15 April 2023: the last three nuclear power stations, Emsland, Isar II and Neckarwestheim II, were shut down.
Data
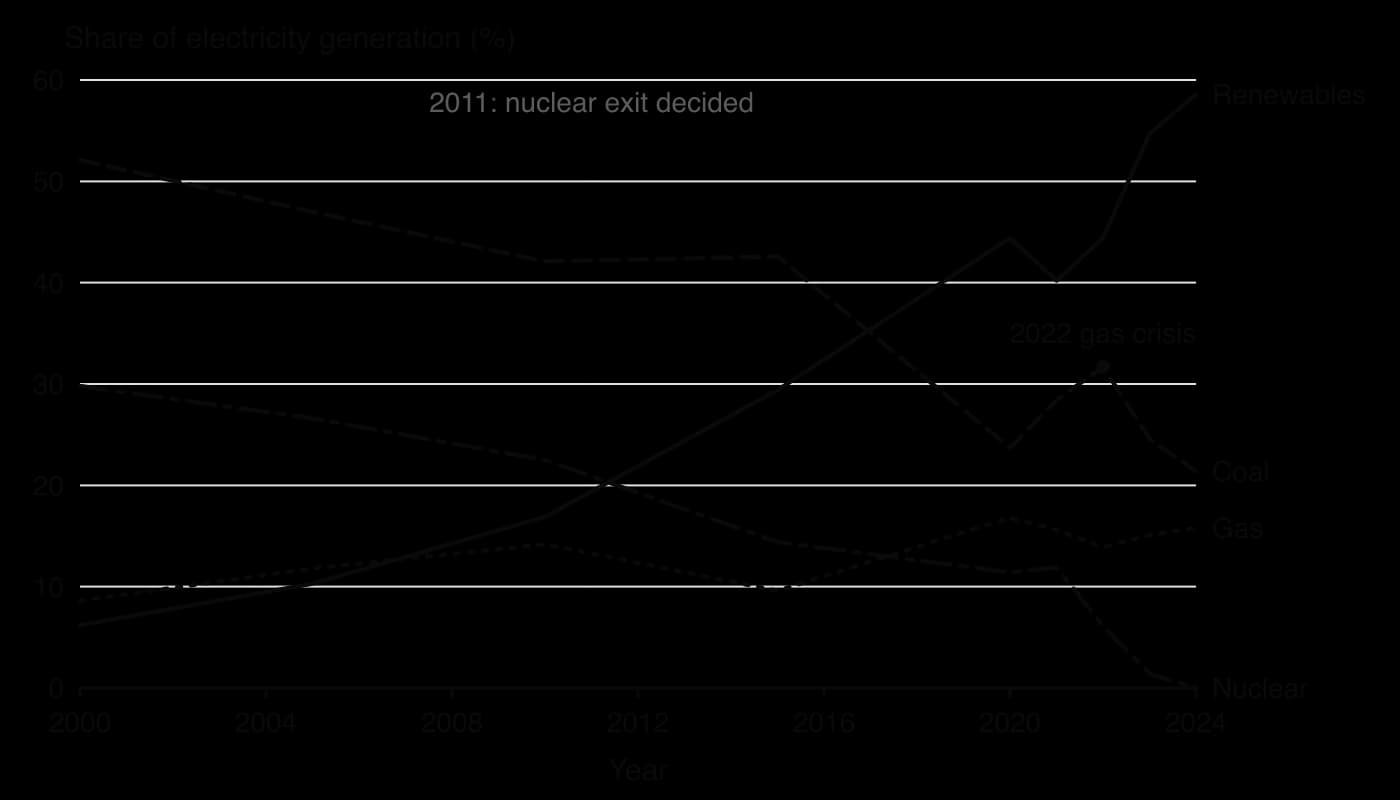
Between 2000 and 2024, the share of Germany’s electricity from renewables rose from 6.2% to 58.6%, led by wind (28.5% in 2024) and solar (14.9%). Nuclear fell from 29.8% to zero, and coal from 52.1% to 21.4%. The carbon intensity of German electricity fell from 573 g CO₂ kWh⁻¹ in 2000 to 336 g CO₂ kWh⁻¹ in 2024. Over the same years, France, which kept its nuclear stations, produced electricity at between 40 and 86 g CO₂ kWh⁻¹, reaching 40 g CO₂ kWh⁻¹ in 2024.
Germany | France | |
|---|---|---|
Renewables share of electricity | 58.6% | 27.2% |
Nuclear share of electricity | 0% | 67.7% |
Coal share of electricity | 21.4% | 0.2% |
Carbon intensity of electricity (g CO₂ kWh⁻¹) | 336 | 40 |
Fossil fuels as share of primary energy | 76.0% | 46.1% |
Sources: Our World in Data, energy dataset (Ember and Energy Institute, 2025), values for 2024.
Total electricity generation in Germany fell from 624 TWh in 2010 to 496 TWh in 2024, partly because of efficiency and partly because industry reduced output when energy prices rose. Germany, a net exporter of electricity for most of the 2010s, imported more electricity than it exported in 2023 and 2024.
Management and responses
The Energiewende was driven by government law and paid for mainly by electricity consumers. The feed-in tariff made small-scale renewable energy profitable and spread ownership of solar panels and turbines widely. The surcharge that paid for it reached 6.35 cents per kWh in 2016, about 22% of the price of electricity. German households paid the highest electricity prices in Europe in 2013, and a 2021 audit found prices 43% above the EU average. To protect competitiveness, rates for industry were largely frozen, so households carried more of the cost.
Electricity grids lagged behind. Most wind power is generated in the windy north, while much of the demand is in the industrial south and west, so new high-voltage lines are needed; a 2024 audit found grid expansion about 6,000 km and seven years behind schedule. Coal regions such as Lusatia, where lignite mining supports many jobs, have received structural support to replace the industry, and one Lusatian regional group voted against the 2038 coal exit date.
Evaluation
Stakeholder | View of the Energiewende |
|---|---|
Environmental groups and the Greens | Strong support for renewables and the nuclear exit, shaped by Chernobyl and Fukushima; opposed to new lignite mining such as Lützerath |
Climate scientists and many economists | Support for renewables, but many argued that coal should have closed before nuclear power; a 2021 open letter estimated that the nuclear exit would add about 60 million tonnes of CO₂ a year |
Households | Gained from owning solar panels and turbines; paid among the highest electricity prices in Europe |
Industry | Concern about high and uncertain prices and international competitiveness; partly protected by exemptions |
Coal regions (Lusatia, Rhineland) | Loss of jobs and identity; villages demolished for lignite mines; dependence on support funds |
The transition succeeded in some ways and fell short in others. Renewable electricity grew faster than almost anyone predicted in 2000, and emissions from electricity fell. On the other hand, closing nuclear power before coal kept carbon intensity far above that of France; one 2024 study estimated that keeping nuclear power could have cut emissions from electricity by 73% between 2002 and 2022, instead of the 25% achieved. Another study estimated that closing coal first would have avoided about 1,100 deaths from air pollution.
Seen through different environmental value systems, the policy looks different. An ecocentric view stresses the nuclear risk and the destruction of landscapes and villages by lignite mining, and supports renewable energy owned by communities. A technocentric view regrets closing working low-carbon reactors and favours new technology, including storage and grid expansion. An anthropocentric view weighs the costs to households and industry against the long-term benefits of a secure, low-carbon system.
What it shows
The Energiewende shows that a country’s energy choices are shaped by public values and politics as much as by resources or cost: Germany and France, neighbours with similar economies, made opposite decisions about nuclear power. It shows that renewable sources are not free of costs, because they need grids, storage and backup, and that phasing out one low-carbon source can slow the phasing out of fossil fuels. It also shows that rapid change is possible when policy gives investors long-term certainty.
Sources: Our World in Data, energy dataset (2025); Wikipedia, Energiewende and Energy in Germany (2026).
Energy security (HL only)
A society is secure in energy when people and businesses can obtain the energy they need, when they need it, at a price they can afford. Energy security is one part of the wider idea of resource security, and it has become a central concern of governments since the oil shocks of the 1970s and, more recently, the gas crisis that followed Russia’s invasion of Ukraine in 2022.
Energy security has several dimensions. Availability asks whether enough energy exists, at home or from trading partners. Reliability asks whether supply can be interrupted by war, political pressure, accidents, extreme weather or a calm, dark week for wind and solar power. Affordability asks whether households and industry can pay for it, including during price spikes. A country can be secure in one dimension and insecure in another: a country that imports cheap gas from a single supplier may be secure in price but insecure in reliability.
Energy insecurity has serious consequences. Price spikes push households into energy poverty, where they cannot afford to heat their homes or cook, and they make industry less competitive. Interruptions can cause power cuts that close hospitals, schools and factories. In low-income countries, unreliable electricity holds back development, and families that cannot afford modern fuels cut firewood faster than forests can regrow.
How countries improve energy security
Improving efficiency and conservation: using less energy for the same output reduces the amount that must be secured at all, especially imports.
Reducing reliance on imports: developing domestic resources, whether renewable (wind, solar, geothermal, hydro), nuclear or fossil (domestic coal, shale gas). Renewable flows cannot be cut off by another country, which gives them a security advantage as well as a climate advantage.
Diversification: buying from many suppliers and using many sources, so that a failure of one can be covered by the others. This includes new pipelines and LNG import terminals, interconnectors to neighbouring grids, and strategic reserves of oil and gas.
Storage and flexibility: gas storage, oil stockpiles, batteries and pumped storage give a buffer against short-term disruption.
These strategies can conflict with other goals. Reopening coal mines improves security for a coal-rich country but increases emissions; building LNG terminals diversifies supply but locks in fossil-fuel infrastructure for decades; and a rapid shift to wind and solar reduces fuel imports but increases dependence on imported panels, turbines and battery minerals, most of which are processed in China.
Germany’s gas crisis, 2022
Before 2022, Russia supplied about half of Germany’s natural gas imports, a third of its heating oil and half of its coal imports. Gas arrived cheaply through pipelines, including Nord Stream 1 under the Baltic Sea, and successive governments had treated trade as a source of stability. Germany had no LNG import terminal of its own.
After Russia invaded Ukraine in February 2022, Gazprom cut flows through Nord Stream 1 to 40% of capacity on 16 June 2022, closed the pipeline for maintenance in July and stopped flows completely on 2 September; on 26 September explosions ruptured the pipelines. European gas prices rose above €200 per MWh during 2022.
Germany responded by restarting 10 GW of coal-fired capacity to save gas, filling gas storage early, asking households and businesses to cut use, and building floating LNG import terminals at Wilhelmshaven and Lubmin, supplied by ships from Norway, the United States and the Middle East. By 2025, Norway had become Germany’s largest supplier of gas, and LNG terminals provided 10.3% of its gas imports.
The crisis showed both the risk of depending on one supplier and the security value of renewable electricity, which kept generating regardless of gas prices. It also showed the trade-offs: Germany’s coal share of electricity rose from 28.4% in 2021 to 31.7% in 2022 before falling again. In 2025, imports still covered 65.6% of Germany’s energy needs, including 89% of its gas, so diversification reduced the risk without ending dependence on imports.
Sources: Wikipedia, Energy in Germany, Energiewende and 2022–2023 Russia–European Union gas dispute (2026); Our World in Data, energy dataset (2025).
How long will fossil fuels last? (HL only)
Coal, oil and natural gas formed over millions of years from buried organic matter, so the amount in the Earth’s crust is fixed on any human timescale. Yet the question “when will they run out?” has no simple answer, because the amount that counts as available depends on knowledge, technology and price as well as geology.
Proven reserves are only a small part of the total resource, which includes deposits that are known but too costly to extract and deposits not yet discovered. When prices rise or technology improves, some of the resource becomes reserve; when prices fall, reserves can shrink without any fuel being used. A common measure of how long reserves would last is the reserves-to-production (R/P) ratio: the number of years the proven reserves would last if production stayed at the current rate.
Fuel | R/P ratio, end of 2015 (years) | R/P ratio, end of 2020 (years) |
|---|---|---|
Oil | 51 | 53.5 |
Natural gas | 53 | 48.8 |
Coal | 114 | not available |
Sources: BP Statistical Review of World Energy (2016 and 2021, the last edition to publish world reserves), via Wikipedia, Reserves-to-production ratio (2026) and Statista (2021).
The table shows that, after five more years of heavy use, the R/P ratio for oil was slightly higher in 2020 than in 2015. New reserves were added at least as fast as oil was produced, so the ratio did not fall. An R/P ratio is a snapshot of present knowledge and prices, not a forecast.
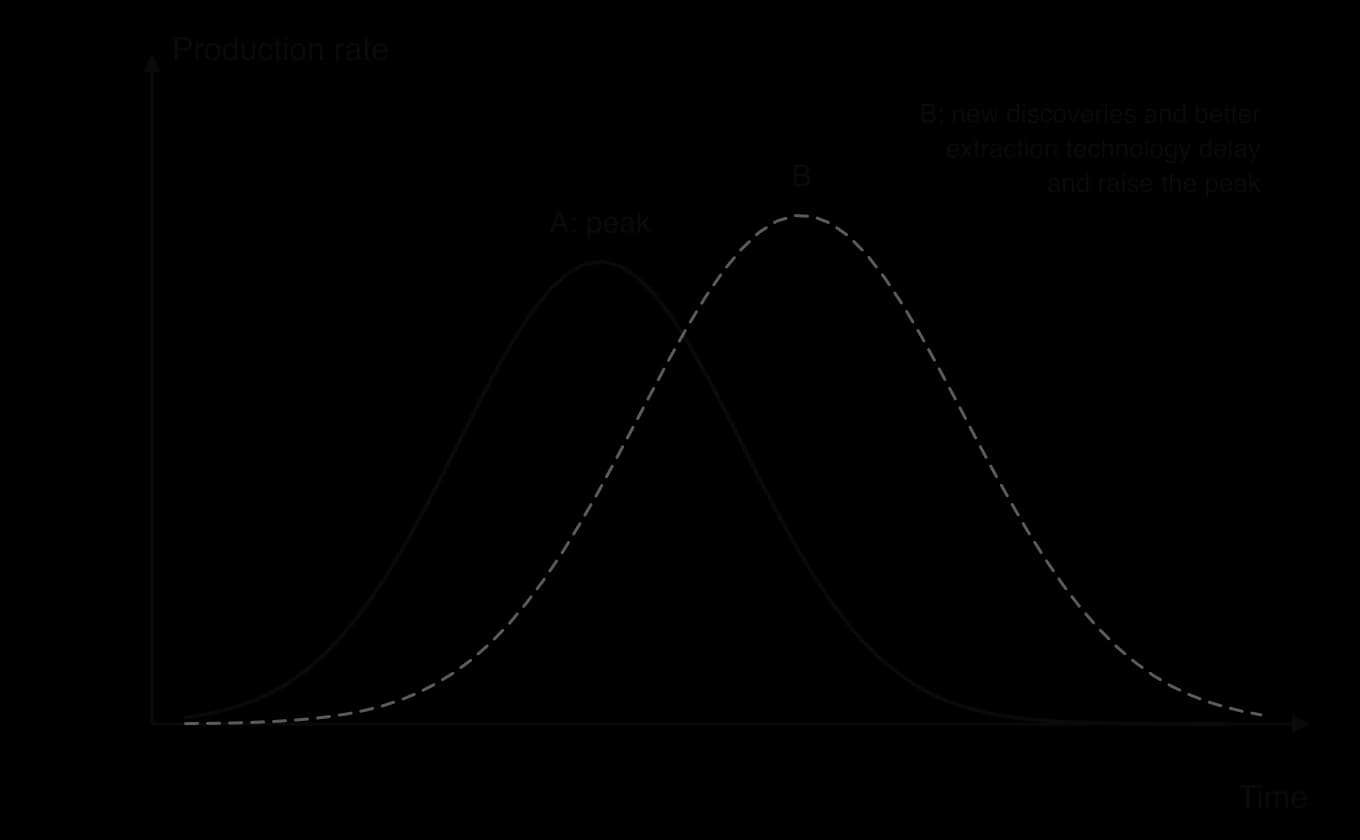
Factors that affect the timeline to depletion
Rate of consumption: if consumption grows each year, reserves last much less time than the R/P ratio suggests; if demand falls, they last longer. Population growth and rising incomes push consumption up.
New discoveries: exploration finds new deposits, for example in deep water off Brazil and Guyana, which adds to reserves.
Extraction technology: horizontal drilling and hydraulic fracturing (fracking) unlocked oil and gas from shale rock in the United States after about 2008, turning deposits that were known but uneconomic into reserves.
Price: higher prices make costly deposits, such as the oil sands of Alberta, Canada, worth extracting, so reserves grow; lower prices can shrink them.
Increased use of renewables and nuclear power: replacing fossil fuels lowers demand, so reserves last longer. Climate policy may mean that much of today’s reserves are never burned at all.
Nuclear power (HL only)
Nuclear power stations produce about 9% of the world’s electricity, and in 2024 they supplied 67.7% of France’s electricity and 17.8% of that of the United States. Nuclear power is the subject of one of the sharpest disagreements in energy policy: some see it as an essential low-carbon source, others as an unacceptable risk.
How nuclear fission produces heat
Almost all nuclear power stations use nuclear fission. Uranium-235 is an unstable isotope: when its nucleus absorbs a slow-moving neutron, it splits into two smaller nuclei (fission products), releases a large amount of energy as heat and emits two or three more neutrons. These neutrons can split further uranium nuclei, setting up a chain reaction. Plutonium-239, which forms in reactor fuel, can undergo fission in the same way.
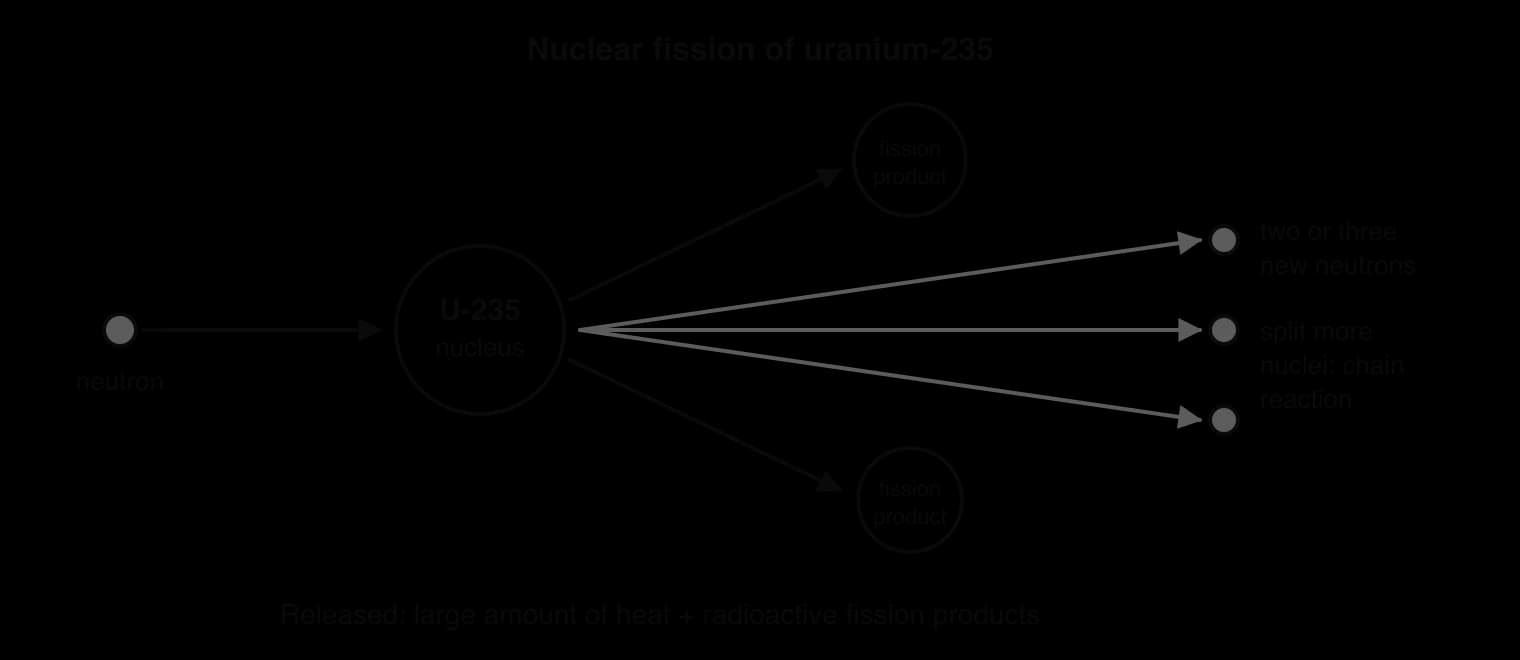
In a reactor, the uranium is formed into pellets inside metal fuel rods. A moderator, usually water or graphite, slows the neutrons so that they are more likely to cause fission, and control rods made of neutron-absorbing materials are raised or lowered to keep the reaction steady. A coolant carries the heat away to make steam, which drives turbines in the same way as in a coal-fired station. The reaction releases no carbon dioxide, and one kilogram of uranium fuel releases far more energy than a kilogram of coal.
Advantages of nuclear power
Low carbon: life-cycle emissions of about 12 g CO₂e kWh⁻¹, similar to wind and far below coal (820) and gas (490).
Constant, reliable output: a reactor runs day and night in all weather, so it can supply the steady base load that wind and solar cannot guarantee without storage.
Low running costs: once built, a station needs little fuel by mass and runs for 40–60 years.
Small land area per unit of electricity, and a very low death rate per unit of energy, about 0.03 deaths per TWh including Chernobyl and Fukushima.
Energy security: uranium can be bought from many countries (including Australia, Canada and Kazakhstan) and stored for years, so a country is less exposed to sudden fuel cut-offs.
Disadvantages of nuclear power
High construction costs and long build times. New nuclear stations are among the most expensive power stations to build, and many recent projects in Europe and the United States have run years late and far over budget. Because the cost is paid before any electricity is sold, nuclear power needs long-term government support or guaranteed prices.
Uranium mining and processing. Mining leaves radioactive tailings and can contaminate water with radon, uranium and heavy metals. Many uranium mines are on Indigenous land, for example in Australia and on the Navajo Nation in the south-western United States, raising questions of environmental justice.
Thermal pollution. Like coal and gas stations, nuclear stations use large volumes of river or sea water for cooling and return it several degrees warmer. Warmer water holds less dissolved oxygen and changes the chemistry and the species living near the outlet, an example of thermal pollution. During heatwaves, stations on rivers may have to cut output because the river is already too warm.
Accident risk. Although accidents are rare, a major accident can release radioactive material over a wide area, force long-term evacuation and destroy public trust. Two accidents have been rated at level 7, the highest on the International Nuclear Event Scale:
Chernobyl, Ukraine (then the Soviet Union), 1986: an explosion and fire destroyed reactor 4 and spread radioactive fallout across Europe. About 91,200 people were evacuated, and an exclusion zone of about 2,600 km² around the plant remains closed to permanent settlement. Long-lived isotopes such as caesium-137, with a half-life of about 30 years, still contaminate soils. Wolves, wild boar, moose and beavers have multiplied in the absence of people, but studies have found fewer animals and more deformities in the most contaminated areas.
Fukushima Daiichi, Japan, 2011: a magnitude 9.0 earthquake and a tsunami up to 13–14 m high cut power to the cooling systems, and three reactors melted down. At least 164,000 people were displaced and over 41,000 were still evacuees ten years later. The UN scientific committee on radiation has documented no adverse health effects directly caused by the radiation, but 51 deaths, mostly of elderly hospital and care-home patients, are attributed to the evacuation itself. Clean-up and compensation were estimated in 2016 at about 20 trillion yen (about US$180 billion).
Sources: Wikipedia, Chernobyl Exclusion Zone and Fukushima nuclear accident (2026); Our World in Data (2024).
Radioactive waste
Spent fuel from a reactor contains highly radioactive fission products and plutonium. Its radioactivity falls over time according to the half-life of each isotope, the time taken for half of the radioactive nuclei in a sample to decay. Some isotopes in spent fuel have half-lives of tens of thousands of years, so radioactive waste must be kept isolated for far longer than any human institution has existed. It is first cooled for years in water pools at the power station, then stored in thick steel and concrete containers that shield the radiation.
The long-term solution favoured by most countries is a deep geological repository. Finland has built the first, Onkalo, at Olkiluoto near Eurajoki on its west coast, with tunnels reaching about 520 m deep in granite bedrock. Spent fuel is sealed in a steel canister inside a copper capsule, placed in its own hole and surrounded by bentonite clay, which swells when wet and blocks the movement of water. A trial run with empty canisters took place in August 2024, and the disposal of spent fuel was scheduled to start in 2026. The repository is planned to receive waste for about 100 years and then be sealed.
Sources: Wikipedia, Onkalo spent nuclear fuel repository (2026).
Repositories raise questions of intergenerational justice. People living thousands of years from now will receive none of the electricity but may bear the risk, and they may not understand warning signs left today. Supporters reply that the waste is small in volume, well contained and better monitored than the carbon dioxide and air pollution from fossil fuels, which are released into the environment with no containment at all.
Perspective | Judgement of nuclear power |
|---|---|
Technocentric | A proven low-carbon technology that can be made safer with new reactor designs; waste is a solvable engineering problem |
Anthropocentric | Useful for reliable low-carbon electricity if risks are tightly regulated and costs are controlled; weigh against cheaper renewables plus storage |
Ecocentric | Unacceptable long-term risk to ecosystems and future generations from accidents and waste; prefers reduced consumption and renewables |
Large-scale battery storage and the minerals behind it (HL only)
Cutting emissions requires very large amounts of battery storage, both in electric vehicles and in grid-scale systems such as the Hornsdale Power Reserve. Most of these batteries are lithium-ion. Their electrodes contain lithium together with other metals and their oxides, such as cobalt, nickel, manganese, iron and graphite, and the motors and generators they work with often contain rare earth elements. Every stage of the supply chain, from the mine to the factory, uses energy, releases emissions and causes pollution.
Lithium from the Salar de Atacama
Lithium is extracted in two main ways: from hard rock (the mineral spodumene, mined mainly in Australia) and from salty brines beneath the salt flats of the “lithium triangle” of Chile, Argentina and Bolivia. The Salar de Atacama in northern Chile is the world’s largest and purest active source of lithium and supplied about 36% of the world’s lithium carbonate in 2017. The brine contains about 2,700 parts per million of lithium.
Brine is pumped from beneath the salt flat into large shallow ponds, where the hot sun evaporates the water over 12–18 months until the brine contains about 6% lithium. Evaporation is very effective in one of the driest places on Earth, with less than 30 mm of rain a year and about 3,500 mm of potential evaporation, but the same dryness makes water extremely scarce. Pumping brine and freshwater from beneath the salar has caused a long dispute with local communities about water use and has been linked to damage to the ecosystem, including the habitat of the Andean flamingo.
The Likan Antay (Atacameño) people, who have lived around the salar for thousands of years, have both opposed extraction and negotiated agreements to share its benefits. Critics argue that these agreements have also increased the mining companies’ control over local decision-making. In December 2025, Chile’s state copper company Codelco and the mining company SQM combined their lithium operations at the salar in a joint venture, increasing state control of the resource.
Sources: Wikipedia, Salar de Atacama (2026).
Processing, transport and tailings
Lithium carbonate from Chile and spodumene concentrate from Australia are shipped to refineries, most of them in China, then to cathode and battery factories, and finally to car and storage plants around the world. Mining and refining are energy-intensive, and in China much of the energy comes from coal. Processing lithium, cobalt, nickel and rare earth elements uses strong acids and creates toxic liquid and solid waste, which can pollute soils, rivers and coastal waters if it escapes.
Mine tailings are stored behind dams that must hold them safely for decades. On 25 January 2019, a tailings dam at the Córrego do Feijão iron ore mine near Brumadinho, Brazil, operated by the company Vale, collapsed. About 12 million m³ of mud swept over the mine’s offices and nearby homes, killing about 270 people, and reached the Paraopeba River the same afternoon. In 2021 Vale agreed to repair the environmental damage and pay reparations initially estimated at US$7 billion. Brumadinho was an iron ore mine, but the same dam technology is used across the mining industry, including for the metals in batteries.
Sources: Wikipedia, Brumadinho dam disaster (2026).
Sociopolitical tensions
Demand for battery metals is global, but their mining, and even more their refining, is concentrated in a few countries, with China processing most of the world’s battery minerals. For energy security this creates a new kind of dependence: a country that replaces imported oil and gas with wind, solar power and batteries may instead depend on imported cells and refined metals. The concentration also creates competition between major economies for secure supplies, and leaves mining communities exposed to pollution, water shortages and, in some places, unsafe artisanal mining and child labour, as in the cobalt mines of the Democratic Republic of the Congo.
Stage | Environmental costs | Social and political costs |
|---|---|---|
Mining | Land clearance, water use (brine pumping), dust, acid drainage, tailings dams | Conflicts over water and land with Indigenous and farming communities; unsafe working conditions |
Transport | Emissions from shipping ore and concentrates across oceans | Dependence on long, vulnerable supply chains |
Processing | Energy use (often coal-based), acids, toxic and sometimes radioactive waste | Concentration of processing in one country; trade restrictions |
Construction and use | Emissions from making cells and factories; fire risk | Benefits mostly in high-income importing countries |
End of life | Toxic waste if dumped; recycling is energy-intensive | Recycling recovers metals and reduces the need for new mines |
These costs do not mean that batteries are worse than the fossil fuels they help replace: a battery’s metals are mined once and can be recycled, whereas fossil fuels are mined and burned continuously. They do mean that the shift to low-carbon energy moves environmental and social burdens from the places where fuel was burned to the places where minerals are mined, and that recycling, better mining standards and the consent of local communities are part of making it sustainable.
Exam practice
Energy appears in all three kinds of question. Paper 2 Section A asks short questions on definitions, data and named examples; Paper 1 gives an unseen place with data about its energy supply; and Paper 2 Section B essays ask for an evaluation of energy sources, a country’s choices or a strategy, with a balanced, evidenced judgement. You should be able to name two contrasting countries, one storage example and several figures from memory.
Paper 2 Section A
Paper 1: an unseen resource
Resource (hypothetical data). Island X has 300,000 people and no fossil fuels. It imports diesel for its power station. The government is considering a wind farm and a battery.
Year | Electricity demand (GWh) | From imported diesel (GWh) | From solar on roofs (GWh) | Diesel price (US$ per litre) |
|---|---|---|---|---|
2015 | 400 | 380 | 20 | 0.70 |
2020 | 450 | 410 | 40 | 0.65 |
2025 | 520 | 440 | 80 | 1.10 |
Paper 2 Section B
Summary
Energy sources are non-renewable (coal, oil, natural gas, uranium) or renewable (wind, solar, tidal, geothermal, hydropower, sustainably grown wood); most are converted to electricity.
World primary energy consumption rose about fourfold between 1965 and 2024 with population and use per person; fossil fuels still supplied 81% in 2024, while renewables generated 32% of electricity.
Steel, cement and synthetic fertiliser depend on fossil fuels as raw materials or for heat, which slows the transition.
Every source has environmental costs across its life cycle; fossil fuels have the highest emissions and death rates, while renewables and nuclear power have costs from mining, manufacturing and waste.
Energy choices depend on availability, cost, sustainability, pollution, efficiency, security and public values, as the contrasts between Iceland and Saudi Arabia and between Germany and France show.
Intermittent wind and solar power need storage: batteries, pumped hydroelectric storage, fuel cells and thermal storage shave peaks and shift energy in time.
Energy conservation changes behaviour; energy efficiency changes technology; both reduce demand and imports, but the rebound effect and voluntary take-up limit them.
Germany’s Energiewende raised renewable electricity from 6% to 59% but closed nuclear power before coal.
Energy security is reliable access to affordable energy, improved by efficiency, fewer imports and diversification. (HL)
Reserves of coal, oil and gas are finite, but their timeline to depletion depends on consumption, discoveries, technology, price and the growth of alternatives. (HL)
Nuclear fission is a low-carbon, non-renewable source with high construction costs, accident risks, thermal pollution and long-lived radioactive waste. (HL)
Battery storage needs lithium, cobalt and rare earth elements whose mining and processing cause pollution, tailings risks and geopolitical tension. (HL)
Self-check
- To do:
I can classify energy sources as renewable or non-renewable and outline how each produces electricity.
- To do:
I can describe and explain trends in global energy consumption using data.
- To do:
I can explain why steel, cement and fertiliser keep the world dependent on fossil fuels.
- To do:
I can evaluate the life-cycle sustainability of fossil fuels, rare earth elements, nuclear, solar and wind power.
- To do:
I can discuss the factors behind the energy choices of two contrasting named countries.
- To do:
I can explain intermittency and peak shaving and outline four methods of energy storage with one example.
- To do:
I can distinguish energy conservation from energy efficiency and evaluate two examples.
- To do:
I can use Germany’s Energiewende as a case study, with data and perspectives.
- To do:
I can explain energy security and how countries improve it, using data. (HL)
- To do:
I can discuss the factors affecting the timeline to depletion of fossil fuel reserves. (HL)
- To do:
I can evaluate nuclear power, including fission, accidents, thermal pollution and radioactive waste. (HL)
- To do:
I can examine the costs of the minerals needed for battery storage, using lithium as an example. (HL)