Classify solid waste, explain why its volume and composition vary, assess its impacts and the waste trade, and evaluate preventative and restorative strategies, disposal options, policies and circular design.
Each is in the ESS glossary, with every other term in the subject.
The breakdown of organic waste by microorganisms in a sealed tank without oxygen, producing biogas (mainly methane) used as fuel and digestate used as fertiliser.
The capacity of a material to be broken down by living organisms, mainly bacteria and fungi, into simple substances such as water, carbon dioxide, methane and mineral nutrients.
Waste that contains infectious agents or biological material that may harm humans, animals or the environment, such as used needles, dressings, blood and laboratory cultures.
The aerobic decomposition of organic waste, such as food scraps and garden waste, by microorganisms into compost, a stable, humus-rich material used to improve soil.
A system in which a small refundable deposit is added to the price of a drink container and paid back when the empty container is returned for reuse or recycling.
Discarded electrical and electronic equipment, such as phones, computers and batteries, which contains valuable metals and hazardous substances such as lead, mercury and brominated flame retardants.
A policy approach that makes manufacturers responsible, financially or physically, for collecting and recycling or disposing of their products at the end of their life.
Classify waste by its source (domestic, industrial, agricultural) and by its type (including e-waste, food and biohazardous waste).
Outline the typical composition of solid domestic waste.
Explain how socio-economic, political, environmental and technological factors change the volume and composition of waste over time and between societies.
Discuss the environmental and social impacts of waste, including those felt far from where it was produced, and the environmental injustice of the waste trade.
Explain how ecosystems absorb waste and when waste becomes pollution, using biodegradability and half-lives.
Distinguish between preventative and restorative waste strategies and explain why reducing consumption is the most sustainable option.
Evaluate landfill, incineration, waste to energy, exporting waste, recycling and composting as disposal options.
Evaluate taxes, incentives, social policies, legislation, education, campaigns and access to facilities as ways of promoting sustainable waste management.
Apply circular economy principles by tracing a product from manufacture to recovery.
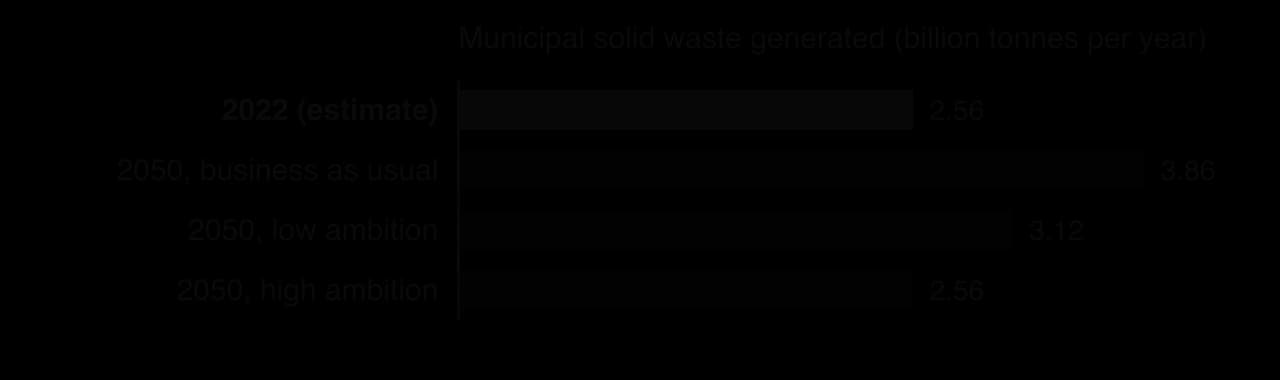
Every use of natural resources produces waste: packaging, food scraps, broken phones, building rubble, farm residues and factory by-products. The world generated an estimated 2.56 billion tonnes of municipal solid waste in 2022, and about a third of it was dumped in the open or never collected. How waste is produced, moved and managed affects soils, water, air, the climate and the health of the people who live and work near it.
Waste is where the linear economy of “take, make, dispose” ends, and it can be studied as the output of a
The official deck for this part of the syllabus.
What is waste?
Explain why something that is waste to one person can be a resource to another.
With a free account, Augment remembers where you stopped and what you have practiced.
The time taken for half of the amount of a substance to break down or decay, such as half of the radioactive nuclei in a sample or half of a pollutant in the environment.
The burning of waste at high temperatures in a controlled furnace, which greatly reduces its volume and leaves ash, flue gases and heat.
A site where waste is buried in the ground; a sanitary landfill is engineered with a liner, daily cover and systems to collect leachate and landfill gas.
The liquid formed when water percolates through waste, carrying dissolved substances such as organic compounds, ammonia and heavy metals that can pollute soil, groundwater and rivers.
The disposal of waste on land without engineering, cover or lining, so that it is exposed to rain, wind, animals and people and is often burned in the open.
The practice of designing products with an artificially limited useful life, for example by making them hard to repair or quickly outdated, so that they must be replaced sooner.
A waste management strategy that stops waste being produced or released into the environment, by altering behaviour (such as reducing consumption) or by controlling release (such as safe disposal).
The sequence of stages a product passes through, from raw material extraction, through manufacture, distribution and use, to its end of life as waste or as recovered material.
The collection and reprocessing of waste materials, such as paper, glass, metals and some plastics, into new raw materials or products.
A waste management strategy that removes waste after it has entered the environment and restores the damaged system, such as clearing beaches or rehabilitating old dump sites.
The use of an item again, for the same or a different purpose, without reprocessing it into a new material, for example refilling a glass bottle or passing on clothes.
A plastic item designed to be used only once before it is thrown away or recycled, such as carrier bags, drinks bottles, straws, cutlery and food packaging.
The solid waste produced by households, such as food scraps, packaging, paper, glass, metals, plastics and textiles; with similar waste from shops and offices it forms municipal solid waste.
Any material that is no longer wanted or useful to its owner and is discarded, including solid, liquid and gaseous materials from households, industry, agriculture and services.
A ranking of waste management options in order of preference, from preventing waste by refusing and reducing, through reuse and recycling, to energy recovery and finally disposal.
The recovery of energy from waste, usually by incinerating it to generate electricity and heat, or by capturing biogas from landfills and anaerobic digesters.
The international movement of waste across borders for recycling, recovery or disposal, usually from high-income to lower-income countries where labour is cheaper and regulation weaker.
Waste is any material that its owner no longer wants and discards. Something that is waste to one person can be a resource to another, as scrap metal dealers and the informal collectors who sort rubbish in many cities show. Waste can be solid, liquid or gaseous; solid waste is the material collected from homes, businesses, farms and factories, or left behind on land.
Source | What it includes | Examples |
|---|---|---|
Domestic | Waste from households, collected by or for local councils | Food scraps, packaging, paper, garden waste, old clothes, broken furniture |
Industrial | Waste from manufacturing, mining, construction, energy and commerce | Mine tailings, slag from steelworks, building rubble, chemical residues, offices’ paper |
Agricultural | Waste from farming, forestry and fishing | Crop residues, manure, plastic mulch film, pesticide containers, abandoned fishing gear |
The three sources differ greatly in size. Industrial and agricultural waste together far outweigh household waste in most countries, but household waste is the most mixed, the most visible and the part most directly shaped by individual choices, so it receives much of the attention in waste policy.
Waste can also be classified by what it is made of and how hazardous it is, because this decides how it must be handled. Three types need particular care.
E-waste is the fastest-growing type of solid waste. A record 62 million tonnes was produced in 2022, 82% more than in 2010, and only 22.3% was documented as formally collected and recycled. It is projected to reach about 82 million tonnes by 2030. The materials in the e-waste generated in 2022 that were not recovered were worth an estimated US$62 billion.
Sources: Global E-waste Monitor (2024).
Food waste is food that is lost or thrown away by shops, restaurants and households. It is the largest single part of municipal solid waste worldwide, about 38%, and it rots quickly, producing methane when it is buried without oxygen.
Sources: World Bank, What a Waste 3.0 (2026).
Biohazardous waste comes mainly from hospitals, clinics and laboratories. It must be separated at the point where it is produced, stored in labelled containers and usually sterilised or incinerated at high temperatures. During the COVID-19 pandemic, the volume of used masks, gloves and test kits grew suddenly, putting pressure on health-care waste systems in many countries.
Solid domestic waste has a very diverse content. A typical household bin contains paper and cardboard, glass bottles and jars, metal cans and foil, plastics (bottles, bags, films and food trays), organic waste from the kitchen and garden, packaging of all kinds, textiles and clothing, and items such as broken toys, nappies and small electrical goods. Construction debris from home repairs and bulky items such as furniture are also part of it.
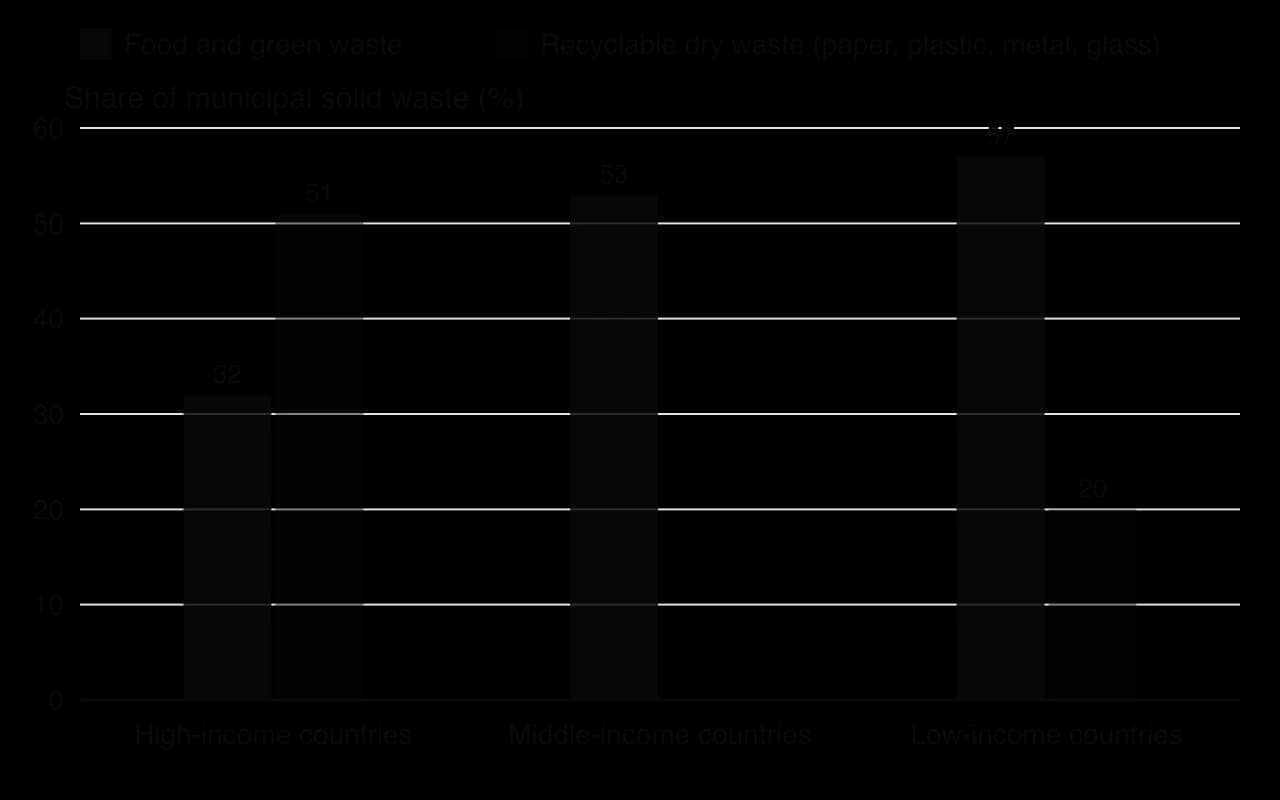
The chart shows how the composition of waste reflects consumption. Households in low-income countries buy more fresh, unpackaged food and fewer manufactured goods, so organic waste dominates. Households in high-income countries buy more packaged and processed products, newspapers and drinks in cans and bottles, so dry recyclable materials make up a larger share. Middle-income countries sit between the two, with about 53% food and green waste.
Component | Examples | Biodegradable? | Usual management |
|---|---|---|---|
Organic (kitchen and garden) | Food scraps, peelings, grass, leaves | Yes, quickly | Composting, anaerobic digestion |
Paper and cardboard | Newspapers, boxes, packaging | Yes, over months | Recycling into new paper |
Plastics | Bottles, bags, films, trays | No (most types) | Recycling of some types; landfill or incineration |
Glass | Bottles, jars | No, but inert | Reuse, recycling |
Metals | Aluminium and steel cans, foil | No (steel rusts) | Recycling |
Textiles | Clothing, shoes | Natural fibres partly; synthetics no | Reuse, second-hand trade |
Construction debris | Rubble, wood, tiles | Mostly no | Crushing and reuse as aggregate |
The amount of waste a society produces, and what that waste is made of, changes over time and differs from place to place. The differences come from the same forces that shape consumption: wealth, policy, the environment and technology. Each can increase or decrease waste, and they usually act together.
Income is the strongest influence on how much waste people produce. On average, each person in the world generated about 0.88 kg of municipal waste a day in 2022, but this ranged from 0.2 kg or less in Niger to 2.2 kg or more in the United States and Canada. In 2016, high-income countries had 16% of the world’s population but generated about 34% of its waste. Richer households buy more goods, more packaged and processed food, and replace clothes, furniture and electronics more often.
Waste is growing fastest where incomes and cities are growing fastest. By 2050, municipal waste is projected to grow by 124% in sub-Saharan Africa and by 99% in South Asia. Urbanisation adds to the change: city dwellers buy more packaged food than rural households, and they have less space to compost or reuse materials, so more of what they discard enters the collected waste stream.
Sources: World Bank, What a Waste 2.0 (2018) and What a Waste 3.0 (2026).
Laws and policies change both how much waste is produced and where it goes. Bans on single-use plastic items, charges for plastic bags, deposit schemes for bottles and cans, and landfill taxes all reduce particular parts of the waste stream. Trade policy matters too: when China stopped accepting most imported plastic waste in 2018, countries that had exported their recyclables suddenly had to landfill, burn or find new destinations for them.
The European Union’s Single-Use Plastics Directive of 2019 banned items such as plastic cutlery, plates and straws from July 2021, removing them from the waste stream at source. Political instability works in the opposite direction: where local government is weak or underfunded, collection services fail and waste is dumped or burned in the open.
Climate and seasons change the composition of waste. In temperate regions, garden waste rises sharply in spring and autumn; in hot climates, food rots faster, so more is thrown away and it must be collected more often. Natural disasters create sudden, huge volumes of waste: floods, earthquakes and storms leave behind debris from destroyed buildings, ruined furniture and dead animals. Environmental concern itself is a factor, because people who value the environment are more likely to reduce, reuse and sort their waste.
New technology changes what is thrown away. At the start of the twentieth century, 53% of household waste in the United Kingdom was coal ash from open fires; as homes switched to gas and electric heating, ash almost disappeared from bins. Plastics, which barely existed in household waste before the 1950s, are now one of its main components, and the spread of mobile phones, computers and other electronics has made e-waste the fastest-growing type of waste.
Technology can also reduce waste. Digital media have replaced some newspapers, letters and printed forms; lighter packaging uses less material for the same job; and better sorting machines make it possible to recycle more of the waste that is collected.
Sources: Wikipedia, Municipal solid waste (2026).
Factor | Example that increases waste | Example that decreases waste |
|---|---|---|
Socio-economic | Rising incomes and urbanisation in sub-Saharan Africa and South Asia | Cultures of repair and reuse; second-hand markets |
Political | Collapse of collection services where local government is weak | Bans on single-use plastics; deposit return schemes |
Environmental | Debris from floods, storms and earthquakes | Public concern leading to reduced consumption |
Technological | Cheap electronics with short lives; plastic packaging | Digital media; lighter packaging; better sorting |
Producing, treating and managing waste all have environmental and social impacts. Some are felt where the waste is produced, some at the disposal site and some, increasingly, in other countries to which waste is shipped.
Greenhouse gases. Organic waste buried without oxygen in landfills and dumps decomposes anaerobically and produces methane. The waste sector emitted about 1.28 billion tonnes of CO₂-equivalent in 2022, of which 1.15 billion tonnes came from methane.
Water and soil pollution. Rainwater seeping through waste forms leachate, which carries heavy metals, organic matter and other chemicals into groundwater and rivers.
Air pollution. Open burning of waste releases smoke, particulates and toxic chemicals such as dioxins.
Plastic pollution. Uncollected plastic is blown and washed into rivers and the sea, where it harms wildlife and breaks down into microplastics. About 93 million tonnes of plastic waste a year is mismanaged.
Land use. Landfills and dumps occupy large areas, often wetlands or valleys near cities.
Sources: World Bank, What a Waste 3.0 (2026).
The people most exposed to waste are often the poorest. About 18 million people work in urban waste management, and about 40% of workers in the sector worldwide are informal: waste pickers who collect, sort and sell recyclable materials from streets and dumps without protective equipment, contracts or social security. They provide a large share of recycling in many cities but face injuries, disease and social stigma. Communities living beside dumps and incinerators suffer from smells, pests, smoke and contaminated water, and blocked drains filled with rubbish can make urban flooding worse.
Sources: World Bank, What a Waste 3.0 (2026), citing the ILO.
Some waste travels thousands of kilometres. The waste trade grew because it was cheaper for high-income countries to ship mixed recyclables and used electronics abroad than to sort and process them at home, and because manufacturers in countries such as China wanted cheap raw materials. Much of the material was recycled, but much was not: contaminated or low-value waste was often dumped or burned at the destination.
This raises questions of environmental justice, the fair distribution of environmental benefits and harms. The consumers who use and discard the goods receive the benefits, while the health and environmental costs of processing their waste fall on workers and communities in other countries who had no part in the decision. International law now controls this trade through the Basel Convention, which requires exporters of hazardous waste to obtain the prior informed consent of the importing country; since 2021 its plastic waste amendments have applied the same rule to most mixed and contaminated plastic waste.
Agbogbloshie, beside the Korle Lagoon near central Accra, became known worldwide as a site where cars and electronic goods were dismantled and their cables burned to recover copper, aluminium and iron. Burning plastic insulation released lead, mercury, arsenic, dioxins, furans and brominated flame retardants into the soil, water and air. A 2019 study found dioxin levels in a free-range egg from the area about 220 times the level the European Food Safety Authority considers safe. Workers, including children, reported headaches, breathing problems and nausea.
An estimated 300–600 containers of used electronics reached Ghana’s ports each month, mostly from Europe, North America and East Asia, often labelled as second-hand goods for reuse. The picture is more complex than a simple “dumping ground”: many imported devices were repaired and resold cheaply to Ghanaian households, and a study for the US International Trade Commission found little evidence of unprocessed e-waste being shipped from the United States to Africa. The government demolished the site in July 2021, but scrap work moved elsewhere and some workers later returned, which shows that closing a site does not remove the flows of waste or the poverty that drives the work.
Sources: Wikipedia, Agbogbloshie (2026).
Ecosystems have always dealt with waste. Dead leaves, dung and dead animals are broken down by decomposers such as bacteria and fungi, and the nutrients they contain are returned to the soil and reused by plants. In this sense, natural ecosystems produce no waste at all: the output of one process is the input of another.
Human waste becomes a problem when it is added faster than ecosystems can transform it into harmless substances, or when it contains substances that ecosystems cannot break down at all. Pollution is defined by this balance of rates. A small amount of food waste on a compost heap is broken down within weeks; the same food buried in a landfill without oxygen, or dumped in large quantities in a river, overwhelms the system and causes harm.
Materials made by living things, such as food, paper, cotton, wood and leather, are biodegradable: decomposers have evolved the enzymes to digest them. Most plastics are made from fossil fuels into long, stable molecules that decomposers cannot digest, so they persist for decades or centuries, breaking up into smaller and smaller pieces rather than disappearing. Glass and most metals are not biodegradable either, but glass is chemically inert and metals can be recovered and recycled indefinitely.
The rate of biodegradation depends on conditions as well as the material. Decomposers work fastest when they have oxygen, water and warmth. In a modern landfill, waste is compacted and covered, so oxygen is scarce; newspapers buried in landfills have been dug up decades later still readable. The same conditions that slow decomposition also cause the anaerobic breakdown that produces methane.
A half-life describes how quickly a persistent substance disappears. Each half-life removes half of what is left, so after one half-life 50% remains, after two 25%, after three 12.5% and so on. The amount approaches zero but, in theory, never reaches it. The concept began with radioactive isotopes, whose half-lives are fixed, but it is also used for pollutants and materials, whose half-lives depend on conditions.
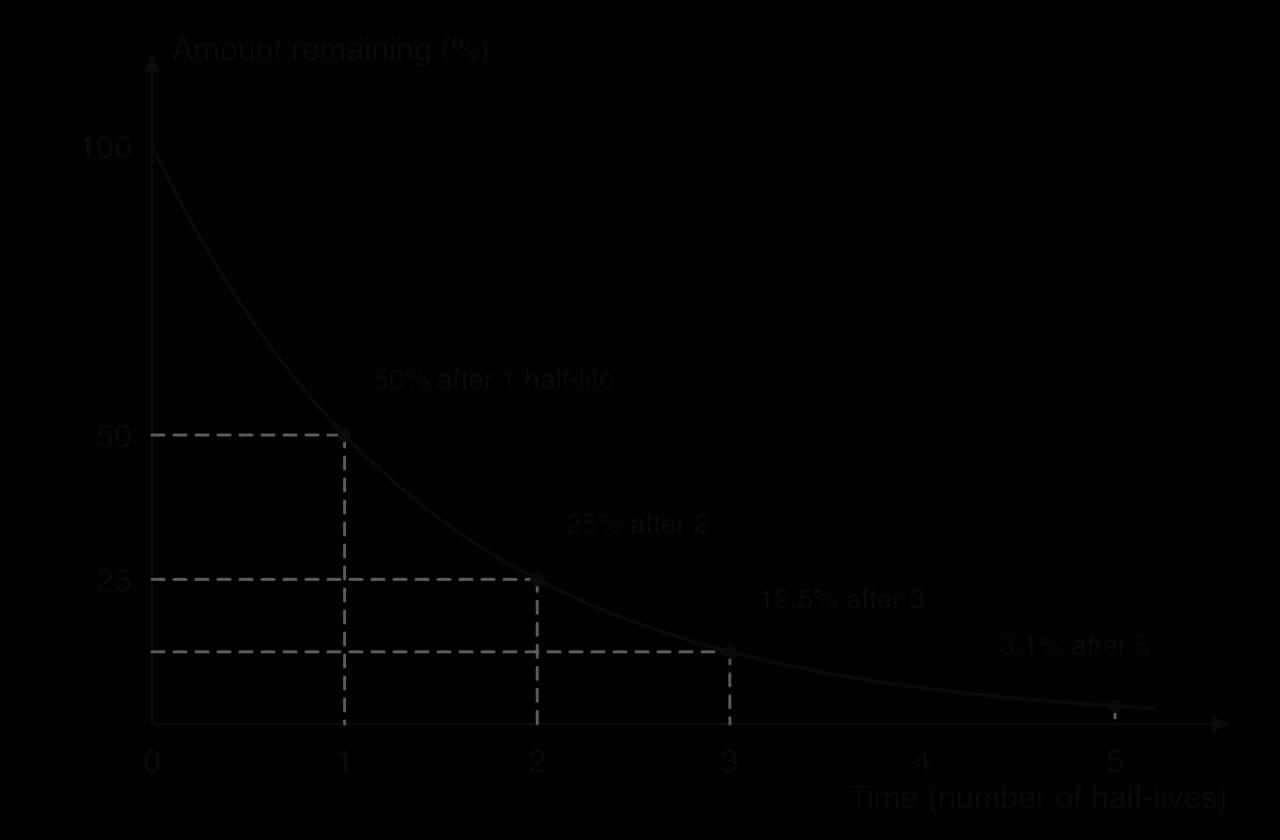
Estimated half-lives for plastics vary hugely with the type of object and its surroundings. One review that extrapolated measured surface degradation rates estimated that a high-density polyethylene (HDPE) bottle in the sea has a half-life of about 58 years, and an HDPE pipe about 1,200 years, because a thick pipe has much less surface area for its mass. These are estimates from short experiments, and real rates are uncertain.
Sources: Chamas et al., “Degradation rates of plastics in the environment”, ACS Sustainable Chemistry & Engineering (2020).
Strategies for managing waste can be divided by when they act. Preventative strategies stop waste being created or stop it escaping into the environment. Restorative strategies deal with waste after it has escaped, by cleaning it up and restoring the damaged ecosystem.
Preventative strategies work on the causes of waste and include both changing behaviour and controlling disposal. Restorative strategies work on its consequences.
These two kinds of strategy map onto the pollution management model, which divides management into three levels: changing the human activity that produces a pollutant, controlling its release, and cleaning up and restoring the environment after its release. Changing the activity and controlling release are both preventative strategies; clean-up and restoration are restorative strategies.
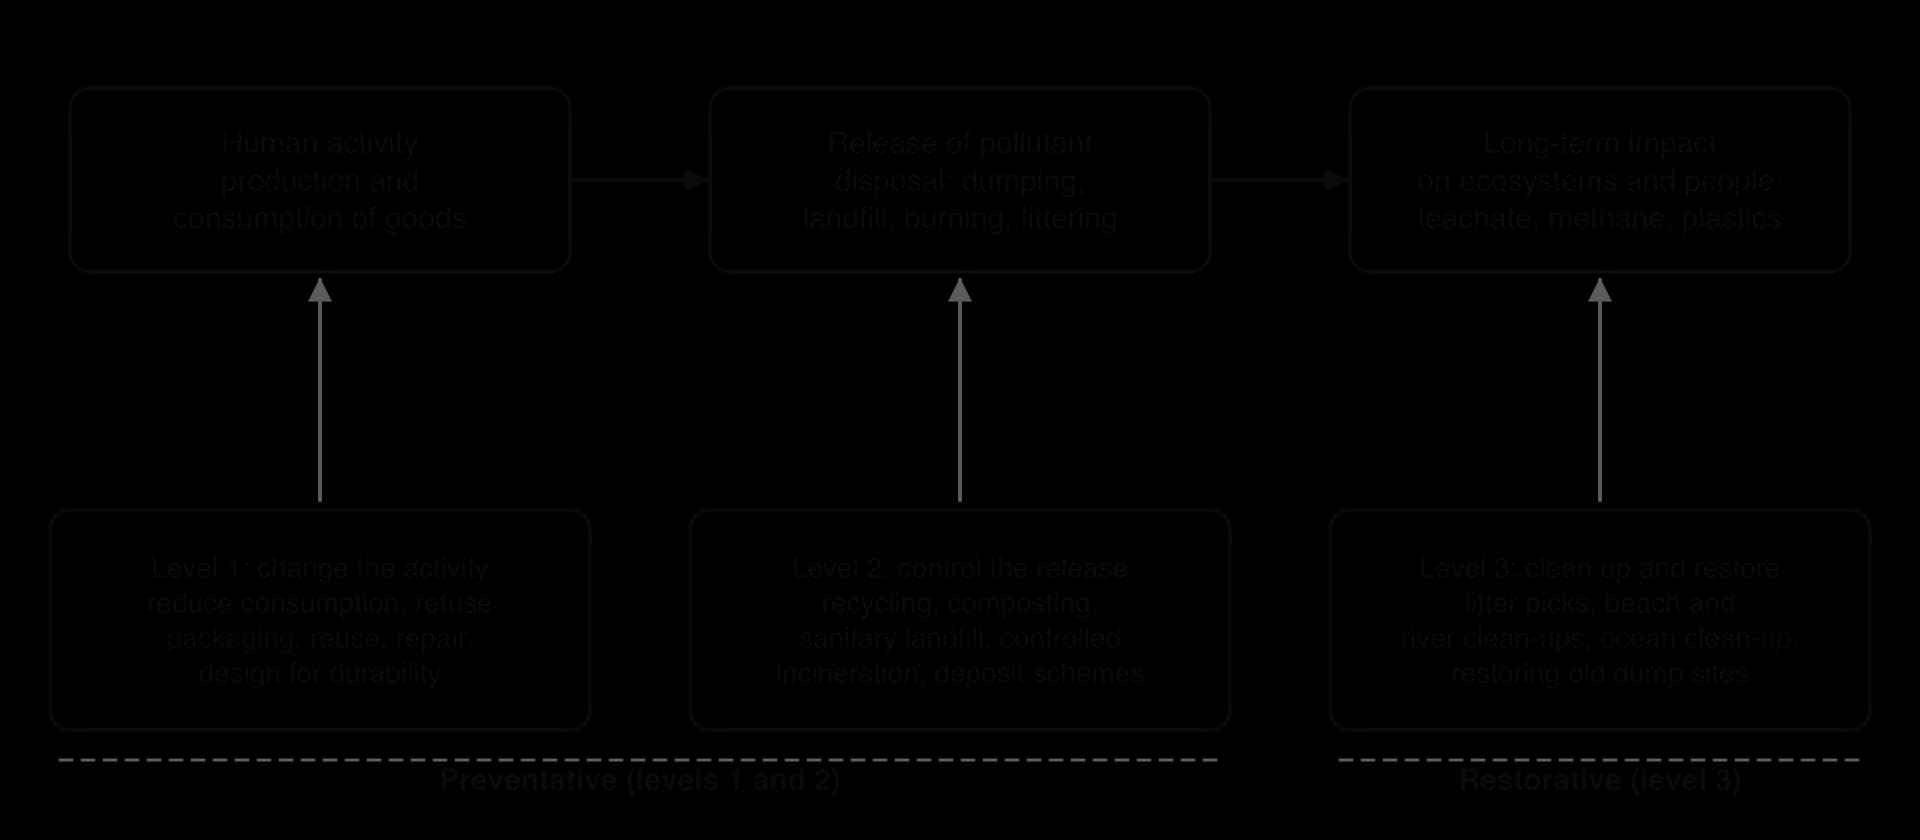
Level | Type | Waste strategies | Strengths | Limitations |
|---|---|---|---|---|
1: change the human activity | Preventative (altering behaviour) | Buying less; refusing packaging; reuse, repair and sharing; durable product design | Removes the waste before it exists; saves resources and energy too | Requires changes in values, habits and business models; hard to enforce |
2: control the release | Preventative (controlling release) | Sorted collection, recycling, composting, sanitary landfill, controlled incineration, deposit schemes | Reliable where infrastructure exists; can recover materials and energy | Needs money, infrastructure and enforcement; waste is still produced |
3: clean up and restore | Restorative | Litter picks; beach and river clean-ups; ocean clean-up; restoring dump sites | Removes visible harm; raises awareness | Expensive; recovers only a fraction; treats symptoms, not causes |
The Great Pacific Garbage Patch, between Hawaii and California, is an area of about 1.6 million km² where floating plastic is concentrated by the circulation of ocean currents; a 2018 study estimated that it held about 79,000 tonnes of plastic (somewhere between 45,000 and 129,000 tonnes). The Ocean Cleanup, a Dutch non-profit organisation founded in 2013, tows long floating barriers through the patch to collect plastic, and has placed solar-powered “Interceptors” in rivers to catch waste before it reaches the sea. By July 2026 it reported removing more than 60,000 tonnes of trash from rivers and the patch together.
Critics argue that only a small share of the plastic entering the oceans, perhaps less than 5%, ends up in garbage patches, that microplastics cannot be collected this way, and that barriers may harm organisms living at the sea surface. Devices close to shore and in rivers are easier to maintain and may recover more plastic per dollar. The Ocean Cleanup published an assessment in 2025 concluding that the benefits of removal outweigh its environmental costs, but as long as plastic keeps flowing into the oceans, clean-up cannot keep pace, so many researchers argue that the priority is to stop plastic entering the sea at all.
Sources: Wikipedia, The Ocean Cleanup and Great Pacific garbage patch (2026).
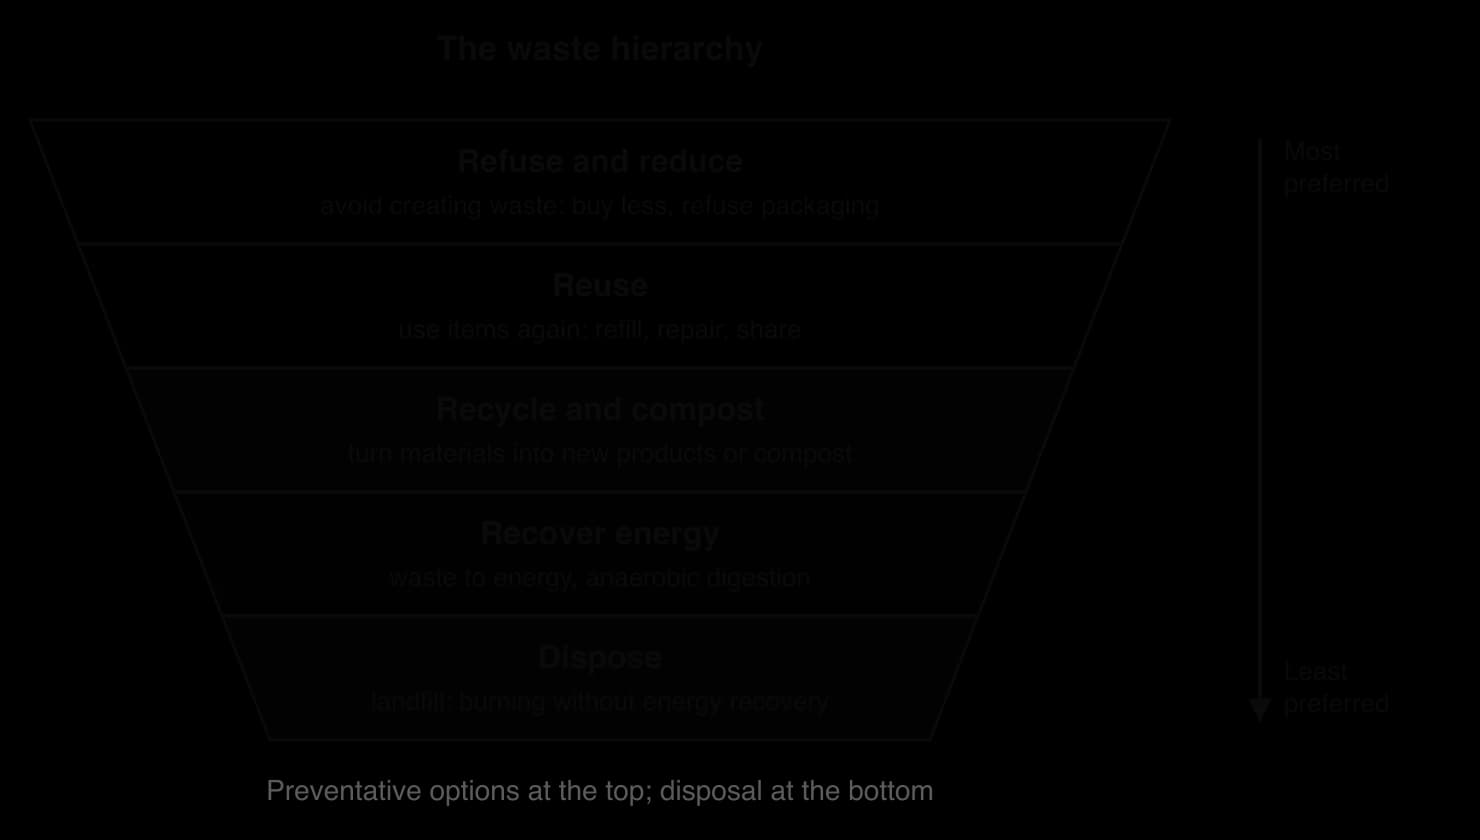
The waste hierarchy puts the same idea into a ranking. Refusing and reducing consumption avoids waste completely. Reuse keeps a product in use for its original purpose, for example refilling bottles or repairing a phone. Recycling breaks a product down into its materials to make new products, which saves raw materials but still uses energy, water and transport. Energy recovery burns waste to generate electricity or heat. Disposal in landfill or by burning without energy recovery recovers nothing.
Reuse ranks above recycling because it keeps all the energy and materials already invested in the product, whereas recycling destroys the product and has to rebuild it from its materials.
Many plastics can be recycled only a few times, each time into a lower-quality material, before they must be landfilled or burned. Aluminium and glass can be recycled repeatedly with little loss of quality, which makes them the materials best suited to closed recycling loops.
Once waste exists, it must go somewhere. The main options are landfill, incineration (with or without energy recovery), exporting, recycling and composting, and in many lower-income cities open dumping remains the most common fate. Each option has advantages and disadvantages for ecosystems and for societies, and the best choice depends on the type of waste, the money and land available, and local values.
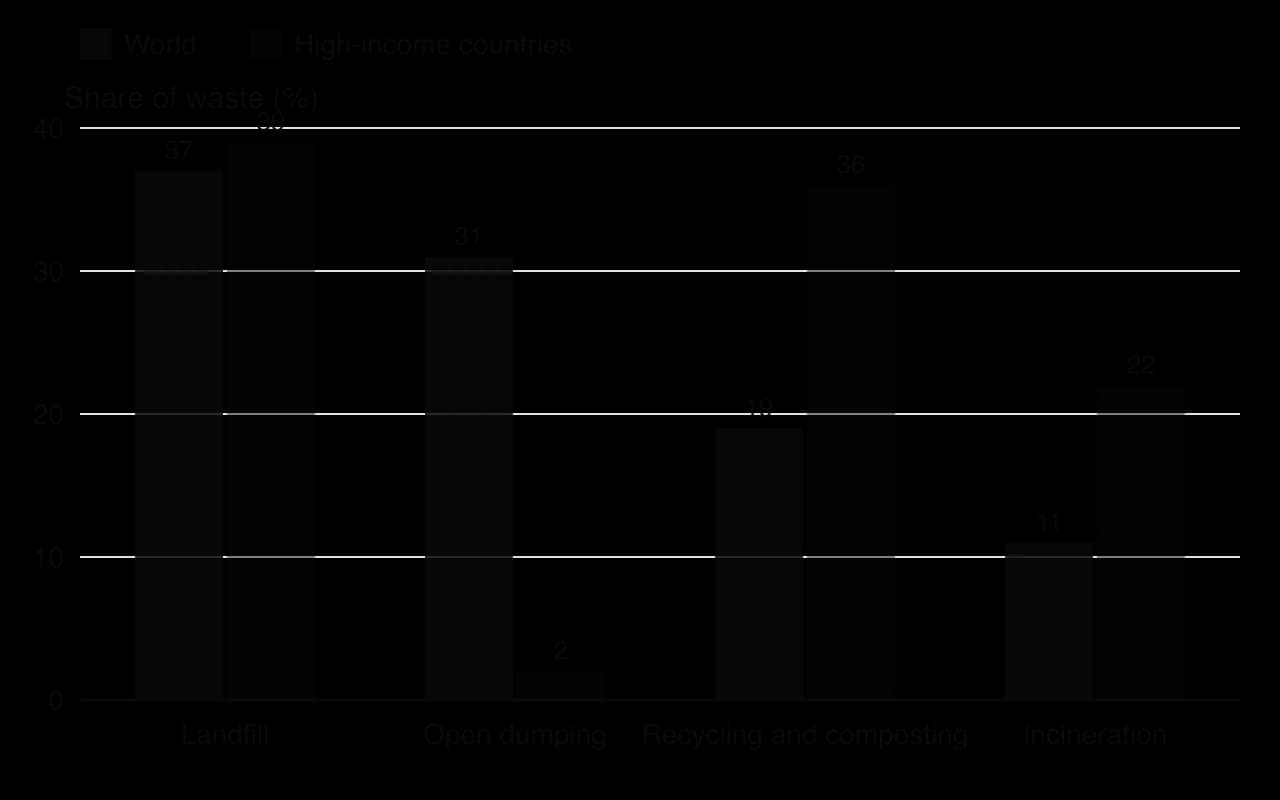
In 2016, about 37% of the world’s waste went to some form of landfill, but only 8% went to sanitary landfills with systems to collect landfill gas. About 31% was dumped in the open, 19% was recycled or composted and 11% was incinerated. The contrast between income groups is stark: low-income countries dumped 93% of their waste, while high-income countries dumped only 2% and recycled or composted 36%.
Sources: World Bank, What a Waste 2.0 (2018).
Open dumping costs almost nothing at first, which is why it persists where collection and disposal services are underfunded. Its costs come later: leachate pollutes groundwater, burning releases smoke and toxins, rats and flies spread disease, rubbish blocks drains and causes flooding, and waste is blown and washed into rivers and the sea. Large dumps can also collapse: piles of waste are unstable, especially after heavy rain.
A sanitary landfill isolates waste from the surrounding environment. The pit is lined with compacted clay and a plastic membrane; waste is spread in thin layers, compacted by heavy machines and covered each day with soil to keep out animals and rain. Pipes at the base collect leachate, and wells collect the gas produced as organic waste decomposes. When the site is full it is capped with clay and soil and planted, and it must be monitored for decades.
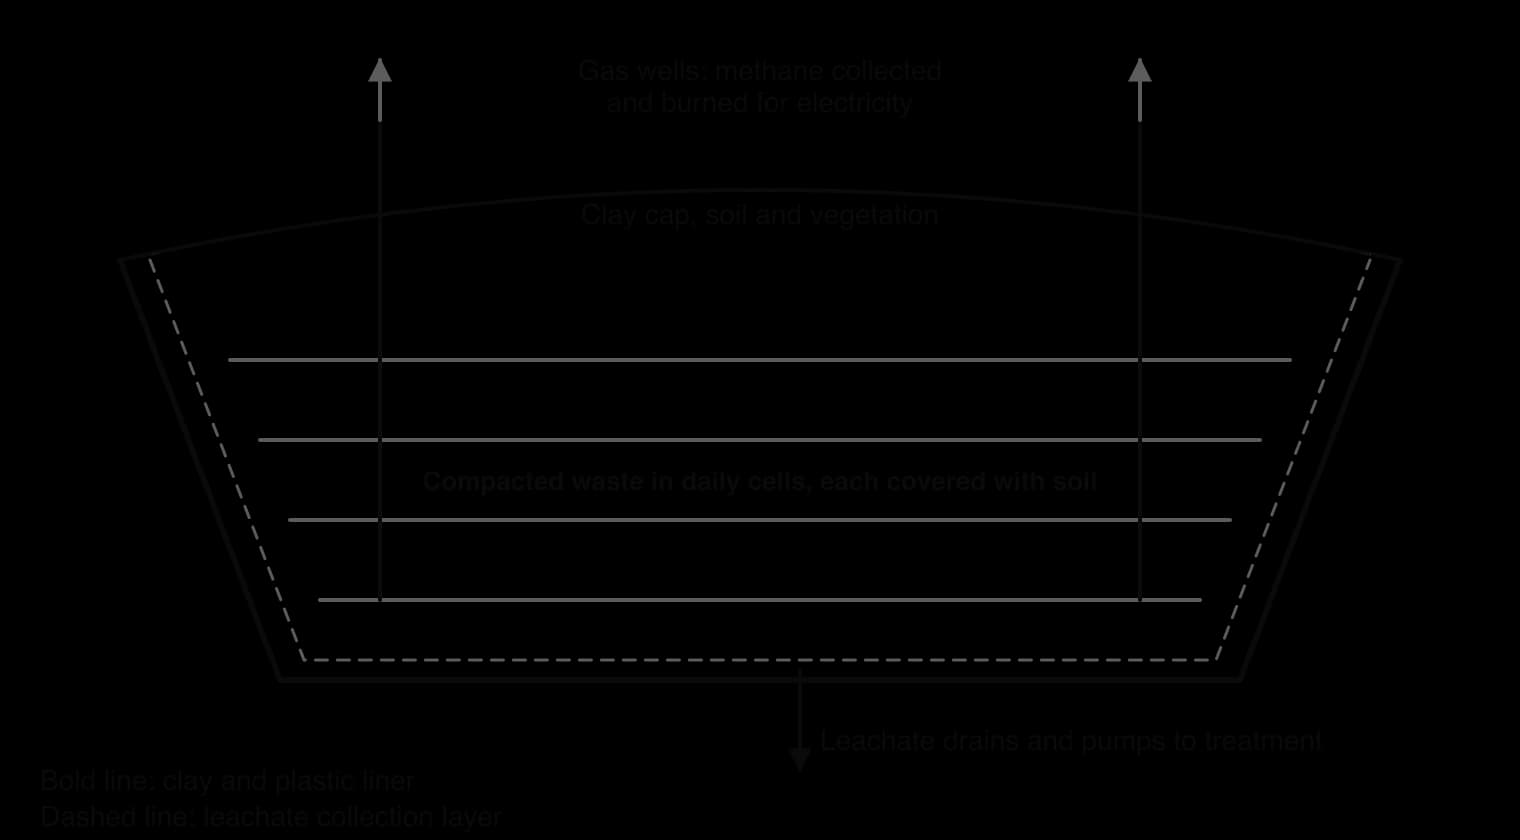
Inside a landfill, oxygen is soon used up, and the organic waste decomposes anaerobically, producing landfill gas, a mixture of methane and carbon dioxide. Methane is a much more powerful greenhouse gas than carbon dioxide over a few decades. Where it is collected, it can be burned to generate electricity, which converts the methane to less harmful carbon dioxide; where it is not, it escapes to the atmosphere for decades after the landfill closes.
 YouTube
Incineration destroys organic material and pathogens, which makes it the standard method for biohazardous waste, and it greatly reduces the volume of waste that must be landfilled. It is used mainly in countries that are wealthy and short of land, such as Japan, Singapore, Switzerland and the Nordic countries. Modern incinerators clean their flue gases with filters and scrubbers to remove particulates, acid gases and dioxins, but they still emit carbon dioxide from burning plastics, and the remaining ash, which contains heavy metals, must be landfilled safely.
Most modern incinerators are waste-to-energy plants. Amager Bakke in Copenhagen, Denmark, opened in 2017 and was designed to burn about 400,000 tonnes of municipal waste a year, producing up to 63 MW of electricity and 157–247 MW of heat for the city’s district heating network. Its sloping roof carries an artificial ski slope, a hiking slope and a climbing wall. Its flue-gas cleaning was expected to cut emissions of sulfur dioxide by 99.5% and of nitrogen oxides by about 95%.
Waste to energy is controversial. Supporters see it as a way to recover value from waste that cannot be recycled and to replace fossil fuels for heating. Critics argue that incinerators need a steady supply of waste for decades to repay their cost, which can discourage reduction and recycling, and that burning plastic is effectively burning fossil fuel. Copenhagen’s plan to become carbon neutral by 2025 depended partly on the plant, but in 2022 its operator was found ineligible for national funding to capture the carbon dioxide from its chimney.
Sources: Wikipedia, Amager Bakke (2026).
Exporting waste moves it to countries where sorting and processing are cheaper. It can supply useful raw materials to manufacturers and keep material out of landfills in the exporting country. However, it shifts pollution and health risks to communities in lower-income countries, it is hard to monitor whether the waste is actually recycled, and it uses energy for transport. It also allows exporting countries to avoid building their own recycling systems. The rise and sudden collapse of the trade in plastic waste to China is analysed in the case study.
Recycling turns waste into raw materials, which reduces mining, logging and oil extraction and usually saves energy: recycled aluminium needs only about 5% of the energy used to make new aluminium from bauxite. It also creates jobs in collection and processing. However, recycling depends on clean, well-sorted materials, stable markets and prices, and the energy and transport needed to collect them. Contamination (food left in containers, mixed plastics) can make a whole load unrecyclable, and many plastics lose quality each time they are reprocessed.
Composting returns the nutrients and organic matter in food and garden waste to the soil, reduces the need for synthetic fertiliser and avoids the methane produced when the same waste is landfilled. It can be done in a back garden, at a school or in large municipal facilities. Only about 6% of the world’s waste is composted or anaerobically digested, even though food and green waste are the largest component of municipal waste.
Anaerobic digestion deliberately produces the methane that a landfill releases by accident, but captures it for use. Small biodigesters fed with manure and food scraps supply cooking gas to millions of rural households in countries such as India, China and Nepal, while large plants in Europe treat municipal food waste and feed biogas into gas grids.
Sources: World Bank, What a Waste 3.0 (2026).
Option | Advantages for societies and ecosystems | Disadvantages for societies and ecosystems |
|---|---|---|
Open dumping | Cheap at first; no technology needed | Leachate, smoke, disease, flooding, plastic in rivers and seas; health risks to nearby communities and waste pickers |
Sanitary landfill | Relatively cheap; can take all types of waste; gas can generate electricity | Uses land; methane and leachate leak if poorly managed; materials are lost; must be monitored for decades |
Incineration / waste to energy | Reduces volume by about 90%; destroys pathogens; produces electricity and heat | Expensive; CO₂ from plastics; toxic ash; can lock in demand for waste; local opposition |
Exporting | Cheap for exporters; may supply raw materials | Shifts pollution to lower-income countries; hard to verify recycling; environmental injustice |
Recycling | Saves raw materials and energy; creates jobs | Needs sorting and markets; contamination; quality loss for plastics; transport energy |
Composting and anaerobic digestion | Returns nutrients to soil; avoids landfill methane; produces biogas | Needs separate collection of organic waste; odours if badly managed; contamination by plastics |
Sustainable waste management depends on millions of daily decisions by households, shops and manufacturers. Governments and communities can influence those decisions with a range of tools: some make unsustainable choices more expensive, some reward better ones, some change the rules, and some make the sustainable choice easier or more normal.
A landfill tax charges a fee for every tonne of waste buried, which makes recycling and composting cheaper by comparison and encourages businesses and councils to reduce waste. Pay-by-weight or pay-per-bag schemes charge households for the amount of rubbish they put out. In Taipei, Taiwan, households must put unsorted rubbish in government-issued bags, sold in convenience stores, while recyclables are collected free; the city’s environmental protection bureau reports that the scheme cut household refuse by two-thirds. Charges on plastic bags at shop tills work in the same way on a single item.
A deposit return scheme turns an empty bottle or can into something worth money, so people return it rather than throw it away, and those who do discard containers create an income for collectors. Most schemes use reverse vending machines in shops. Return rates are often above 90%, and the containers collected are clean and sorted, which makes high-quality recycling possible.
Sources: Wikipedia, Container-deposit legislation (2026).
Incentives can also reward people directly. In Curitiba, Brazil, the Green Exchange programme lets residents of low-income neighbourhoods trade bags of recyclable materials for fresh food or bus tokens, which combines waste collection with social support.
Some of the most successful schemes rely on community organisation and shared norms rather than prices. The small town of Kamikatsu in Tokushima, Japan (population 1,431 in 2022) asks households to wash their waste and sort it into 45 categories at the town’s Zero Waste Center, rather than paying for an incinerator. It recycles about 80% of its waste, compared with about 20% for Japan as a whole. The approach works in a small, close-knit community; it would be much harder to apply in a city of millions.
Sources: Wikipedia, Kamikatsu, Tokushima (2026).
Laws can ban the most damaging items, such as some single-use plastics, set recycling targets, and require extended producer responsibility. Under EPR, the cost of dealing with packaging, electronics, batteries or tyres at the end of their life is moved from taxpayers and councils to the companies that make and sell them. Because producers then pay for waste, they have a reason to use less packaging, choose recyclable materials and design products that can be repaired.
People cannot sort or reduce waste if they do not know how, or if facilities are far away. School programmes, labels on packaging, community clean-ups and campaigns by NGOs raise awareness and change social norms. Convenient access is just as important. Taiwan, once nicknamed “Garbage Island” because of overflowing dumps, introduced a recycling programme in 1989 and began enforcing the sorting of waste in the 1990s. Residents bring their rubbish and recyclables to collection trucks that play music such as Beethoven’s “Für Elise” to announce their arrival, and 33 recyclable items in 13 categories are collected.
Sources: Wikipedia, Waste management in Taiwan (2026).
Tool | Example | Strengths | Limitations |
|---|---|---|---|
Taxes and charges | Landfill tax; Taipei’s pay-per-bag system | Make polluters pay; raise money for services | Can encourage illegal dumping; may fall hardest on poor households |
Incentives | Lithuania’s deposit scheme; Curitiba’s Green Exchange | Very high return rates; clean recyclables | Covers only some products; needs infrastructure |
Social policies | Kamikatsu’s 45-category sorting | High recycling; strong community ownership | Time-consuming; hard to scale up to large cities |
Legislation | Bans on single-use plastics; extended producer responsibility | Applies to everyone; changes product design | Needs enforcement; industry resistance |
Education and campaigns | School waste audits; clean-up days | Changes values over the long term | Slow; knowing does not always lead to doing |
Access to facilities | Taiwan’s collection trucks; recycling points | Makes the sustainable choice easy | Costly to provide, especially in rural areas |
No single tool is enough on its own. Taiwan combined fees, sorting rules, convenient collection and education; Kamikatsu combined community commitment with access to a well-run sorting centre. Different environmental value systems favour different tools: a technocentric view emphasises better recycling technology and waste-to-energy plants, an anthropocentric view favours taxes, incentives and regulation that balance costs and benefits, and an ecocentric view argues for reducing consumption and changing values, at the top of the waste hierarchy.
Most waste management treats waste as a problem to be dealt with once it exists. The circular economy treats waste as a design failure. It aims to keep products and materials in use for as long as possible, at their highest value, and to regenerate natural systems, so that very little ends up as waste at all.
Applied to waste, this gives a holistic view of the whole product life cycle: the raw materials, manufacture, distribution, use and end of life of a product, and the choices at each stage that decide how much waste it creates. Products in a circular economy are designed to last, to be repaired, to be taken apart, and to have their materials recovered and used again.
Circular design is the opposite of planned obsolescence, in which products are deliberately designed to fail, become outdated or be impossible to repair after a limited time, so that consumers buy replacements. Sealed batteries, glued cases and software updates that slow down older devices are often given as examples, although manufacturers usually reject the charge.
A drinks can on the linear path begins as bauxite ore, mined in places such as Australia, Guinea and Brazil. The bauxite is refined into alumina, and the alumina is smelted into aluminium using very large amounts of electricity. The metal is rolled into sheet, formed into cans, filled, sold, used once and thrown into a bin that goes to landfill, or dropped as litter.
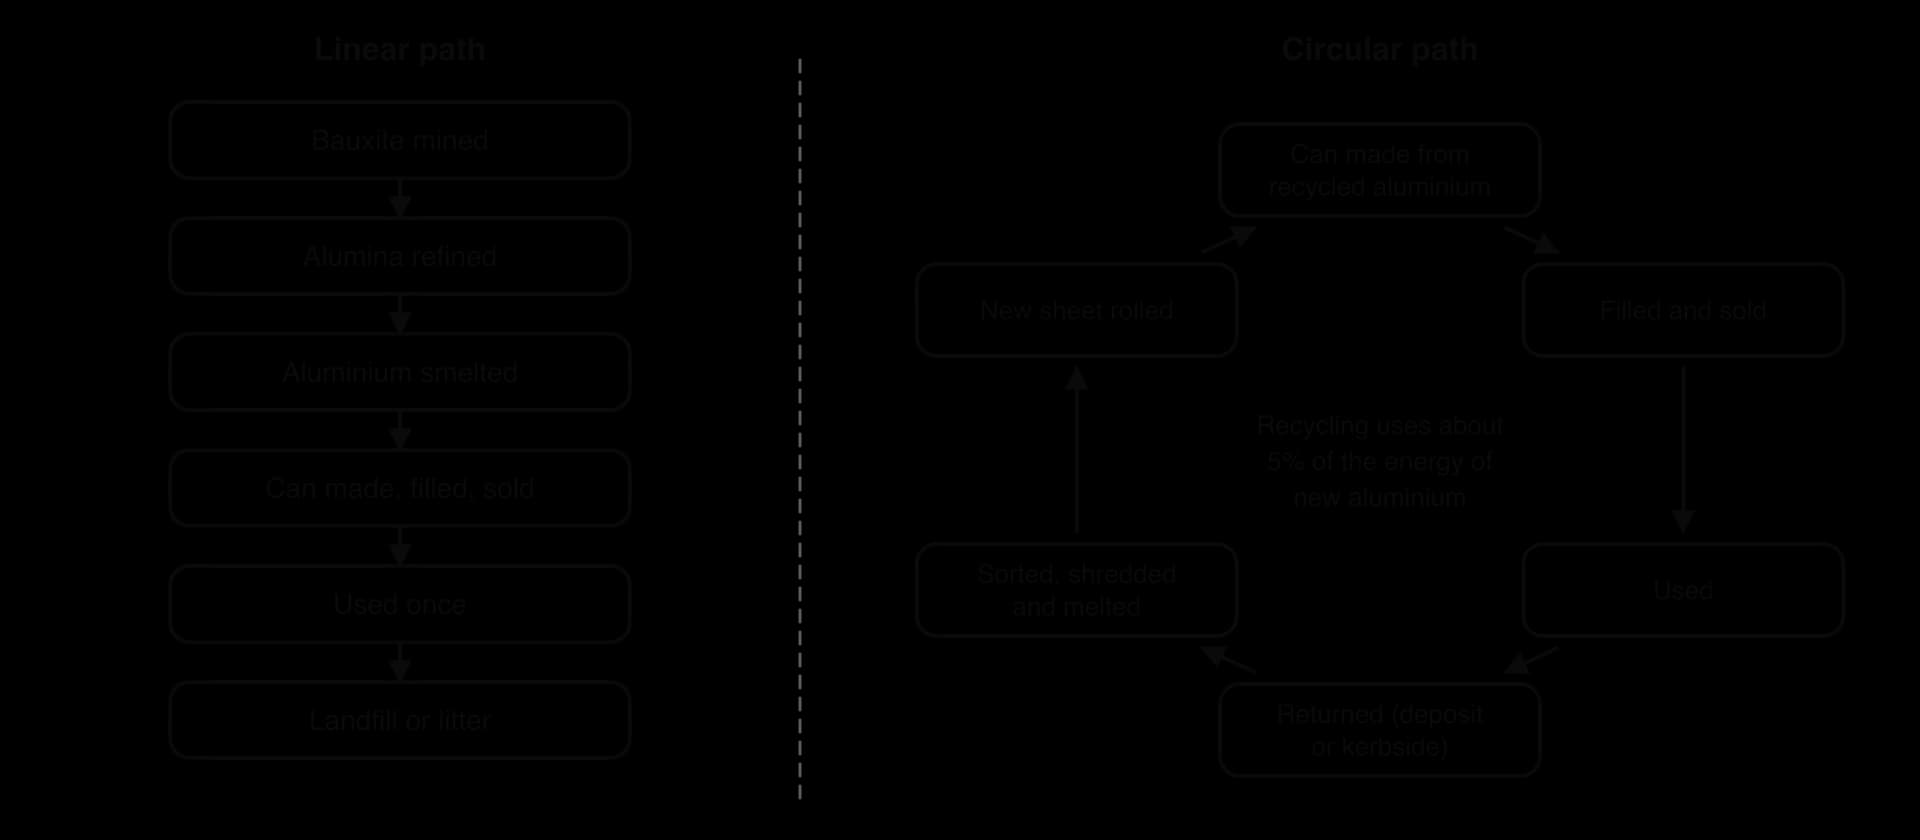
On the circular path, the empty can is returned through a deposit scheme or kerbside collection, sorted from other materials with magnets and eddy-current separators, shredded, melted and cast into new sheet for new cans. Aluminium can be recycled repeatedly without losing quality, and recycling it uses only about 5% of the energy needed to make new aluminium from bauxite. About 75% of all the aluminium ever produced, nearly a billion tonnes, is still in use.
Recovery rates show that the loop can be closed in practice. Brazil recycled about 98% of its aluminium cans by the late 2000s, many of them collected by informal waste pickers (catadores), for whom cans are among the most valuable materials. In Europe, Finland and Germany, both with deposit schemes, recycled 99% of drinks cans in 2023, while several countries without deposits recycled 26–37%, against a European average of 76.3%. The difference shows how much policy and access, rather than the material itself, decide whether a product follows the circular path.
Sources: Wikipedia, Aluminium recycling and Container-deposit legislation (2026).
Fairphone, a social enterprise founded in Amsterdam in 2013, makes modular smartphones that users can open and repair with a simple screwdriver, replacing the battery, screen or camera themselves. Every Fairphone model since the second has received the highest repairability score, 10 out of 10, from the repair website iFixit. The company uses recycled and fairly traded materials and offers warranties and software support of five years or more, aiming to keep each phone in use for many years rather than replacing it after a short time.
Fairphone shows the recovery strategies near the top of the waste hierarchy: maintenance and repair first, then refurbishment and resale, then recovery of the metals by recycling only at the very end. Its limitations are also clear: it sold about 145,000 phones in 2025, a tiny share of the world market, its phones cost more upfront than basic models, and circular design works only if consumers are willing to keep a phone for longer.
Sources: Wikipedia, Fairphone (2026).
 YouTube
For about 25 years, a large part of the world’s plastic and paper “recycling” took place in China. High-income countries collected recyclables at home, baled them and shipped them across the oceans, often in containers that would otherwise have returned empty after bringing Chinese manufactured goods to Europe and North America. Chinese factories used the cheap material to make new products, while low-grade and contaminated material was processed informally, dumped or burned.
The trade was a global system of flows: plastic waste moved from consumers in high-income countries through sorting and export to reprocessing in China, and new products moved back the other way. Between 1992 and 2016, China imported 106 million tonnes of plastic waste, 45.1% of all plastic waste imported by any country, worth US$57.6 billion. In 2016 alone it imported 7.35 million tonnes from 43 countries. Hong Kong acted as an entry port, re-exporting 63% of the plastic waste it received in 2016 to mainland China.
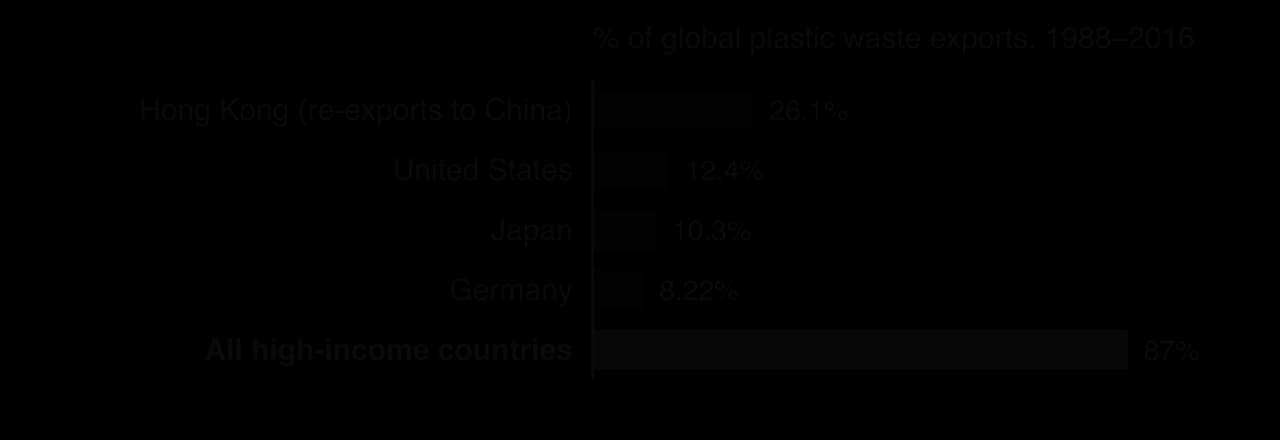
The exporters were overwhelmingly rich: high-income countries supplied 87% of all plastic waste exports between 1988 and 2016. Before the ban, about 70% of the plastic waste exported by the United States went to mainland China and Hong Kong. For exporting countries, the trade was cheaper than building their own sorting and reprocessing plants, and it allowed councils to report high recycling rates for material that was in fact being shipped away.
China had already tightened inspections of contaminated imports in 2013 under Operation Green Fence. In 2017 the government launched Operation National Sword to review recyclable imports more strictly, and on 18 July 2017 it notified the World Trade Organization that it would ban more solid waste imports. By the start of 2018, 24 categories of solid waste were banned, including low-grade plastics and unsorted mixed paper, and the permitted level of contamination in the remaining imports was cut from 5–10% to 0.5%. China’s imports of plastic waste fell by 99%.
China’s reasons were environmental, health-related and political. Informal recycling of contaminated imports had polluted rivers, soils and air in recycling towns, and the government wanted its own growing domestic waste to be recycled instead. “Foreign garbage” had also become a symbol that the government wished to remove as the country grew richer.
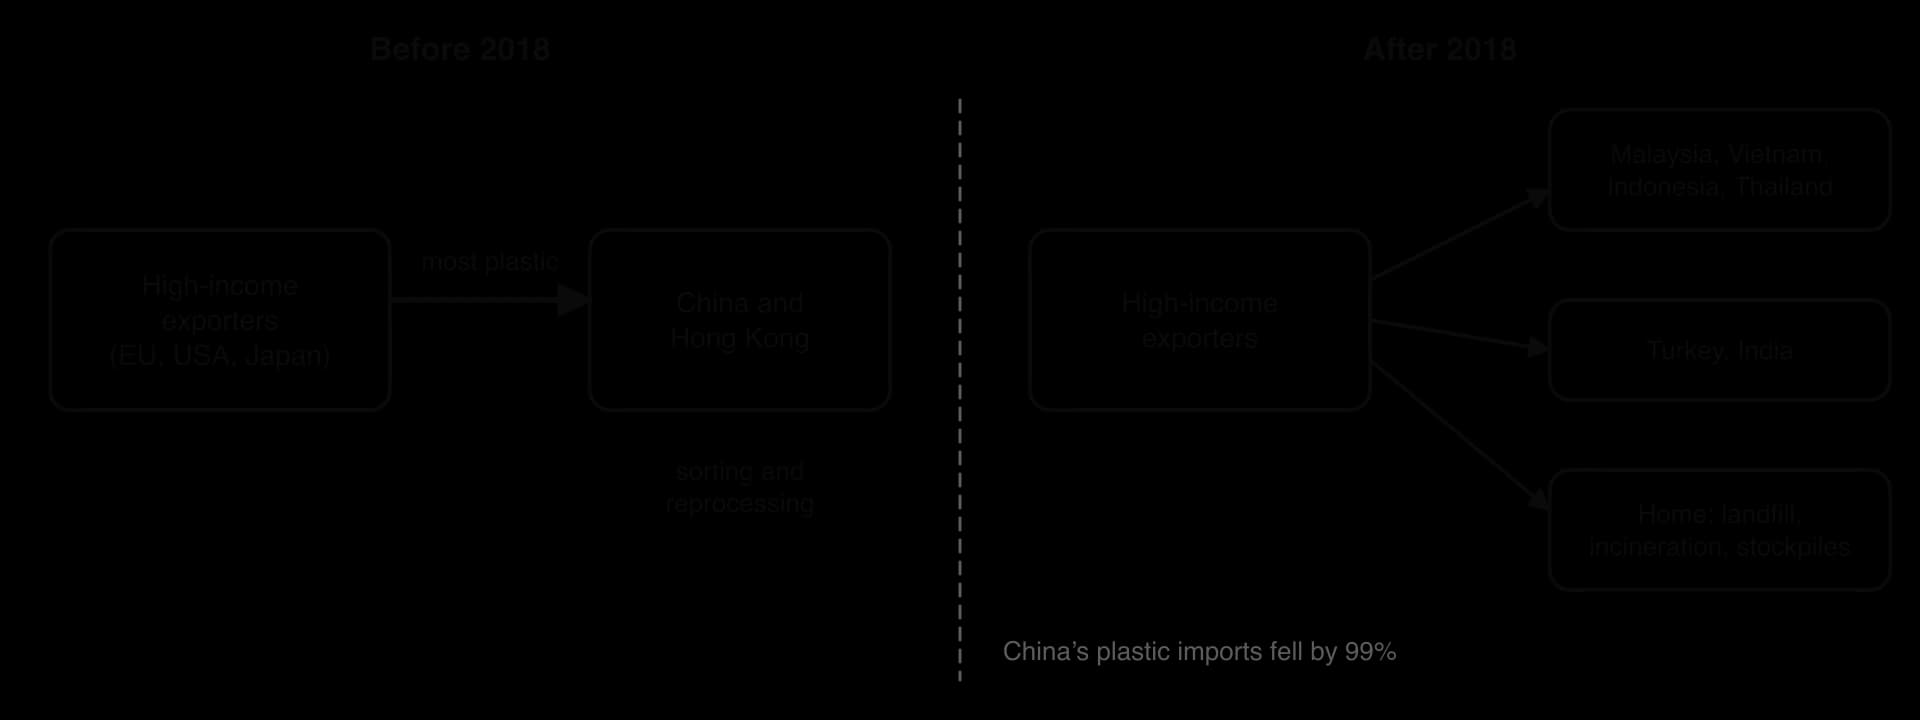
Waste backlogs built up in Europe and North America. Exporters redirected plastic waste to Malaysia, Vietnam, Thailand, Indonesia, Turkey and India, wherever buyers could be found, and some councils and companies landfilled or incinerated material that had previously been exported. By early 2019, several South-East Asian countries were also rejecting imports and sending containers of contaminated waste back. A 2018 study estimated that about 111 million tonnes of plastic waste would be displaced by China’s ban by 2030.
Sources: Wikipedia, Operation National Sword (2026); Brooks, Wang and Jambeck (2018).
International law: in May 2019, the parties to the Basel Convention adopted plastic waste amendments, which took effect on 1 January 2021. Exports of most mixed, contaminated or hazardous plastic waste now need the prior informed consent of the importing country; clean, sorted plastics of a few common types sent for recycling remain outside this consent procedure.
Importing countries: several South-East Asian governments tightened import rules, raided illegal recycling plants and returned shipments to the countries that sent them.
Exporting countries: some invested in domestic sorting and reprocessing, while others landfilled or burned more waste, or narrowed what households could put in recycling bins.
Researchers’ recommendations: the 2018 study proposed developing domestic markets for recycled plastic, reducing the use of plastic and redesigning packaging to be recyclable, regulating plastic waste under the Basel Convention, making producers and exporters legally responsible for the waste, and allowing importing countries to tax imports to pay for waste infrastructure.
Stakeholder | Perspective on the ban |
|---|---|
Chinese government | Protecting the environment and health at home and building a domestic recycling industry; ending the image of China as the world’s waste bin |
Exporting councils and recyclers in high-income countries | Sudden costs, falling prices for recyclables and full warehouses; pressure to improve sorting and find new markets |
Communities in new destination countries | Illegal processing plants, open burning and polluted water arrived with the redirected waste |
Zero-waste and environmental groups | Evidence that recycling exports hid overconsumption; argument for reducing plastic use and extended producer responsibility |
Plastic and packaging industry | Concern about higher costs and regulation; interest in recycled-content markets |
The ban reduced pollution from informal recycling in China, but in the short term much of the harm moved rather than disappeared. Waste that had been processed in China was shipped to countries with even weaker regulation, or was landfilled and burned in the exporting countries. This is a clear case of environmental injustice in the waste trade: the countries that consumed the most plastic had for decades passed the environmental and health costs of their waste to others, and when one destination closed they looked for another.
The longer-term effects were more positive. The ban exposed how little of the plastic placed in recycling bins was actually recycled at home, and only about 9% of all plastic waste ever produced has been recycled. It pushed governments towards international regulation through the Basel amendments and towards policies higher in the waste hierarchy, such as producer responsibility and bans on single-use items. From an ecocentric perspective, it showed that recycling had been used to justify overconsumption; from a technocentric one, it created a market for better domestic sorting technology.
National Sword shows that the volume and fate of waste depend on political decisions as well as on technology and income, that the impacts of waste can be felt far from where it was produced, and that exporting waste, though it appears in national statistics as recycling, often moves environmental costs to lower-income communities. It also shows why preventative strategies higher in the waste hierarchy, especially reducing the amount of plastic produced, are more sustainable than relying on recycling elsewhere.
Sources: Brooks, Wang and Jambeck, Science Advances 4: eaat0131 (2018); Wikipedia, Operation National Sword (2026); Basel Convention Secretariat, plastic waste amendments (2026).
Questions on solid waste test definitions and classifications, data on waste generation and disposal, the waste hierarchy and pollution management model, named examples of policies, and evaluation of strategies. Strong essays link waste to sustainability, environmental justice and the circular economy, and judge which strategies are most sustainable in a particular context.
Resource (hypothetical data). City Y, a fast-growing city of 2 million people, has one open dump that is nearly full. The table shows how its waste is managed.
2015 | 2025 | |
|---|---|---|
Waste generated (tonnes per day) | 1,200 | 1,800 |
Collected (%) | 55 | 70 |
Openly dumped (% of waste generated) | 50 | 55 |
Recycled by informal waste pickers (% of waste generated) | 5 | 8 |
Food and green waste (% of waste generated) | 60 | 56 |
Waste can be classified by source (domestic, industrial, agricultural) and by type (e-waste, food, biohazardous and others).
Solid domestic waste contains paper, cardboard, glass, metal, plastics, organic waste, packaging, construction debris and textiles; food and green waste is the largest component worldwide.
The volume and composition of waste vary with socio-economic, political, environmental and technological factors; global municipal waste was 2.56 billion tonnes in 2022 and could reach 3.86 billion tonnes by 2050.
Waste causes methane emissions, leachate, air pollution from burning and plastic pollution, and its harms often fall on the poorest communities and on waste pickers.
The waste trade moves waste from high- to lower-income countries, raising questions of environmental justice, as at Agbogbloshie and after China’s National Sword ban.
Waste becomes pollution when it is added faster than ecosystems can transform it; biodegradability and half-lives show how long materials persist.
Preventative strategies (changing behaviour and controlling release) are more sustainable than restorative clean-up, and reducing consumption is the most sustainable option.
Landfill, incineration and waste to energy, exporting, recycling and composting each have advantages and disadvantages for societies and ecosystems.
Taxes, incentives such as deposit schemes, social policies, legislation including extended producer responsibility, education, campaigns and access to facilities can all promote sustainable waste management.
Circular economy principles trace a product through its whole life cycle and keep materials in use, as the aluminium can and repairable phones show.
I can classify waste by source and by type, with examples.
I can outline the components of solid domestic waste and how they differ between income groups.
I can explain socio-economic, political, environmental and technological factors that change the volume and composition of waste.
I can discuss the impacts of waste, including the waste trade and environmental injustice.
I can explain when waste becomes pollution and use biodegradability and half-lives in calculations.
I can distinguish preventative from restorative strategies and place them on the pollution management model and waste hierarchy.
I can evaluate landfill, incineration, waste to energy, exporting, recycling and composting.
I can evaluate the tools used to promote sustainable waste management, with named examples.
I can trace a product such as an aluminium can through linear and circular paths.
I can use China’s National Sword ban as a case study of the waste trade.