
Construct systems diagrams, explain feedback, equilibria, tipping points and resilience, and evaluate models, using Daisyworld, Biosphere 2 and the collapse of a California kelp forest.
Each is in the ESS glossary, with every other term in the subject.
The proportion of incoming solar radiation reflected by a surface, from 0 to 1; snow and ice have a high albedo, dark ocean and forest a low one.
Two or more different conditions in which the same system can persist under similar circumstances, each maintained by its own feedback loops.
The part of the Earth system made or modified by humans, including cities, farmland, infrastructure, industry and the flows of materials they create.
A sealed research facility in Arizona, USA, built to test a materially closed life-support system; its 1991–1993 mission showed how hard such a system is to keep in balance.
A system that exchanges energy but not matter with its surroundings; Biosphere 2 and, approximately, the Earth and its global cycles are examples.
All the frozen water of the Earth system, including ice sheets, glaciers, sea ice, snow cover and permafrost.
A computer model of an imaginary planet with black and white daisies, published by Watson and Lovelock in 1983, showing how negative feedback through albedo can regulate a planet's temperature.
Outline what a system is and how a systems approach differs from a reductionist approach.
Construct systems diagrams with storages, flows, inputs, outputs and a system boundary.
Distinguish between transfers and transformations, and between open and closed systems.
Describe the Earth as a single integrated system and apply the system concept at local, regional and global scales.
Explain negative and positive feedback with diagrams, using Daisyworld and the ice–albedo feedback as examples.
Distinguish between steady-state, stable, unstable and developing equilibria.
Explain how positive feedback can push a system past a tipping point into an alternative stable state.
Evaluate the uses and limitations of models, including the loss of accuracy that comes with simplification.
Describe emergent properties such as predator–prey oscillations and trophic cascades.
Explain how diversity, storage size and time lags affect resilience, and how human activity reduces it.
A system is a set of parts that interact so that they work as a whole. A pond, a forest, a farm, a city and the whole Earth can all be studied as systems, because in each of them matter and energy move between parts that depend on one another. Thinking in systems makes it possible to follow how a change in one part, such as warmer water or the loss of a predator, spreads through everything else.
Systems are one of the three foundation ideas of environmental systems and societies, together with perspectives and sustainability. The same tools appear in every later topic: the carbon cycle and
The official deck for this part of the syllabus.
What is a system?
State three types of component that a system can contain.
With a free account, Augment remembers where you stopped and what you have practiced.
The clearing of forest and conversion of the land to another use, such as farming, mining or settlement, removing the forest's storages of biomass and much of its diversity.
The planet viewed as a single integrated system in which the biosphere, hydrosphere, cryosphere, geosphere, atmosphere and anthroposphere are linked by flows of energy and matter.
A characteristic of a system that arises from the interactions between its components and is not shown by any component on its own.
A state of balance in a system, in which opposing flows or processes cancel out so that there is no overall change in the system.
The return of part of the output of a process to affect the same process, so that a change in a system either reduces itself (negative) or increases itself (positive).
The movement of energy or matter between storages, or into or out of a system, measured as a rate and drawn as an arrow in systems diagrams.
The model, proposed by James Lovelock and developed with Lynn Margulis, of the Earth as a single self-regulating system in which life and its surroundings interact through feedback to keep conditions suitable for life.
The solid, non-living part of the Earth system, made of rocks, minerals, sediments and soil, including the lithosphere.
A way of studying a situation by looking at the whole system and the interactions between its parts, rather than at each part separately.
All the liquid water on and near the Earth's surface, including oceans, lakes, rivers and groundwater, considered as one part of the Earth system.
The property of a system in which the path of recovery differs from the path of collapse, so a pressure must be reduced well below the level that caused a regime shift before the original state returns.
A flow of energy or matter that crosses the boundary into a system, such as sunlight or rainfall entering an ecosystem.
A theoretical system that exchanges neither energy nor matter with its surroundings; no true example exists on Earth.
The rigid outer layer of the solid Earth, made of the crust and the uppermost mantle, which forms the base of soils and landforms.
A simplified representation of reality, such as a diagram, graph, equation, simulation or description, used to understand how a system works and to predict its response to change.
A feedback loop in which the output of a process inhibits or reverses the same process, reducing change and stabilising a system around its equilibrium.
A system that exchanges both energy and matter with its surroundings across its boundary; almost all natural ecosystems are open systems.
A flow of energy or matter that crosses the boundary out of a system, such as heat lost by respiration or water leaving in a river.
A feedback loop in which a disturbance leads to amplification of that disturbance, destabilising a system and driving it away from its equilibrium.
Regular, linked rises and falls in the populations of a predator and its prey, with the predator lagging behind the prey; an emergent property of their interaction.
A way of studying a situation by breaking it into its separate parts and investigating each part or relationship on its own, often by controlled experiment.
A large, rapid and persistent change in the structure and functioning of a system as it moves from one stable state to an alternative stable state.
The tendency of an ecological or social system to avoid tipping points and maintain stability; its capacity to resist damage and to recover from, or adapt to, disturbance.
A system in which a natural ecosystem and a human society are linked so closely, through resource use and management, that each can only be understood together with the other.
An equilibrium to which a system tends to return after a disturbance, because negative feedback restores its previous state.
The condition of an open system in which flows continue but inputs are balanced by outputs, so its storages stay approximately constant over time.
A part of a system in which matter or energy is held for a period of time, such as water in a lake or carbon in forest biomass; drawn as a box in systems diagrams.
A set of interacting or interdependent components organised to form a functional whole, such as a pond, a forest, a city or the whole Earth.
The real or chosen edge of a system, which decides which flows count as inputs and outputs; often drawn as a dashed line in systems diagrams.
A holistic way of visualising and analysing a complex set of interactions, in which a situation is represented as storages linked by flows of energy and matter.
A model of a system in which storages are shown as boxes and flows as labelled arrows pointing in the direction of movement, with inputs and outputs crossing a boundary.
The delay between a change in an input or flow of a system and the full response of the system to that change, usually longer where storages are large.
The minimum amount of change within a system that will cause it to destabilise, after which it shifts to a new equilibrium or alternative stable state.
A flow in which energy or matter changes location but not its nature, such as water flowing down a river or a herbivore eating a plant.
A flow in which energy or matter changes its chemical nature, its state or its form of energy, such as photosynthesis, evaporation or combustion.
A series of indirect effects passing through several trophic levels when the abundance of a top predator changes, such as predators reducing herbivores and allowing plants to recover.
An equilibrium from which a system, once disturbed, moves away and settles into a new and different equilibrium instead of returning.
Every system is made of components: living things, non-living stores of matter, or human structures such as farms and factories. What turns a collection of components into a system is that they interact. Rabbits eat grass, foxes eat rabbits, and the droppings of both return nutrients to the soil that the grass grows in. Remove one component and the others change.
Ecologists, geographers and economists all use systems. A system can be natural (a coral reef), human (a transport network) or a mixture of both. Most environmental issues involve a socio-ecological system, in which a natural system and a human society are linked so closely that neither can be understood alone. A fishery is an example: the fish population, the fishing fleet, market prices and fishing rules all affect one another.
A systems approach studies how the parts of a system are connected rather than studying each part separately. It asks questions such as: Where does the energy come from and where does it go? Which parts store matter, and for how long? What happens elsewhere if one flow becomes larger?
The systems approach is holistic: it looks at the whole set of interactions. Traditional laboratory science is often reductionist: it breaks a problem into small parts and studies each part on its own, for example by measuring how one fertiliser affects the growth of one crop in a controlled experiment. Both approaches are useful. Reductionist experiments give precise, reliable results about single relationships; the holistic view shows how those relationships combine, and often explains outcomes that no single experiment would predict.
Reductionist approach | Holistic (systems) approach | |
|---|---|---|
Focus | One part or one relationship at a time | The whole system and the connections between its parts |
Typical method | Controlled experiment, other variables held constant | Systems diagrams, models, field observation, long-term monitoring |
Strength | Precise, repeatable, shows cause and effect clearly | Shows indirect effects, feedback and unexpected outcomes |
Limitation | Can miss interactions between parts | Less precise; many variables change at once |
Example | Measuring the effect of nitrate concentration on algal growth in flasks | Tracing how fertiliser run-off changes a whole lake food web |
A systems approach is especially useful for environmental issues because they cross the boundaries between subjects. Soil erosion, for instance, involves rainfall and slope (physical geography), plant roots (ecology), farming methods (agriculture), land ownership and prices (economics) and government policy (politics). Seeing all of these as parts of one system helps to explain why a single technical fix often fails.
Every system can be described with a small set of terms. A storage (or store) is a place where matter or energy is held: biomass in trees, water in a lake, carbon in the atmosphere. A flow is the movement of matter or energy from one storage to another, or into or out of the system. Flows that enter a system are inputs; flows that leave it are outputs.
Flows are processes, and they have a rate: an amount per unit time. Rainfall adds water to a lake at so many cubic metres per day; photosynthesis fixes so many grams of carbon per square metre per year. Storages are amounts at one moment in time. This difference matters when reading data, because a large storage can have a small flow through it, and a small storage can have a very fast one.
The system boundary marks the edge of the system that is being studied. Some boundaries are physical, such as the shore of a lake or the walls of a greenhouse. Many are chosen by the person studying the system: the boundary of a "forest system" could be drawn around one tree, one hectare or a whole national park. Where the boundary is drawn decides which flows count as inputs and outputs.
A systems diagram shows the structure of a system in a simple, standard way. Storages are drawn as boxes (usually rectangles) and flows as arrows, with each arrow pointing in the direction of the flow and labelled with the process that causes it. Inputs and outputs cross the system boundary, which is often drawn as a dashed line.
The size of a box or the width of an arrow can be drawn in proportion to the size of a storage or flow. This turns the diagram into a quick visual summary of where most matter or energy is held and which routes carry the most. The diagram then becomes a simple quantitative model, not only a sketch of what is connected.
Storages: boxes, each labelled with what is stored (and the amount, if known).
Flows: arrows labelled with the process, such as "evaporation", "feeding" or "decomposition", and the rate where data exist.
Inputs and outputs: arrows that cross the boundary; the boundary itself drawn as a dashed line.
Proportion (optional): wider arrows and larger boxes for larger flows and storages.
All flows fall into one of two groups. In a transfer, matter or energy moves to a new place but stays the same thing. In a transformation, matter or energy changes into something different: a new chemical, a new state or a new form of energy.
Water running downhill, wind carrying seeds and a bird migrating between continents are all transfers: something moves, but it is the same water, seed or bird when it arrives.
Eating is usually classed as a transfer, because the biomass of the plant moves into the herbivore. Digestion and respiration inside the herbivore are transformations, because the chemicals in the food are broken down and their energy is released partly as heat. The same event can therefore contain both kinds of flow, and the label depends on which part of the process the arrow represents.
Flow | Transfer or transformation? | Why |
|---|---|---|
Water flowing down a river to the sea | Transfer | Water changes location only |
Evaporation of sea water | Transformation | Change of state, liquid to gas |
A fox eating a rabbit | Transfer | Biomass moves from one organism to another |
Photosynthesis | Transformation | Light energy becomes chemical energy; CO₂ and water become glucose |
Respiration | Transformation | Chemical energy is released as heat; glucose becomes CO₂ and water |
Leaves falling to the forest floor | Transfer | Organic matter moves from the canopy to the litter layer |
Decomposition of leaf litter | Transformation | Organic matter becomes inorganic nutrients, CO₂ and heat |
Wind carrying dust across an ocean | Transfer | Particles change location only |
Burning fossil fuels | Transformation | Chemical energy becomes heat; carbon compounds become CO₂ |
The pond diagram puts these ideas together. Sunlight enters as an input and is transformed into chemical energy by photosynthesis. Biomass is transferred along the food chain by feeding and to the dead organic matter by death. Decomposition transforms dead matter back into dissolved nutrients, which are transferred into producers again. Energy leaves as heat from respiration, a transformation, and matter leaves as water flowing out of the pond or fish taken by herons, both transfers.
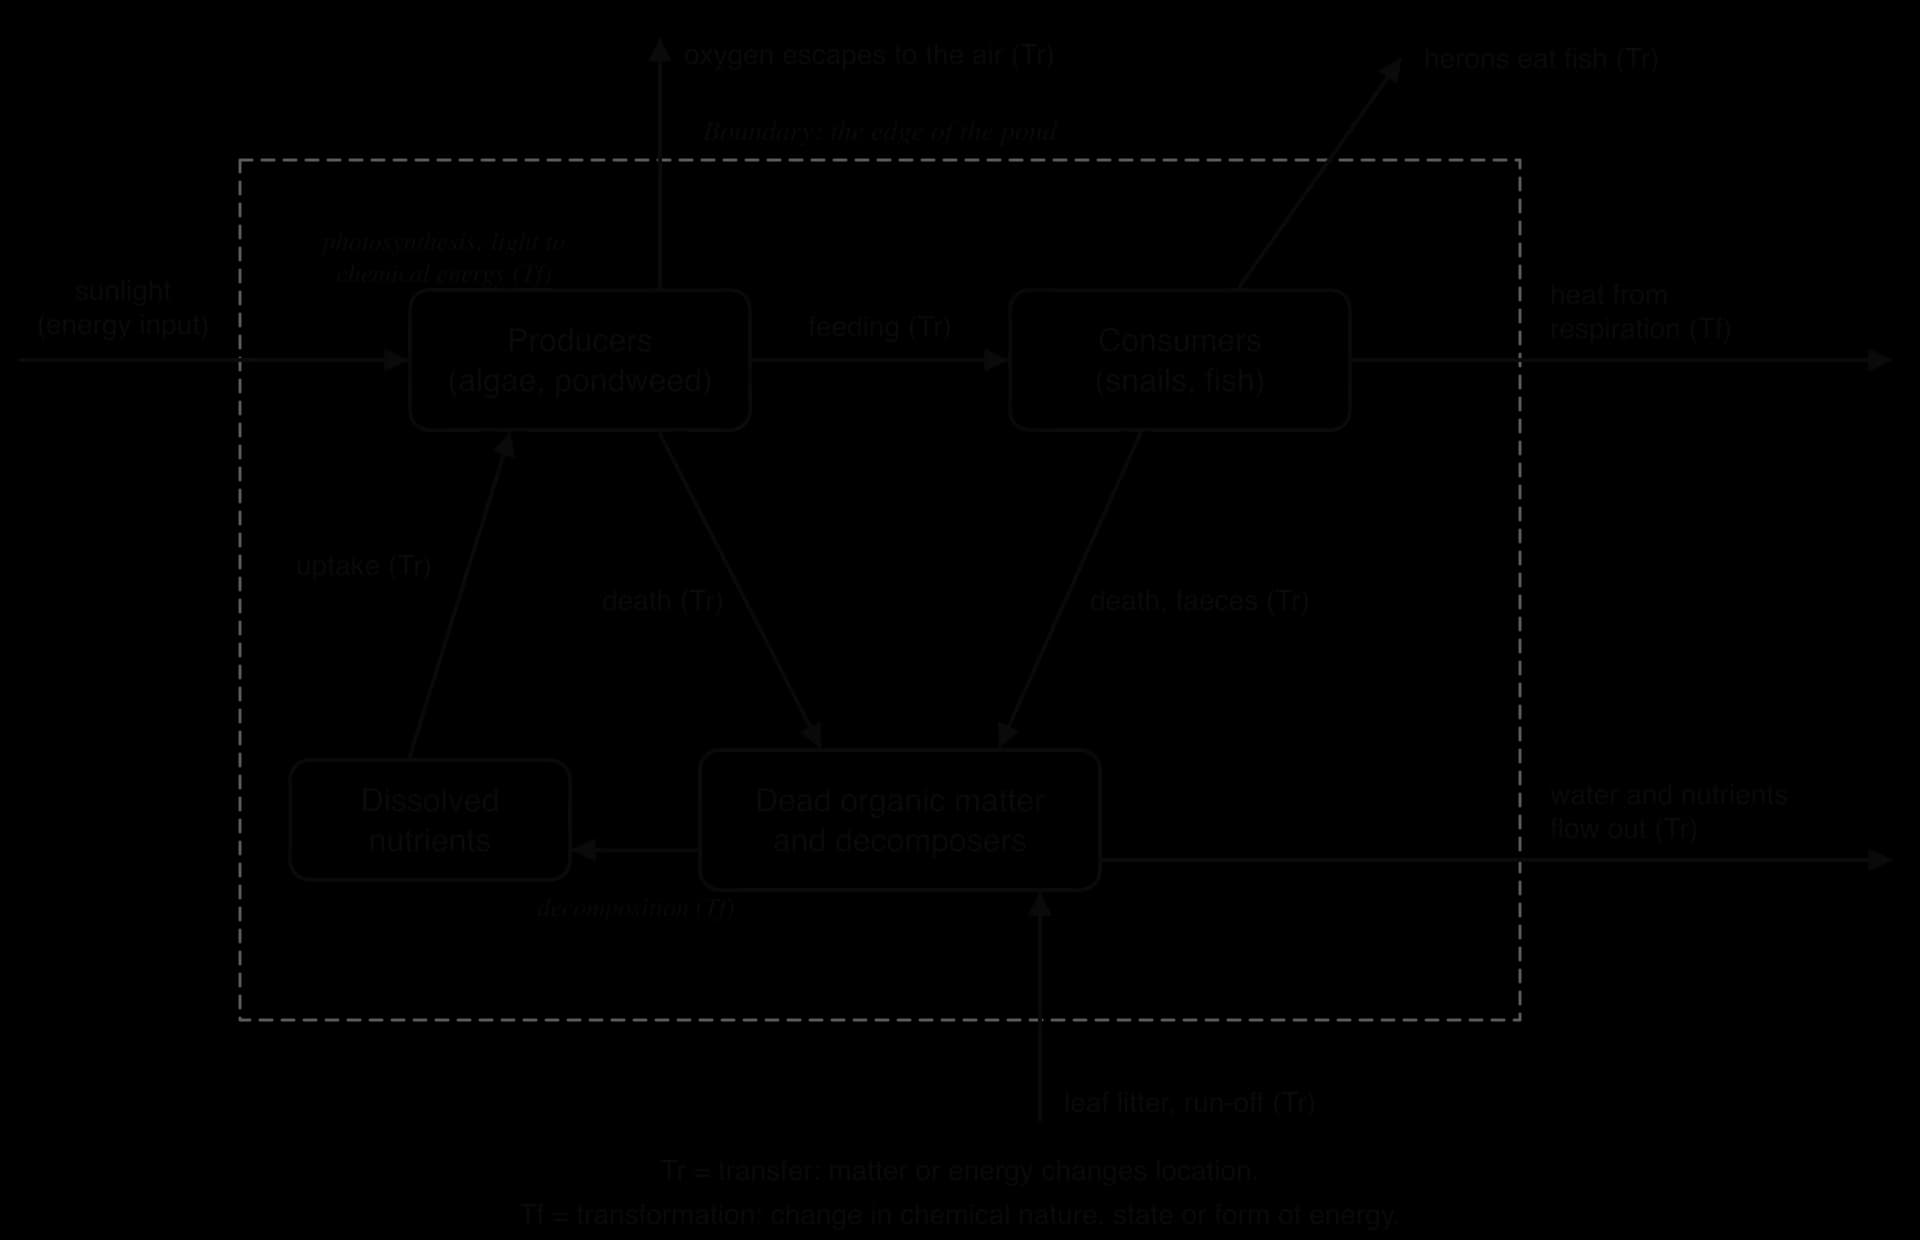
Systems are classified by what can cross their boundary. In an open system, both energy and matter move in and out. In a closed system, energy crosses the boundary but matter does not. A third type, the isolated system, exchanges neither energy nor matter; it is a theoretical case used in physics, and environmental systems are always described as open or closed.
The difference between the two lies only in matter. Both receive energy, usually as sunlight, and both lose energy, usually as heat.
Almost every real system is open. A forest receives sunlight, rain, seeds and migrating animals, and loses heat, water vapour, stream water and timber. A city takes in food, fuel, water and people, and gives out waste, sewage, heat and manufactured goods. Local ecosystems are therefore always treated as open systems.

Closed systems are rare and usually artificial. At the global scale, the Earth comes close to being closed: it receives energy from the Sun and radiates heat to space, but very little matter arrives (meteorites, dust) or leaves (light gases escaping from the upper atmosphere). For this reason the global cycles of carbon, nitrogen and water are treated as approximately closed systems.
Biosphere 2 is a sealed glass and steel structure of about 1.27 hectares at Oracle, Arizona, USA, built between 1987 and 1991. It contained a rainforest, a savanna, a desert, a mangrove wetland, a small "ocean" with a coral reef, and a farm. From September 1991 to September 1993 eight people lived inside, aiming to grow all their food and recycle all their air and water. Energy (sunlight and electricity) crossed the boundary, but matter was meant to stay inside, so the building was designed as a materially closed system.

The experiment showed how difficult it is to keep a closed system in balance. The oxygen concentration of the air fell steadily from 20.9% to 14.5% over 16 months, and extra oxygen had to be pumped in during 1993. Two processes explain the fall. Soil microbes in the rich, newly added soils respired faster than the plants photosynthesised, using oxygen and producing carbon dioxide. The carbon dioxide then reacted with the exposed concrete of the building to form calcium carbonate, locking away both carbon and oxygen. Many species of plants and animals died out inside, and the crew reported constant hunger in the first year.
If soil respiration alone had used the oxygen, carbon dioxide in the air should have risen by a matching amount. It did not, which puzzled the scientists. Isotope analysis later showed that the missing carbon dioxide had reacted with concrete inside the building. This "hidden" storage had not been included in the designers’ model of the system, a reminder that leaving out one storage or flow can make a model badly wrong.
Biosphere 2 is still useful to environmental science. It shows that the Earth’s life-support services, such as keeping oxygen and carbon dioxide in balance, are provided by systems far larger and more complex than any people have been able to build. It also shows that a closed system has no outside source of matter to correct an imbalance, so small errors accumulate.
Sources: University of Arizona Biosphere 2; Wikipedia, "Biosphere 2" (2026).
At the largest scale, the whole planet works as one integrated system, the Earth system. Scientists divide it into spheres, each a major storage of matter, linked by flows of energy and matter. The biosphere is all living things; the atmosphere is the layer of gases; the hydrosphere is liquid water in oceans, lakes, rivers and underground; the cryosphere is frozen water in ice sheets, glaciers, sea ice and permafrost; the geosphere is the solid Earth of rocks and soil, whose rigid outer layer is the lithosphere; and the anthroposphere is the part of the Earth made or changed by people, including cities, farms, roads and mines.

Each sphere is itself a storage, or a group of storages, and the flows between them are the transfers and transformations that link the whole planet.
Sphere | Main storages | Example flow to another sphere |
|---|---|---|
Atmosphere | Nitrogen, oxygen, water vapour, carbon dioxide | Precipitation transfers water to the hydrosphere |
Hydrosphere | Oceans, lakes, rivers, groundwater | Evaporation transforms liquid water into water vapour in the atmosphere |
Cryosphere | Ice sheets, glaciers, sea ice, permafrost, snow | Meltwater transfers water to rivers and the sea |
Geosphere (incl. lithosphere) | Rocks, sediments, soil, fossil fuels | Weathering releases mineral nutrients to soil water and plants |
Biosphere | Living organisms and their biomass | Photosynthesis removes CO₂ from the atmosphere |
Anthroposphere | Cities, farmland, infrastructure, livestock | Burning fossil fuels moves carbon from the geosphere to the atmosphere |
The anthroposphere is now large enough to change the other spheres at a global scale. Human activity, through farming, mining and construction, moves more rock and soil each year than rivers carry to the oceans, has raised the concentration of carbon dioxide in the atmosphere and has converted much of the land surface to farmland. Treating human societies as part of the Earth system, rather than outside it, is central to how environmental issues are analysed.
The system concept works at any scale, from a few millilitres of water to the whole planet. The same terms (storages, flows, inputs, outputs, boundaries) apply at each one, but the boundary, the time scale and the flows that matter change.
Small scale: a bromeliad tank. Many bromeliads, plants of the pineapple family that grow on rainforest branches in Central and South America, hold a small pool of rainwater in the centre of their leaf rosette. This phytotelma (a "plant pond") is a complete small system: falling leaves and insects are its inputs, algae, mosquito larvae, tiny crustaceans and sometimes tadpoles of poison dart frogs live in it, and nutrients released by decomposition are absorbed by the plant.
Ecosystem scale: a tropical rainforest. The boundary is the edge of the forest. Inputs include sunlight, rain and nutrients from weathering and dust; outputs include river water, water vapour, heat and timber. The forest stores carbon in trees and soil and recycles most nutrients internally.
Global scale: atmospheric circulation or the Earth system. Heat is transferred from the equator towards the poles by winds and ocean currents, a flow that only makes sense when the whole planet is the system.
Choosing the scale is part of any systems analysis. A study of a single field might treat the farm’s fertiliser as an input from outside; a study of the global nitrogen cycle would treat the same fertiliser as a flow from the atmosphere (where the nitrogen came from) to the soil.
In the 1960s and 1970s the British scientist James Lovelock, working with the American microbiologist Lynn Margulis, proposed that the Earth behaves as a single self-regulating system. The Gaia hypothesis states that living organisms interact with the atmosphere, oceans and rocks in ways that keep conditions on the planet suitable for life. Lovelock developed the idea while working on ways of detecting life on Mars: he noticed that the Earth’s atmosphere, rich in reactive oxygen and methane together, is far from the chemical equilibrium seen on lifeless planets such as Mars and Venus, which suggested that life was constantly maintaining it.
The hypothesis was introduced to explain how the composition of the atmosphere and the temperature of the Earth are linked through feedback control. The Sun’s energy output has increased by about 25–30% since life began, yet the Earth’s surface has stayed within the range that liquid water and living things need. Supporters of Gaia argue that biological processes, such as the removal of carbon dioxide by photosynthesis and by the formation of limestone from shells, help to hold temperature in that range.
Early versions of the hypothesis were criticised as teleological: they seemed to suggest that life regulates the planet on purpose. The evolutionary biologists W. Ford Doolittle and Richard Dawkins argued that natural selection acts on individual organisms, not on whole planets, so there is no mechanism by which organisms could evolve to keep the Earth comfortable for all life. Others point to events in Earth history when life destabilised the environment, such as the rise of oxygen produced by early photosynthesising bacteria, which was toxic to many existing microorganisms.
Lovelock accepted that the Earth does not act with purpose and responded with a model designed to show that regulation can arise automatically, without any planning by organisms. Today many scientists regard the strong form of Gaia (life keeps conditions optimal) as untestable, while accepting a weaker form: life and the environment have evolved together and are linked by feedback. Earth system science, which studies the planet as interacting spheres, grew partly out of this debate.
Sources: Wikipedia, "Gaia hypothesis" and "Daisyworld" (2026); Watson and Lovelock (1983), _Tellus._
Systems respond to change. When one part of a system changes, the change passes along flows to other parts, and sometimes it comes back round to affect the part where it started. This return of information or effect is called feedback. The path it follows is a feedback loop.
Feedback loops are the reason why many systems stay remarkably stable, and also the reason why some change suddenly and dramatically. The direction of the loop decides which happens.
Negative feedback occurs when the result of a change works against that change. If something increases, the system responds in a way that decreases it, and if it decreases, the response increases it. Negative feedback therefore keeps a system close to a set level and is stabilising.
Human body temperature is a familiar example. When the body becomes too hot, sweating and wider blood vessels in the skin increase heat loss, so the temperature falls back towards about 37 °C. When the body becomes too cold, shivering and narrower skin blood vessels raise it again. The response always opposes the original change.

Ecosystems have many negative feedback loops. In a predator–prey relationship, more prey means more food for predators, so the predator population grows; more predators then eat more prey, so the prey population falls; with less food, predators decline, and the prey can recover. The interaction holds both populations within limits. Competition for food or space works in a similar way: when a population grows beyond what resources can support, shortages raise the death rate and lower the birth rate until numbers fall again.
Daisyworld is a computer model published by Andrew Watson and James Lovelock in 1983 to show how negative feedback involving living things could regulate a planet’s temperature. It was built to answer the critics of the Gaia hypothesis by showing that regulation can emerge from ordinary growth and competition, with no purpose or planning by the organisms.
Daisyworld is an imaginary planet orbiting a star that slowly becomes brighter, like the Sun. It has no greenhouse effect, plenty of water and nutrients, and only two kinds of life: black daisies and white daisies. Both grow best at the same temperature and cannot grow if it is too cold or too hot. The only difference between them is colour, and therefore albedo, the proportion of incoming sunlight that a surface reflects.
When the star is dim, the planet is cold. Black daisies absorb more sunlight than bare ground and warm themselves, so they grow better than white daisies and spread. As the planet becomes darker, its albedo falls, it absorbs more energy and it warms towards the daisies’ ideal temperature.
As the star brightens, the planet starts to overheat. White daisies, which reflect sunlight and stay cooler, now grow better and spread. The planet’s albedo rises, more sunlight is reflected, and the planet cools back towards the optimum.
Over a long period of increasing brightness, the mix of daisies shifts gradually from mostly black to mostly white, and the planet’s temperature stays close to the optimum.
Only when the star becomes so bright that even a fully white planet is too hot do the daisies die. The temperature then jumps to the value a lifeless planet would have.

The model’s output is most striking when compared with a lifeless planet. Without daisies, the temperature rises steadily as the star brightens. With daisies, it stays almost level over a wide range of brightness. The daisies are not trying to control the climate; each daisy simply grows where conditions suit it, and the regulation of the whole planet results from their combined effect on albedo.

 YouTube
Strengths | Limitations |
|---|---|
Shows clearly that self-regulation can arise from local growth and competition, with no purpose | Extremely simplified: one variable (temperature), two species, no atmosphere, no animals |
Easy to understand and to run as a simulation | The daisies change their local and global temperature in the same direction, a special case that is uncommon in real ecosystems |
Later versions with more species, grazers and predators were even more stable, which links diversity to stability | Depends on an assumed death rate and other set values; changing them can make regulation fail |
Encouraged the scientific study of feedback between life and climate | Cannot be tested directly against the real Earth; it shows what is possible, not what happens |
Sources: Wikipedia, "Daisyworld" (2026); Watson and Lovelock (1983).
Positive feedback occurs when the result of a change reinforces that change. An increase leads to a further increase, or a decrease leads to a further decrease. Positive feedback therefore amplifies change and pushes a system further away from where it started: it is destabilising.
The best-known environmental example is the ice–albedo feedback in the Arctic. Sea ice has a high albedo and reflects most of the sunlight that reaches it; open ocean is dark and absorbs most of it. When the Arctic warms, sea ice melts and the area of open water grows. The dark water absorbs more solar energy, which warms the ocean and the air above it, which melts more ice. The loop runs on, each turn making the next stronger.

Satellite measurements since 1979 show the result. The area of Arctic sea ice left at the end of the summer melt season, in September, has fallen by more than a third. Year-to-year variation is large because weather differs from summer to summer, but the downward trend is clear, and the loss of reflective ice is one reason the Arctic has warmed faster than the global average.

Positive feedback does not always mean growth. It can drive a decrease just as strongly. A small, declining population of animals has fewer breeding adults, so fewer young are born, so the population declines further. A growing population, by contrast, has more breeding adults and so the potential for even faster growth. In both cases the change feeds on itself.
From the 1960s, river water feeding the Aral Sea in Central Asia was diverted to irrigate cotton, and the sea shrank. The exposed seabed became a salt-and-dust desert, and the smaller water body no longer moderated the local climate, so the annual range of temperature widened by several degrees and storms carried more salty dust. Windblown salt settled on surrounding fields, which then needed extra irrigation water to flush the salt away, taking still more water from the rivers. The shrinking sea created conditions that made further shrinking more likely, a positive feedback that links a natural system and a farming society.
Sources: Wikipedia, "Aral Sea" (2026).
 YouTube
Equilibrium is a state of balance in a system: the opposing processes acting on it cancel out, so it shows no overall change. In living systems this balance is never still. Plants grow and die, animals are born and eaten, water arrives and leaves, but the storages stay roughly the same size because the flows balance.
Most natural systems are open, with energy and matter constantly flowing through them. When the inputs to such a system match its outputs over time, its storages stay about the same size. This is a steady-state equilibrium. A mature forest is an example: each year it fixes carbon by photosynthesis and loses roughly the same amount by respiration and decomposition, so its total biomass hardly changes, even though large flows of carbon pass through it.
A lake whose level stays the same from year to year is another example: rainfall and river inflow are balanced by evaporation, outflow and seepage. The level rises after a wet month and falls in a dry one, but these fluctuations are small and there is no long-term trend. The balance is held by negative feedback: a higher lake loses more water by outflow and evaporation, which brings the level back down.
Some systems are not balanced at a fixed level but are moving towards one. During succession, the gradual change in a community over time, an ecosystem on bare ground builds up soil, biomass and species until it reaches a mature climax community. While this happens the storages grow, but the system still stays near a stable path of development, because negative feedbacks steer it. This is sometimes called a developing equilibrium. Once the climax is reached, the system settles into a steady state.

Equilibria also differ in how they respond to a disturbance, such as a storm, a fire or a disease outbreak. In a stable equilibrium, the system tends to return to its previous state after the disturbance, because negative feedback pulls it back. A grassland that is grazed hard for one season and then regrows to its former state is in stable equilibrium.
In an unstable equilibrium, a disturbance moves the system away from its previous state, and it settles into a new and different equilibrium instead of returning. This happens when positive feedback takes over. A forest cleared and then overgrazed so that its soil erodes may never return to forest; it may settle instead as scrub or grassland.

Most ecosystems exist in a stable equilibrium most of the time, either in a steady state or developing through succession, and negative feedback maintains them. The important question for environmental management is how large a disturbance they can take before the equilibrium stops being stable.
A system held in stable equilibrium by negative feedback can absorb many small changes. If pressure on it keeps increasing, however, positive feedback loops may become stronger than the stabilising ones. The point at which this happens is a tipping point. Once it is passed, the system changes rapidly and moves to a new equilibrium.
Positive feedback tends to drive a system towards a tipping point. Each turn of a positive loop makes the next turn stronger, so once a threshold is crossed the change speeds up and becomes self-sustaining. Before the threshold, the system may have looked stable for a long time, which is why tipping points often come as a surprise.
After a tipping point the system does not simply become chaotic. It usually settles into a different, internally stable condition with its own set of negative feedbacks. Ecologists call the two possible conditions alternative stable states, and the sudden switch from one to the other a regime shift.
The ball-and-cup model shows the idea. The system is a ball and each stable state is a valley in a surface of hills and valleys. Negative feedback is the slope that rolls the ball back to the valley floor after a push. As pressure on the system grows, the valley becomes shallower: the system is still in the same state but is losing resilience. Eventually a small push is enough to send the ball over the ridge into the other valley, and once there it is held by that valley’s slopes.

A small alteration in one component can therefore produce a large change in the whole system. Tipping points of this kind occur in lakes, coral reefs, kelp forests, grasslands, forests, fisheries and the climate system. The collapse of the cod fishery off Newfoundland in the early 1990s, after which the ecosystem settled into a new state that did not return to cod dominance for decades, is one widely studied example.
Shallow lakes show alternative stable states especially clearly. In the clear-water state, rooted underwater plants (macrophytes) cover the lake bed. They take up nutrients, shelter animal plankton that eat algae, and hold the sediment in place, so the water stays clear and the plants get the light they need. This is a set of negative feedbacks that maintain the clear state.
When nitrate and phosphate concentrations rise, often from farm run-off or sewage, algae multiply in a process called eutrophication. Above a threshold, the algae shade out the plants, the plants die, and without them sediment is stirred up and nutrients are released. The lake flips to a turbid state dominated by algae, which has its own positive feedbacks keeping it cloudy.
Lake Veluwe, a shallow lake in the Netherlands, was studied for more than 30 years. Its plant-dominated clear state disappeared in the late 1960s when total phosphorus rose above about 0.20 mg L⁻¹. After nutrient inputs were cut, the lake did not recover at the same level: clear water returned only when total phosphorus fell below about 0.10 mg L⁻¹, and full recovery also needed bottom-feeding bream to be reduced, because their feeding kept the sediment stirred up. The return path differing from the collapse path is called hysteresis.

Sources: Ibelings et al. (2007), _Ecosystems 10; Scheffer et al. (2001), Nature 413._
Hysteresis has a practical consequence. Restoring a system after a regime shift is usually slower and more expensive than preventing the shift, and simply removing the cause may not be enough. This is one argument for the precautionary principle: acting before a threshold is reached, even when its exact position is uncertain.
The system may look stable until just before the shift. Loss of resilience (a shallower valley) is not visible in the average state of the system.
Several pressures can act together. Warming, nutrient pollution and the loss of a predator may each be harmless alone but push a system over the threshold in combination.
Thresholds vary between places and over time. A lake’s phosphorus threshold depends on its depth, its fish and its climate.
Data are often too short. A threshold may only become clear after it has been crossed.
Scientists look for early warning signals, such as a system taking longer to recover from small disturbances or fluctuating more widely, but these are not reliable everywhere. Different perspectives respond to this uncertainty in different ways: an ecocentric view favours strict limits well below any suspected threshold, while a technocentric view may argue that monitoring and technology will allow problems to be fixed if they appear.
Real environmental systems are far too complex to study in every detail. A model picks out the parts and relationships that matter most for a particular question and represents them in a simpler form. Every systems diagram, from a food chain to the carbon cycle, is a model.
Form of model | Example | What it is used for |
|---|---|---|
Diagram | Systems diagram of a pond; food web | Showing storages, flows and connections |
Graph | S-shaped population growth curve; Daisyworld temperature curve | Showing how a variable changes, or a relationship between variables |
Equation | NPP = GPP − R; the Lincoln index | Calculating a value from measurements |
Physical model | Bottle ecosystem; Biosphere 2 | Testing how a system behaves under controlled conditions |
Computer simulation | Climate models; Daisyworld; population projections | Predicting future states under different scenarios |
Verbal (in words) | The Gaia hypothesis; the description of eutrophication | Explaining an idea or a sequence of cause and effect |
They make complex systems understandable by focusing on the most important parts.
They allow predictions, for example of sea-level rise or future population, so that decisions can be made in advance.
They allow experiments that would be impossible, unethical or too slow in the real world, such as doubling atmospheric CO₂.
They make assumptions explicit, so they can be questioned and tested against new data.
They help communicate ideas to the public and to decision-makers.
Simplification is what makes a model useful, but it also means that some accuracy is lost. Every model leaves things out, and if something important is left out, the model’s predictions can be wrong. Biosphere 2’s designers did not include the reaction between carbon dioxide and concrete, and their oxygen balance failed. A bottle ecosystem in a classroom lacks migration, weather and most of the species of a real pond, so it behaves differently from the pond it represents.
Predictive models can give very different results depending on their assumptions. Global climate models agree that more greenhouse gases will cause warming, but they differ on how much, partly because of uncertainty about clouds and feedbacks and partly because future emissions depend on human choices. The Intergovernmental Panel on Climate Change therefore reports a range of possible futures under different emission scenarios rather than a single forecast. Population projections behave in the same way: small differences in assumed future fertility rates produce very different world populations by 2100.
Strengths of models | Limitations of models |
|---|---|
Simplify complex systems so they can be understood | Simplification loses accuracy; some processes are left out |
Allow predictions and the testing of scenarios | Predictions depend on assumptions and input data, which may be wrong |
Can be changed and improved as new data arrive | Different models of the same system can give different results |
Make it possible to study very large or very slow systems | Feedback loops and tipping points are hard to represent accurately |
Help explain ideas to non-specialists | May be trusted too much, or used selectively to support one side of an argument |
The way people use models also depends on their perspective. A technocentric view tends to trust models to guide technical solutions; an ecocentric view may stress their uncertainty and argue for caution; groups with economic interests may highlight the uncertainty of models whose results they dislike. Evaluating a model therefore means asking both how good its science is and who is using it, and for what purpose.
When the components of a system interact, the whole can behave in ways that none of its parts can on their own. A single snowshoe hare does not cycle in numbers, and a single lynx does not either; the regular rise and fall of both populations only appears when they interact. Such behaviour is an emergent property of the system.
Emergent properties are the main reason a holistic approach is needed. Studying hares in one experiment and lynx in another would never show the cycle that links them. Many important features of environmental systems, including the stability of ecosystems, the regulation of climate and the resilience of communities, are emergent in this way.
The mechanism is a negative feedback loop with a time lag. When prey are abundant, predators raise more young and their population grows. More predators push prey numbers down; with less food, predator numbers fall some time later, and the prey recover. Because each population responds to the other only after a delay, the loop overshoots in both directions instead of settling at a steady balance, and the result is a regular cycle, as in the hare–lynx cycle of the Canadian boreal forest. These predator–prey oscillations are a pattern of the system, not of either species.

A trophic cascade is a chain of effects that passes down a food chain when the population of a top predator changes. Removing a predator lets its prey increase, which reduces the prey’s food plants, which affects the animals that depend on those plants. Adding a predator back can reverse the chain.
Grey wolves (Canis lupus) had been eliminated from Yellowstone National Park in the USA by 1926. Without them, elk numbers rose and heavy browsing damaged aspen, willow and cottonwood. Wolves captured in Canada were released into the park in 1995 and 1996. Since then elk numbers have fallen, willows have recovered in some valleys, and the number of beaver colonies rose from one in 2001 to nine in 2011, because beavers depend on willow. This sequence is often presented as a trophic cascade, an emergent property of the restored food web, but how much of it the wolves caused is debated.
Some ecologists argue that wolves changed elk behaviour as well as numbers, keeping them away from stream banks. Others point out that hunting by people, more bears and cougars, drought and harsh winters also reduced elk, and that willows recovered only in some places, partly because the loss of beavers had already lowered water tables. The case shows that emergent properties are real but hard to attribute to a single cause in an open system with many interacting parts.
Sources: Wikipedia, "History of wolves in Yellowstone" (2026).
Other emergent properties include the regulation of temperature on Daisyworld (no single daisy controls it), the stability of a species-rich grassland during drought, the nutrient recycling of a forest, and, in human systems, the traffic jams and housing patterns of cities that no individual driver or builder intends.
Some systems survive storms, fires, droughts and disease outbreaks with little lasting change. Others collapse after a single shock. The difference is their resilience: the ability to absorb a disturbance and keep the same basic structure and functioning.
In the ball-and-cup model, resilience is the depth and width of the valley. A resilient system sits in a deep, wide valley: large disturbances are needed to push it out, and it returns quickly. A system that has lost resilience sits in a shallow valley, close to a tipping point, so even a small disturbance may cause a regime shift. Resilience is not the same as resistance to all change: a resilient forest may burn, but it regrows as forest.
Resilience applies to human systems too. A farming community with several crops, savings, roads to markets and strong local organisations recovers from a failed harvest more easily than one that depends on a single crop and has no reserves. Resilient socio-ecological systems keep both their ecological functions and the livelihoods that depend on them.
Systems with more diversity are usually more resilient. In an ecosystem with many species, several species often perform similar roles, such as pollinating, fixing nitrogen or eating a particular pest. If one is lost, another can take over. Different species also respond differently to the same disturbance: in a drought, deep-rooted plants survive while shallow-rooted ones die, so the community as a whole keeps functioning. Genetic diversity within a species works in the same way, because some individuals are likely to resist a new disease.
Long-term grassland experiments, in which species-rich plots withstood drought better than species-poor ones, support this, and the history of the North American prairie shows what happens when that diversity is removed.
Before European settlement, the grasslands of the North American Great Plains held hundreds of species of deep-rooted grasses and wildflowers, grazed by bison and burned by periodic fires. The dense, permanent root systems held the soil and stored water through droughts. Between about 1800 and 1930 most of this grassland was ploughed, and over 95% of the original tallgrass prairie is now farmland; estimates of what survives range from under 1% to about 4%.
Further west, on the drier shortgrass prairie of the southern High Plains, farmers replaced the native grassland with wheat in the wet years of the 1910s and 1920s. When severe drought struck in the 1930s, the monoculture crops failed and the bare, ploughed soil had nothing to hold it. Strong winds lifted the topsoil into enormous dust storms, the Dust Bowl.
About 100 million acres (around 400,000 km²) centred on the Texas and Oklahoma panhandles were affected, and about 3.5 million people moved out of the Plains states between 1930 and 1940. A diverse, perennial grassland that had survived droughts for thousands of years had been replaced by a single annual crop with almost no resilience to drought.
Sources: Wikipedia, "Tallgrass prairie" and "Dust Bowl" (2026).
Large storages also increase resilience. A large storage can absorb a big change in its inputs or outputs before the system as a whole is affected, and it changes slowly. The delay between a change in a flow and the full response of the system is a time lag.
A puddle and a lake show the effect. A puddle holds very little water, so a single sunny afternoon can evaporate it completely, and it fills again in the next shower. A lake holds so much water that one dry month barely changes its level; it would take years of reduced inflow to empty it. The lake is more stable and more resilient to short droughts. The same large storage also produces a long time lag in the opposite direction: once a large lake is polluted, it takes years for the pollutant to be flushed out, because the new clean water is diluted in a huge volume.
People often reduce the resilience of systems by shrinking their storages and simplifying their diversity, frequently without noticing until a disturbance arrives. Deforestation is a clear example. A tropical rainforest stores huge amounts of carbon, nutrients and water in its trees and soil, and contains many thousands of species. When it is cleared:
the biomass storage, and the nutrients held in it, are removed with the timber or burned;
the soil, no longer protected by roots and leaf litter, erodes, so the soil storage of nutrients and organic matter shrinks;
less water is held and transpired, so local rainfall can decrease;
diversity falls sharply, often to a single crop or pasture grass, so the remaining system has no back-up species.
With smaller storages and less diversity, the cleared land is much less able to absorb droughts, floods, pests or fire, and it can cross tipping points that the forest would not. In the Amazon, for example, large-scale clearing raises the risk that parts of the forest could shift to a drier, savanna-like state. Other human actions that lower resilience include overfishing (removing large fish and simplifying food webs), draining wetlands (removing water storage), monoculture farming and the loss of traditional varied land-use systems.
Factor | Increases resilience | Decreases resilience |
|---|---|---|
Diversity | Many species and genetic variety; several species in each role | Monocultures; loss of key species such as top predators |
Storage size | Large storages of water, nutrients, biomass and soil | Small or depleted storages (eroded soil, drained wetlands) |
Feedback | Strong negative feedbacks | Strong positive feedbacks near a threshold |
Connectivity | Connected habitats allow species to recolonise after a disturbance | Fragmented habitats isolate small populations |
Human factors | Varied livelihoods, savings, good governance, traditional knowledge | Dependence on one product or market, poverty, weak institutions |
Different perspectives suggest different ways of building resilience. An ecocentric approach protects diversity and large natural storages for their own sake, for example by rewilding or protecting old-growth forest. An anthropocentric, managerial approach invests in planned diversity, such as mixed cropping and protected watersheds, because resilient ecosystems keep providing services that people need. A technocentric approach may rely on engineered storages, such as reservoirs and seed banks, to replace natural ones. Each has costs and limits, and many successful strategies combine them.
Along more than 350 km of rocky coast north of San Francisco, in Sonoma and Mendocino counties, California, USA, forests of bull kelp (Nereocystis luetkeana) grew for as long as records exist. Bull kelp is a large brown seaweed that grows from the sea floor to the surface each year, forming a canopy that shelters fish, invertebrates and seaweeds. The region is thinly populated, so few direct human pressures were expected. The kelp forest supported the world’s largest recreational red abalone (Haliotis rufescens) fishery, valued at about US$44 million a year, and a commercial red sea urchin fishery worth about US$3 million a year.
As a system, the kelp forest held a stable equilibrium. Purple sea urchins (Strongylocentrotus purpuratus) were few, lived mainly in small, sheltered patches and fed largely on drift kelp, pieces of seaweed that break off and sink. The sunflower sea star (Pycnopodia helianthoides), a large and fast predator, ate urchins. With urchins kept low and fed by drift, they did little damage to living kelp, and the kelp continued to produce drift. These were negative feedbacks that kept the kelp forest in place.
Sea otters, another urchin predator, had disappeared from this coast by the mid-1800s, hunted for the fur trade, so the sea star was the main remaining check on urchins.
Several stressors arrived within a few years. In 2013, sea star wasting syndrome, a disease whose cause is still uncertain, began killing sea stars along the coast. Within a year sunflower stars were functionally extinct in the region, and none were seen at monitoring sites from 2016 to 2019.
In 2014 a record-breaking marine heatwave reached the coast: sea surface temperatures about 2.5 °C above normal persisted for 226 days, the longest marine heatwave then recorded, and the warm water was low in nutrients. Temperatures at the kelp forest were high for months, reaching a record 17.4 °C at 10 m depth in September 2014. Warm, nutrient-poor water slows the growth of bull kelp, an annual species that must regrow every year.
Bull kelp canopy collapsed in 2014. With little drift kelp to eat and almost no predators left, purple urchins came out into the open and began actively grazing living kelp and other seaweeds. Their numbers exploded: densities rose about 60-fold in 2015 and kept increasing. Grazing urchins removed young kelp as soon as it appeared, so the kelp could not recover even when the water cooled. By 2015 large areas had become urchin barrens, rocky sea floor covered with urchins and almost nothing else.

Measure | Before the shift | After the shift |
|---|---|---|
Bull kelp canopy area (aerial surveys) | 2.4–14.9 km² in any year; historic maximum extent over 50 km² | Below 2 km² in 2014–2016; over 90% loss along more than 350 km |
Sunflower sea stars | 0.01–0.12 per m² (before 2013) | Only 1 seen in 2014 and 2015; none 2016–2019 |
Purple sea urchins | 0.0–1.7 per m² (before 2014) | 8.2–12.9 per m² (2015); 9.2–24.1 per m² (2018) |
Red abalone | 0.24–1.01 per m² | Down 48–82% from 2016 to 2017, then a further 43–96%; 0.01–0.21 per m² in 2018 |
Fisheries | Recreational abalone (about US$44 million a year); commercial red urchin (about US$3 million a year) | Red urchin fishery collapsed from 2015; abalone fishery closed in 2018 |
The figures come from twenty years of diving surveys by the California Department of Fish and Wildlife and the University of California, Davis. Starving abalone, which also feed on kelp, died in large numbers from 2017, and the recreational abalone fishery in California was closed in 2018. Red urchins, starved of kelp, had too little roe to sell, so their fishery collapsed as well.
Coastal communities lost income from fishing, diving and tourism, and the region lost an economically and culturally important fishery and food.
Sources: Rogers-Bennett and Catton (2019), _Scientific Reports 9: 15050; California Department of Fish and Wildlife._
Urchin removal. From 2020 the Mendocino Kelp Forest Restoration Project, managed by Reef Check and the California Department of Fish and Wildlife with US$617,000 from the California Ocean Protection Council, paid commercial urchin divers to remove purple urchins at Noyo Harbor and Albion Cove. The target was fewer than 2 urchins per m², the density below which kelp can regrow. At Noyo Harbor divers removed about 11,800 kg of purple urchins in 2020, and young kelp appeared within weeks; by May 2021 some kelp had reached the surface and was reproducing.
A purple urchin fishery. The scientists who documented the collapse proposed supporting a “restorative” fishery for purple urchins, so that removing urchins could pay for itself rather than depend on grants.
Protecting the predator. In 2023 the US National Oceanic and Atmospheric Administration proposed listing the sunflower sea star as threatened under the Endangered Species Act, and scientists have begun breeding sunflower stars in captivity with the aim of returning them to the wild.
Fishery closures. Closing the abalone fishery protected the surviving abalone so that they could breed when kelp returns.
Planning. A recovery plan for bull kelp in northern California, drawn up in 2018–2019 with scientists and stakeholders, aims to understand the drivers and build resilience to future heatwaves.
Sources: Kelp Forest Alliance, "Bull kelp restoration in the Mendocino region"; NOAA Fisheries, "Sunflower sea star" (2023).
Starving urchins do not simply die out once the kelp has gone. Purple urchins can survive for long periods in low-food conditions, absorbing dissolved organic matter from sea water as larvae and as adults, and adults keep spawning even at sites with no seaweed, so young urchins are abundant. Small remnant kelp patches, covering less than 5% of the former area, produce too few spores to reseed the coast. Both effects help keep the barren as an alternative stable state.
Urchin removal works at small sites: kelp regrew within months where urchin densities were pushed below the threshold. It is expensive and slow, though, and covers a tiny fraction of the 350 km of barrens. Because the barren state is held by positive feedback, urchins move back in from surrounding areas unless removal continues. Long-term recovery probably depends on returning a predator, but sea stars are still rare and the cause of the wasting disease is unknown. Marine heatwaves are predicted to become more frequent as the climate warms, so the stressor that helped tip the system may return.
Perspective | How it sees the problem | Preferred response |
|---|---|---|
Technocentric | A management problem to be solved with technology and effort | Large-scale urchin removal, kelp outplanting, a commercial purple urchin fishery |
Anthropocentric (managerial) | A loss of ecosystem services, fisheries and tourism income | Fishery closures, paid restoration work, monitoring, climate-ready management plans |
Ecocentric | The loss of an ecosystem with intrinsic value, caused by wider human impacts | Restore predators (sea stars, possibly sea otters), protect marine reserves, cut greenhouse gas emissions |
Fishing communities | A loss of livelihood, food and cultural practice | Support for affected families, a role in restoration work, eventual reopening of fisheries |
Who loses and who gains is uneven. Abalone divers, urchin fishers and coastal businesses lost their income almost overnight, while the main long-term driver, ocean warming, results from greenhouse gas emissions released mostly far away. Paid restoration work for commercial urchin divers has replaced a small part of the lost income and given fishers a direct role in managing the system they depend on.
The kelp forest shows almost every idea of systems thinking in one place. It was a socio-ecological system in stable equilibrium, held by negative feedback between sea stars, urchins and kelp. Its resilience had already been lowered by the earlier loss of sea otters, leaving one main predator. Two stressors together, disease and a heatwave, pushed it past a tipping point in 2014. Positive feedback (less kelp, more active grazing, even less kelp) then drove a regime shift to an alternative stable state, the urchin barren, which has persisted even after the water cooled, an example of hysteresis.
The collapse spread to abalone, urchin fisheries and coastal communities, an emergent effect of the whole food web. Restoring the forest requires reducing urchins well below the level at which the forest first collapsed, which is far harder than preventing the shift would have been.
Systems ideas are tested in every paper. Short questions ask for definitions, for the classification of flows, or for a labelled feedback diagram. Data questions in Paper 1 often give an unfamiliar system (a river basin, a farm, a city) and ask you to construct a systems diagram, identify a feedback loop or suggest how resilience could be increased. In Paper 2 essays, systems terms such as tipping point, positive feedback and resilience lift an answer from description to explanation.
Diagrams carry many of the marks in systems questions, so they are worth practising until they can be drawn quickly and accurately.
Questions on feedback often combine a definition with an example, and the example must show the loop working.
Resilience questions reward a comparison that uses numbers or named systems rather than general statements.
Resource (hypothetical data). A shallow lake on a farming plain was surveyed every five years. The table shows total phosphorus in the water and the percentage of the lake bed covered by rooted underwater plants.
Year | Total phosphorus (mg L⁻¹) | Plant cover of lake bed (%) | Water clarity |
|---|---|---|---|
1990 | 0.06 | 72 | Clear |
1995 | 0.11 | 68 | Clear |
2000 | 0.17 | 61 | Clear |
2005 | 0.22 | 9 | Turbid, algal blooms |
2010 | 0.24 | 4 | Turbid, algal blooms |
2015 | 0.14 | 5 | Turbid |
2020 | 0.08 | 38 | Mostly clear |
A system is a set of interacting components forming a functional whole; the systems approach is holistic, while the reductionist approach studies parts separately.
Systems diagrams show storages as boxes, flows as labelled arrows, and inputs and outputs crossing a dashed boundary; box and arrow sizes can show quantities.
Transfers change the location of matter or energy; transformations change its chemical nature, state or form of energy.
Open systems exchange energy and matter, and closed systems only energy (an isolated system, exchanging neither, is only theoretical); almost all real systems are open, and Biosphere 2 showed how hard a closed system is to balance.
The Earth is one integrated system of biosphere, atmosphere, hydrosphere, cryosphere, geosphere and anthroposphere; the Gaia hypothesis models it as self-regulating, and Daisyworld shows how life can regulate temperature through albedo.
Negative feedback reduces change and stabilises a system; positive feedback amplifies change and destabilises it, as in the ice–albedo feedback.
Ecosystems are usually in stable equilibrium, either a steady state with balanced flows or developing through succession.
Positive feedback can drive a system past a tipping point into an alternative stable state (a regime shift), and recovery often shows hysteresis, as in Lake Veluwe.
Models simplify reality to explain and predict, but simplification reduces accuracy, so different models can give different results.
Emergent properties, such as predator–prey oscillations and trophic cascades, arise from interactions between components.
Resilience is the ability to resist and recover from disturbance; diversity and large storages increase it, and deforestation and monocultures reduce it.
The northern California kelp forest crossed a tipping point in 2014 and shifted to urchin barrens held by positive feedback.
I can define a system and explain the difference between holistic and reductionist approaches.
I can construct a systems diagram with storages, flows, inputs, outputs and a boundary.
I can classify flows as transfers or transformations and justify each classification.
I can distinguish open and closed systems and use Biosphere 2 as an example of a closed system.
I can describe the Earth system and explain the Gaia hypothesis, the Daisyworld model and the criticisms of each.
I can draw and explain negative and positive feedback loops with named examples.
I can distinguish steady-state, developing, stable and unstable equilibria with graphs.
I can explain tipping points, regime shifts, alternative stable states and hysteresis using a lake or kelp forest.
I can evaluate the strengths and limitations of a model.
I can explain emergent properties using predator–prey oscillations and a trophic cascade.
I can explain how diversity, storage size and time lags affect resilience, and how humans reduce it.