Explain sustainability, sustainable development and environmental justice, measure sustainability with footprints and indicators, and evaluate the SDGs, planetary boundaries, doughnut economics and the circular economy.
Each is in the ESS glossary, with every other term in the subject.
A planetary boundary process covering the amount of fine particles added to the atmosphere by human activity, which affects climate, rainfall patterns and health.
The capacity of a biologically productive area to generate an ongoing supply of renewable resources and to absorb its wastes; measured in global hectares.
A planetary boundary process covering human additions of nitrogen and phosphorus to the environment, mainly from fertilisers, which disrupt their natural cycles.
The part of the circular economy in which biodegradable materials, such as food and wood, are cascaded into other uses and then returned safely to the soil by composting or anaerobic digestion.
The 1987 report Our Common Future by the UN World Commission on Environment and Development, chaired by Gro Harlem Brundtland, which gave the standard definition of sustainable development.
A model of the circular economy by the Ellen MacArthur Foundation, showing materials looping back through a technical cycle on one side and a biological cycle on the other.
The total amount of greenhouse gases produced directly and indirectly by a person, product, organisation or country, expressed in tonnes of CO₂ equivalent.
Define sustainability and sustainable development, and explain how sustainability applies to socio-ecological systems.
Distinguish between the environmental, social and economic pillars of sustainability, and compare models of strong and weak sustainability.
Explain how unsustainable use of natural resources can lead to ecosystem collapse.
Evaluate GDP and green GDP as measures of development.
Explain the meaning of environmental justice, using one local and one global example of environmental injustice.
Describe how sustainability and environmental justice apply at operating scales from the individual to the global.
Outline the use of sustainability indicators, including ecological, carbon and water footprints and biocapacity.
Outline the role of citizen science in monitoring Earth systems.
Evaluate the Sustainable Development Goals, the planetary boundaries model, doughnut economics and the circular economy as frameworks for sustainability.
Determine, using quantitative data, when and whether planetary boundaries have been crossed. (HL)
Sustainability is about whether the ways people live, farm, fish, build and trade can continue for a long time without wearing down the natural systems and the societies they depend on. Every environmental issue, from a polluted river to a warming climate, can be judged by asking how sustainable the activities behind it are, and for whom.
Sustainability is one of three foundation ideas in environmental systems and societies. It depends on the other two: a systems approach shows how resources flow through the environment and the economy, and
The official deck for this part of the syllabus.
What is sustainability?
In the definition of sustainability, what does "viability" mean?
With a free account, Augment remembers where you stopped and what you have practiced.
An economic model that aims to decouple economic activity from the consumption of finite resources by eliminating waste and pollution, circulating products and materials, and regenerating nature.
Scientific research in which members of the public take part, often by collecting, recording or analysing data, usually in collaboration with professional scientists.
A unit that expresses the amount of any greenhouse gas as the amount of carbon dioxide that would cause the same warming, so different gases can be added together.
Breaking the link between economic activity and environmental pressure, so that output or well-being can rise while resource use or pollution stays the same or falls.
An economy designed to share value and opportunity far more equitably among all stakeholders, rather than relying on growth to reduce poverty.
A framework for a regenerative and distributive economy that meets the needs of all people within the means of the planet, shown as a ring between a social foundation and an ecological ceiling.
The outer boundary of the doughnut economics model, based on the planetary boundaries, beyond which human pressure overshoots the Earth's life-supporting systems.
The area of land and water required to sustainably provide all the resources a population consumes and absorb all the wastes it produces, at its current rates; measured in global hectares.
The situation in which a population's ecological footprint exceeds the biocapacity available to it, so that natural capital is depleted and wastes accumulate.
The maintenance of economic structures and systems that support the production and consumption of goods and services to meet human needs into the future.
A change in which an ecosystem loses its defining species, structure or functions and shifts to a different, usually less valuable state from which recovery is slow or impossible.
The right of all people to live in a pollution-free environment and to have equitable access to natural resources, regardless of race, gender, socio-economic status or nationality.
The use and management of natural resources in a way that allows resources to be replaced and ecosystems to recover and regenerate, avoiding depletion, pollution and biodiversity loss.
Fairness in the distribution of resources, opportunities, costs and benefits, so that no group is systematically disadvantaged; equitable does not necessarily mean equal.
A planetary boundary process covering human disturbance of the water cycle, measured by changes in river flows (blue water) and in soil moisture (green water).
A unit of area equal to one hectare of land or water with the world-average biological productivity, used to measure ecological footprints and biocapacity.
A measure of economic output that subtracts the monetary value of environmental costs, such as resource depletion and pollution damage, from gross domestic product.
The total monetary value of all final goods and services produced and sold in a country in a given period, usually one year.
An index of collective well-being used by the government of Bhutan as an alternative to GDP, covering domains such as health, education, culture, good governance and ecological resilience.
The geological epoch of roughly the last 12,000 years, a period of unusually stable climate in which agriculture, cities and human civilisations developed.
Fairness between generations, so that people living now do not use resources or cause damage in ways that leave future generations with fewer opportunities.
A planetary boundary process covering the conversion of forests, grasslands and wetlands to farmland, settlements and other uses, measured by remaining forest cover.
An economic model in which raw materials are extracted, made into products, used and then discarded as waste; often summarised as take, make, waste.
The stock of natural resources and ecosystems, such as forests, soils, fish stocks, groundwater and the atmosphere, that provides goods and services of value to people.
Human-made substances and materials, such as synthetic chemicals, plastics and pesticides, released into the environment; one of the nine planetary boundaries.
A level at which decisions and actions for sustainability are taken: individual, business, community, city, country or global.
The use of a renewable resource at a rate greater than its natural rate of replacement, so that the stock declines over time.
The three dimensions on which sustainability rests: environmental, social and economic, each of which must be maintained for a practice or system to be sustainable.
A model identifying nine Earth system processes that have kept the planet stable during the Holocene, with a limit to human disturbance of each; crossing a limit raises the risk of abrupt, irreversible change.
An approach to decisions under uncertainty: where an activity threatens serious or irreversible harm, lack of full scientific certainty is not a reason to postpone preventive action.
An economy designed to work with and within the cycles and limits of the living world, so that materials are reused and ecosystems restored rather than depleted.
The space between the social foundation and the ecological ceiling of the doughnut model, in which everyone's needs are met without degrading the planet.
The range of conditions within all nine planetary boundaries in which the Earth system is expected to remain in a stable, Holocene-like state that supports human societies.
The inner boundary of the doughnut economics model, based on the social goals of the SDGs, below which people lack life's essentials such as food, water, health and political voice.
The creation of structures and systems, such as health care, education, equity and community, that support human well-being and the survival of societies and their cultures over the long term.
A view that natural capital cannot be fully replaced by manufactured or human capital, so critical natural capital must be maintained; shown as the economy nested within society within the environment.
The extent to which practices allow for the long-term viability of a system; generally, the responsible maintenance of socio-ecological systems so that conditions are not diminished for future generations.
A measurable quantity, tracked over time, that shows whether a system is moving towards or away from sustainability, such as a biodiversity index, a pollutant concentration or a footprint.
Development that meets the needs of the present without compromising the ability of future generations to meet their own needs, as defined by the Brundtland Report in 1987.
A set of 17 social, economic and environmental goals with 169 targets, adopted by all UN member states in 2015, to guide action on sustainability and justice up to 2030.
The part of the circular economy in which materials that cannot safely return to nature, such as metals and plastics, are kept in use by sharing, repair, reuse, remanufacture and recycling.
The total volume of fresh water used directly and indirectly to produce the goods and services consumed by a person, product or country, usually in cubic metres per year.
A view that natural capital can be replaced by manufactured or human capital, so development is sustainable if total capital does not fall; shown as three equal overlapping pillars.
In everyday speech, “sustainable” simply means able to continue. A household that spends more than it earns each month is not financially sustainable, because its savings will eventually run out. The same reasoning applies to a forest that is logged faster than it regrows, or a town whose young people all leave to find work elsewhere.
Two words in the definition need unpacking. “Viability” means the ability of the system to keep functioning: a fishery that keeps producing fish, a soil that keeps growing crops, a community that keeps its culture and livelihoods. “Socio-ecological system” is a reminder that people and nature are not separate. A fishing village, its boats and markets, the fish stock and the sea are parts of one system, and a change in any part affects the others.
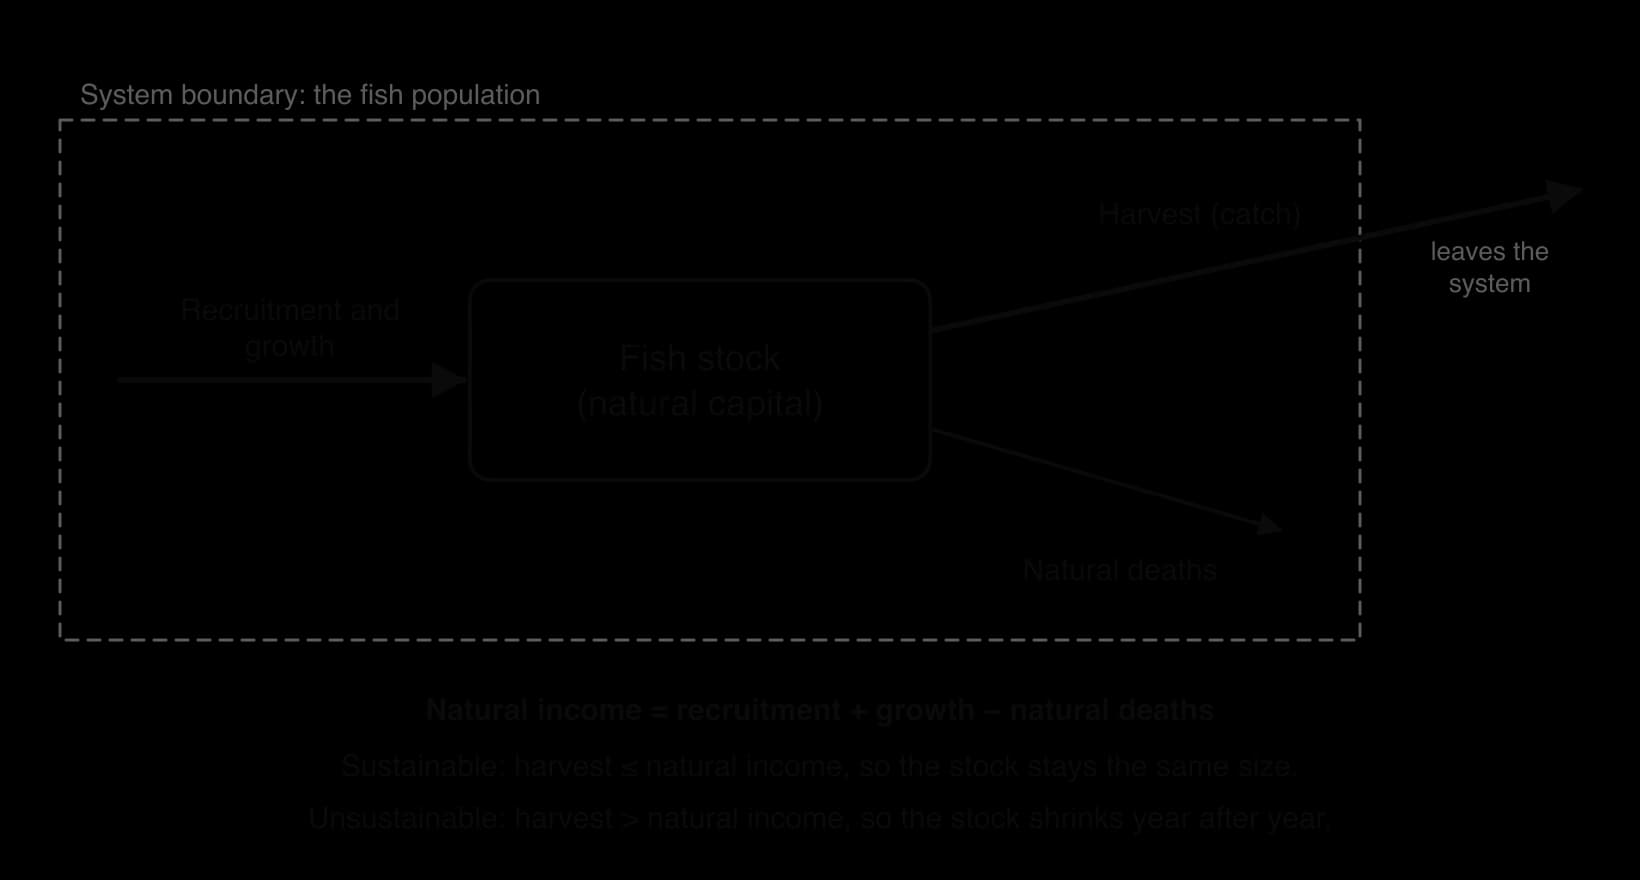
Because every human activity takes place inside a system, sustainability can be analysed with the tools of systems thinking. A sustainable system keeps its storages roughly constant over time: the inputs to a storage balance the outputs. A forest is used sustainably if the timber removed each year is no more than the new wood the trees add by growth. If the outputs are larger than the inputs, the storage shrinks and the activity cannot continue indefinitely.
Sustainability is also linked to resilience, the capacity of a system to resist damage and recover from disturbance. A diverse farm with several crops, hedgerows and healthy soil recovers more quickly from a drought or a pest outbreak than a large monoculture. In general, actions that increase the resilience of a socio-ecological system also increase its sustainability, because the system is less likely to be pushed past a tipping point into a degraded state.
Sustainability is a matter of degree rather than a yes-or-no label. Most real practices are more sustainable or less sustainable than the alternatives, and the judgement depends on the timescale, the scale (a single field or the whole planet) and the values of the person making it.
Many discussions of sustainability borrow a metaphor from finance. A sum of money in a bank is capital, and the interest it earns each year is income. A person can spend the interest for ever, but spending the capital itself shrinks the future income. Nature can be thought of in the same way, as natural capital.
The yearly yield from natural capital, such as the growth of a forest or the young fish added to a stock, is natural income. Living sustainably means living off the income without running down the capital. The idea is useful because it makes visible a loss that ordinary accounts often hide: a country that cuts down its forests faster than they regrow can show rising income for a while, but it is spending its capital. How natural capital is classified and valued is developed further in the study of natural resources.
The term is itself a perspective. Calling nature “capital” frames it by its usefulness to people, an anthropocentric view. People with an ecocentric worldview argue that a wetland or a species has intrinsic value whatever its economic use, and that treating nature as a store of assets makes it easier to trade away.
Sustainability is not only about the environment. A society that protects its forests while its people go hungry, or an economy that grows while its workers are exploited, is not sustainable either. For this reason sustainability is usually described as resting on three pillars: environmental, social and economic.
Environmental sustainability focuses on three main threats: the depletion of resources, pollution and the loss of biodiversity. It also includes active work to regenerate damaged ecosystems, such as replanting mangroves or restoring peat bogs. Resources are replaced over very different timescales: a crop of rice in months, a forest in decades, a soil in centuries, and an oil field effectively never on a human timescale.
Social sustainability is about whether societies and their cultures can survive and flourish. It includes access to clean water, schooling and fair treatment under the law, but also the continued use of a language, belief system or spiritual practice. When an Indigenous community loses the land on which its way of life depends, its social sustainability is threatened even if its income rises.
An economically sustainable system provides livelihoods, income and the goods people need without collapsing through debt or exhaustion of its resource base. Every economy draws its raw materials and energy from the environment and releases its wastes back into it. In terms of resource use, therefore, there can be no economic sustainability without environmental sustainability; a fishing industry, for example, cannot outlast the fish stock it depends on.
The three pillars can be drawn in two different ways, and the choice of diagram reflects a real disagreement about how the pillars relate to each other.
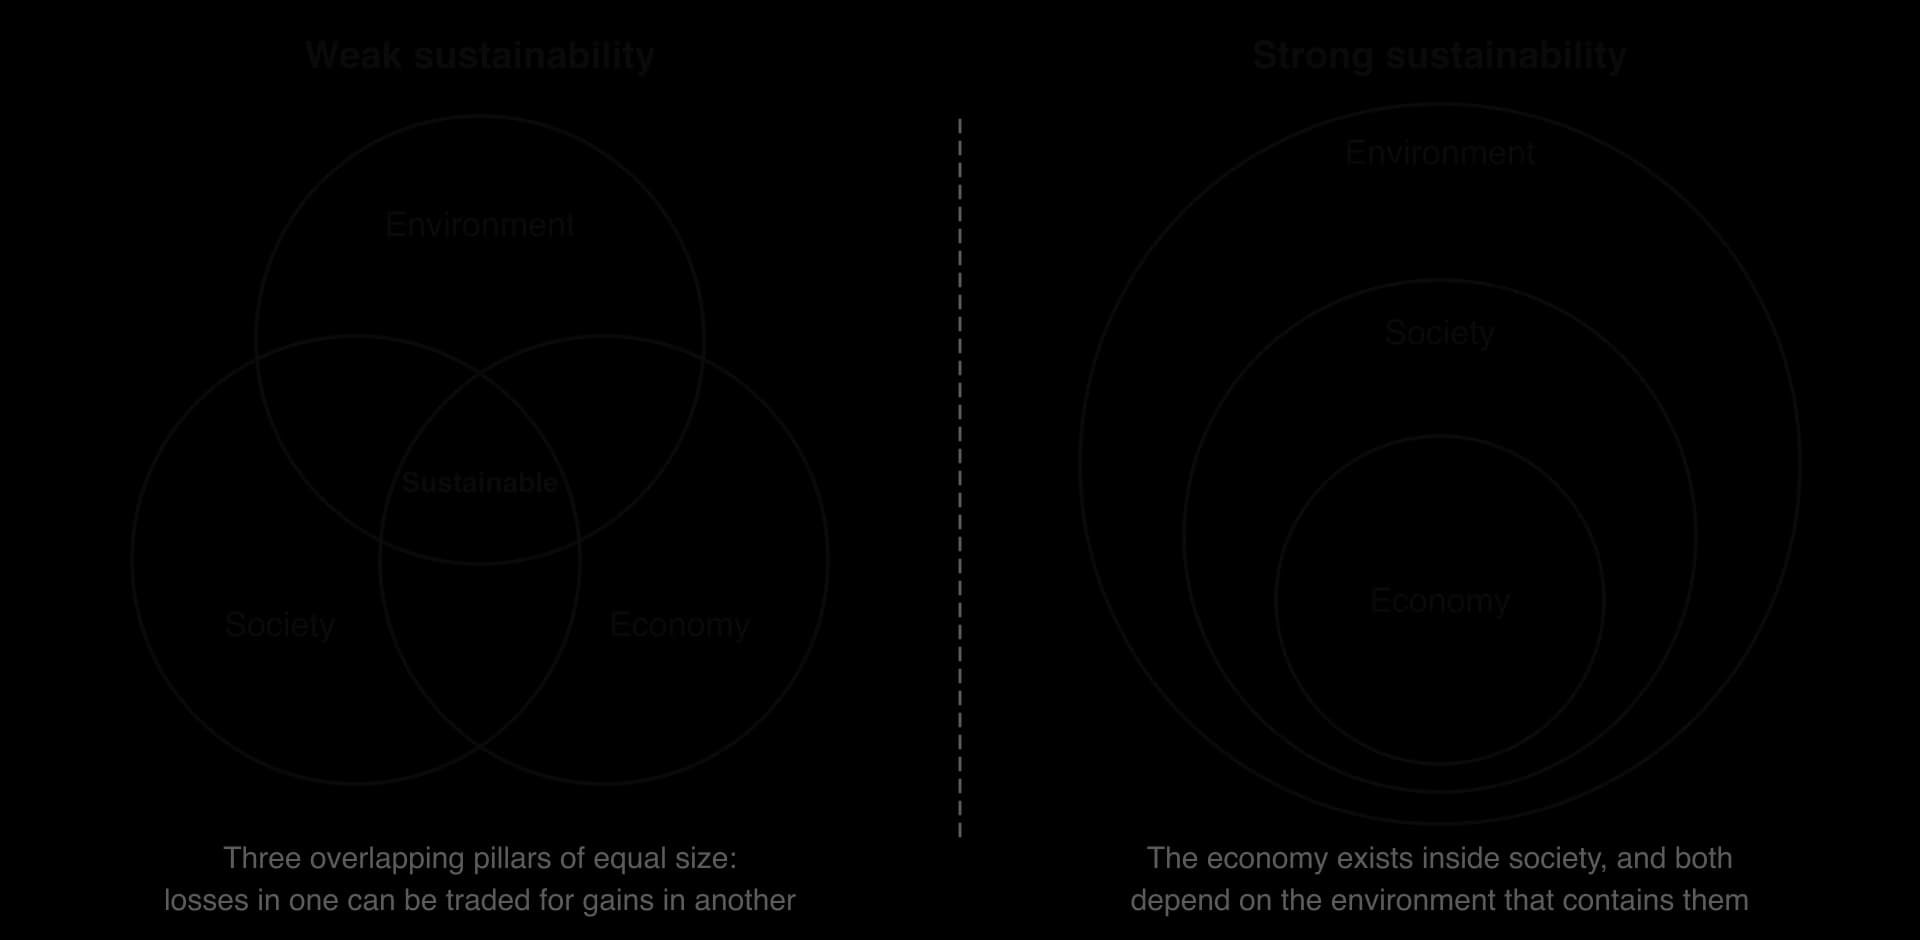
The weak sustainability model shows the environment, society and the economy as three overlapping circles of equal size, with sustainability where all three overlap. Because the circles are equal and separate, the model implies that the pillars can be traded against each other. A loss of natural capital, such as a cleared forest, is acceptable if it is replaced by an equal value of manufactured capital, such as a factory or a road, or human capital, such as education.
The strong sustainability model draws the pillars as nested circles. The economy sits inside society, because markets are human institutions, and society sits inside the environment, because every society depends on air, water, food and a stable climate. In this view some natural capital is critical and cannot be replaced by anything people make: no factory can replace the ozone layer or the pollination of crops by wild insects.
The two models lead to different decisions. Under weak sustainability, draining a wetland to build a port can be justified if the port creates more value than the wetland provided. Under strong sustainability, the wetland’s role in flood control, fisheries and biodiversity may make it irreplaceable, so the port should go elsewhere or not be built.
Weak sustainability | Strong sustainability | |
|---|---|---|
Diagram | Venn diagram: three equal overlapping circles | Nested circles: economy inside society inside environment |
Can natural capital be replaced? | Yes, by manufactured or human capital of equal value | Only partly; critical natural capital cannot be replaced |
Main goal | Keep the total stock of capital from falling | Keep the stock of natural capital from falling |
Linked perspective | Closer to technocentric and anthropocentric views | Closer to ecocentric views and ecological economics |
Typical example | Revenue from mining invested in schools and roads | Protecting a watershed forest whatever the value of its timber |
The weak model is easier to use in practice, because it allows costs and benefits to be compared in money. Its critics point out that many environmental losses are irreversible and that the planet’s life-support systems have no substitute. The strong model better reflects the dependence of economies on ecosystems, but it gives less guidance on how to choose between competing human needs. A technocentric thinker is more likely to accept substitution, trusting technology to replace lost services; an ecocentric thinker is more likely to insist on strong sustainability.
Sustainability describes a state that can continue; development describes change that improves people’s lives. In the 1970s and 1980s governments struggled with how to bring the two together, and in particular with whether poorer countries could develop, as the richer countries had, without destroying the environment on which everyone depends.
The United Nations set up the World Commission on Environment and Development, chaired by the former Norwegian Prime Minister Gro Harlem Brundtland, to address this problem. Its report, Our Common Future, published in 1987 and known as the Brundtland Report, treated environment and development as one issue rather than two. It gave the definition of sustainable development that is still the most widely used.
The definition applies sustainability to social and economic development. It is a framework for guiding change while maintaining three things together: economic stability, social equity and ecological integrity. Two ideas sit at its heart. The first is “needs”, especially the essential needs of the world’s poorest people, which the report said should come first. The second is limits: the environment’s ability to meet present and future needs is limited by the state of technology and social organisation.
The Brundtland Report brought the social and economic aspects of sustainability into the idea of sustainable development. It argued that poverty is itself a cause of environmental damage, because people with no alternatives may have to cut forests or overgraze land to survive. It laid the groundwork for the Earth Summit in Rio de Janeiro in 1992, which adopted Agenda 21, a global action plan for sustainable development.
Sources: United Nations World Commission on Environment and Development, _Our Common Future (1987)._
The phrase is widely accepted partly because it is flexible, and that flexibility is also its main weakness. Different groups read it in very different ways.
Some economists and governments read it as sustained growth: development means a rising GDP, and sustainability means keeping that growth going with cleaner technology.
Many environmentalists argue that endless growth on a finite planet is impossible, so sustainable development in rich countries may require using fewer resources, not more.
Leaders in some lower-income countries have argued that limits set by rich countries amount to “green imperialism”, denying them the development the rich countries already enjoyed.
The definition says nothing about the needs of other species, so ecocentric critics see it as an anthropocentric idea.
Despite these debates, the Brundtland definition gave governments, businesses and campaigners a shared starting point. Its central principle, fairness between present and future generations, is known as intergenerational equity.
When a renewable resource is harvested faster than it can replace itself, a process called overexploitation, the storage shrinks. For a while the harvest can continue, and may even rise as more effort is applied, but each year there is less natural capital left to produce the next year’s income. Eventually the system can cross a tipping point and reorganise into a different, less productive state, which is called ecosystem collapse.
Overexploitation does not always end in collapse. A stock reduced to a low level can still recover if harvesting is cut back in time, but the longer overexploitation continues, the greater the risk that the ecosystem reorganises around different species.
Collapse is often sudden even though the pressure behind it built up slowly. The reason is positive feedback: as a population becomes smaller, it produces fewer young, so each year’s harvest takes a larger share of what is left, and the decline speeds up. Other species can also take over the empty niche, which makes it harder for the original community to return.
The northern cod fishery off Newfoundland, Canada, is the classic example. Atlantic cod had been fished there for about 500 years, but from the 1950s large factory trawlers allowed far more fish to be caught; the catch peaked at about 810,000 tonnes in 1968. Quotas were set too high because rising catches were mistaken for a growing stock, when they actually reflected better technology. By 1992 the spawning stock of northern cod had fallen to about 1% of its historic level, and the Canadian government closed the fishery.
The moratorium was the largest industrial closure in Canadian history: more than 35,000 fishers and fish-plant workers in over 400 coastal communities lost their work. The cod did not recover for decades, and the ecosystem shifted towards snow crab and northern shrimp. The collapse shows all three pillars failing together: the fish stock (environmental), the fishing communities and their way of life (social) and the regional economy (economic). The detail of how fisheries are managed and how this one collapsed belongs with the study of fishery collapse.
Sources: Fisheries and Oceans Canada data summarised in “Collapse of the Atlantic northwest cod fishery”, Wikipedia (accessed 2026).
Other collapses are less clear-cut. The deforestation of Rapa Nui (Easter Island) is often told as a society that destroyed its own forest, but historians and archaeologists now dispute this, pointing also to introduced rats and to the impact of European contact and slave raids. The example shows that an apparent collapse needs careful evidence before a single cause is blamed.
Governments need a way to tell whether their countries are becoming better off. The most widely used measure is gross domestic product (GDP), and the choice of measure matters, because whatever is measured tends to be what governments try to increase.
GDP is useful because it is measured in the same way in almost every country, so it can be compared across time and place. A rising GDP usually means more jobs and more tax revenue for schools and hospitals. As an indicator of development, however, it has serious blind spots.
Depletion counts as income. When a forest is felled and sold, GDP rises by the value of the timber. Nothing is subtracted for the loss of the forest as natural capital, or for the services it provided, such as flood control and carbon storage.
Pollution and its clean-up can raise GDP. An oil spill adds to GDP through spending on the clean-up and on medical care, while the damage to fisheries and health is not subtracted.
Unpaid and non-market value is missing. Clean air, pollination by wild insects and food grown for a family’s own use have no market price, so they do not appear.
Distribution is hidden. GDP is a total. It can rise while most of the gain goes to a small group, or while the costs fall on poor communities.
A government that focuses only on raising GDP may therefore encourage unsustainable development: it can look as though the country is getting richer while it is actually running down its natural capital and storing up costs for the future.
In a green GDP account, the value of the timber sold still counts, but the value of the forest lost is subtracted. The result shows how much of a country’s output is genuine income and how much is the spending of natural capital. The United Nations publishes a framework for this kind of accounting, the System of Environmental-Economic Accounting.
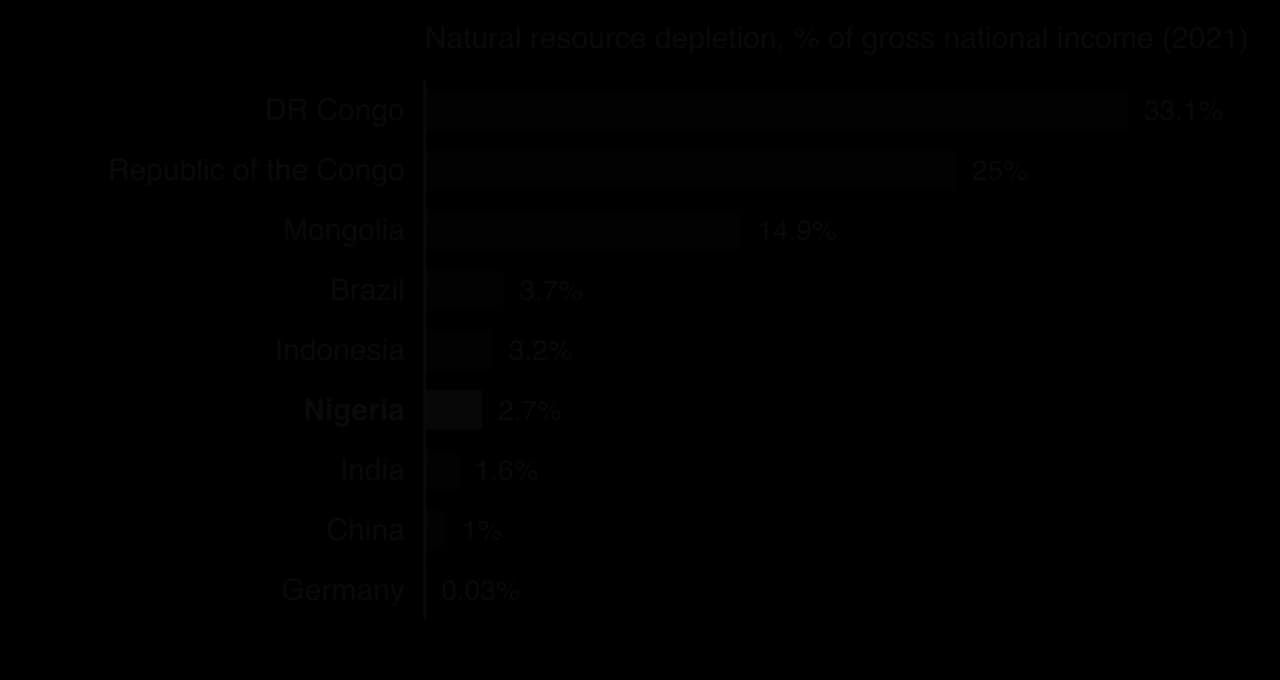
The chart shows only one part of the environmental cost, the depletion of energy, minerals and forests, and still the adjustment is large for countries such as the Democratic Republic of the Congo and Mongolia. Adding the costs of air and water pollution would lower green GDP further.
China tried to introduce green GDP in the mid-2000s. Its first national green GDP report, for the year 2004, was published in September 2006 and estimated that pollution had cost 511.8 billion yuan, about 3% of the economy. The project was abandoned in 2007, when it became clear that the adjustments would reduce the growth rate of some provinces to almost zero, and the report for 2005 was never released. Local officials were judged on growth, and the data on environmental damage were expensive to collect.
Sources: “Green gross domestic product”, Wikipedia (accessed 2026), citing China’s State Environmental Protection Administration and National Bureau of Statistics (2006).
Some countries have tried to move further away from money as the measure of progress. Bhutan’s Gross National Happiness index, written into its 2008 constitution as a goal of the state, measures well-being across nine domains, including health, education, time use, cultural diversity, good governance and ecological diversity and resilience. The index has been praised for valuing what GDP leaves out, and criticised because, before Bhutan became a democracy in 2008, the state expelled more than 100,000 people of Nepali origin and Hindu faith in the name of protecting its culture.
Sources: “Gross National Happiness”, Wikipedia (accessed 2026).
The costs and benefits of using the environment are rarely shared equally. A factory brings jobs and profits to some people and polluted air to others; a dam brings electricity to a city and floods the farmland of people upstream. Environmental justice asks who bears these costs and whether that is fair.
The key word is equity, which means fairness. Equitable access does not require identical shares for everyone; it requires that no group is systematically denied clean water, safe air or land because of who they are. Environmental injustice happens when poorer or less powerful groups carry a larger share of pollution and resource loss, while the benefits go elsewhere. It can occur within one country or between countries, and between generations, when present consumption leaves damage for people not yet born.
Environmental injustice also tends to make development less sustainable. When the people who suffer the damage have little political power, the decision-makers who benefit have little reason to reduce it, so pollution continues for longer. Communities that lose their land or water may be forced into poverty, which weakens social sustainability. For this reason many campaigners treat justice as a condition of sustainability rather than an optional extra.
A stretch of about 300 km along the Mississippi River between Baton Rouge and the Gulf of Mexico holds more than 350 industrial facilities, many of them petrochemical plants and refineries. From the 1950s onwards many plants moved there from the cities, often onto former plantation land next to small, mostly African American communities. Near a neoprene plant in St John the Baptist Parish, the US Environmental Protection Agency estimated the risk of cancer from air pollution at more than 700 times the national average. Residents have campaigned for decades against new plants, winning some cases, such as the withdrawal of a planned PVC plant at Convent in 1998.
The case shows the typical pattern of environmental injustice: land use decisions made by state agencies and companies, a pollution burden carried by a community with low income and little political power, and few of the industry’s jobs going to local residents.
Sources: “Cancer Alley”, Wikipedia (accessed 2026), citing US EPA National Air Toxics Assessment (2015).
On the night of 2–3 December 1984, about 40 tonnes of methyl isocyanate gas leaked from a pesticide plant in Bhopal owned by Union Carbide India Limited, a subsidiary of the US company Union Carbide Corporation. More than 500,000 people in the surrounding neighbourhoods were exposed. The official immediate death toll was 2,259; the state government later confirmed 3,787 deaths related to the gas, and other estimates are much higher.
Bhopal is an example of global environmental injustice because a multinational company based in a high-income country operated a hazardous plant with weaker safety standards in a lower-income country. Internal company audits had identified major hazards at the plant before the disaster. In 1989 Union Carbide paid US$470 million to settle all claims, a sum many survivors regarded as far too small for the scale of death and long-term illness.
Sources: “Bhopal disaster”, Wikipedia (accessed 2026), citing the Government of Madhya Pradesh and the Supreme Court of India (1989).
Deepwater Horizon, Gulf of Mexico (2010). An explosion on a BP-operated drilling rig killed 11 workers and released about 4.9 million barrels of oil. Coastal fishing communities, which had no say in how the rig was run, lost income when more than a third of federal waters in the Gulf was closed to commercial fishing.
Plastic waste exported from richer to poorer countries. After China banned most imports of plastic waste in 2018, much of the plastic collected for “recycling” in Europe, North America and Japan was diverted to countries such as Malaysia, Indonesia and Vietnam, often illegally, until these countries tightened their border controls. The countries that consumed the plastic avoided the cost of dealing with it, while the receiving communities were left with the waste.
Maasai land rights in Kenya and Tanzania. Large areas of Maasai grazing land were taken to create national parks and reserves such as the Maasai Mara in Kenya and the Ngorongoro Conservation Area in Tanzania. The benefits of conservation and tourism have often not reached the people who lived on the land.
Inequalities in income, race, gender and cultural identity, within and between societies, lead to large differences in access to water, food and energy. A family that cannot afford a connection fee may live next to a power line and still have no electricity, and when water is sold at a price that covers its full cost, the poorest households may be priced out of a safe supply. Gender matters too: in households without water on the premises, women and girls aged 15 and over are the main water collectors in about 7 out of 10, which takes time from school and paid work.
Sources: UNICEF and WHO, _Progress on household drinking water, sanitation and hygiene 2000–2022: special focus on gender (2023)._
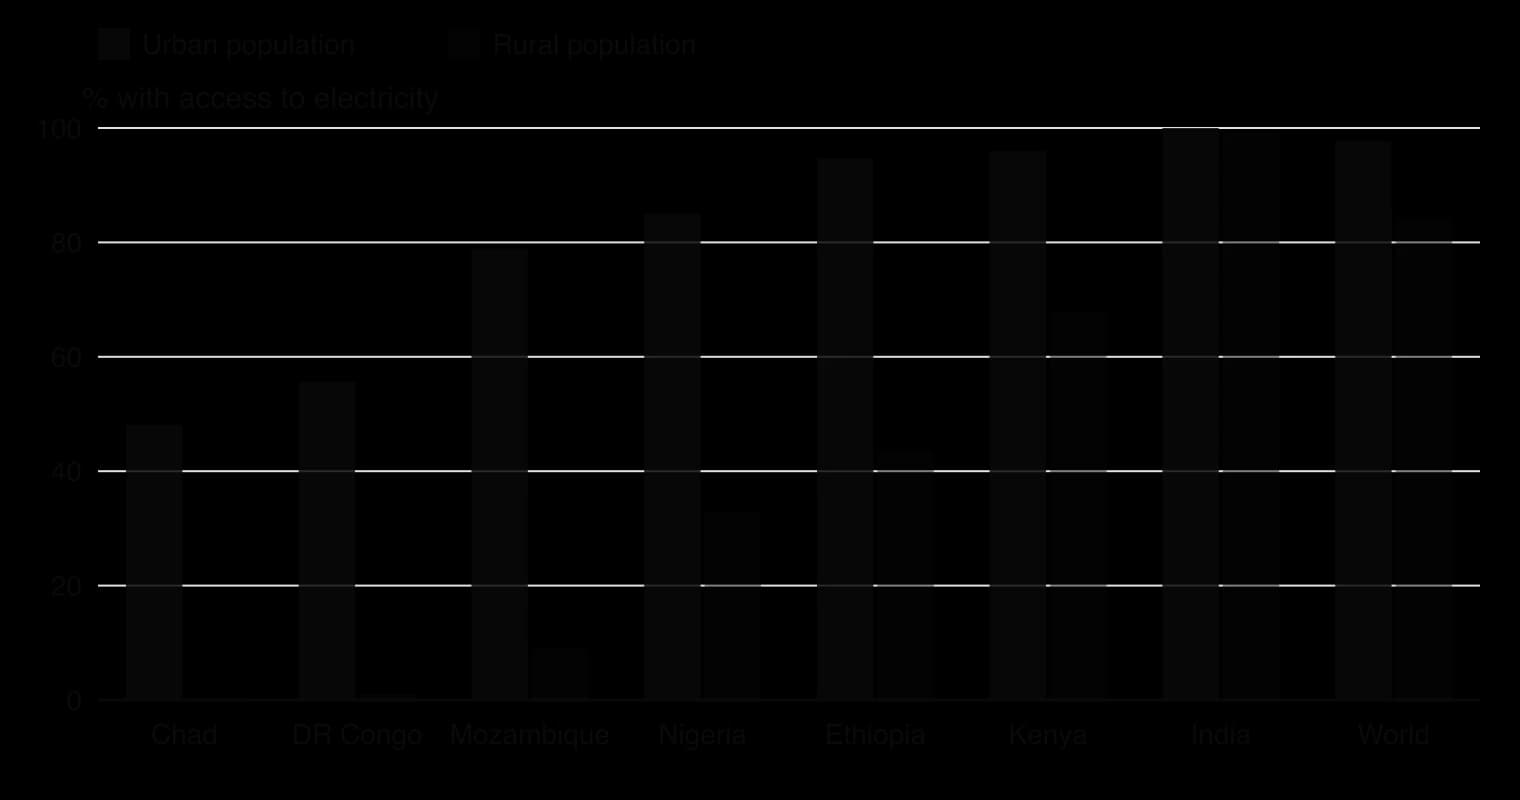
The chart shows that within a country the gap between city and countryside can be far larger than the gap between countries. Nigeria earns large revenues from oil exports, yet in 2023 only about a third of its rural population had electricity. Access depends on the distribution of income and investment, not only on the total wealth of a country.
Sustainability and environmental justice apply at every scale at which decisions are made, from one person’s choices to agreements between nearly 200 countries. These are called operating scales. Actions at one scale are shaped by, and shape, actions at the others: an individual chooses what to buy, but the choice depends on what businesses sell and what laws allow.
Operating scale | Who acts | Examples of action for sustainability or justice |
|---|---|---|
Individual | One person or household | How to live and work: diet, travel, energy use, what to buy and throw away, voting and campaigning |
Business | Companies and their supply chains | Cutting waste and emissions, designing products for repair, paying fair wages, avoiding deforestation in supply chains |
Community | Religious, cultural, political or Indigenous groups | Community forests, local food networks, campaigns against a polluting plant, protecting sacred sites |
City | Municipal governments | Public transport, green space, waste collection and recycling, building standards |
Country | National governments | Policies, laws and taxes; energy and land-use planning; how the economic system distributes costs and benefits |
Global | International organisations and agreements | The UN Sustainable Development Goals, the Paris Agreement, the Montreal Protocol |
Larger scales usually have more power to change systems, but they are slower and more remote from the people affected. Smaller scales can act quickly and test new ideas, but they cannot by themselves solve problems that cross borders, such as climate change. Effective sustainability policy usually needs action at several scales at once.
Managing sustainability requires measuring it. Because no single number captures everything, scientists and governments use a range of sustainability indicators, each tracking one part of a socio-ecological system over time.
Indicators cover many aspects of the environment and society:
Biodiversity: the Living Planet Index, the IUCN Red List Index, counts of breeding birds.
Pollution: concentrations of PM2.5 in city air, nitrate in rivers, plastic per square kilometre of sea surface.
Human population: growth rate, life expectancy, the share of people living in poverty.
Climate change: atmospheric CO₂ concentration, global mean temperature, sea-level rise, Arctic sea-ice extent.
Resource use: material footprints, carbon footprints, water footprints, the ecological footprint.
Indicators can be used at every scale. A school can track its electricity use and waste; a city its air quality; a country its forest cover; the world its CO₂ concentration. A good indicator is measurable with reliable data, sensitive to change, easy to understand and linked to a clear goal. No indicator is perfect, so judgements about sustainability usually combine several.
The Living Planet Index (LPI), managed by the Zoological Society of London with WWF, tracks the average change in size of monitored populations of wild vertebrates: mammals, birds, reptiles, amphibians and fish. The 2026 edition combined 35,803 population time series for 5,790 species and showed an average decline of about 73% between 1970 and 2022, the same figure that the 2024 edition reported for 1970–2020. Declines were steepest in Latin America and the Caribbean (about 95%) and in freshwater ecosystems (about 85%).
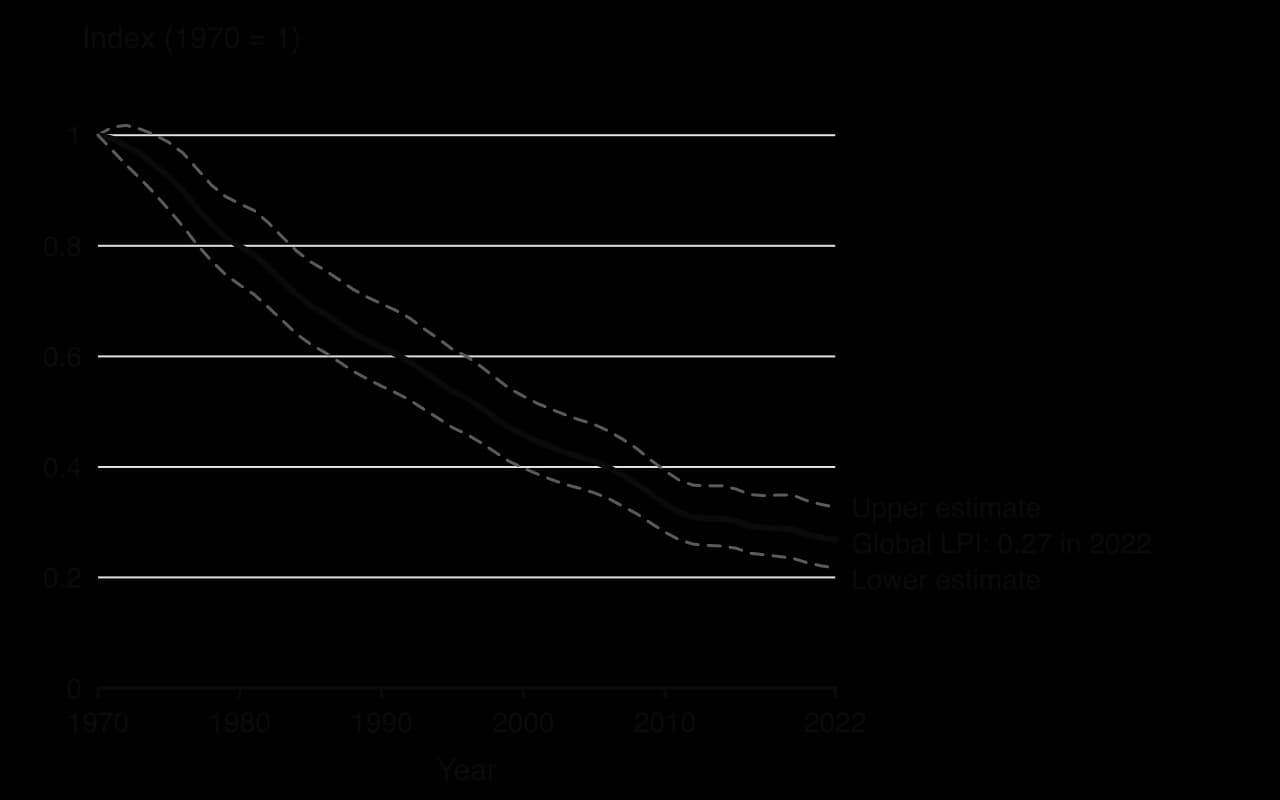
The LPI is useful because it turns thousands of separate studies into one trend that governments and the public can follow, and it has been used to track progress towards targets under the Convention on Biological Diversity. Its limits are equally important:
It is an average rate of change, not a count. A 73% decline does not mean that 73% of all animals, or 73% of species, have been lost.
It covers only vertebrates, because long-term data on plants and invertebrates are scarce.
Data are uneven: Europe and North America have many long records, the tropics far fewer.
Statistical studies in 2020 and 2024 found that a small number of populations with extreme declines strongly affect the average, and that the method may overestimate declines; other scientists defend the index.
Sources: WWF and ZSL, Living Planet Index (2026 data release, via Our World in Data); WWF, _Living Planet Report 2024; “Living Planet Index”, Wikipedia (accessed 2026)._
One way to measure whether a population is living sustainably is to compare what it takes from nature with what nature can supply. The ecological footprint measures demand; biocapacity measures supply.
The footprint adds together six kinds of biologically productive area: cropland for food and fibre; grazing land for meat, milk and wool; forest for timber and paper; fishing grounds for seafood; built-up land covered by buildings and roads; and the forest area that would be needed to absorb the population’s CO₂ emissions. The carbon component is the largest part of humanity’s footprint, about 60% of the total.
Land varies greatly in productivity: a hectare of fertile farmland produces far more than a hectare of desert scrub. To make areas comparable, footprints are measured in global hectares (gha). One global hectare is a hectare with the world-average biological productivity.
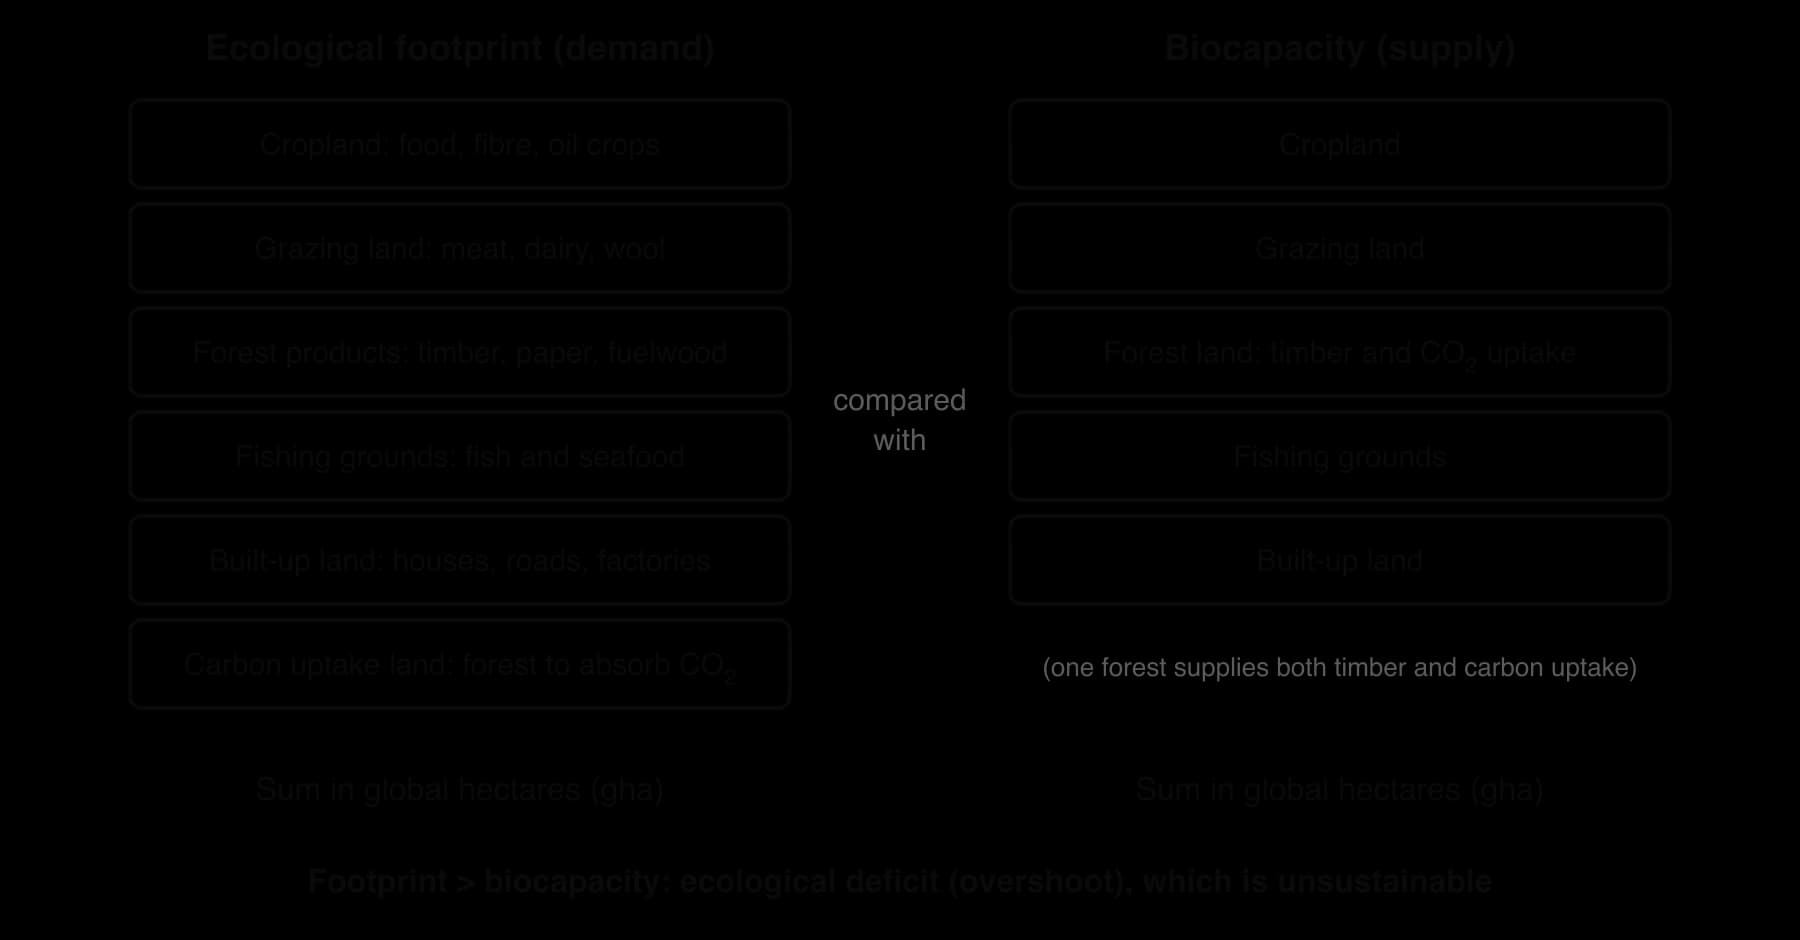
If a population’s ecological footprint is greater than the biocapacity of the area it occupies, it is living unsustainably. It must either import resources from elsewhere, using other places’ biocapacity, or run down its own natural capital, for example by overfishing or by letting CO₂ build up in the atmosphere. At the scale of the whole planet there is nowhere else to import from, so a global footprint larger than global biocapacity is called ecological overshoot.
The Global Footprint Network estimates that humanity first went into overshoot in the early 1970s. It expresses the gap as Earth Overshoot Day, the date in each year by which humanity has used as much as the Earth’s ecosystems can regenerate in the whole year. In 2026 it fell on 30 July, which means humanity is using resources about 1.7 times as fast as they are renewed.
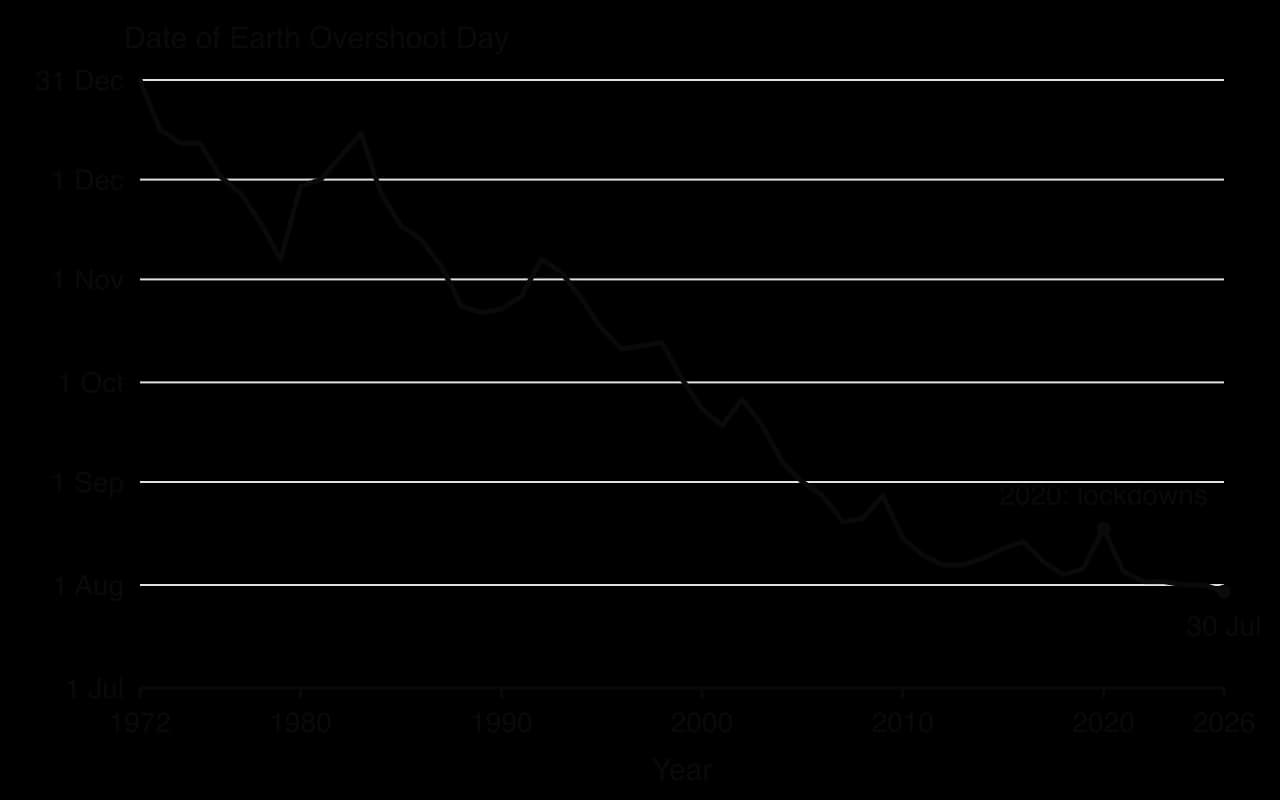
Footprints differ hugely between countries. They depend on how much each person consumes (diet, housing, travel, goods) and on how many people there are, so a country’s total footprint reflects both consumption per person and population size. Biocapacity depends on the area and productivity of a country’s land and sea.
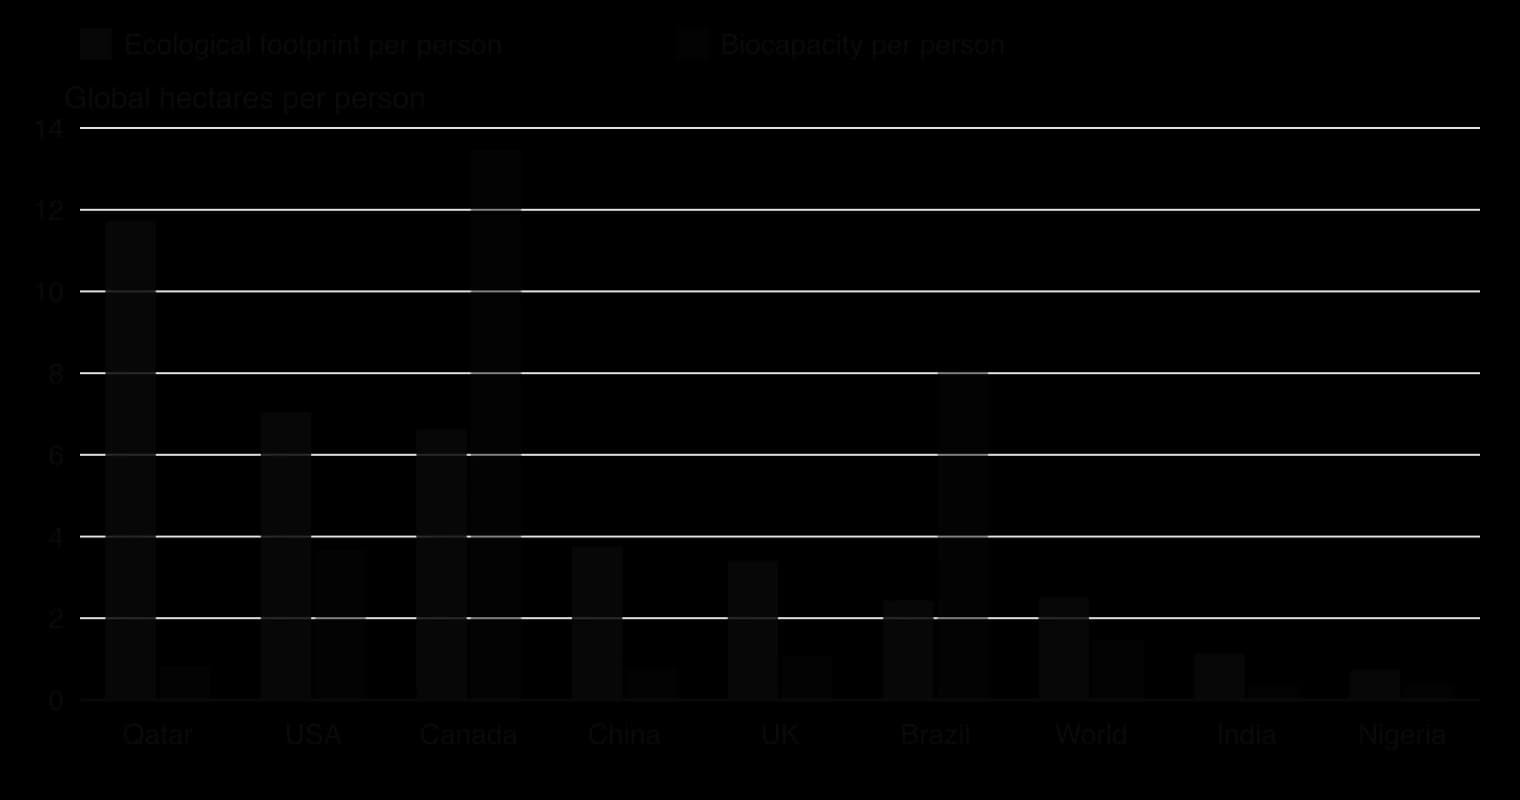
The chart shows two kinds of inequality. High-income countries such as Qatar and the USA have footprints per person several times the world average biocapacity of about 1.5 gha per person, while India and Nigeria have footprints of around 1 gha or less. Many countries with small footprints still run ecological deficits because their large populations live on a small area of biocapacity. If everyone in the world lived like the average resident of the USA, humanity would need several Earths.
Sources: York University, Footprint Data Foundation and Global Footprint Network, National Footprint and Biocapacity Accounts (2025 edition), as tabulated in “List of countries by ecological footprint”, Wikipedia (accessed 2026).
Strengths | Limitations |
|---|---|
Combines many kinds of resource use into one easily understood number | Only covers resources that can be converted into an area; it ignores water use, pollution by toxic chemicals and non-renewable resources such as metals |
Compares demand directly with supply in the same unit | Assumes current yields are sustainable, so it may overestimate biocapacity where soils or aquifers are being degraded |
Allows comparison between people, cities, countries and years | The carbon component depends on the assumption that forests would absorb the CO₂; other ways of removing carbon are not counted |
Shows the global inequality in resource use | Says nothing about the social pillar; it can label dense cities as “unsustainable” because they depend on rural areas |
The ecological footprint is one of a family of footprints. Two others, the carbon footprint and the water footprint, are widely used for individuals, products, companies and countries.
The unit CO₂ equivalent (CO₂e) converts other greenhouse gases, such as methane and nitrous oxide, into the amount of CO₂ that would cause the same warming, so that all of them can be added together. A carbon footprint usually covers both direct emissions, such as burning petrol in a car, and indirect emissions, such as the energy used to make and transport the goods a person buys.
Most of a person’s water footprint is “hidden” in food and goods, not used at home. Meat, cotton and coffee have especially large water footprints because of the water used to grow crops and animal feed. Countries that import water-intensive goods are in effect importing other countries’ water, which matters when the exporting country is short of water.
Footprint | What it measures | Unit | Main use |
|---|---|---|---|
Ecological footprint | Biologically productive land and water needed to supply resources and absorb CO₂ | Global hectares (gha) | Comparing total demand on nature with biocapacity |
Carbon footprint | Greenhouse gases emitted | Tonnes of CO₂ equivalent (t CO₂e) | Tracking contributions to climate change and targets for cutting emissions |
Water footprint | Fresh water used, including water embedded in goods | Cubic metres per year (m³ yr⁻¹) | Showing pressure on water resources, including through trade |
Footprint calculators let individuals estimate their own ecological, carbon and water footprints from questions about diet, travel, housing and shopping. Comparing results within a class, and plotting them in a spreadsheet, shows how strongly footprints depend on lifestyle and which choices make the biggest difference: usually flying, car use, home heating and the amount of meat eaten.
Monitoring the state of the Earth needs enormous amounts of data, collected over large areas and long periods. Professional scientists cannot gather it all, and members of the public now collect a large share of it.
Citizen science plays a role in monitoring Earth systems and in judging whether resources are used sustainably. The information collected is often directly relevant to local problems, such as the water quality of a nearby river, and when it is pooled across many places it also feeds research on global issues such as climate change and biodiversity loss.
The Big Garden Birdwatch (UK), run by the Royal Society for the Protection of Birds since 1979: in 2024 more than 600,000 people counted almost 10 million birds over one weekend, giving trends in common garden species over decades.
iNaturalist: a smartphone platform on which people upload photographs of plants and animals; the records are identified by the community and used by scientists. The South African National Biodiversity Institute uses it to monitor biodiversity.
eBird: birdwatchers’ checklists submitted from around the world, used to map bird distributions and migration routes and to detect changes in range linked to climate change.
Snapshot Serengeti and Wildcam Gorongosa on the Zooniverse platform: volunteers classify animals in camera-trap photographs from Tanzania and Mozambique.
Sources: “Citizen science”, Wikipedia (accessed 2026), citing RSPB Big Garden Birdwatch results (2024).
Strengths of citizen science | Limitations of citizen science |
|---|---|
Collects far more data, over larger areas and longer periods, than professionals could afford | Data quality varies: untrained volunteers may misidentify species or follow methods inconsistently |
Low cost | Sampling is biased towards places where people live and towards popular, easily seen species |
Engages the public, raising awareness and support for environmental action | Effort varies over time (more observers, not more birds, can raise counts), which complicates trends |
Local knowledge, including Indigenous knowledge, can be included | Requires careful design, training and data checking by professionals |
Projects reduce the limitations by giving simple protocols, training volunteers, using photographs that experts can check and applying statistical methods that allow for uneven effort. Well-designed citizen science is now used in official monitoring and published research.
Several frameworks try to describe what a sustainable world would look like and how to get there. Each is a model: a simplified representation of reality that highlights some features and leaves out others. Each therefore has uses and limitations. Four are widely used today: the Sustainable Development Goals, the planetary boundaries model, doughnut economics and the circular economy.
On 25 September 2015 all 193 member states of the United Nations adopted the 2030 Agenda for Sustainable Development. At its centre are 17 Sustainable Development Goals (SDGs), with 169 targets to be met mostly by 2030 and more than 230 indicators to measure progress.
The goals address poverty, hunger, health, education, gender equality, water and sanitation, energy, decent work, industry, inequality, cities, consumption and production, climate, life below water, life on land, peace and justice, and partnerships. Together they cover all three pillars of sustainability. Their guiding principle is to “leave no one behind”.
The SDGs replaced the eight Millennium Development Goals (2000–2015), which applied mainly to lower-income countries. The SDGs apply to every country, rich and poor, and were negotiated more openly, with input from civil society as well as governments. They are not legally binding: each government decides how to pursue them and reports its progress voluntarily.
SDG | Short title | Example of a link to the environment |
|---|---|---|
6 | Clean water and sanitation | Safe drinking water; treatment of wastewater before release |
7 | Affordable and clean energy | Electricity access; share of renewable energy |
12 | Responsible consumption and production | Halving food waste; reducing waste generation |
13 | Climate action | Cutting greenhouse gas emissions; adapting to climate impacts |
14 | Life below water | Ending overfishing; reducing marine pollution |
15 | Life on land | Halting deforestation and biodiversity loss |
Uses | Limitations |
|---|---|
Provide common ground and a shared language for policymaking across governments, businesses and charities | Many argue the goals do not go far enough on the environment; several targets rely on continued economic growth (SDG 8) |
Apply to developed and developing countries alike | Top-down and bureaucratic: 17 goals and 169 targets are hard to prioritise, and some goals conflict (ending hunger may need more farmland; growth may raise emissions) |
Have galvanised the international community on economic and social inequality | Tend to ignore local contexts: global targets may not suit a particular community or ecosystem |
Link the environment to poverty, health and justice rather than treating them separately | Lack supporting data in many countries, so progress is hard to measure; not legally binding |
Progress has been slow. The UN’s Sustainable Development Goals Report 2025 found that only about 35% of targets were on track or making moderate progress, nearly half were moving too slowly, and about 18% had gone backwards since 2015. The COVID-19 pandemic, conflicts and debt in lower-income countries all set progress back.
Sources: United Nations, _Sustainable Development Goals Report 2025; “Sustainable Development Goals”, Wikipedia (accessed 2026)._
For roughly the last 12,000 years the Earth has been in an unusually stable period called the Holocene. Global temperature, sea level and the chemistry of the oceans and atmosphere varied only within narrow limits. Farming, cities and every human civilisation developed in these conditions. The planetary boundaries model asks how far human activity can push the Earth system before it risks leaving this stable state.
The area inside all nine boundaries is called the safe operating space for humanity. For each process the scientists chose a measurable control variable, such as the CO₂ concentration of the atmosphere, and set the boundary at a cautious value, before the point at which they expect dangerous change might begin. Beyond the boundary lies a zone of increasing risk and then, for some processes, a high-risk zone. The boundaries apply the precautionary principle: because tipping points are uncertain, the limit is set on the safe side of them.
Boundary | What it tracks | Main human causes |
|---|---|---|
Climate change | Atmospheric CO₂ concentration and radiative forcing | Burning fossil fuels, deforestation, agriculture |
Biosphere integrity | Extinction rate (genetic diversity) and the share of plant production taken by people (functional integrity) | Habitat loss, overexploitation, invasive species |
Land-system change | Remaining forest cover as a share of the original | Clearing land for farming, grazing and settlements |
Freshwater change | Disturbance of river flows (blue water) and soil moisture (green water) | Irrigation, dams, deforestation, climate change |
Biogeochemical flows | Nitrogen fixed for fertiliser and phosphorus applied to fields | Fertiliser use, intensive livestock farming |
Ocean acidification | Saturation of surface seawater with aragonite (a form of calcium carbonate) | CO₂ dissolving in the oceans |
Atmospheric aerosol loading | Difference in particle pollution between the two hemispheres | Burning fossil fuels and biomass, industry |
Stratospheric ozone depletion | Ozone in the stratosphere (in Dobson units) | CFCs and other ozone-depleting substances |
Novel entities | Synthetic chemicals, plastics and other new materials released without adequate safety testing | Industry, agriculture, consumer products |
Each process has its own causes and evidence: biosphere integrity belongs with the study of ecosystems and biodiversity, ocean acidification and nitrogen with the biogeochemical cycles, freshwater with water security, and ozone with the stratosphere.
Some terms are new here. Land-system change is the conversion of forests, grasslands and wetlands to other uses. Freshwater change covers human disturbance of both rivers and soil moisture. Biogeochemical flows are the flows of nitrogen and phosphorus, mostly from fertilisers. Atmospheric aerosol loading is the amount of fine particles in the air, which affects monsoon rainfall and health. Novel entities are human-made substances, from pesticides to plastics, that did not exist in nature before.
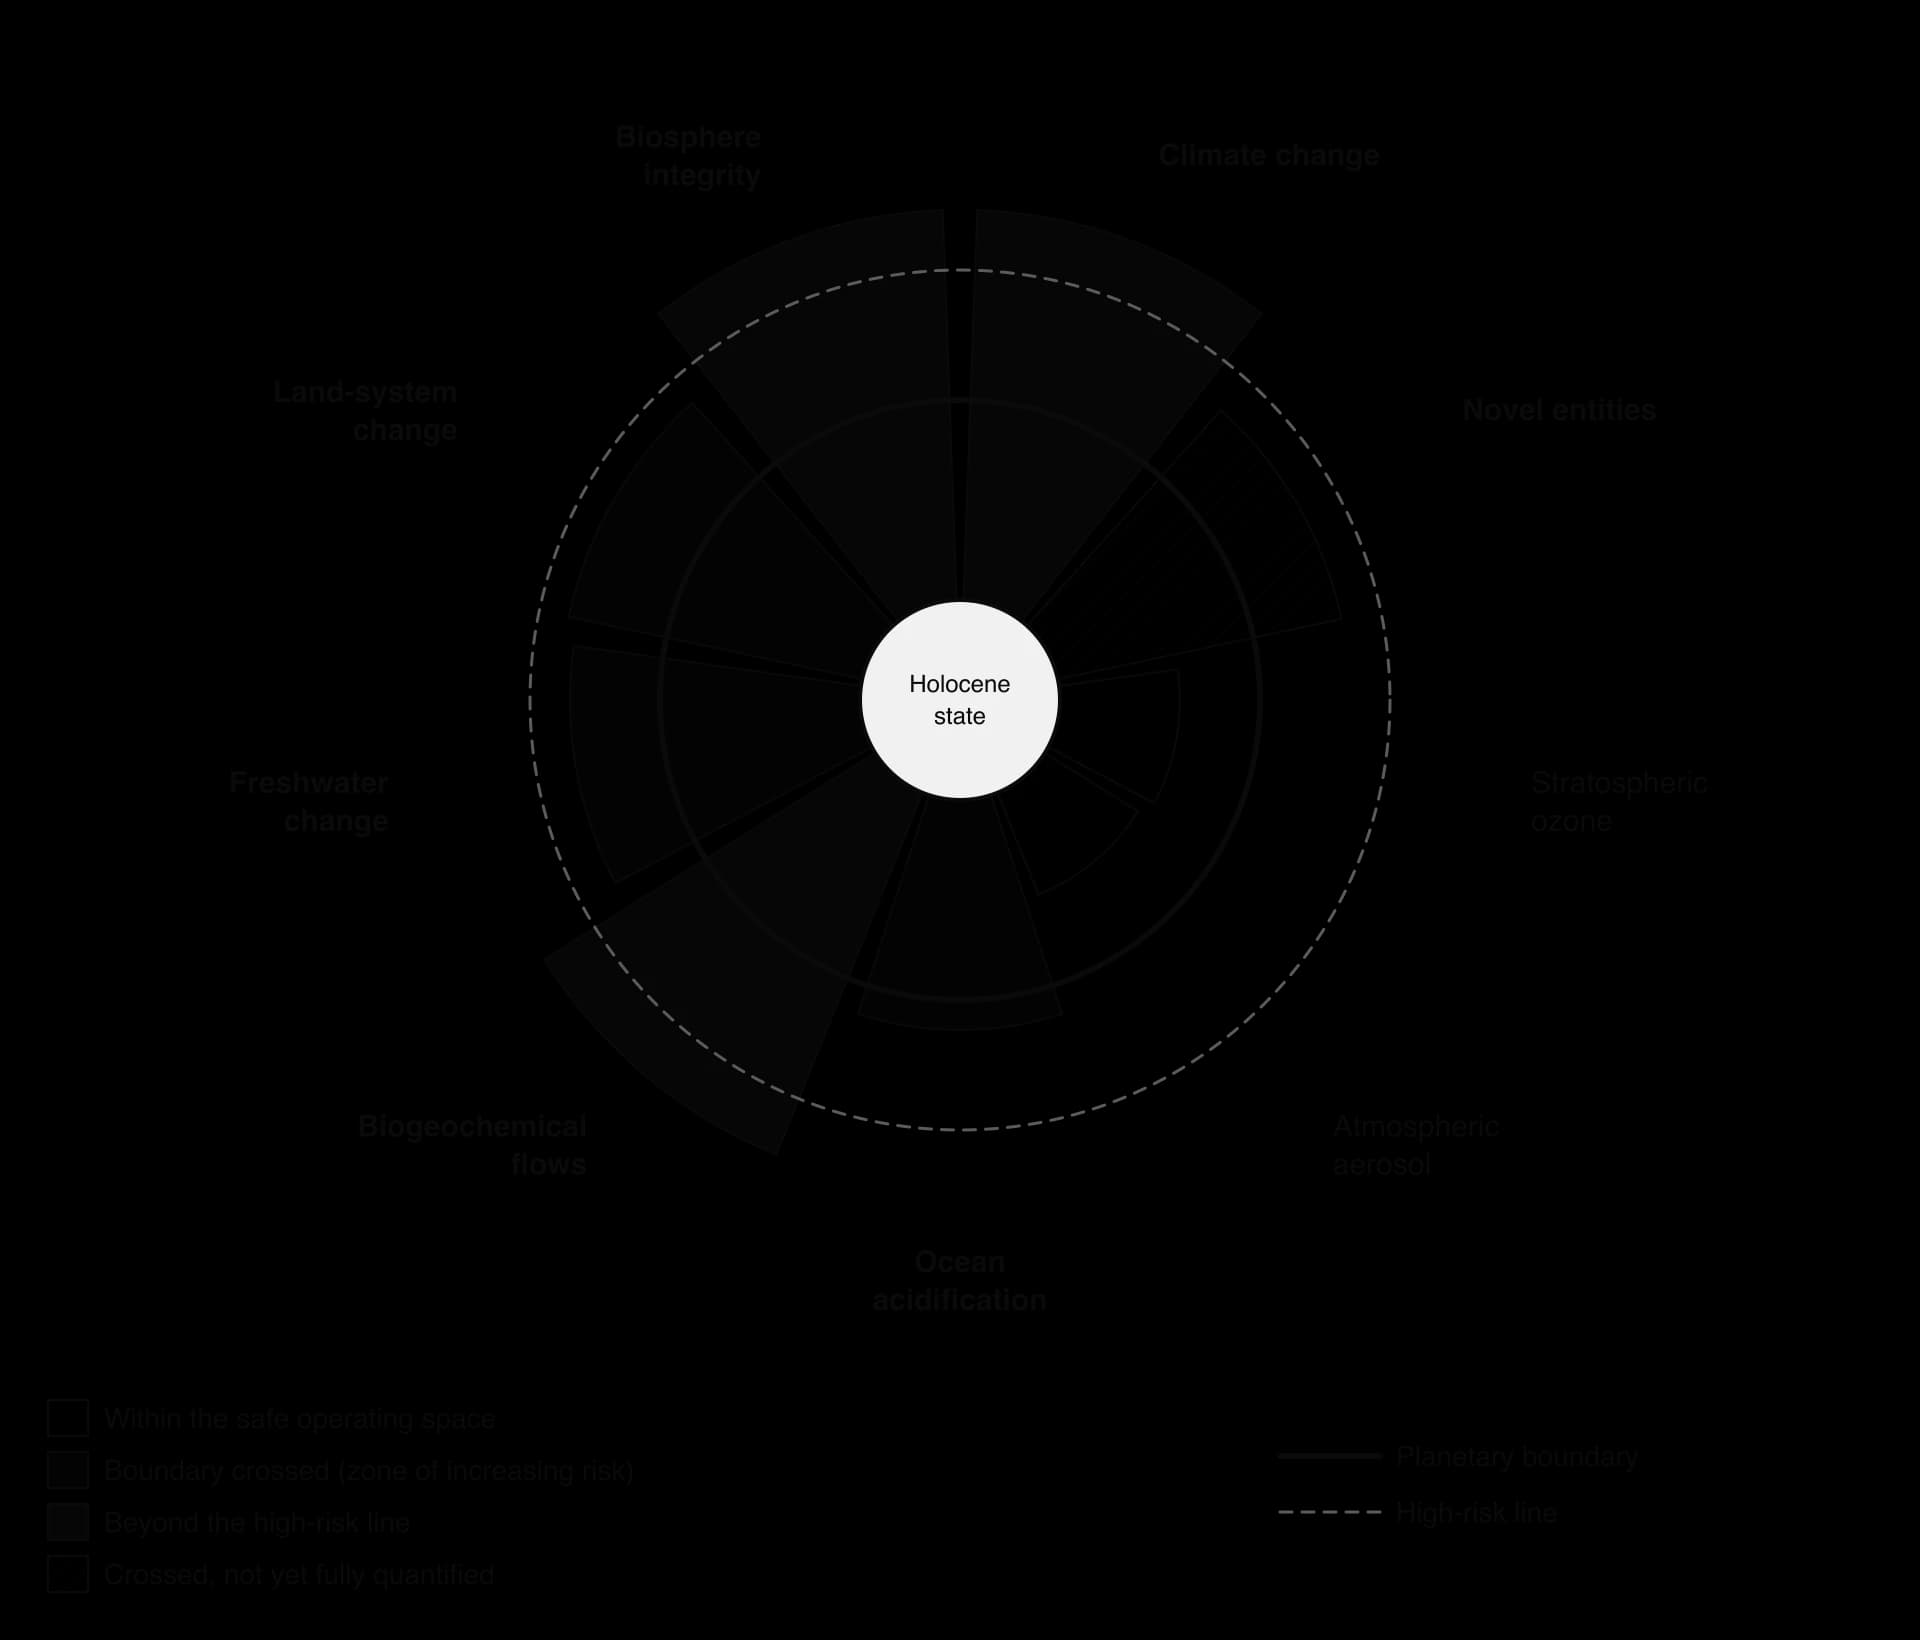
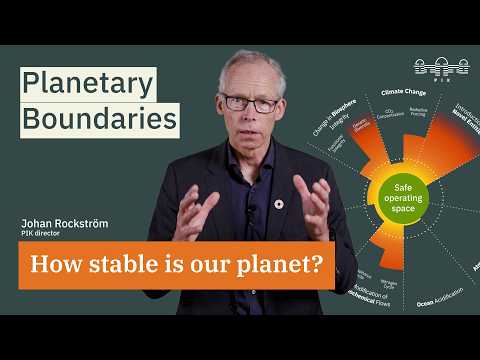
The assessment of the boundaries changes as new data arrive. In 2009 three boundaries were judged to have been crossed; the 2015 update found four. In 2023 a study led by Katherine Richardson concluded that six of the nine had been crossed, and in 2025 the second annual Planetary Health Check added ocean acidification as the seventh. The 2026 check found the same seven boundaries crossed, all of them still under increasing pressure.
Status (2025) | Boundaries | Main factors that led to this |
|---|---|---|
Crossed | Climate change, biosphere integrity, land-system change, freshwater change, biogeochemical flows, novel entities, ocean acidification | Rapid growth since about 1950 in fossil fuel use, farmland, fertiliser use, water withdrawal and chemical production, driven by population growth and much higher consumption per person in high-income countries |
Not crossed | Atmospheric aerosol loading | Air pollution controls have reduced aerosol emissions in many countries, although regional pollution remains severe |
Not crossed | Stratospheric ozone depletion | The Montreal Protocol (1987) phased out CFCs, so the ozone layer is slowly recovering |
The ozone boundary shows that a boundary can be pulled back from the edge. When the cause is clear and a substitute exists, international action can work. Many of the other boundaries are harder to address because the causes, such as fossil fuels and fertilisers, lie at the heart of how the world feeds and powers itself.
Sources: Rockström et al., _Nature (2009); Steffen et al., Science (2015); Richardson et al., Science Advances (2023); Potsdam Institute for Climate Impact Research, Planetary Health Check 2025 and 2026._
 YouTube
Uses | Limitations |
|---|---|
Sets science-based limits for human pressure on the Earth system | Covers only ecological systems: it ignores the human dimension, such as poverty and inequality, needed for environmental justice |
Shows that the environmental crisis is more than climate change, and that the processes interact | A work in progress: control variables and boundary values change as new data arrive, and novel entities are hard to quantify |
Alerts the public and policymakers to the urgency of action, with a simple visual | Global boundaries do not say what a single country, city or company should do, and do not show who caused the pressure |
Applies the precautionary principle to uncertain tipping points | Some boundaries, such as the nitrogen limit, clash with feeding the world population, and lower-income countries fear limits will block their development |
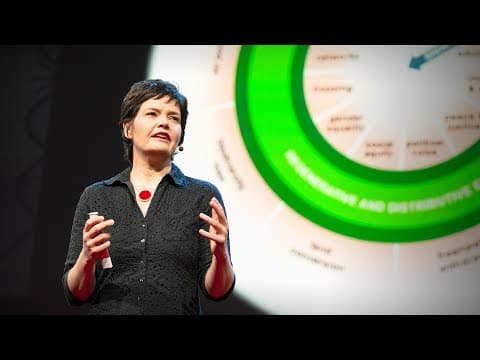
The planetary boundaries show the outer limits of human activity, but they say nothing about whether people’s basic needs are met. In 2012 the economist Kate Raworth, then working for Oxfam, added a second, inner boundary for human well-being. The resulting diagram looks like a ring doughnut, which gave doughnut economics its name, and she developed the idea in her 2017 book Doughnut Economics.

The model has three parts:
The social foundation (the inner ring) is based on the social goals of the SDGs. It has 12 dimensions: food, health, education, income and work, peace and justice, political voice, social equity, gender equality, housing, networks, energy and water. Anyone below it is in shortfall.
The ecological ceiling (the outer ring) is based on the science of the planetary boundaries. Its nine dimensions are climate change, ocean acidification, chemical pollution, nitrogen and phosphorus loading, freshwater withdrawals, land conversion, biodiversity loss, air pollution and ozone layer depletion. Pressure beyond it is overshoot.
Between the two lies the safe and just space for humanity, where everyone’s needs are met without degrading the planet.
At present humanity is outside the doughnut in both directions. Billions of people fall short of the social foundation, lacking enough food, clean water, energy or political voice, while humanity has overshot most of the planetary boundaries. A 2018 study of 150 countries found that none met its citizens’ basic needs while keeping its resource use at a globally sustainable level.
Raworth argues that economies will not reach the doughnut simply by growing. They need to be redesigned in two ways.
Examples of regenerative design include farming that builds soil carbon, buildings that generate more energy than they use, and the circular economy, in which materials are kept in use.
Distributive design includes fairer wages, cooperative ownership of businesses, open access to knowledge and land, and taxes that share wealth. Raworth also accepts that significant GDP growth is still needed in low- and middle-income countries to lift people over the social foundation; her criticism is of growth pursued for its own sake in rich countries.
 YouTube
The model has been applied at many scales. In April 2020 Raworth’s team and the City of Amsterdam introduced the Amsterdam City Doughnut, which the city used in its planning for recovery from the COVID-19 pandemic. Doughnut analyses have also been made for Wales, Scotland, South Africa and the Erhai lake catchment in China.
Uses | Limitations |
|---|---|
Combines ecological and social elements, so it supports environmental justice | A work in progress: the dimensions and the data used to measure them are still being developed as groups try to apply it |
Simple, memorable visual that is popular with the public | Offers broad principles but no specific policies; it does not say how to move a country into the doughnut |
Used at many scales: countries, cities, neighbourhoods and businesses | Social thresholds (how much energy or income is “enough”) are value judgements that differ between cultures |
Challenges the assumption that GDP growth is always good | Critics argue it underestimates the role of growth and technology in reducing poverty |
Sources: Raworth, _A Safe and Just Space for Humanity, Oxfam (2012); Raworth, Doughnut Economics (2017); O’Neill et al., Nature Sustainability (2018)._
Most of the world’s economy still works in a straight line. Raw materials are taken from the Earth, made into products, used, often briefly, and thrown away. This is the linear economy, often summarised as “take, make, waste”.
The linear model depends on a constant supply of new raw materials and a place to put waste, and both are running short. A circular economy aims to break this link between economic activity and the consumption of finite resources.
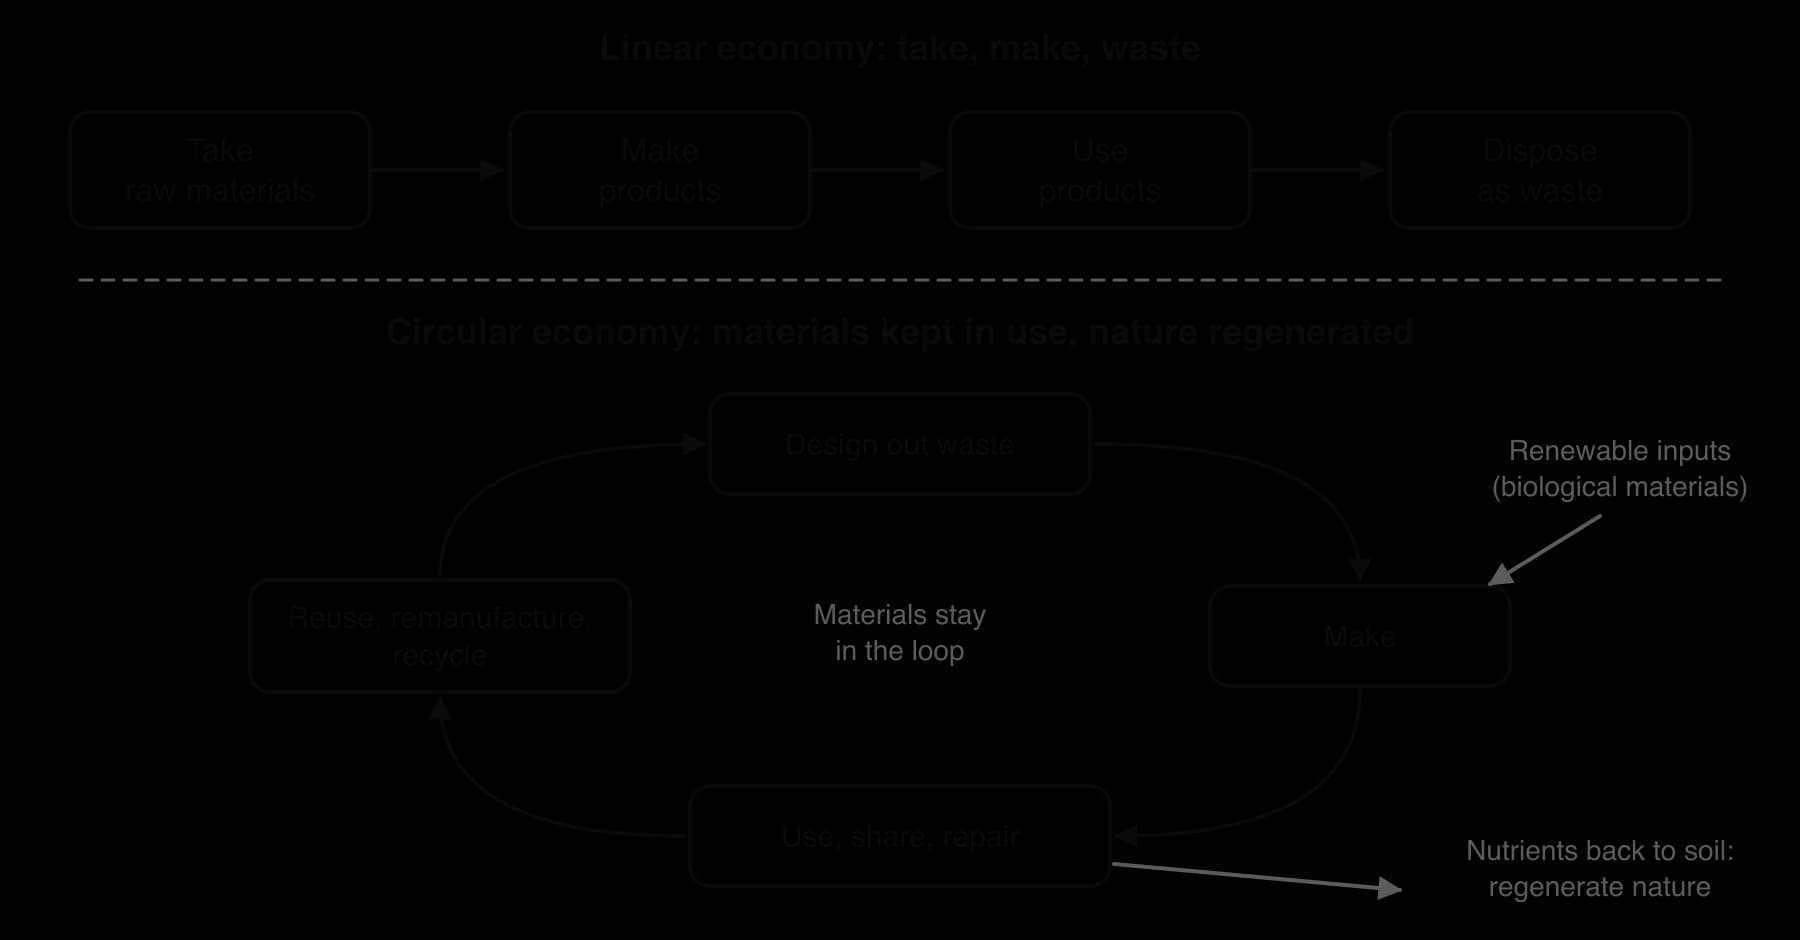
The three principles work together:
Eliminate waste and pollution at the design stage, for example with packaging that can be reused or composted, or products without toxic materials.
Circulate products and materials at their highest value for as long as possible: sharing, repair, reuse, remanufacture and, last, recycling.
Regenerate nature: returning biological nutrients to the soil and shifting from extracting resources to restoring ecosystems.
A circular economy aims for decoupling: economic activity, measured in output or well-being, continuing or growing while the use of finite resources falls. This is the opposite of the linear model, in which more output always means more extraction and more waste.
The Ellen MacArthur Foundation, a UK charity that has done much to spread the idea, illustrates the circular economy with the butterfly diagram. Materials flow down the centre from extraction through manufacture to the user. Instead of leaving the system as waste, they loop back on two “wings”.
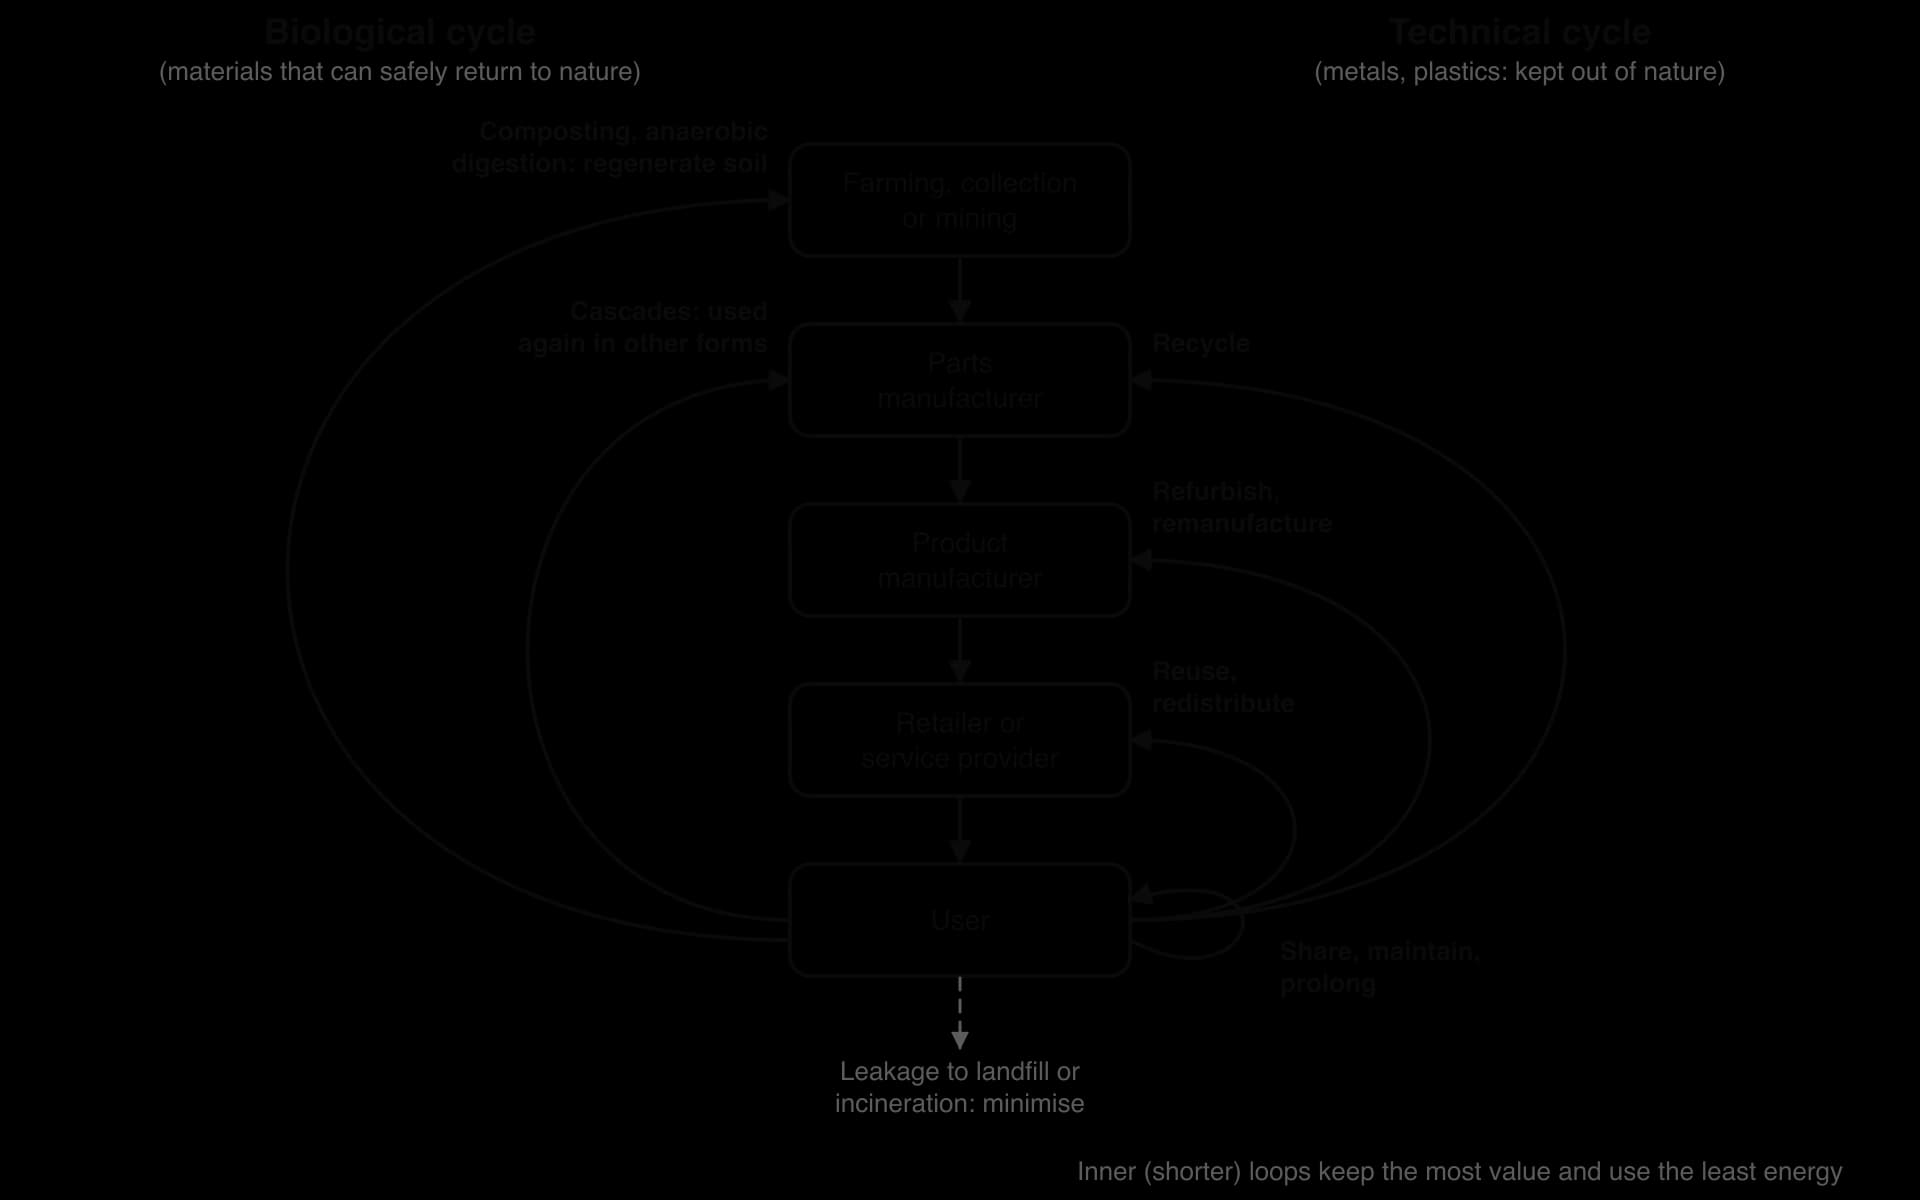
The technical cycle (right) is for materials that do not break down safely, such as metals and most plastics. They are kept in the economy by sharing, maintaining, reusing and redistributing, refurbishing and remanufacturing, and finally recycling.
The biological cycle (left) is for materials that can safely return to nature, such as food, wood and cotton. They can be cascaded into other uses (for example, waste wood into fibreboard), then composted or digested anaerobically, returning nutrients to the soil and regenerating the land.
The inner loops matter most. Repairing a phone keeps almost all its value and uses little energy; recycling it recovers only some of the metals and needs a lot of energy. This is why recycling, although useful, is the last resort in a circular economy rather than its main goal.
Uses | Limitations |
|---|---|
Regenerates natural systems by returning nutrients and reducing extraction | Lack of awareness among consumers and companies of what circular design involves |
Reduces greenhouse gas emissions from mining, manufacturing and waste | Lack of regulation to enforce repair, reuse and recycling; linear products are often cheaper |
Supports local food networks and communities, such as repair cafés and community composting | Technical limits: some wastes cannot be recycled, and every cycle loses some material and needs energy |
Reduces waste by extending product life cycles | Lack of finance for new infrastructure and business models |
Changes consumer habits from owning to sharing and leasing | Savings may be cancelled out if cheaper, longer-lasting goods lead people to consume more |
The world is still far from circular. The Circularity Gap Report 2020 estimated that only 8.6% of the minerals, biomass, fossil fuels and metals entering the global economy were reused. China made the circular economy a national policy in its five-year plan from 2006, and the European Union adopted a Circular Economy Action Plan in 2020.
Sources: Ellen MacArthur Foundation; Circle Economy, _Circularity Gap Report 2020; “Circular economy”, Wikipedia (accessed 2026)._
No single framework covers everything. Each makes some features of sustainability easy to see and leaves others out, and different perspectives favour different ones.
Framework | What it shows best | Main gap | Closest perspective |
|---|---|---|---|
Strong and weak sustainability | Whether natural capital can be substituted | No measurement or targets | Strong: ecocentric; weak: technocentric |
Ecological footprint and biocapacity | Demand on nature compared with supply, in one number | Ignores non-renewable resources and toxic pollution | Anthropocentric resource accounting |
SDGs | Social and environmental goals together, with targets for every country | Voluntary; can rely on growth; many trade-offs | Anthropocentric, development-focused |
Planetary boundaries | Science-based limits for the whole Earth system | No social dimension; hard to apply locally | Precautionary; protects a safe space for humanity, but often favoured by ecocentrics |
Doughnut economics | Social floor and ecological ceiling together | Broad principles, few specific policies | Between anthropocentric and ecocentric |
Circular economy | How to redesign production and consumption | Technical limits; does not address equity directly | Technocentric (redesign and innovation) |
Used together, the frameworks are stronger. The planetary boundaries set the ecological ceiling of the doughnut, the SDGs set its social foundation, footprints measure where a country stands, and the circular economy offers one way of moving inside the doughnut.
Ogoniland is the homeland of the Ogoni people, an ethnic minority in Rivers State in the Niger Delta of southern Nigeria, east of the city of Port Harcourt. It covers about 1,050 km² of low plateau, creeks and mangrove swamps near the Gulf of Guinea. Estimates of its population range from about half a million to over two million. Most Ogoni have traditionally lived by farming yams and other crops, fishing in the creeks and producing palm oil.
Commercially viable oil was found in the Niger Delta in 1956 and production began in 1958. From the late 1950s oil companies, led by the Shell Petroleum Development Company in a joint venture with the Nigerian state, took over land in Ogoniland that had belonged to farming and fishing communities. Pipelines, flow lines, wellheads and flare stacks were built through farmland and mangrove creeks. Oil soon became the centre of Nigeria’s economy, while the Ogoni were one of many small ethnic groups with little political power in a large country.
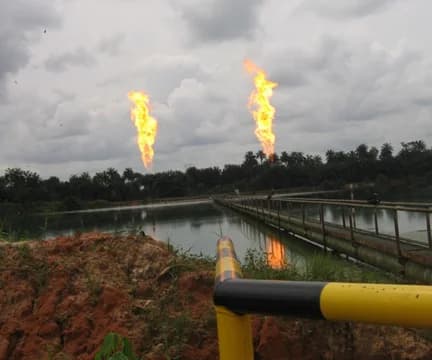
Seen as a system, oil extraction in Ogoniland had one main output to the outside world, crude oil and the revenue from selling it, which flowed to the federal government and to the oil companies. Many of its other outputs stayed in Ogoniland: oil spilled from corroded pipes, blowouts and sabotage, gas burned in flares, and waste discharged into creeks and soil.
From 1976 to 1991 about 2,976 oil spills released roughly 2.1 million barrels of oil in Ogoniland, reported to be about 40% of all Shell’s spills worldwide in that period.
Oil soaked into the soils, killed mangroves and contaminated the creeks on which fishing depended.
Hydrocarbons and benzene, a cause of cancer, entered the groundwater from which many communities drew their drinking water.
Gas flaring released air pollutants and greenhouse gases and lit the sky near villages.
In 1990 the Movement for the Survival of the Ogoni People (MOSOP), led by the writer Ken Saro-Wiwa, issued the Ogoni Bill of Rights. It demanded political autonomy for the Ogoni, a fair share of oil revenue and the clean-up of their land. On 4 January 1993 about 300,000 Ogoni, more than half of the population, marched peacefully. Later that year Shell withdrew its staff from Ogoniland and output from the area fell sharply; the military occupied the region. In 1995, after a trial widely condemned as unfair, Saro-Wiwa and eight other Ogoni leaders were executed by the military government, and Nigeria was suspended from the Commonwealth.
At the request of the Nigerian government, the United Nations Environment Programme (UNEP) carried out a scientific assessment of Ogoniland, published in 2011. It examined more than 200 locations and found that the damage from 50 years of oil production was deeper and more widespread than had been thought.
Finding | Result |
|---|---|
Locations assessed | More than 200 sites across Ogoniland |
Soils | Hydrocarbon pollution in soil at many sites; land no longer viable for farming in places |
Drinking water | In one community, benzene in well water about 900 times the World Health Organization guideline |
Mangroves and creeks | Mangroves killed and fisheries damaged by oil on water and sediments |
Time for restoration | Up to 30 years for full recovery of soils, water and mangroves |
Cost | About US$1 billion needed for the first five years of clean-up |
Sources: UNEP, _Environmental Assessment of Ogoniland (2011), as summarised in “Ogoni people”, Wikipedia (accessed 2026)._
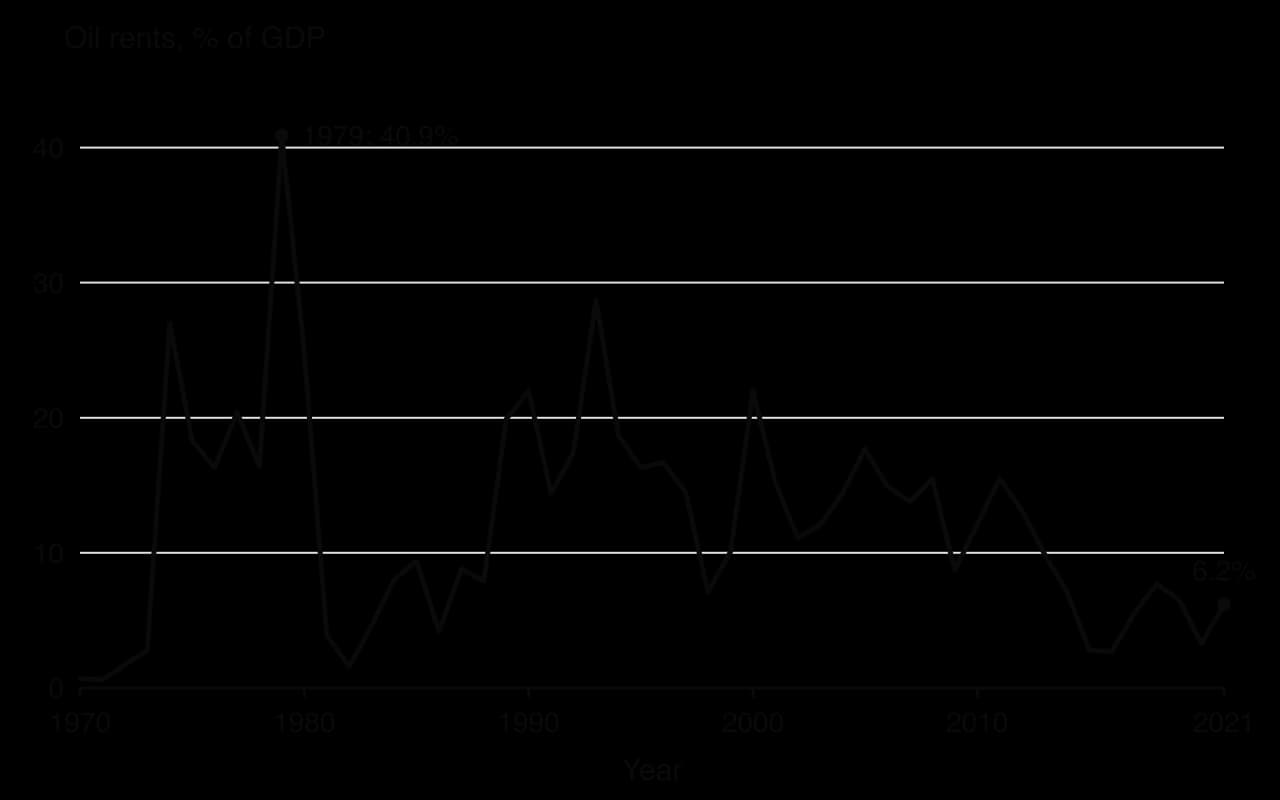
At the national scale, oil revenue has been a large part of Nigeria’s economy. The World Bank measures “oil rents”, the value of oil produced minus the cost of producing it, as a share of GDP. These rents peaked at about 41% of GDP in 1979 and stayed between about 10% and 25% in most years from 1989 to 2012.
Different stakeholders responded from very different perspectives.
Stakeholder | Perspective and position | Actions |
|---|---|---|
Ogoni communities and MOSOP | Land, water and culture are the basis of their survival; justice requires control over resources and clean-up | Ogoni Bill of Rights (1990), mass protest (1993), campaigns and lawsuits |
Federal government of Nigeria | Oil revenue funds national development and holds the country together | Military occupation in the 1990s; later commissioned the UNEP study and set up the Hydrocarbon Pollution Remediation Project (HYPREP) |
Shell and its joint-venture partners | Many spills are caused by sabotage and oil theft, not by the company’s operations; communities dispute this | Withdrew staff in 1993; settled lawsuits without admitting liability |
UNEP and international NGOs | Scientific evidence and human rights | Environmental assessment (2011); campaigns by groups such as Amnesty International |
Courts in the USA, UK and the Netherlands | Companies can be held responsible abroad | In 2009 Shell paid US$15.5 million to settle a case brought by the families of Saro-Wiwa and the other executed men; in 2015 it agreed to pay compensation to the Bodo community for two spills in 2008 |
HYPREP was first set up in 2011, then relaunched on 2 June 2016 with the start of clean-up at the Bodo waterfront, and given a project coordination office in 2017. HYPREP has since remediated polluted sites, replanted mangroves and built drinking-water projects in 49 Ogoni communities, but in 2025 and 2026 local groups protested to demand accountability and transparency in the clean-up.
Sources: “Movement for the Survival of the Ogoni People”, “Ken Saro-Wiwa”, “Hydrocarbon Pollution Remediation Project” and “Environmental issues in the Niger Delta”, Wikipedia (accessed 2026).
Environmental sustainability. Oil is a non-renewable resource, and its extraction in Ogoniland ran down renewable natural capital as well: mangroves, fish stocks, farmland and groundwater. On the strong sustainability model this is a clear failure, because the services of the creeks and soils could not be replaced by the money earned from oil. On the weak model, the outcome depends on whether the oil revenue was invested in lasting human and manufactured capital, and very little of it reached Ogoniland.
Social and economic sustainability. Ogoni livelihoods based on fishing and farming were damaged, health was put at risk, and the conflict of the 1990s killed many people and displaced many more. The economic benefits went mostly to the federal government, the companies and their shareholders, far from the people who carried the costs. In GDP terms Nigeria became richer; in green GDP terms, which would subtract the depletion of oil and the damage to ecosystems and health, the gain would have been much smaller.
Environmental justice. Ogoniland fits the definition of environmental injustice closely. A small, poor ethnic minority without political power bore the pollution, while the benefits flowed to others. The case operates at every scale: the community (Ogoni villages), the country (Nigeria’s oil-dependent federal state), multinational business (Shell) and the global (international courts, UNEP and the global oil market whose consumers used the oil).
Effectiveness of the response. The clean-up is the first large-scale attempt to restore oil-damaged land in the Niger Delta and shows that a government can accept responsibility. However, it started about five years after the UNEP report, has been criticised as slow, and does not address continuing spills from theft and old pipelines elsewhere in the Delta. The question of who should pay, the state, the companies or both, remains disputed. An ecocentric view stresses the restoration of the mangroves for their own sake; an anthropocentric view stresses the health and livelihoods of the Ogoni; a technocentric view looks to remediation technology to clean the soil.
Ogoniland shows how an activity can raise GDP while running down natural capital, how unsustainable resource use and environmental injustice reinforce each other, and why all three pillars of sustainability must be considered together. It links directly to several SDGs: clean water and sanitation (SDG 6), life below water and on land (SDGs 14 and 15), and peace, justice and strong institutions (SDG 16). It also shows the operating scales of environmental justice, from a single community to global courts.
Sources: UNEP (2011); World Bank (2026); “Ogoni people” and related Wikipedia articles (accessed 2026).
Each planetary boundary is defined by a control variable with a numerical limit. Deciding whether a boundary has been crossed therefore means comparing a measured value with the boundary value, and deciding when it was crossed means finding the year in a time series when the measured value first passed the limit. Both steps depend on the quality of the data and on the choice of the pre-industrial reference value.
Boundary (control variable) | Planetary boundary | High-risk line | Current value (2026 assessment) | Status |
|---|---|---|---|---|
Climate change (atmospheric CO₂) | 350 ppm | 450 ppm | 426 ppm | Crossed |
Climate change (radiative forcing) | +1.0 W m⁻² | +1.5 W m⁻² | +3.10 W m⁻² | High risk |
Biosphere integrity (extinctions per million species-years) | 10 | 100 | 100–1,000 | High risk |
Biosphere integrity (human appropriation of net primary production) | 10% | 20% | 21–30% | High risk |
Land-system change (global forest cover, % of potential) | 78% | 54% | 64% | Crossed |
Freshwater change (land with disturbed streamflow, blue water) | 12.9% | 50% | 22.6% | Crossed |
Freshwater change (land with disturbed soil moisture, green water) | 12.4% | 50% | 22.0% | Crossed |
Biogeochemical flows (nitrogen fixed for agriculture) | 62 Tg yr⁻¹ | 82 Tg yr⁻¹ | 165 Tg yr⁻¹ | High risk |
Biogeochemical flows (mined phosphorus applied to cropland) | 6.2 Tg yr⁻¹ | 11.2 Tg yr⁻¹ | 18.2 Tg yr⁻¹ | High risk |
Ocean acidification (aragonite saturation, Ω) | 2.86 | 2.50 (provisional) | 2.85 | Crossed (just) |
Aerosol loading (interhemispheric difference in aerosol optical depth) | 0.10 | 0.25 | 0.07 | Safe |
Stratospheric ozone (global mean, Dobson units) | 277 DU | 263 DU | 286 DU | Safe |
Novel entities (% of synthetic chemicals released untested) | 0% | not set | not quantified | Crossed |
Sources: Potsdam Institute for Climate Impact Research, _Planetary Health Check 2026. Tg = teragram = one million tonnes._
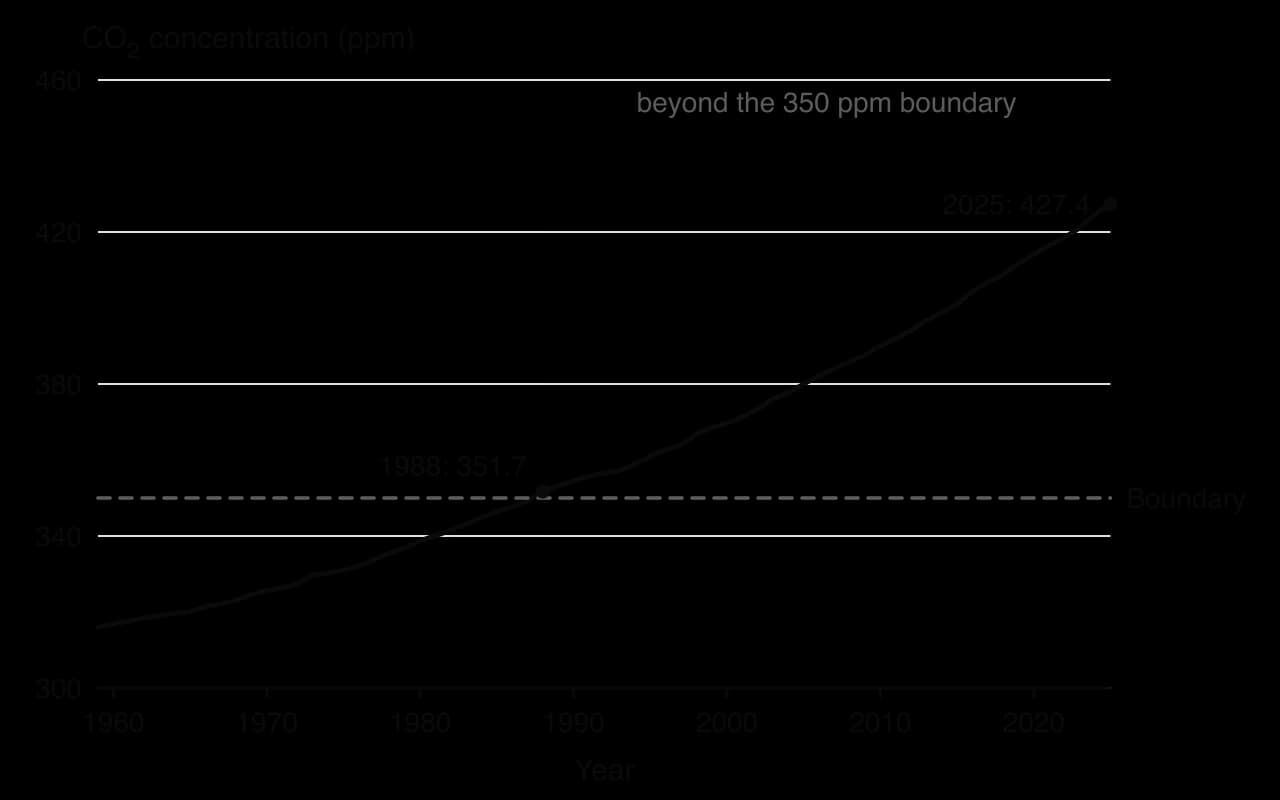
The values in the table come from the most recent data available to the assessment, so some are a year or more old. The CO₂ value of 426 ppm is therefore slightly lower than the 2025 annual mean measured at Mauna Loa (427 ppm).
For most control variables a higher value means more pressure, so a boundary is crossed when the value rises above the limit. For forest cover, aragonite saturation and ozone the direction is reversed: the boundary is crossed when the value falls below the limit. Reading the direction correctly is the first step in any judgement.
The climate boundary is the easiest to date because atmospheric CO₂ has been measured continuously at Mauna Loa, Hawaii, since 1958. The annual mean first rose above 350 ppm in 1988. Other boundaries can be dated from historical reconstructions: the 2023 assessment estimated that the blue-water boundary was crossed around 1905, the green-water boundary around 1929, the functional biosphere boundary in the late nineteenth century and the land-system boundary around 1988. Such dates depend on the method: the 2026 Planetary Health Check, using a newer reconstruction, places both freshwater crossings around the 1940s.
A useful way to compare boundaries measured in different units is to express the current value as a multiple of the boundary value. For nitrogen, 165 Tg yr⁻¹ ÷ 62 Tg yr⁻¹ = 2.7, so humanity fixes almost three times as much nitrogen for fertiliser as the boundary allows. For phosphorus, 18.2 ÷ 6.2 = 2.9; for radiative forcing, 3.10 ÷ 1.0 = 3.1.
Along with the extinction rate, which is ten to a hundred times its boundary but known only roughly, these are among the largest exceedances of any quantified boundary. For this reason fertiliser use, as well as fossil fuel use, is a central target of policies for staying within planetary limits.
Ocean acidification shows that whether a boundary “has been crossed” depends on the data and the reference values used, not only on the state of the ocean. The control variable is the saturation state of surface seawater with respect to aragonite (Ω), the form of calcium carbonate used by corals and many shelled organisms. The boundary is set at 80% of the pre-industrial value.
Assessment | Pre-industrial Ω used | Boundary (80%) | Measured Ω | Judgement |
|---|---|---|---|---|
Richardson et al. (2023) | 3.44 | 2.75 | about 2.8 | Not crossed, but close |
Planetary Health Check 2025 | revised upwards (about 3.58) | 2.86 | 2.84 | Crossed for the first time |
Planetary Health Check 2026 | as in 2025 | 2.86 | 2.85 | Crossed, just below the boundary |
The ocean itself changed only slightly between the 2023 and 2025 assessments. The main reason for the different verdict is that better reconstructions raised the estimate of the pre-industrial saturation state, which moved the boundary up past the measured value. The land-system boundary shows the same effect: the 2025 check used a global boundary of 75% forest cover and a measured value of about 59%, while the 2026 check uses 78% and 64%. This is why the planetary boundaries are described as a work in progress, and why a statement such as “seven of nine boundaries are crossed” should always be given with its date and source.
Data quality varies. CO₂ has a precise, continuous record since 1958; novel entities have no agreed quantity at all, and biodiversity loss is estimated indirectly.
Boundaries are set with judgement. Values such as 350 ppm or 78% forest cover are cautious estimates on the safe side of uncertain thresholds, not measured tipping points.
Global averages hide regional exceedances. Ozone is within the boundary globally but not over Antarctica in spring; aerosols are within the boundary globally but beyond safe levels over South Asia, where the trend is still worsening.
Trends matter as much as status. Aerosol loading has declined globally since around 2010 and ozone has recovered since the mid-1990s, although its recovery may recently have levelled off, while all seven crossed boundaries show increasing pressure.
Questions on sustainability appear in both papers, often combined with content from other topics. Paper 1 questions use an unseen case study, so expect to apply ideas such as footprints, environmental justice or the three pillars to an unfamiliar place and its data. Paper 2 Section A has short definition, calculation and explanation items; Section B essays often ask you to evaluate one of the frameworks or to discuss whether a development is sustainable or just.
An “explain” question needs reasons, not just a list of features: each point should say why GDP misleads.
The resource is a short table about a hypothetical coastal country, “Country X” (invented data for practice).
Indicator | 2005 | 2025 |
|---|---|---|
Population (millions) | 20 | 28 |
GDP (US$ billion) | 60 | 150 |
Value of mangrove and forest lost per year (US$ billion) | 2 | 12 |
Health costs of air pollution per year (US$ billion) | 1 | 6 |
Ecological footprint per person (gha) | 1.4 | 2.2 |
Biocapacity per person (gha) | 1.9 | 1.3 |
% of rural households with electricity | 30 | 45 |
% of urban households with electricity | 85 | 98 |
Sustainability is the extent to which practices allow for the long-term viability of a socio-ecological system; resilient systems are generally more sustainable.
Natural capital is the stock of natural resources that yields natural income; living sustainably means living off the income without running down the capital.
Sustainability has environmental, social and economic pillars; weak sustainability (Venn model) allows natural capital to be substituted, strong sustainability (nested model) does not.
Sustainable development, as defined in the Brundtland Report of 1987, meets present needs without compromising future generations’ ability to meet theirs.
Overexploitation can cause ecosystem collapse, as in the northern cod fishery off Newfoundland (moratorium 1992).
GDP counts resource depletion and pollution clean-up as income; green GDP subtracts environmental costs but is still a monetary measure.
Environmental justice is the right of all people to a pollution-free environment and equitable access to resources; Cancer Alley and Bhopal show local and global injustice, and sustainability and justice apply at every operating scale.
Indicators such as the Living Planet Index and ecological, carbon and water footprints measure sustainability; a footprint greater than biocapacity means overshoot (Earth Overshoot Day 2026: 30 July).
Citizen science gathers large amounts of monitoring data at low cost but needs careful design to control quality and bias.
The SDGs, planetary boundaries (seven of nine crossed in the 2025 and 2026 assessments), doughnut economics and the circular economy are frameworks with distinct uses and limitations.
Quantitative data show when a boundary was crossed (CO₂ passed 350 ppm in 1988) and how far beyond it humanity is (nitrogen about 2.7 times the boundary), but judgements change as reference values are revised. (HL)
I can define sustainability and sustainable development and explain how resilience relates to sustainability.
I can explain natural capital and natural income as an idea, and draw a stock-and-flow diagram of a harvested resource.
I can distinguish the three pillars of sustainability and draw and compare the strong and weak sustainability models.
I can explain how overexploitation led to the collapse of the northern cod fishery.
I can evaluate GDP and green GDP and calculate green GDP from data.
I can define environmental justice and explain one local and one global example of injustice.
I can describe sustainability and justice at operating scales from the individual to the global.
I can define and compare ecological, carbon and water footprints and biocapacity, and calculate overshoot.
I can outline the strengths and limitations of citizen science.
I can evaluate the SDGs, planetary boundaries, doughnut economics and the circular economy, including the butterfly diagram.
I can use quantitative data to determine when and whether a planetary boundary has been crossed. (HL)