2.4 Climate and biomes
Explain how temperature, precipitation and atmospheric and ocean circulation shape the world's biomes, compare their productivity and limiting factors, and evaluate evidence that warming is shifting them poleward and upslope.
- IB Environmental Systems and Societies
- Part of 2 Ecology
- SL and HL
Key terms introduced here
Each is in the ESS glossary, with every other term in the subject.
- Altitude
The height of a place above sea level; temperature usually falls as altitude increases, producing zones of vegetation on mountains.
- Atmospheric circulation
The large-scale movement of air around the Earth that transfers heat from the equator towards the poles, driven by unequal heating of the Earth's surface.
- Biome
A group of comparable ecosystems that have developed in similar climatic conditions in different parts of the world and so share similar vegetation structure and adaptations.
- Biome shift
A change in where a biome occurs as the climate changes, generally a movement towards the poles and to higher altitudes as the climate warms.
- Boreal forest
A biome of high mid-latitudes dominated by coniferous trees, with long cold winters, short mild summers and low productivity limited by temperature and the short growing season.
- Climate
The average atmospheric conditions of a place, such as temperature, precipitation, humidity and wind, calculated over a long period, usually about 30 years.
- Climate graph
A graph showing the average monthly temperature of a place as a line and its average monthly precipitation as bars, usually based on about 30 years of data.
- Continental climate
A temperate climate type far from the sea, with a large annual temperature range, cold winters, warm or hot summers and lower precipitation, often peaking in summer.
- Coral reef
A shallow, warm-water marine ecosystem built from the calcium carbonate skeletons of corals, with very high productivity and species diversity despite nutrient-poor surrounding water.
- Coriolis effect
The apparent deflection of moving air and water caused by the Earth's rotation: to the right in the Northern Hemisphere and to the left in the Southern Hemisphere.
- El Niño
The warm phase of ENSO, in which the Walker circulation weakens or reverses, warm water spreads east across the tropical Pacific and upwelling off western South America decreases.
- El Niño–Southern Oscillation
The irregular fluctuation in winds and sea-surface temperatures across the tropical Pacific Ocean between El Niño, neutral and La Niña states, which affects weather in many parts of the world.
- Ferrel cell
The cell of atmospheric circulation between about 30° and 60° latitude, in which air sinks in the subtropics, moves poleward at the surface and rises near 60°.
- Hadley cell
The cell of atmospheric circulation between the equator and about 30° latitude, in which warm air rises at the equator, moves poleward at height and sinks in the subtropics.
- Hot desert
A biome with very low and unreliable precipitation, usually under about 250 mm a year, and high daytime temperatures, in which water is the main limiting factor.
- Insolation
The amount of incoming solar radiation reaching a given area of the Earth's surface, which varies with latitude, season, time of day and cloud cover.
- Intertropical convergence zone
The belt of low pressure near the equator where the trade winds of the two hemispheres meet and warm, moist air rises, bringing heavy convectional rain; it moves north and south with the seasons.
- La Niña
The cool phase of ENSO, in which the Walker circulation and the trade winds strengthen, cold upwelling off western South America increases and the western Pacific becomes wetter.
- Latitude
The angular distance of a place north or south of the equator, measured in degrees from the centre of the Earth, from 0° at the equator to 90° at the poles.
- Maritime climate
A temperate climate type near oceans, with a small annual temperature range, mild winters, cool summers and precipitation spread throughout the year.
- Monsoon
A seasonal reversal of winds that brings a distinct wet season, as when the ITCZ moves away from the equator in summer and draws moist air over land.
- Ocean current
A continuous, directed movement of seawater, driven by wind, the Earth's rotation and differences in water density, that transfers heat around the globe.
- Oceanic Niño Index
A measure of ENSO used by NOAA: the three-month running mean of the sea-surface temperature anomaly in the central equatorial Pacific (the Niño 3.4 region).
- Permafrost
Ground that remains at or below 0 °C for at least two consecutive years, found beneath tundra and boreal forest, which stores large amounts of organic carbon.
- Polar cell
The cell of atmospheric circulation between about 60° latitude and the pole, in which cold, dense air sinks at the pole and flows towards lower latitudes at the surface.
- Rain shadow
A dry area on the sheltered side of a mountain range, where air that has lost its moisture rising over the mountains descends and warms.
- Savanna
A tropical grassland biome with scattered trees, high temperatures all year and a long dry season, often maintained by fire and grazing as well as climate.
- Sea-surface temperature
The temperature of the water at or near the surface of the ocean, which controls evaporation, storm formation and the exchange of heat between the ocean and the atmosphere.
- Storm surge
A rise in sea level above the normal tide caused by the strong winds and low pressure of a storm, which can flood low-lying coasts.
- Temperate forest
A forest biome of the mid-latitudes with warm summers, cool or cold winters and rain spread through the year, often dominated by broadleaved trees that lose their leaves in winter.
- Temperate grassland
A grassland biome of continental interiors in the mid-latitudes with hot summers, cold winters and too little rain to support forest, such as the prairies and steppes.
- Trade winds
The steady surface winds that blow from the subtropical high-pressure belts towards the equator, from the north-east in the Northern Hemisphere and the south-east in the Southern Hemisphere.
- Treeline
The edge beyond which trees cannot grow, set by low temperatures and a short growing season, found at high latitudes and at high altitudes on mountains.
- Tricellular model
A model of atmospheric circulation in which each hemisphere has three cells of moving air, the Hadley, Ferrel and polar cells, explaining global belts of pressure, wind and rainfall.
- Tropical cyclone
A rapidly rotating storm system with a low-pressure centre that forms over warm tropical oceans; it is called a hurricane, typhoon or cyclone once sustained winds exceed 119 km/h.
- Tropical rainforest
A forest biome near the equator with high temperatures and heavy rainfall all year, very high net primary productivity and the highest terrestrial species diversity.
- Tundra
A treeless biome of high latitudes or high altitudes with long, very cold winters, a short growing season, low precipitation and often permafrost below the surface.
- Walker circulation
The east–west loop of atmospheric circulation over the tropical Pacific, with air rising over the warm western Pacific and sinking over the cooler eastern Pacific.
- Weather
The state of the atmosphere at a particular place and time, or over a short period, described by temperature, humidity, air pressure, wind speed and precipitation.
- Whittaker biome diagram
A graph that plots mean annual precipitation against mean annual temperature and shows which terrestrial biome is likely to develop under each combination of the two.
Notes on 2.4 Climate and biomes
Learning objectives
Distinguish between weather and climate.
Outline what a biome is and explain how precipitation, temperature and insolation control where terrestrial biomes occur.
Construct and interpret climate graphs for different biomes, and interpret a Whittaker biome diagram.
Compare the limiting factors, productivity and biodiversity of tropical rainforest, hot desert, tundra and at least two other biomes.
Explain the tricellular model of atmospheric circulation and use it to explain the global distribution of heat, precipitation and biomes.
Outline how the oceans absorb solar radiation and how ocean currents redistribute heat.
Explain, with evidence, how global warming is shifting biomes towards the poles and to higher altitudes.
Evaluate the tricellular model and the biome concept as models of a complex system.
Explain the three general climate types and the biomes found in each, and why the predicted biome may not develop in an area. (HL)
Explain how El Niño and La Niña develop and outline their effects on weather and marine productivity. (HL)
Describe tropical cyclones and evaluate the evidence that global warming is making them more intense. (HL)
Introduction
The climate of a place decides which plants can grow there, and the plants in turn decide which animals can live there. This is why a tropical rainforest in the Amazon basin and one in the Congo basin look alike, even though they share very few species: both have developed under constant heat and heavy rain. Large regions of similar climate and similar communities are called biomes, and they are the largest units into which ecologists divide the biosphere.
Climate and biomes connect the three foundation ideas of the course. The atmosphere and oceans form a system that moves heat from the equator towards the poles, and this flow of energy sets the pattern of biomes. Different perspectives decide how societies use each biome, from clearing rainforest for farmland to protecting it for its biodiversity. As the climate warms, biomes are shifting, which raises questions about the sustainability of the ecosystems and the societies that depend on them.
Weather and climate
The words weather and climate are often used as if they meant the same thing, but they describe the atmosphere over very different lengths of time. Weather is what the atmosphere is doing now or over a few days. Climate is the pattern that the weather follows over many years.
A rainy afternoon in Manaus, a cold snap in Moscow or a heatwave in Riyadh are all examples of weather. Weather changes from day to day because air masses, fronts and storms move across the Earth's surface. It can be forecast only a few days ahead, because small differences in the starting conditions grow quickly in the atmosphere.
Meteorological services calculate climate "normals" as averages over a fixed 30-year period, currently 1991–2020. Thirty years is long enough to smooth out unusual years, such as a single very wet summer, but short enough to show how the climate is changing. A climate also includes the range and variability of the weather, for example how often droughts or frosts occur, not only the averages.
Feature | Weather | Climate |
|---|---|---|
Time scale | Hours to days | About 30 years or more |
What it describes | Actual conditions at a given time | Average conditions and their usual range |
Example statement | “It is 31 °C and raining in Manaus today.” | “Manaus has a mean annual temperature of about 27 °C and about 2,360 mm of rain a year.” |
How it is studied | Forecasts from current observations and models | Long records of observations, climate graphs, climate models |
Biomes: ecosystems shaped by climate
An ecosystem is a community of organisms interacting with each other and with their abiotic environment, and it can be as small as a pond. Ecosystems that develop in similar climates, even on different continents, tend to have similar vegetation structure and similar adaptations. Ecologists group these comparable ecosystems into biomes.
Biomes are defined by the type of vegetation and its structure, not by particular species. The hot deserts of the Sahara, the Sonoran Desert in North America and the deserts of central Australia have different species of plants, yet all have widely spaced, drought-tolerant plants with small or no leaves, deep or wide roots and ways of storing water. These parallel features evolved separately in each region because the same abiotic factors favoured the same solutions.
The main influences: precipitation, temperature and insolation
Three abiotic factors have the greatest influence on which biome develops on land. Precipitation controls how much water is available to plants. Temperature controls the rate of photosynthesis and other metabolic processes and the length of the growing season. Insolation controls the energy available for photosynthesis and for heating the ground and air.
Insolation is greatest near the equator and least near the poles, for three reasons. Near the equator the Sun is high in the sky for most of the year, so a beam of sunlight strikes the ground almost at right angles and its energy falls on a small area. At high latitudes the Sun is lower, so the same beam is spread over a larger area. The low-angle beam also passes through a longer path of atmosphere, so more of its energy is reflected or absorbed by clouds, dust and gases before it reaches the ground.
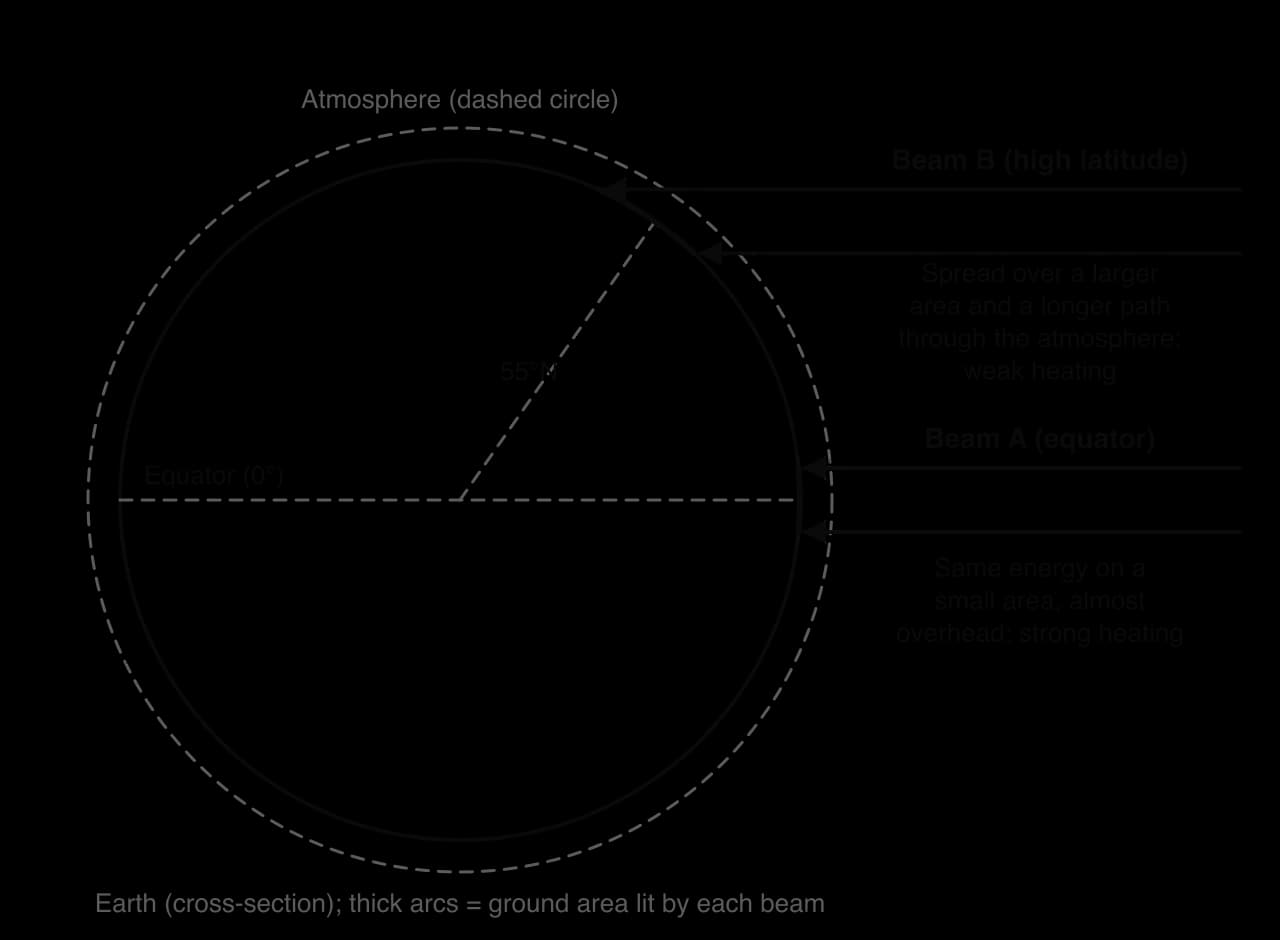
Day length adds a seasonal pattern. Near the equator, day and night stay close to 12 hours all year, so insolation hardly changes between seasons. Towards the poles the contrast grows until there is continuous daylight in summer and continuous darkness in winter. This is why high-latitude biomes have a short, intense growing season and a long period when photosynthesis stops completely.
Climate graphs
A climate graph summarises the climate of one place on a single chart. Average monthly precipitation is drawn as bars against the left-hand axis, and average monthly temperature is drawn as a line against the right-hand axis. Both are averages over about 30 years, so a climate graph describes climate, not the weather in any one year.
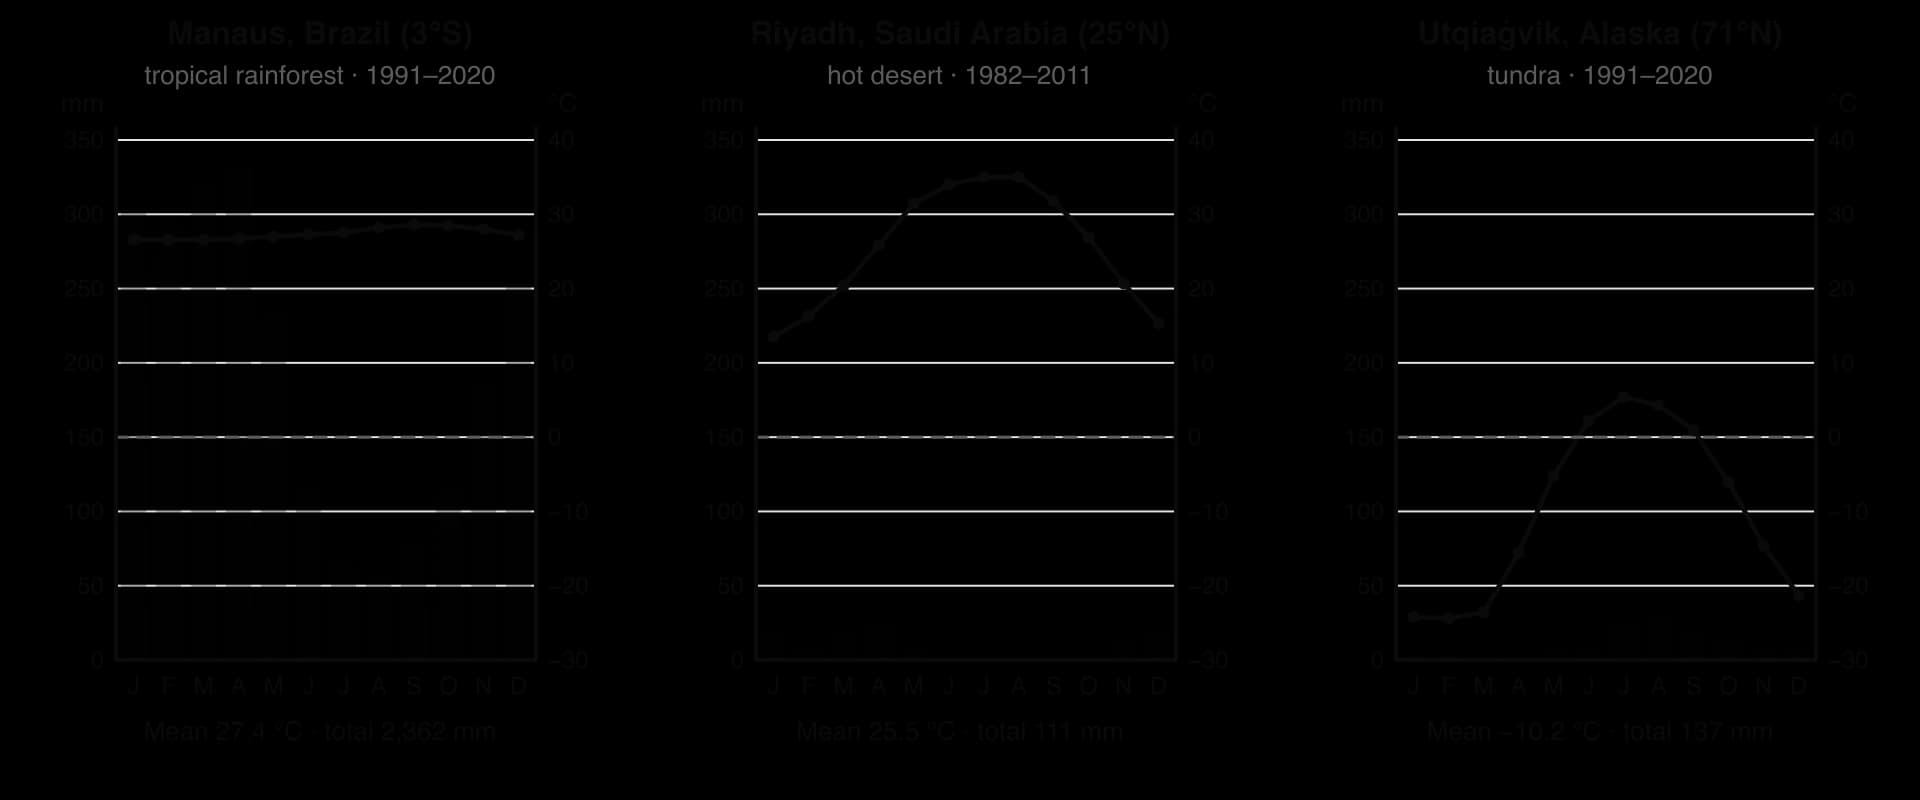
Reading the three graphs together shows how differently the main limiting factors act. In Manaus, temperature hardly changes through the year (26.6–28.6 °C), and even the driest month has more than 50 mm of rain, so plants can grow all year. In Riyadh, temperatures are high but the annual total is only about 111 mm, so water limits growth. In Utqiaġvik, Alaska, mean monthly temperatures are above 0 °C only from June to September, and the annual precipitation (about 137 mm) is barely more than Riyadh's. Low temperature and the short growing season, more than lack of water, limit growth there.
Abiotic factors and the distribution of biomes
For any given combination of temperature and rainfall, one natural ecosystem type is likely to develop. Ecologist Robert Whittaker showed this by plotting the world's biomes on a graph with mean annual precipitation on one axis and mean annual temperature on the other. The result, the Whittaker biome diagram, is one of the simplest models in ecology.
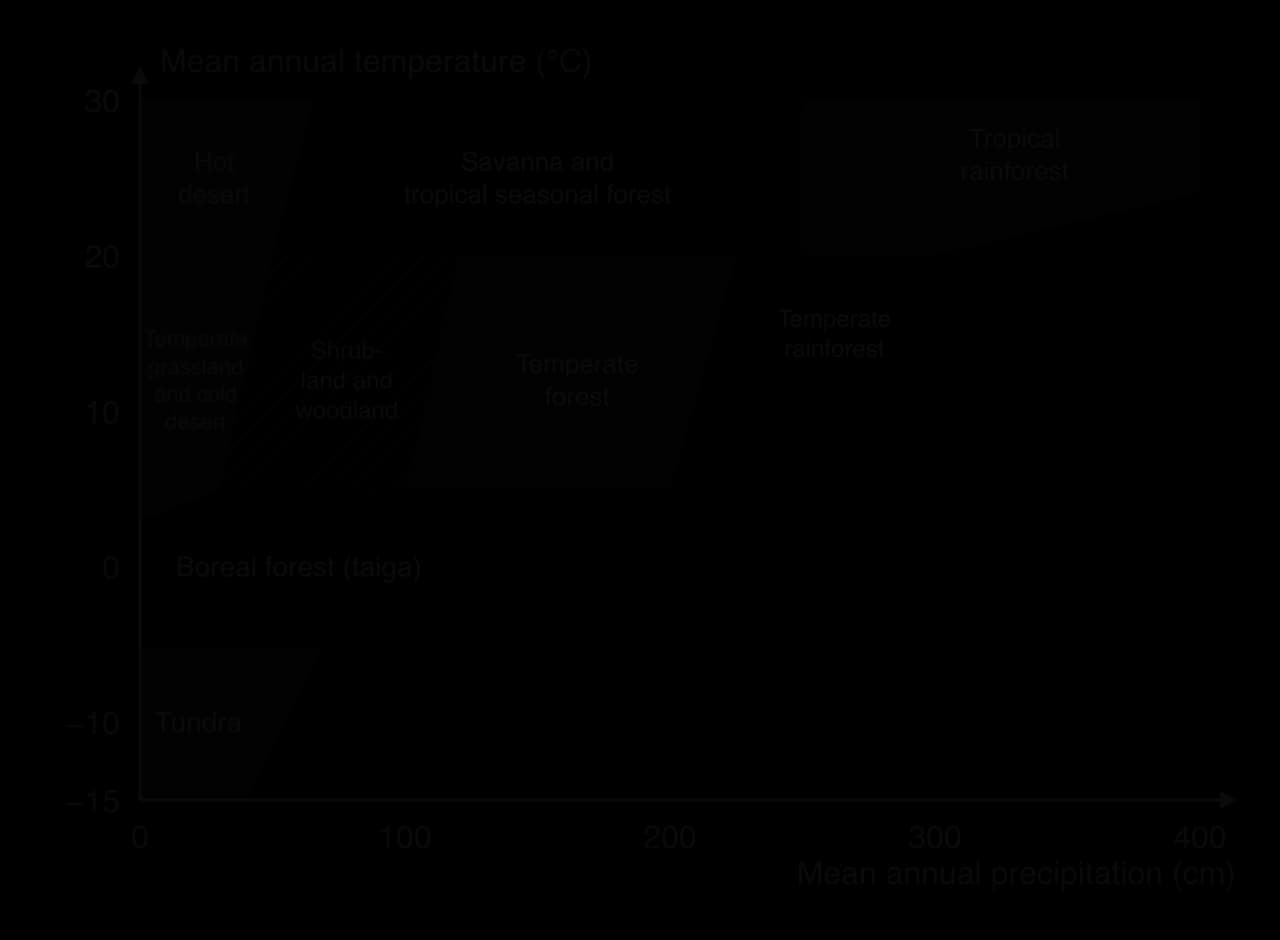
The diagram can be read in two directions. Moving up the temperature axis at a fixed rainfall, the growing season lengthens and productivity rises, so tundra gives way to boreal forest and then temperate forest. Moving along the precipitation axis at a fixed high temperature, water becomes less limiting, so hot desert gives way to savanna and then to tropical rainforest.
Temperature and precipitation interact because higher temperatures increase evapotranspiration. The same 500 mm of rain supports forest in a cool climate, where little water evaporates, but only dry grassland or scrub in a hot climate, where much of it is lost back to the atmosphere. This is why the boundary between forest and grassland or desert slopes on the diagram: warmer places need more rain to support trees.
Other abiotic factors modify the picture locally. Soils that are very sandy or waterlogged, steep slopes, exposure to wind, and the seasonal timing of rain all affect which community develops. A rain shadow forms on the sheltered side of a mountain range: air rising over the mountains cools and loses its moisture as rain on the windward side, then descends and warms on the leeward side, where it is dry. The dry plains of Patagonia in Argentina, for example, lie in the rain shadow of the Andes.
Sources: Whittaker, R. H. (1975) Communities and Ecosystems; WMO World Weather Information Service; NOAA NCEI 1991–2020 normals; INMET 1991–2020 normals.
The major groups of biomes
Biomes can be grouped into a small number of broad types. On land these are forest, grassland, desert and tundra; in water they are freshwater and marine. Each group can be divided further, for example forest into tropical rainforest, temperate forest and boreal forest, and each has its own characteristic limiting factors, productivity and diversity.
Group | Examples of biomes | Main limiting factors |
|---|---|---|
Forest | Tropical rainforest, temperate forest, boreal forest | Light under the canopy; nutrients in rainforest soils; temperature and growing season at high latitudes |
Grassland | Savanna, temperate grassland | Water (seasonal drought); fire and grazing stop trees from dominating |
Desert | Hot desert, cold desert | Water |
Tundra | Arctic tundra, alpine tundra | Temperature, short growing season, permafrost |
Freshwater | Lakes, rivers, wetlands | Light with depth; nutrients (especially phosphate); dissolved oxygen |
Marine | Open ocean, coral reefs, estuaries, kelp forests | Light with depth; nutrients (especially nitrate); temperature |
The productivity of a biome is measured as net primary productivity (NPP): the rate at which producers add new biomass per unit area per year, after their own respiration. NPP is high where all the factors photosynthesis needs (light, warmth, water and nutrients) are available for most of the year, and low where any one of them is in short supply. The factor in shortest supply sets the limit, which is why identifying the limiting factor is the key to explaining a biome.
Ecosystem or biome | Typical NPP (g dry mass m⁻² yr⁻¹) |
|---|---|
Swamps and marshes | 2,500 |
Tropical rainforest | 2,000 |
Coral reefs | 2,000 |
Estuaries | 1,800 |
Temperate forest | 1,250 |
Cultivated land | 650 |
Tundra | 140 |
Open ocean | 125 |
Extreme desert | 3 |
Sources: Ricklefs, R. E. and Miller, G. L. (2000) Ecology, 4th edition, p. 192, via Wikipedia, "Biomass (ecology)"; figures are typical means and vary widely within each biome.
The open ocean has one of the lowest NPP values per square metre, yet it covers so much of the planet that its total production is very large. Productivity per unit area and total productivity answer different questions, so it matters which one a comparison uses.
Tropical rainforest
Tropical rainforests lie roughly between 10°N and 10°S, in the Amazon and Congo basins and in South-East Asia. Mean monthly temperatures stay between about 25 and 28 °C, and annual rainfall is usually between about 1,750 and 3,000 mm, with no long dry season. Manaus, in the central Amazon, has a mean of 27.4 °C and about 2,360 mm of rain a year.
With warmth, water and strong insolation all year, photosynthesis never has to stop, so NPP is among the highest of any land biome. The forest is layered: emergent trees rise above a continuous canopy, with an understorey and a dark forest floor below. Light is the main limiting factor for plants below the canopy, which is why many understorey plants have large, dark-green leaves and why climbing plants and epiphytes grow towards the light.
Despite the lush forest, the soils are poor. Heavy rain leaches nutrients down through the soil, and high temperatures mean that dead organic matter decomposes within weeks. Most nutrients are therefore held in the living biomass and cycled quickly from leaf litter back into roots, often with the help of mycorrhizae. Nutrients are a second major limiting factor, and when the forest is cleared the nutrient store goes with it, so cleared land often loses its fertility within a few years.
Biodiversity is the highest of any terrestrial biome. Stable conditions over long periods, high productivity and the many layers and niches of the forest structure allow a great number of species to coexist.
Hot desert
Hot deserts are concentrated in the subtropics, roughly 15–35° north and south of the equator: the Sahara, the Arabian Desert, the Kalahari and the deserts of central Australia. Riyadh, in the Arabian Desert, receives about 111 mm of rain a year and none at all from June to September, while mean monthly temperatures rise to 35 °C in July and August. Clear skies let the ground heat strongly by day and lose heat quickly at night, so the daily temperature range is large.
Water is the overwhelming limiting factor. Plant cover is sparse and NPP is very low, falling to almost zero in extreme deserts. Plants such as cacti and other succulents store water, reduce leaf area to cut transpiration and open their stomata at night. Many annual plants survive as seeds and complete their life cycle in a few weeks after rain. Animals are often nocturnal and many obtain most of their water from food.
Biodiversity is low overall, but many desert species are found nowhere else because of their specialised adaptations. The thin, slow-forming soils and sparse vegetation make deserts very slow to recover from damage such as off-road driving or overgrazing.
Tundra
Arctic tundra surrounds the Arctic Ocean in northern Canada, Alaska, Greenland, Scandinavia and Siberia, beyond the northern limit of trees. Utqiaġvik, on the north coast of Alaska, has a mean annual temperature of about −10 °C and mean monthly temperatures above 0 °C only from June to September. Arctic tundra receives only about 150–250 mm of precipitation a year, so it is a cold desert in terms of rainfall.
Temperature and the short growing season are the main limiting factors. Only the top layer of soil thaws in summer, and the frozen ground beneath, the permafrost, stops water draining away, so the surface is boggy and dotted with lakes even though precipitation is low. Plants are low-growing mosses, lichens, sedges, grasses and dwarf shrubs that stay close to the ground, out of the wind and under the insulating snow. Low temperatures also slow decomposition, so dead organic matter builds up in the soil as peat, and nutrients, especially nitrogen, are in short supply.
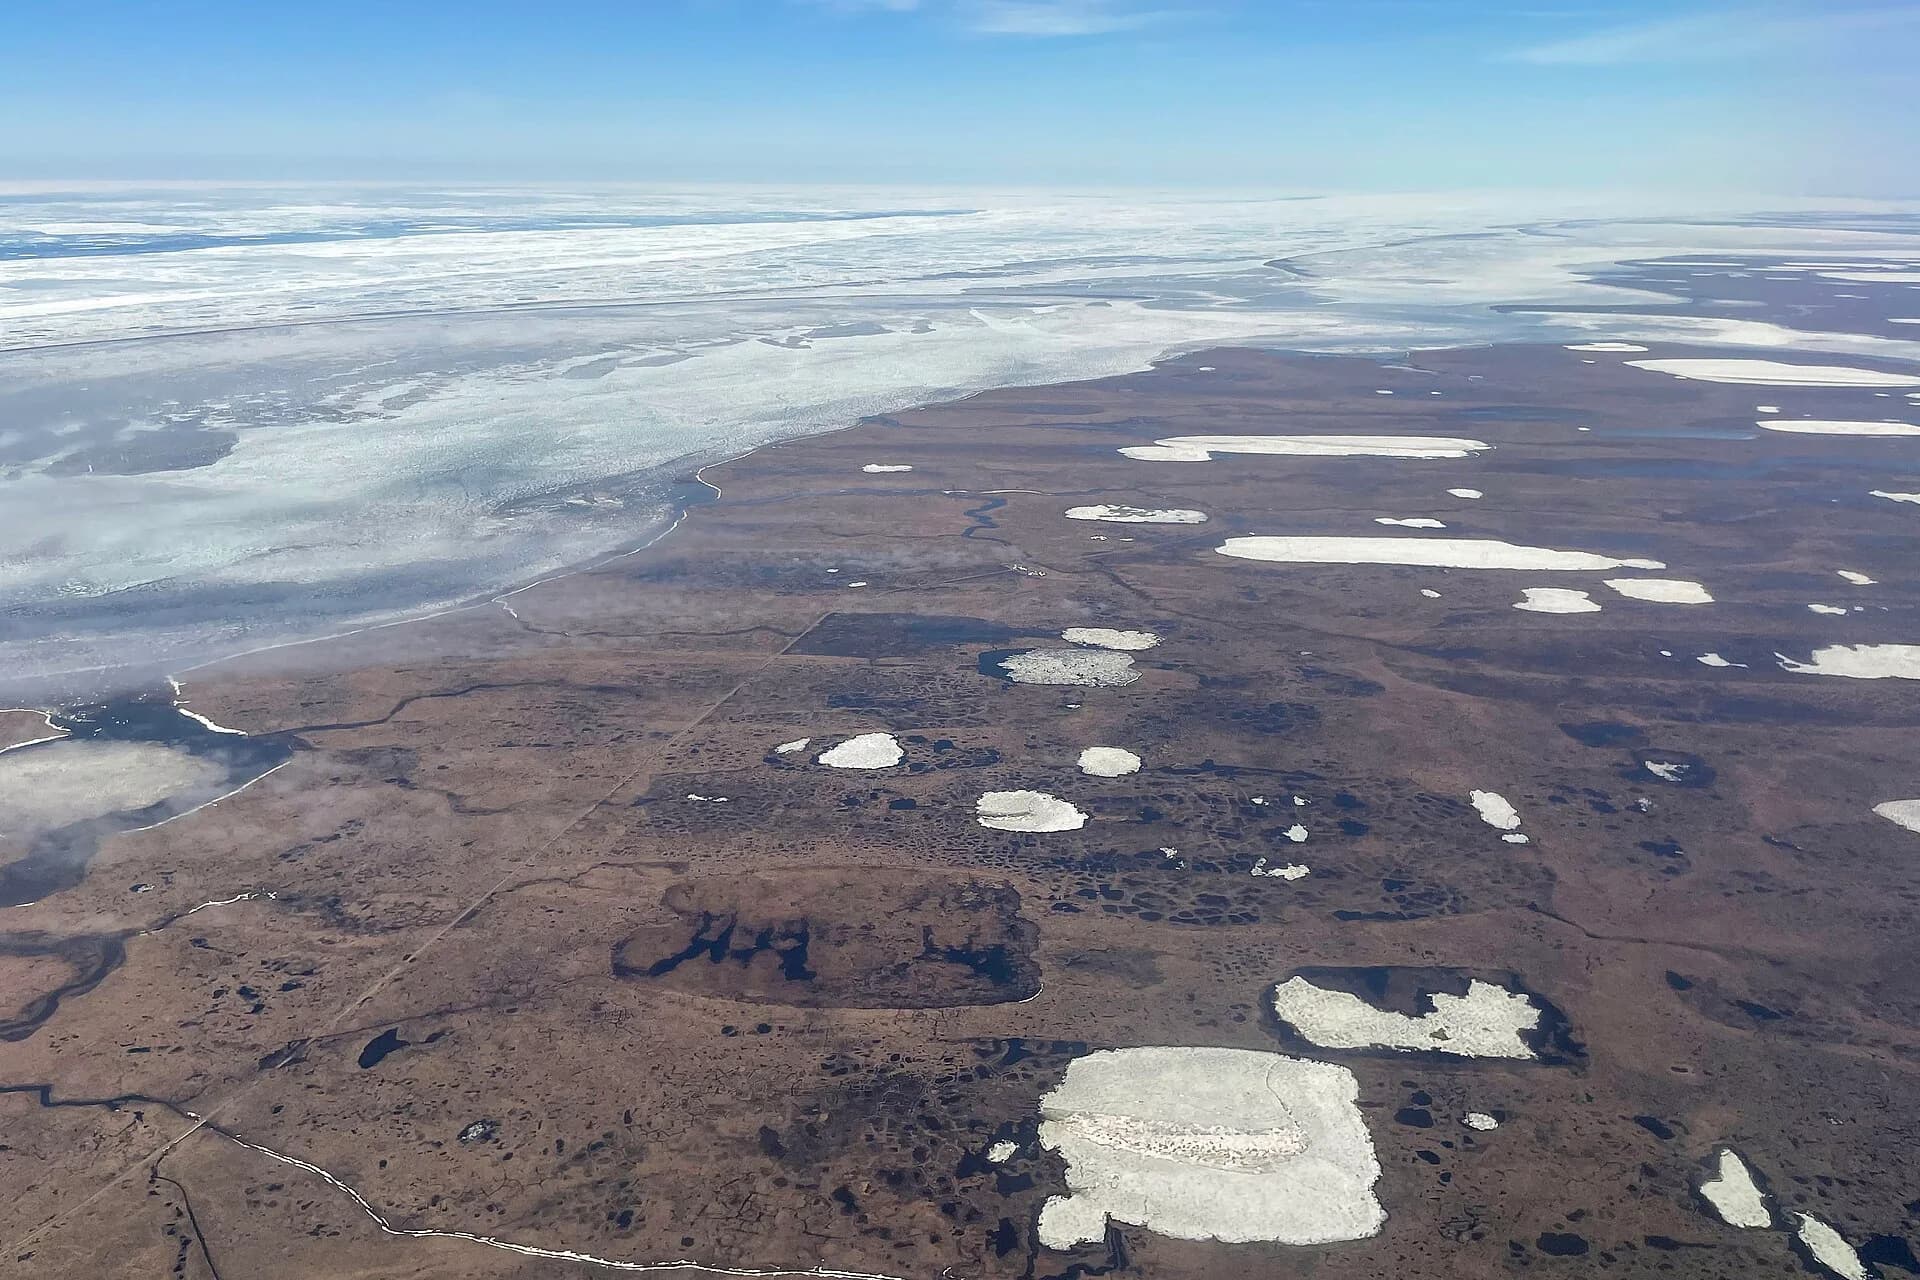
NPP is very low (about 140 g m⁻² yr⁻¹) and so is species diversity. Food webs are short and many animals, such as caribou and many birds, migrate in and out with the seasons. Because so much carbon is locked in frozen peat and permafrost, the tundra matters to the global carbon cycle far more than its low productivity suggests.
Temperate forest
Temperate deciduous forests grow mainly in the Northern Hemisphere: in western and central Europe, eastern North America and eastern Asia. Precipitation is moderate (about 750–1,500 mm a year) and falls in all seasons. The main limiting factors are temperature and light in winter: broadleaved trees such as oak, beech and maple drop their leaves to avoid frost damage and water loss when the ground is frozen, and grow again in spring.
NPP is high (about 1,250 g m⁻² yr⁻¹), though lower than in tropical rainforest because growth stops in winter. Leaf fall each autumn supplies a large amount of litter, and moderate temperatures allow it to decompose over a year or so, producing deep, fertile brown-earth soils. Diversity is moderate. Because these soils are good for farming, much of the original temperate forest in Europe and eastern North America has been cleared for agriculture.
Boreal forest
The boreal forest forms a broad belt across Canada, Alaska, Scandinavia and Russia, roughly between 50° and 70°N, between the temperate forests to the south and the tundra to the north. It is the largest land biome by area. Winters are long and very cold, summers short and mild, and precipitation moderate to low.
Temperature and the short growing season limit productivity, which is lower than in temperate forest. Conifers such as spruce, pine, fir and larch are well adapted: their needle-shaped, waxy leaves lose little water when the ground is frozen, their conical shape sheds snow, and keeping leaves all year (except in larch) lets them photosynthesise as soon as temperatures allow. Cold, acidic conditions slow decomposition, so thick layers of needle litter and peat build up. Species diversity is low, with large areas dominated by a few tree species.
Grasslands: savanna and temperate grassland
Grasslands develop where there is too little water, for too much of the year, to support continuous forest, but enough for a full cover of grasses. Two biomes are important.
Savanna covers large parts of Africa, South America, India and northern Australia between the rainforests and the hot deserts. It is hot all year, with a wet season and a long dry season. Grasses with scattered, drought-resistant trees such as acacias dominate. Water in the dry season is the main limiting factor, and fire and grazing by large herbivores stop trees from forming a closed canopy. Productivity is moderate to high in the wet season, and savannas support some of the largest herds of grazing mammals on Earth.
Temperate grassland (the prairies of North America, the steppes of Eurasia, the pampas of Argentina) lies in the interiors of continents in the mid-latitudes, far from the moderating influence of the sea. Summers are hot, winters cold, and precipitation is low to moderate. Water is the main limiting factor. Productivity is moderate, and the deep, organic-rich soils make these some of the world's most important farming regions; most of the original grassland has been ploughed.
 YouTube
Aquatic biomes
In water, the limiting factors are different from those on land. Water is never in short supply, but light falls quickly with depth, so photosynthesis is restricted to the sunlit surface layer, and nutrients are often scarce in surface waters far from land. This is why most of the open ocean has low productivity per square metre, while shallow coastal waters, estuaries and areas where cold, nutrient-rich water rises to the surface are far more productive.
Coral reefs are shallow, warm-water ecosystems built by corals that live in a mutualistic relationship with photosynthetic algae inside their tissues. They grow in clear, nutrient-poor tropical water, yet they are among the most productive and diverse ecosystems on Earth, because nutrients are recycled very efficiently within the reef community. Freshwater biomes such as lakes, rivers and wetlands cover a small area but have high diversity per unit area; their productivity is often limited by phosphate.
Sources: Wikipedia, "Tundra" (Arctic precipitation); WMO and NOAA climate normals; Ricklefs and Miller (2000).
The tricellular model of atmospheric circulation
The equator receives far more insolation than the poles, yet the tropics do not keep getting hotter and the poles do not keep getting colder. Heat is carried from low to high latitudes by the moving atmosphere and oceans. The large-scale movement of air that does this is called atmospheric circulation, and its simplest model is the tricellular model.
Latitude matters because it sets the angle of the Sun and therefore the insolation a place receives. The tricellular model explains how the atmosphere responds to this difference in heating between low and high latitudes.
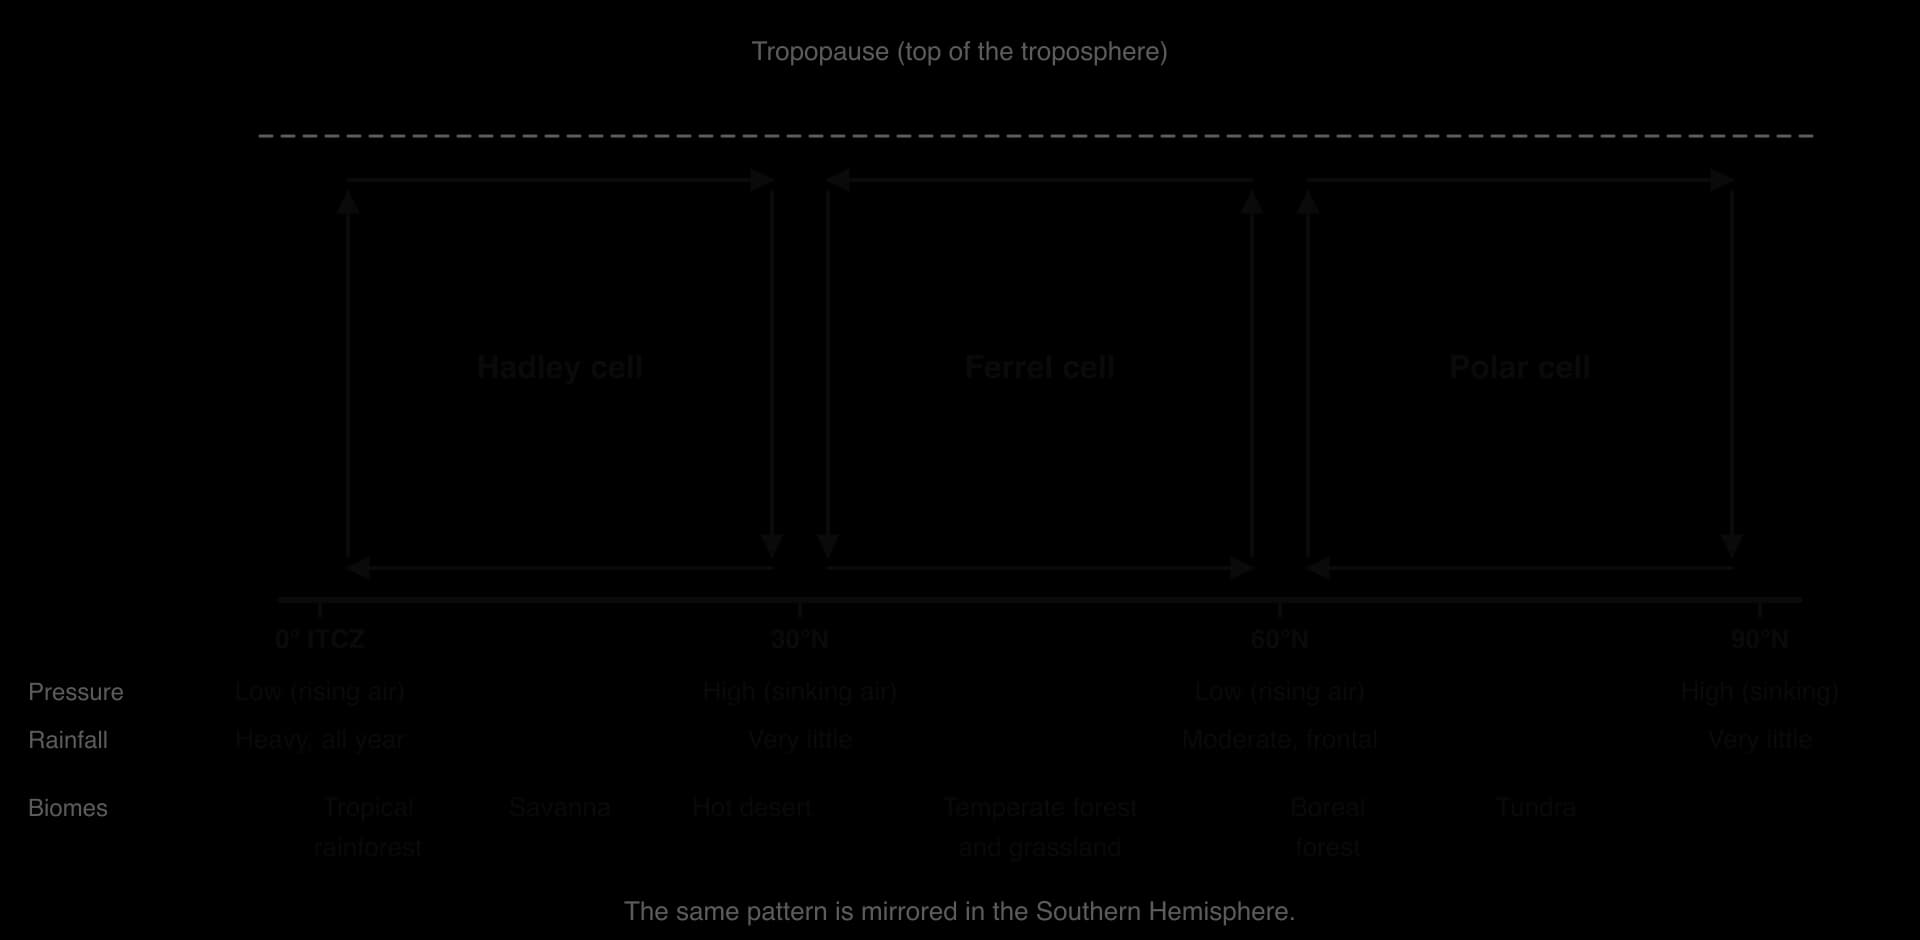
The model has the same three cells in each hemisphere. In each cell, air rises in one place, moves across the sky at height, sinks somewhere else and returns along the surface. Rising air cools, and because cool air holds less water vapour, the water condenses into clouds and falls as rain; rising air also lowers the pressure at the surface. Sinking air warms as it is compressed, so clouds evaporate and the air is dry; sinking air raises the surface pressure. This link between vertical air movement, pressure and rainfall is the key to the whole model.
The Hadley cell
At the equator, intense insolation heats the surface, and the warm, moist air above it rises by convection. As it rises it cools, and its water vapour condenses, releasing latent heat that keeps the air rising and producing towering clouds and heavy afternoon downpours. The belt where this happens, where the surface winds of the two hemispheres meet, is the intertropical convergence zone (ITCZ).
High in the troposphere, the rising air spreads towards the poles. It cools by radiating heat to space and is deflected eastward by the Earth's rotation, and around 30° north and south it sinks back towards the surface. The sinking air warms and dries, creating the subtropical high-pressure belts, where clear skies and very low rainfall produce most of the world's hot deserts. From these highs, surface air flows back towards the equator as the trade winds, completing the Hadley cell.
The trade winds do not blow straight from north to south. The Coriolis effect, caused by the Earth's rotation, deflects moving air to the right in the Northern Hemisphere and to the left in the Southern Hemisphere. The trade winds therefore blow from the north-east north of the equator and from the south-east south of it.
The Ferrel and polar cells
At the poles, the air is very cold and dense, so it sinks and forms high pressure. It flows away from the poles at the surface as cold polar easterly winds. Around 60° latitude this cold air meets warmer air moving poleward from the subtropics. The warmer, lighter air is forced to rise over the cold air along the polar front, forming low-pressure systems (depressions) that bring frequent cloud and frontal rain to the mid-latitudes. The loop of sinking air at the pole and rising air at about 60° is the polar cell.
Between 30° and 60° lies the Ferrel cell. Its air sinks at about 30°, together with the Hadley cell, and rises at about 60°, together with the polar cell, and the surface winds between them blow towards the pole as the westerlies. The Ferrel cell is driven by the two cells on either side of it, a little like a gear turned by two others, rather than by heating directly beneath it.
Using the tricellular model to explain where biomes occur
The cells create a repeating pattern of wet and dry belts from the equator to the poles. Combined with the fall in temperature with latitude, this pattern explains the broad distribution of biomes.
Latitude | Air movement and pressure | Climate | Biome |
|---|---|---|---|
0–10° | Rising air at the ITCZ; low pressure | Hot, wet all year | Tropical rainforest |
10–20° | ITCZ overhead in summer only | Hot; wet summer, long dry season | Savanna |
20–30° | Sinking air of the Hadley cell; high pressure | Hot, very dry, clear skies | Hot desert |
40–60° | Westerlies, depressions at the polar front | Mild to cool; rain all year | Temperate forest; temperate grassland in continental interiors |
50–70° | Polar front; cold air masses in winter | Long cold winters, short summers | Boreal forest |
65–90° | Sinking polar air; high pressure | Very cold, dry | Tundra, polar desert and ice |
The ITCZ follows the zone of most intense heating, which moves north of the equator in the northern summer and south of it in the southern summer. Places 10–20° from the equator are therefore under the rising air of the ITCZ for part of the year and under the sinking air of the subtropical high for the rest, which gives the strongly seasonal rainfall of the savanna.
In West Africa, the northward shift of the ITCZ each summer draws moist air from the Atlantic over the land, bringing the West African monsoon; the Sahel, on the desert edge, depends on how far north this rain belt reaches in a given year.
 YouTube
Evaluating the tricellular model
Like every model, the tricellular model is a simplification of reality, and its value depends on what it is used for. It explains the broad, zonal pattern of rainfall and biomes clearly, links them to a single cause (unequal heating), and can be used to predict the likely climate of an unfamiliar place from its latitude.
It treats the Earth as uniform. Real circulation is affected by the distribution of land and sea, mountain ranges and ocean currents. The cold deserts of central Asia, such as the Gobi (about 42°N), lie well north of the subtropical high-pressure belt; they are dry because they are far from the ocean and lie under the cold, dry Siberian high pressure in winter.
It shows an average. The cells shift with the seasons and vary from day to day; the Ferrel cell in particular is an average pattern of many moving weather systems rather than a steady loop of air.
It leaves out important features, such as jet streams, monsoons and east–west circulations like the Walker circulation over the Pacific.
The cells are changing. Observations and climate models indicate that the Hadley circulation has widened poleward since at least the 1980s as a result of climate change, which may push dry subtropical conditions into regions at the poleward edge of the desert belts.
Oceans and the redistribution of heat
The oceans cover about 71% of the Earth's surface and absorb most of the solar radiation that falls on them, because water has a low albedo. Water also has a high specific heat capacity: it can absorb a great deal of energy for a small rise in temperature, and it releases that energy slowly. The oceans therefore act as a huge store of heat, which smooths out differences in temperature between day and night, summer and winter.
Surface ocean currents are driven mainly by the prevailing winds, such as the trade winds and the westerlies, and deflected by the Coriolis effect into large circular gyres in each ocean basin. On the western side of each basin, warm currents carry water from the tropics towards the poles; on the eastern side, cold currents return water towards the equator. Together, ocean currents and the atmosphere stop the tropics from becoming ever hotter and the high latitudes from becoming ever colder.
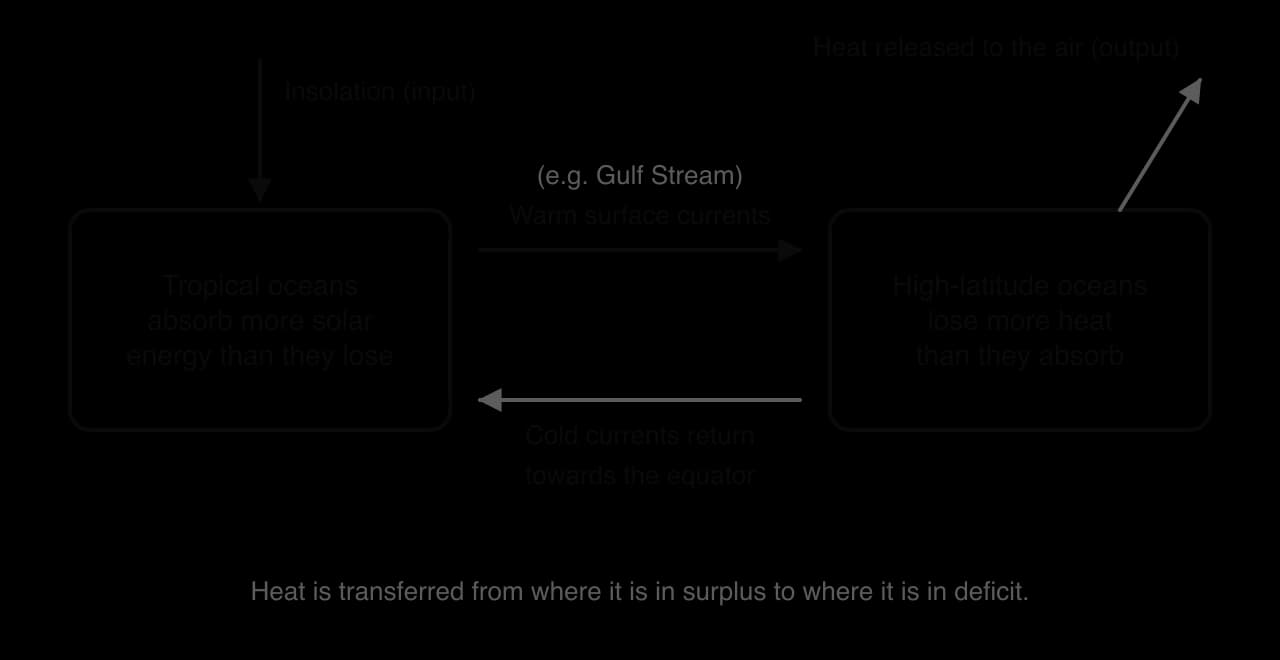
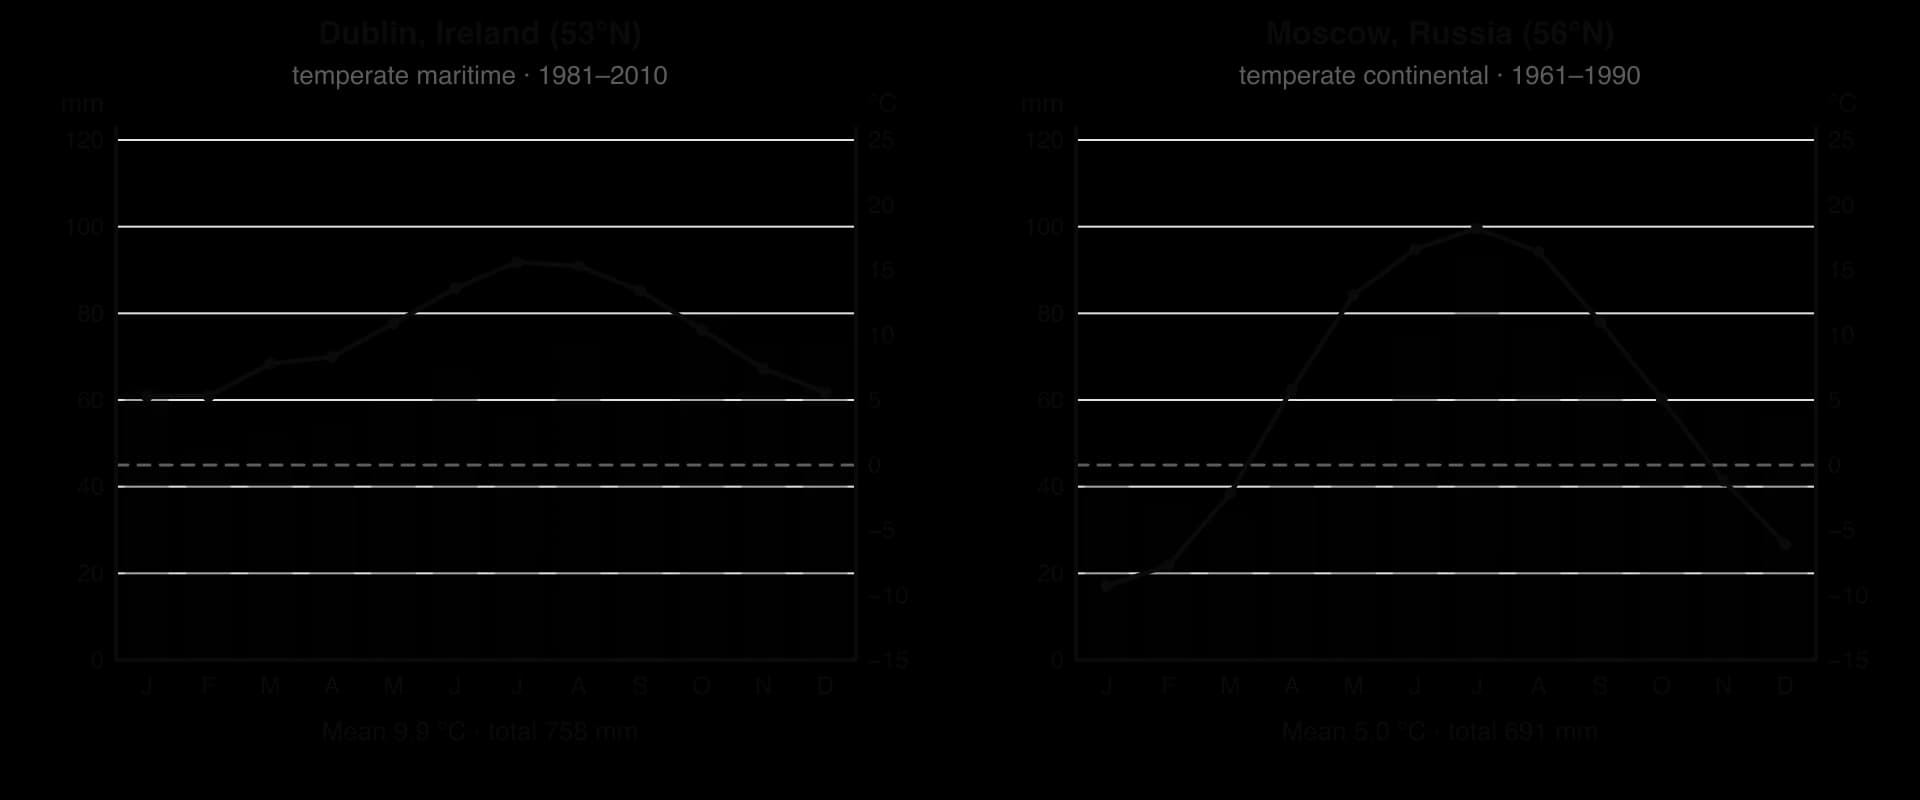
The Gulf Stream is a warm current that flows from the Gulf of Mexico along the east coast of the United States and continues across the Atlantic towards north-west Europe as the North Atlantic Current. The heat it carries is one reason why north-west Europe is milder than other places at the same latitude: Dublin, at 53°N, has a mean January temperature of about 5 °C, while places at similar latitudes in the interior of Canada and Russia are far colder.
Cold currents have the opposite effect. Where cold water flows along a coast, it cools the air above it, which makes the air stable and reduces rainfall. Cold currents along the west coasts of South America and southern Africa help to explain why some of the driest deserts in the world, such as the Atacama and the Namib, lie right beside the ocean.
Global warming and shifting biomes
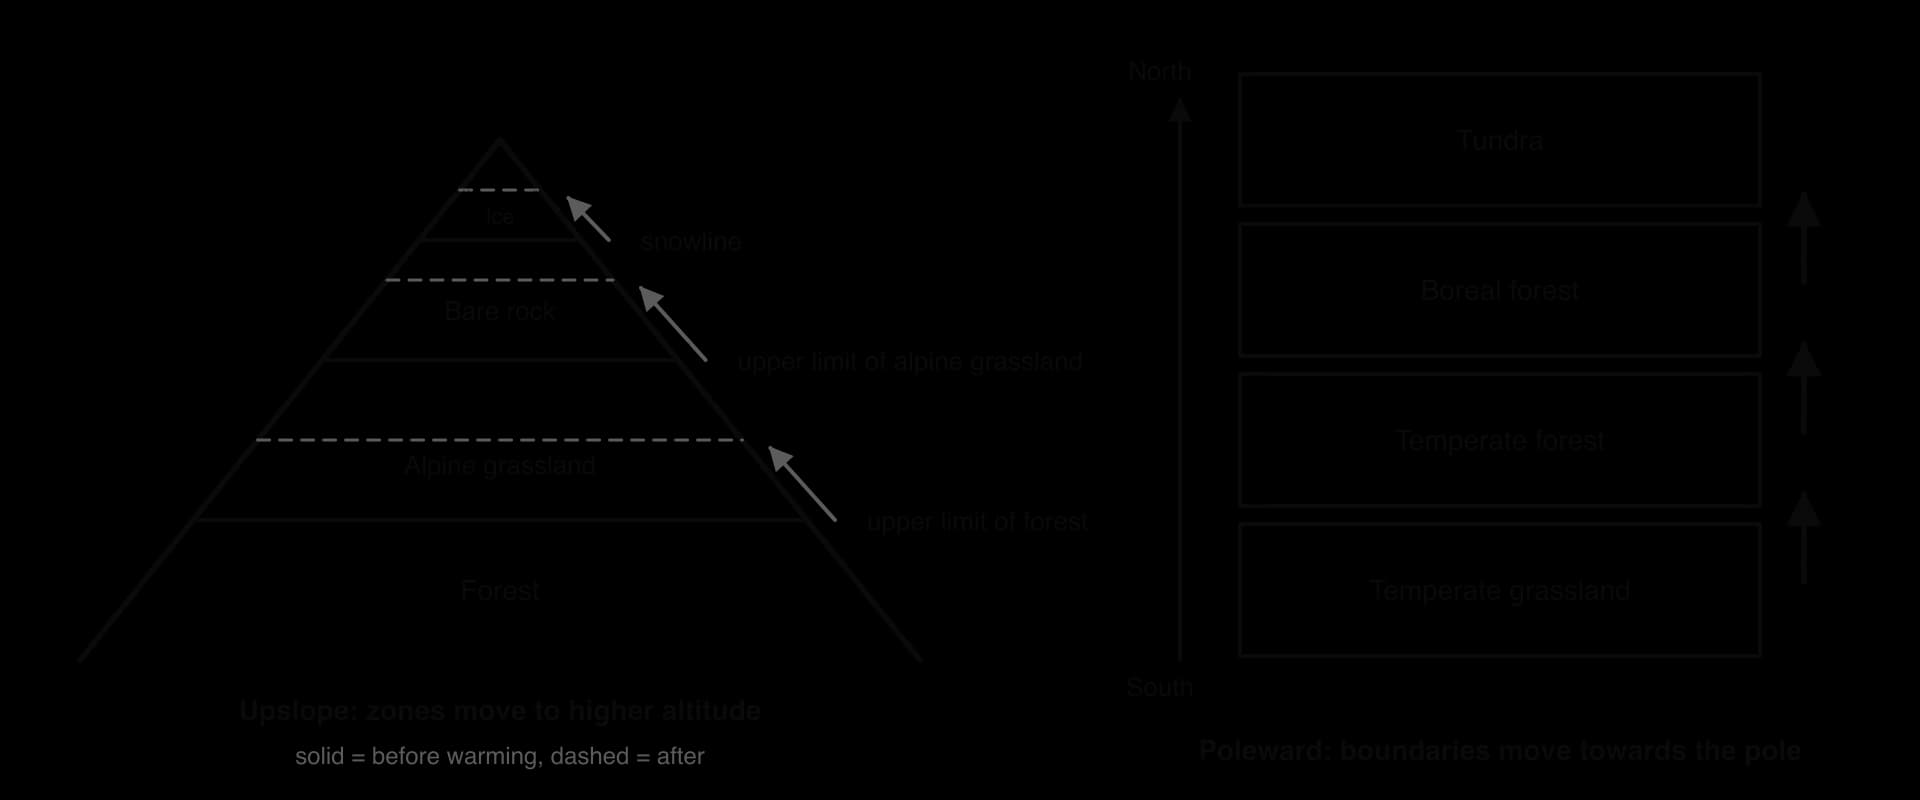
Biome boundaries are not fixed, and a change in where a biome occurs is called a biome shift. Because each biome develops under a particular range of temperature and precipitation, a change in climate changes where those conditions occur. Global average temperature has risen by about 1.3 °C since the late nineteenth century as a result of the enhanced greenhouse effect, and the warming is greater over land and greatest in the Arctic.
The reasoning is the same in both directions. Warming moves the band of temperatures suited to each biome towards the poles, where it was previously too cold. On mountains, temperature falls with altitude, so warming moves the band of suitable temperatures uphill. Species that can disperse and establish fast enough follow the moving conditions; those that cannot are left in conditions that no longer suit them.
Evidence of biomes on the move
Arctic greening. Satellite measurements of tundra "greenness" since the early 1980s show widespread greening across the low Arctic of North America and Eurasia. In 2024 the circumpolar average was the second highest in the 25-year record of the MODIS satellite sensor, and a record in North America. Much of the greening comes from shrubs spreading and growing taller in the tundra ("shrubification"), crowding out low-growing plants such as lichens. Some areas, such as parts of south-western Alaska and Siberia, have browned instead.
Advancing treelines. The treeline is the edge beyond which trees cannot grow. In the North Cascades National Park in the United States, the treeline has risen by more than 120 m in 50 years as earlier snowmelt and warmer summers allowed seedlings to establish above the old limit. In the hills near Fairbanks, Alaska, a series of warm summers in the 1940s allowed many spruce seedlings to establish above the previous treeline.
Tropical mountains. On Chimborazo in Ecuador, plants now grow hundreds of metres higher than when Alexander von Humboldt recorded them in 1802 (the case study).
The evidence needs careful interpretation. In the Pyrenees, a study of the rising treeline concluded that the main cause was the end of grazing and other traditional land uses, not climate change. Separating the effect of warming from changes in land use, fire and grazing is one of the main difficulties in attributing a biome shift to climate change.
Biome shifts also feed back on the climate system. Shrubs and trees that spread into tundra are darker than snow-covered tundra, so they absorb more sunlight and lower the albedo, which can amplify warming locally, a positive feedback. At the same time the extra plant growth takes up carbon dioxide, a negative feedback. Which effect dominates, and how much carbon is released as permafrost thaws, are active research questions.
Perspectives on biomes and their use
The same biome can be valued in very different ways, and those values decide how it is used and managed. A rainforest can be seen as a store of timber and farmland, a carbon sink, a home, or a community of species with a right to exist. How societies respond to biome shifts depends on the same differences in environmental value systems.
Perspective | How the biome is valued | Typical response to biome change |
|---|---|---|
Ecocentric | Intrinsic value of the species and communities, whether or not they are useful to people | Protect large, connected areas and corridors so species can move; reduce emissions at source |
Anthropocentric | Value for people: food, water, timber, carbon storage, tourism | Manage biomes sustainably for ecosystem services; plan for changes in farming and water supply |
Technocentric | Biomes are resources whose problems can be solved by technology and management | Assisted migration of species, seed banks, monitoring by satellite, geoengineering |
Indigenous and local knowledge | Biomes as homelands bound up with culture, food and identity, often observed over many generations | Use long-term local observation to detect change; adapt land use; claim rights over land and resources |
Indigenous peoples of the Arctic, for example, are among the first to experience biome change directly, through changes to sea ice, permafrost, plants and the movements of animals such as caribou. Their long-term observations add to scientific records that, in the Arctic, cover only a few decades.
Sources: NOAA Arctic Report Card 2024, "Tundra greenness"; IPCC AR6 WGI (2021); Wikipedia, "Hadley cell", "Gulf Stream" and "Tree line", with their references (Ameztegui et al. 2016 for the Pyrenees).
Case study: vegetation moving upslope on Chimborazo, Ecuador
Context
Chimborazo is an ice-capped, inactive volcano in the Andes of central Ecuador, about one degree south of the equator. At 6,263 m it is the highest mountain in Ecuador. Because temperature falls with altitude, the climb from its foothills to the summit passes through a series of vegetation zones that resemble the change in biomes from the tropics towards the poles: montane forest, then the high Andean grassland called páramo, then sparse plants on bare ground, and finally permanent ice.
In June 1802 the naturalist Alexander von Humboldt, with the botanist Aimé Bonpland and the Ecuadorian Carlos Montúfar, climbed Chimborazo to about 5,875 m and recorded the plants they found at different heights. Humboldt used these and other Andean records to draw his Tableau physique (1807), a cross-section of the mountain showing belts of vegetation. It became one of the most influential diagrams in the history of ecology, because it showed that climate controls where plants grow.
What changed
In 2012, exactly 210 years after Humboldt's climb, a team of ecologists repeated his survey on Chimborazo and compared their findings with his records. They found that the vegetation zones had moved upslope and that the maximum elevations of individual plant taxa had risen by more than 500 m on average. The highest seed plant they found grew at 5,185 m, whereas Humboldt had placed the upper limit of plant growth at about 4,600 m.
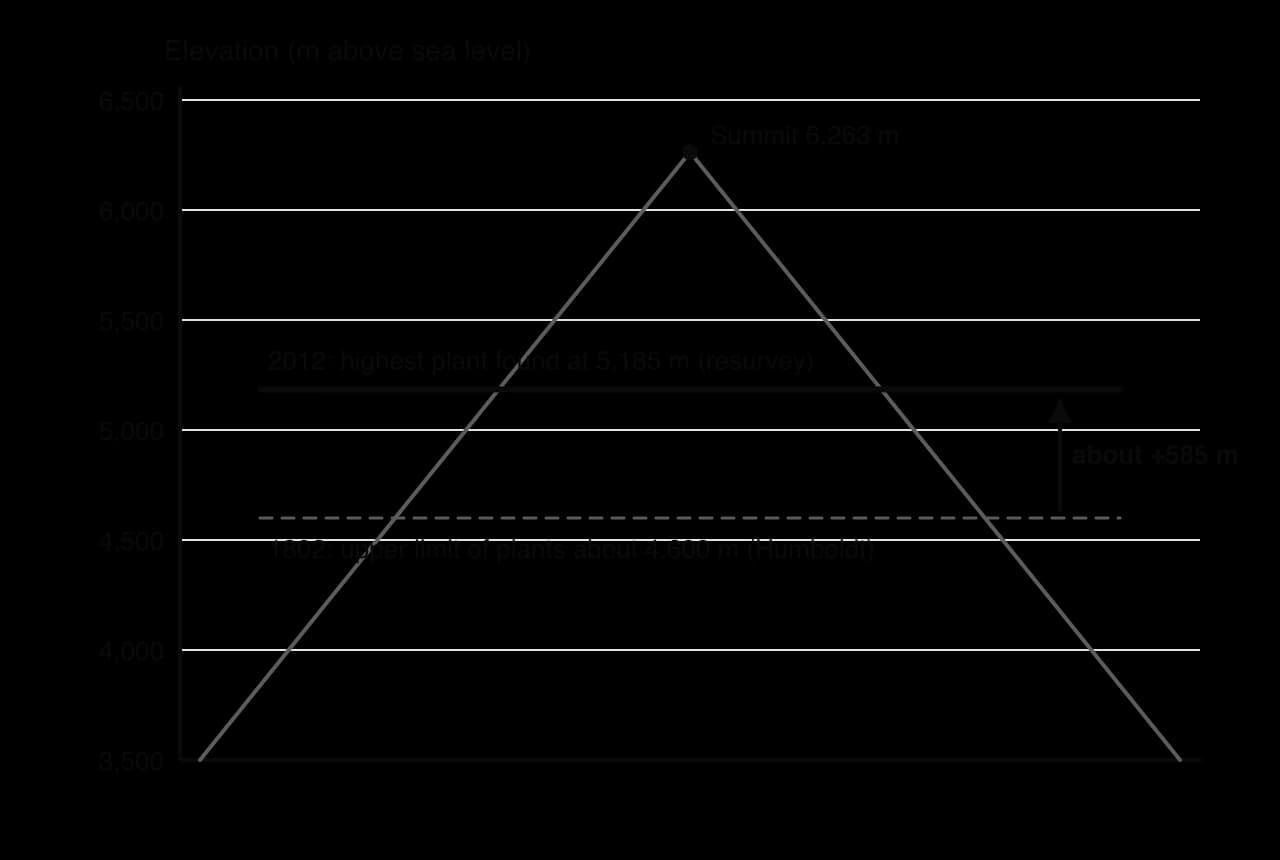
The researchers linked the shift to two changes on the mountain since 1802: higher temperatures and the retreat of Chimborazo's glaciers, which has exposed new ground at high altitude. The shifts were larger than the regional rise in temperature alone would be expected to cause. The researchers suggested that a shift towards drier, less predictable rainfall and ash from the nearby volcano Tungurahua falling on the ice may also have contributed.
Data
Measure | 1802 (Humboldt) | 2012 (resurvey) | Change |
|---|---|---|---|
Upper limit of plant growth | about 4,600 m | 5,185 m (highest seed plant) | about +585 m |
Maximum elevation of individual plant taxa | Humboldt's records | Resurvey records | more than +500 m on average |
Interval | 210 years |
Evaluating the evidence
Historical records like Humboldt's are valuable because they are some of the very few baselines from before modern warming, especially in the tropics. They also have weaknesses. Humboldt's instruments, place names and methods were not those of a modern survey, and his notes were never intended to be repeated.
In 2019 a team of historians and botanists re-examined Humboldt's original notebooks. They concluded that the top part of the Tableau physique, above the treeline, was partly an idealised construction and that most of Humboldt's plant records from above the treeline had actually been collected on a neighbouring volcano, Antisana, not on Chimborazo. Resurveying Antisana, they found an upslope shift of 215–266 m in 215 years: about half the earlier estimate, but consistent with the rate of 10–12 m per decade observed for plants and animals in mountains worldwide.
The original authors replied that a resurvey of Antisana still supported their overall conclusion that vegetation has moved strongly upslope, and the debate continued in the same journal. Both teams agree that plants in the tropical Andes have moved upslope as the climate has warmed; they disagree about how far, and about how much weight a 200-year-old record can bear.
Management and perspectives
Scientific: the case shows both the value of long-term records and the need to check them critically. Historical baselines are needed to show change, but errors in them can make a change look larger or smaller than it is.
Local communities: Chimborazo's glaciers supply water to people in the provinces of Bolívar and Chimborazo. A study of the mountain found evidence of warming between 1986 and 2011, and local residents interviewed reported less rainfall and less surface water. For farming communities, the upslope shift of vegetation, crops and water sources is a direct change to their livelihoods.
Conservation (ecocentric): species that already live near the upper limit of vegetation can move only a little further before they run out of mountain. Mountain-top species in the tropics are therefore at risk of the "escalator to extinction", and protecting connected areas from lower to higher altitude allows species room to move.
Global (anthropocentric and technocentric): the evidence adds to the case for cutting greenhouse gas emissions; other responses include monitoring with permanent plots and seed banking of threatened high-altitude plants.
What it shows
Chimborazo shows, on a single mountain, the two ideas at the heart of this topic: abiotic factors such as temperature determine where each type of vegetation grows, and as the climate warms, those zones move to higher altitude. It also shows that measuring a biome shift is not simple. The size of the shift depends on the quality of the baseline, and warming acts together with other changes, such as glacier retreat and drying, to move species. A sound conclusion therefore states both the direction of change, which is well supported, and the uncertainty in its size.
Sources: Morueta-Holme, N. et al. (2015) PNAS 112: 12741–12745; Moret, P. et al. (2019) "Humboldt's Tableau Physique revisited", PNAS 116: 12889–12894; Morueta-Holme et al. and Moret et al., replies in PNAS (2019); La Frenierre, J. and Mark, B. G. (2017) Annals of the American Association of Geographers 107: 979–997; Wikipedia, "Chimborazo".
Climate types and their biomes (HL only)
The pattern of biomes follows a smaller number of broad climate types. Each type results from the same few controls: latitude (which sets insolation and the position under the circulation cells), distance from the sea (which sets the temperature range and moisture supply), ocean currents and prevailing winds.
Climate type | Subtype | Main features and reasons | Typical biomes |
|---|---|---|---|
Tropical | Equatorial | Hot all year (monthly means about 25–28 °C) because insolation is high and varies little; rain in every month from rising air at the ITCZ | Tropical rainforest |
Seasonal (wet–dry) | Hot all year, but rain falls mainly when the ITCZ moves overhead in summer; dry season under the subtropical high | Savanna, tropical seasonal forest; hot desert where the dry season lasts most of the year | |
Temperate | Maritime | Near oceans on the western sides of continents; the sea's high heat capacity gives mild winters, cool summers and a small annual range; westerlies bring rain all year | Temperate (deciduous) forest, temperate rainforest |
Continental | Far from the sea, in continental interiors; land heats and cools quickly, giving hot summers, cold winters and a large annual range; lower precipitation, often peaking in summer | Temperate grassland, boreal forest, temperate forest in wetter areas | |
Polar | Very low insolation, long polar nights and sinking dry air of the polar cell; very cold and dry | Tundra, polar desert, ice sheet |
Maritime and continental climates compared
Dublin and Moscow lie at similar latitudes (53°N and 56°N), so they receive similar insolation through the year. Their climates are nonetheless very different, maritime in Dublin and continental in Moscow, because Dublin lies on the western edge of Europe beside the Atlantic and Moscow lies far inland.
When the predicted biome does not develop (HL only)
The Whittaker diagram predicts the biome that the climate of a place would support. In many places a different community is found, because other factors override the climate or because people have changed the land. The biome that would develop without human interference is sometimes called the potential natural vegetation of an area.
Soils and parent rock. Very sandy, shallow, waterlogged or nutrient-poor soils can prevent forest from developing even where the climate would support it, for example heathland on poor sandy soils or bogs on waterlogged ground.
Relief and drainage. Steep slopes have thin soils, exposed summits are too windy for trees, and valley floors may be waterlogged.
Fire. Regular fires kill tree seedlings but not the underground parts of grasses, so many savannas are kept open by fire as well as by drought.
Grazing. Large herbivores, wild or domestic, eat tree seedlings and can hold a community at grassland or heath.
Human land use. Agriculture, forestry plantations and cities replace the natural community completely.
The uplands of Britain are a clear example. Their climate would support woodland over much of their area, and pollen analysis shows that much of the Pennine moorland was forested in Mesolithic times. Today large areas are treeless heather moorland or grassland, held in that state by sheep grazing and the rotational burning of heather: a plagioclimax rather than the forest the climate would support. Equally, most of lowland Britain would be temperate deciduous forest without people, but is instead farmland and towns.
The ocean conveyor belt (HL only)
Besides the wind-driven surface currents, the oceans have a slow, deep circulation driven by differences in water density, which depend on temperature and salinity. In the North Atlantic, cold, salty water sinks and flows south at depth, drawing warm surface water north to replace it. This global loop, the great ocean conveyor belt, links all the oceans and moves heat over hundreds to thousands of years. Its mechanism, its role in regional climate and the risk that it may slow as the climate warms are covered with water systems and with climate tipping points.
El Niño–Southern Oscillation (HL only)
Normal conditions and the Walker circulation
In neutral conditions, the trade winds blow from east to west across the equatorial Pacific. They push warm surface water westward, where it piles up as a deep "warm pool" near Indonesia and northern Australia. Off the coast of Peru and Ecuador, the water pushed away is replaced by cold, nutrient-rich water from below, a process called upwelling. The thermocline, the boundary between warm surface water and cold deep water, is therefore deep in the west (on average about 140 m) and shallow in the east (about 30 m).
Above the ocean, warm, moist air rises over the warm pool, bringing heavy rain to Indonesia and northern Australia, flows east at height, and sinks over the cool eastern Pacific, where the air is dry. This east–west loop of air is the Walker circulation. The upwelling off Peru supplies nutrients that support high productivity of phytoplankton, which in turn support one of the largest fisheries in the world, for the Peruvian anchoveta (Engraulis ringens).
How El Niño develops
During an El Niño event the trade winds weaken or even reverse. Warm water from the western Pacific spreads east across the ocean, and the thermocline deepens in the east. The upwelling off South America then brings up warm, nutrient-poor water instead of cold, nutrient-rich water, and the surface layer becomes more strongly stratified. The Walker circulation weakens or reverses, so the area of rising air and heavy rain moves to the central and eastern Pacific.
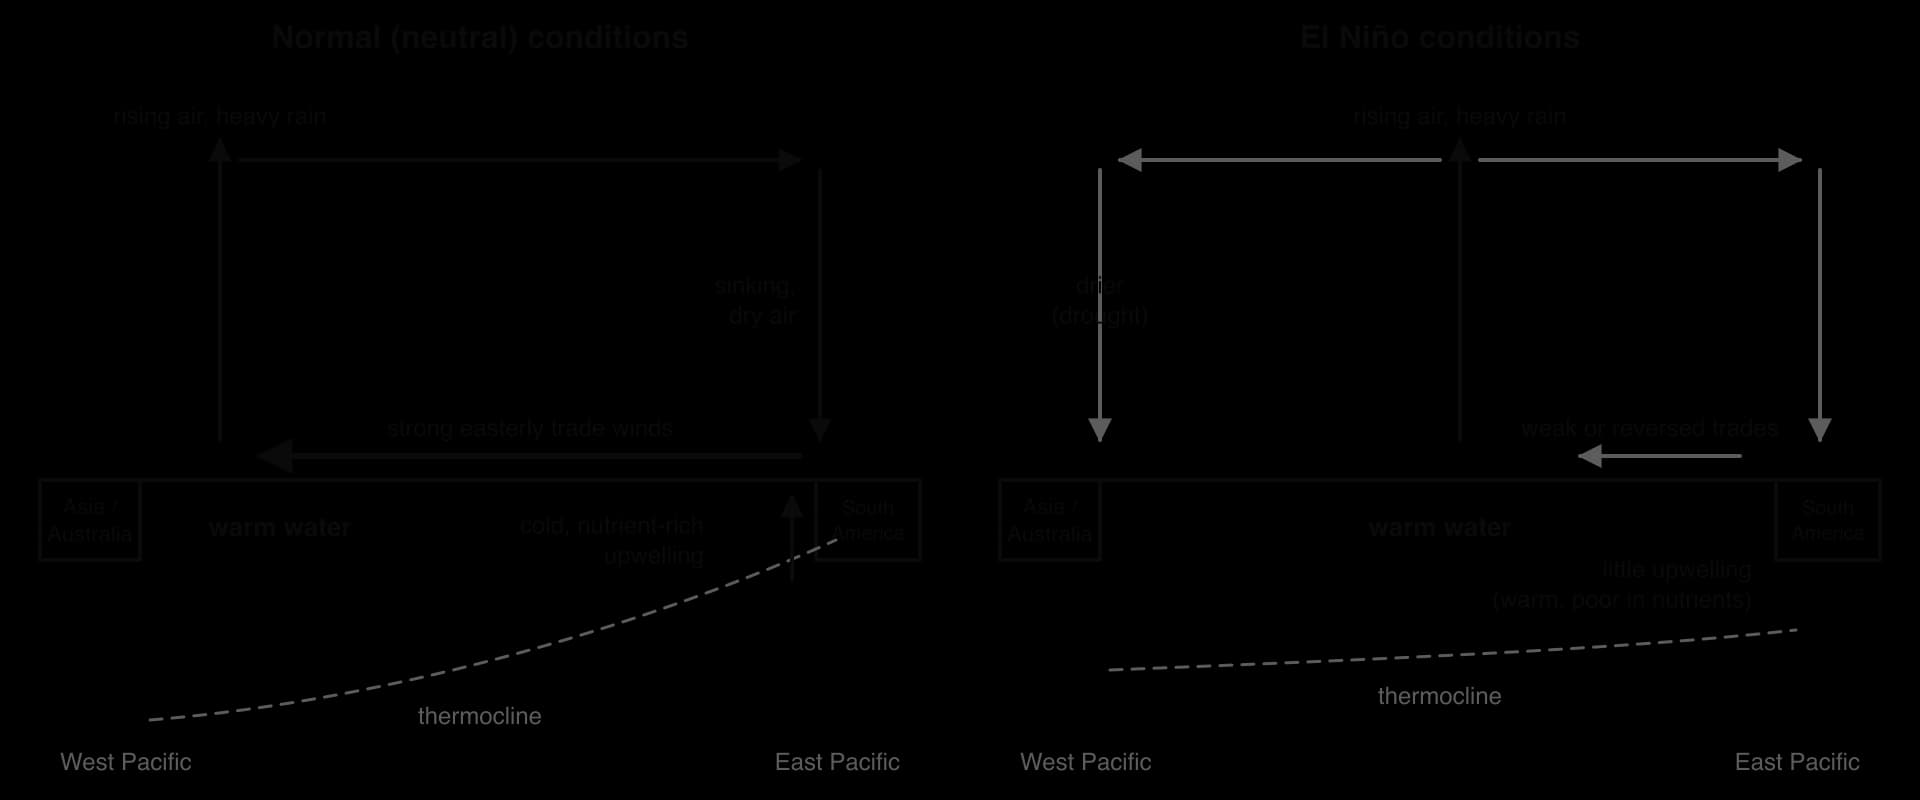
Once started, an El Niño tends to strengthen itself. Weaker trade winds let warm water spread east; the warmer eastern Pacific reduces the temperature contrast that drives the trade winds, so they weaken further. This is a positive feedback between ocean and atmosphere. After a year or so, ocean processes bring the system back, and often overshoot into La Niña.
La Niña reverses the effects of El Niño and exaggerates normal conditions: stronger trade winds, more upwelling and colder water off South America, and more rain over Indonesia and Australia. Each phase typically lasts about a year, and events occur at irregular intervals of about two to seven years, with neutral conditions in roughly half of all years.
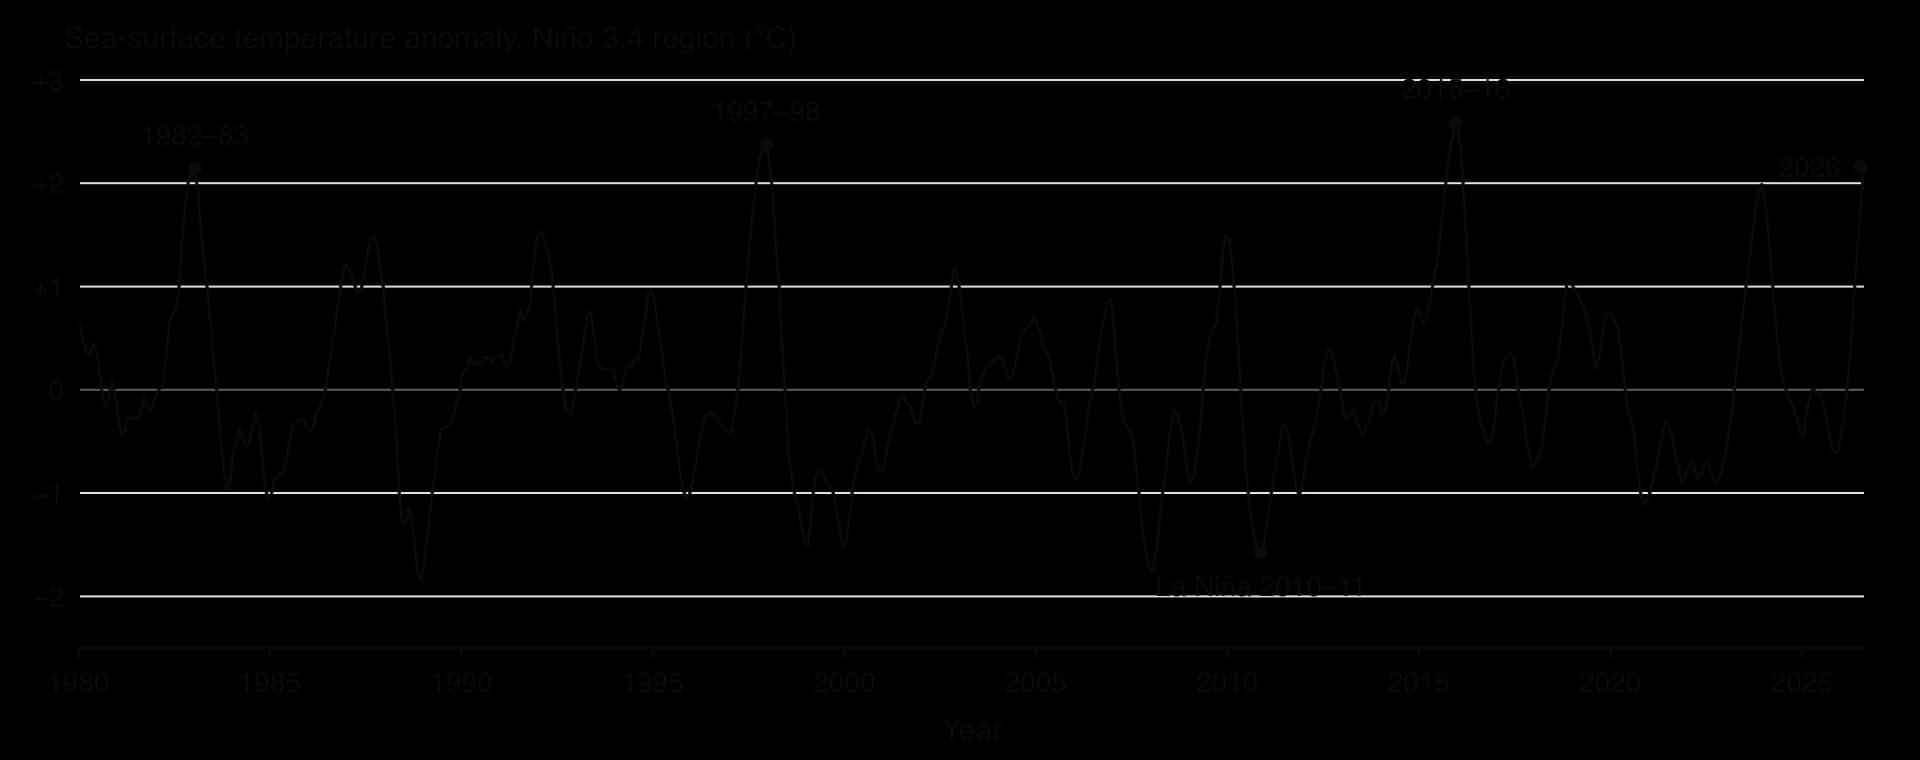
The Oceanic Niño Index shows how irregular ENSO is. The strongest El Niño events since 1980 peaked in 1982–83, 1997–98 and 2015–16, but the gaps between them, and their size, differ widely. In July–September 2026 the index reached +2.16 °C, indicating El Niño conditions again. Since 2026 NOAA has used a closely related Relative Oceanic Niño Index (RONI) for official monitoring; its value for the same period was +1.69 °C. Because the timing and strength of events are hard to predict more than a few months ahead, ENSO forecasts are given as probabilities.
Effects on weather and marine productivity
ENSO affects the tropical Pacific directly and, through changes in atmospheric circulation, the weather of many other tropical and subtropical regions indirectly.
Peru (marine productivity): the Peruvian anchoveta catch reached a record 13.1 million tonnes in 1971. During the 1972–73 El Niño, warm water spread over the cold Humboldt Current and the thermocline deepened, cutting the supply of nutrients; combined with overfishing, the anchoveta population collapsed. Strong El Niños in 1982–83 and 1997–98 again caused large falls. In October 2015, during another El Niño, a survey found only 2 million tonnes of anchoveta of reproductive age, well below the 5 million tonnes normally needed before the fishery is opened.
Indonesia (drought and fire): El Niño moves the rain away from the western Pacific. In 1997–98 the dry season in Indonesia was even drier than normal, and fires set to clear land in Kalimantan and Sumatra spread into peat-swamp forest. The resulting haze affected Indonesia, Malaysia, Singapore and other countries, with total costs estimated at between US$4.5 billion and US$9 billion.
Australia (La Niña floods): during the strong La Niña of 2010–11, Queensland had its wettest December on record. Rain falling on saturated catchments caused floods that killed 33 people, affected more than 2.5 million people, and led to over 78% of the state being declared a disaster zone; insured losses were estimated at A$2.38 billion.
Tropical cyclones (HL only)
Around 80–90 named tropical storms form each year worldwide, and more than half reach hurricane strength. The name depends on location: hurricanes in the Atlantic and north-eastern Pacific, typhoons in the north-western Pacific, and cyclones in the Indian Ocean and South Pacific.
How tropical cyclones form
Tropical cyclones draw their energy from warm ocean water. Their formation needs several conditions at once:
Sea-surface temperatures of around 27 °C or more, over a deep layer of warm water, to supply heat and moisture.
Warm, moist air that rises rapidly; as water vapour condenses in the rising air it releases latent heat, which warms the air and makes it rise even faster.
A location at least about 5° from the equator, where the Coriolis effect is strong enough to set the storm spinning.
Low vertical wind shear (little change in wind speed and direction with height), so the storm is not torn apart.
As air rises in the centre, surface pressure falls and air spirals in from all sides to replace it. The inflowing air picks up more heat and moisture from the sea, which feeds more rising air: a positive feedback that strengthens the storm as long as it stays over warm water. Around the calm, clear eye at the centre, a ring of towering cloud, the eyewall, has the strongest winds and heaviest rain. Over land or cooler water the supply of heat and moisture is cut off and the cyclone weakens.
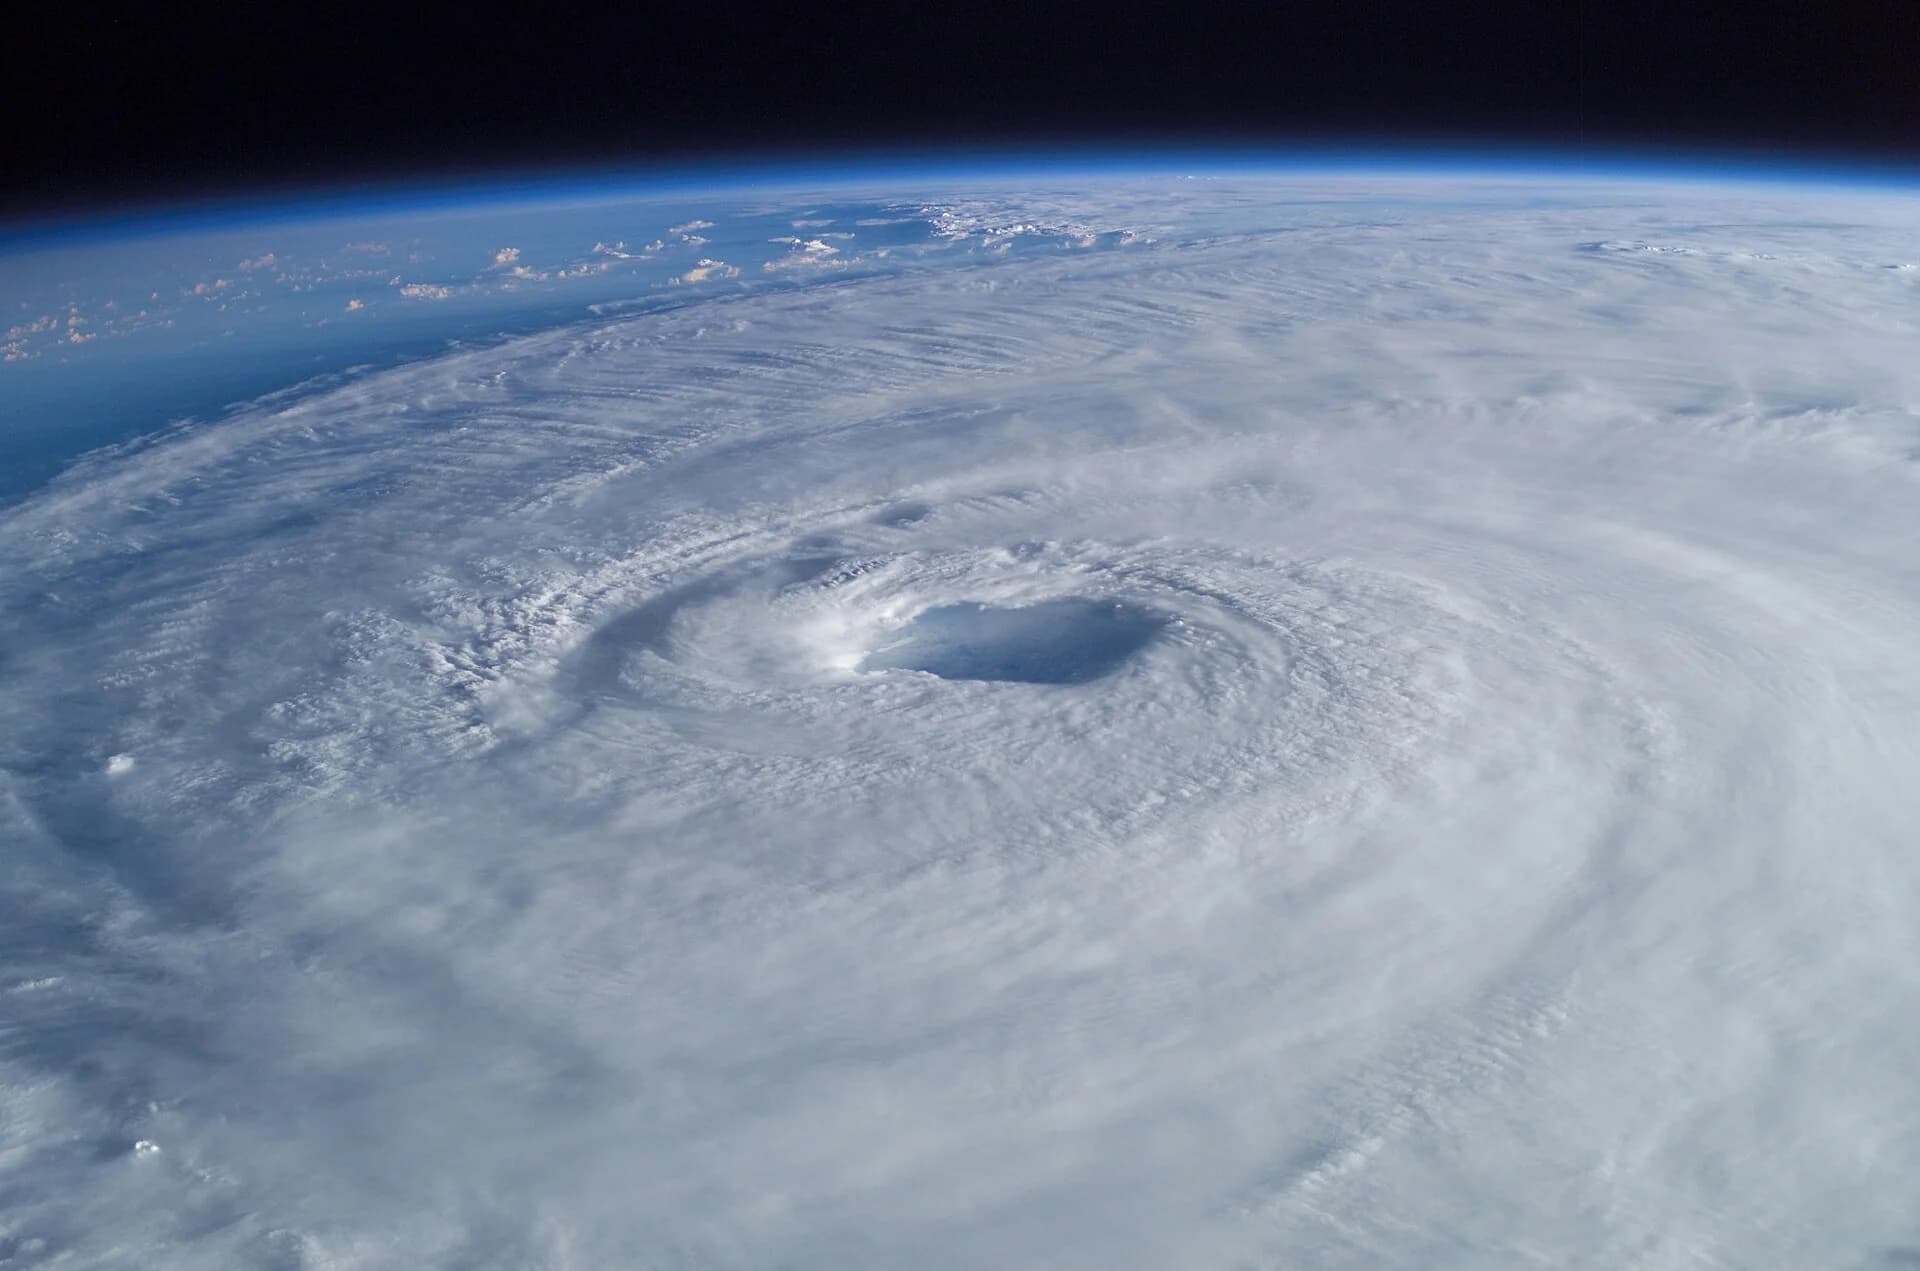
Typhoon Haiyan, known in the Philippines as Yolanda, made landfall at Guiuan in Eastern Samar on 8 November 2013 (local time), with estimated one-minute sustained winds of about 305 km/h at landfall (315 km/h at its peak). A storm surge of about 5.2 m destroyed the terminal building at Tacloban airport, and about 6,300 people died in the Philippines. It showed that the most damaging part of a cyclone is often the storm surge: the rise in sea level pushed onshore by the wind and low pressure.
Is global warming making tropical cyclones worse?
Warmer oceans contain more heat energy, and warmer air can hold more water vapour, so there are good physical reasons to expect stronger storms with heavier rain. The evidence, assessed by the Intergovernmental Panel on Climate Change (IPCC) in its Sixth Assessment Report, supports some of these expectations more strongly than others:
Change | IPCC AR6 assessment |
|---|---|
Proportion of major (Category 3–5) tropical cyclones | Likely to have increased over the last four decades |
Latitude of peak intensity in the western North Pacific | Very likely to have shifted northward |
Heavy rain from tropical cyclones | Increased by human-induced climate change (high confidence) |
Proportion of the most intense (Category 4–5) cyclones and their peak winds | Projected to increase with further warming (high confidence) |
Total number (frequency) of tropical cyclones | Low confidence in long-term trends |
Rising sea levels add to the danger, because the same storm surge now starts from a higher base and reaches further inland. The overall picture is therefore not necessarily more cyclones, but a larger share of very intense ones, with heavier rain and higher surges.
Sources: NOAA Climate Prediction Center, Oceanic Niño Index (2026); IPCC AR6 WGI Summary for Policymakers (2021), A.3.4 and B.2.4; WMO World Weather Information Service; Wikipedia, "El Niño–Southern Oscillation", "Peruvian anchoveta", "1997 Southeast Asian haze", "2010–2011 Queensland floods", "Typhoon Haiyan", "Tropical cyclone" and "Moorland", with their references.
Exam practice
Questions on climate and biomes appear in Paper 2 Section A as short definitions, explanations of biome distribution and data questions on climate graphs; in Paper 1 through unfamiliar climate or vegetation data for a named place; and in Paper 2 Section B through essays that combine biome characteristics, atmospheric circulation and climate change. HL papers add ENSO and tropical cyclones.
Paper 2 Section A-style questions
Paper 1-style data question
The following resource is hypothetical data, written for practice. Surveys recorded the highest altitude at which a species of shrub was found on a mountain in three different years, together with the mean summer temperature at a weather station at 2,000 m.
Survey year | Highest altitude of shrub (m) | Mean summer temperature at 2,000 m (°C) |
|---|---|---|
1960 | 2,350 | 11.2 |
1990 | 2,410 | 11.6 |
2020 | 2,530 | 12.5 |
Paper 2 Section B-style essay
HL question
Summary
Weather is the state of the atmosphere over hours or days; climate is the average of these conditions over about 30 years.
A biome is a group of comparable ecosystems that develop in similar climates; precipitation, temperature and insolation are the main controls of their distribution on land.
Climate graphs show monthly mean temperature (line) and precipitation (bars); a Whittaker diagram shows which biome is likely for each combination of temperature and rainfall.
Tropical rainforest has the highest NPP and diversity (limited by light and nutrients); hot desert is limited by water and tundra by temperature and the short growing season, so both have low NPP and diversity.
In the tricellular model, rising air at the equator and 60° gives low pressure and rain, and sinking air at 30° and the poles gives high pressure and dry conditions, which explains the belts of biomes.
The oceans store heat and ocean currents carry it poleward; warm currents moderate climates such as north-west Europe's, and cold currents dry neighbouring coasts.
Global warming is moving biomes poleward and upslope (Arctic greening, rising treelines, Chimborazo), but the size of shifts is uncertain and other factors such as land use also play a part.
Climates fall into tropical (equatorial, seasonal), temperate (maritime, continental) and polar types, each with its own biomes. (HL)
Soils, relief, fire, grazing and human land use can stop the biome predicted by climate from developing. (HL)
ENSO swings irregularly between El Niño (weak Walker circulation, less upwelling off Peru) and La Niña (strong Walker circulation, more upwelling), affecting weather and marine productivity across the tropics. (HL)
Tropical cyclones form over oceans above about 27 °C; warming is increasing the proportion of the most intense storms and their rainfall, but not clearly their number. (HL)
Self-check
- To do:
I can distinguish between weather and climate.
- To do:
I can define a biome and explain how precipitation, temperature and insolation control where biomes occur.
- To do:
I can construct and interpret a climate graph and use a Whittaker diagram.
- To do:
I can compare the limiting factors, productivity and biodiversity of tropical rainforest, hot desert, tundra, temperate forest and boreal forest.
- To do:
I can draw and explain the tricellular model and use it to explain the distribution of biomes.
- To do:
I can outline how the oceans absorb and redistribute heat.
- To do:
I can explain, with evidence, how global warming is shifting biomes poleward and upslope.
- To do:
I can evaluate the tricellular model and the biome concept as models.
- To do:
I can explain the three general climate types and why a predicted biome may not develop. (HL)
- To do:
I can explain how El Niño and La Niña develop and describe their effects. (HL)
- To do:
I can describe tropical cyclones and evaluate evidence that warming is making them more intense. (HL)
Flashcards for 2.4
The official deck for this part of the syllabus.
2.4 Climate and biomes · front
What is weather?
2.4 Climate and biomes · front
What is climate?
- 2.4 Climate and biomes250 cards
Carry on with 2.4 in Augment
With a free account, Augment remembers where you stopped and what you have practiced.