Trace carbon and nitrogen through their stores and flows, decide when an ecosystem is a sink or a source, and evaluate how human activity and policy change the cycles, from Amazon forests to ocean acidification.
Each is in the ESS glossary, with every other term in the subject.
A compound of nitrogen and hydrogen (NH₃) made by nitrogen fixation and by the Haber process; the starting material for most synthetic nitrogen fertilisers.
The release of ammonium from the nitrogen-containing organic compounds in dead organisms and wastes, carried out by decomposers.
The positively charged ion NH₄⁺, formed when ammonia dissolves in soil water; a form of inorganic nitrogen released by decomposition and used by nitrifying bacteria.
Conditions in which oxygen is absent or very scarce, such as waterlogged soils, swamp sediments and animal guts, where only organisms that do not need oxygen can respire.
The continuous movement of a chemical element such as carbon or nitrogen between living organisms and the atmosphere, hydrosphere and lithosphere, which keeps the element available to living things.
The process by which organisms such as corals, molluscs and some plankton build shells or skeletons of calcium carbonate from calcium and carbonate ions dissolved in seawater.
A compound of calcium, carbon and oxygen (CaCO₃) that marine organisms use to build shells and skeletons, and the main component of limestone and chalk.
Outline how biogeochemical cycles keep chemical elements available to living organisms.
Distinguish between a store, a sink and a source, and identify each in a named ecosystem.
Describe the main organic and inorganic carbon stores and explain what residence time means.
Construct a systems diagram of the carbon cycle, labelling each flow as a transfer or a transformation.
Explain how forests, agricultural land and oceans can act as carbon stores, sinks or sources.
Explain how increased dissolved carbon dioxide causes ocean acidification and harms marine organisms.
Evaluate measures that reduce human impacts on the carbon cycle.
Explain how limestone and fossil fuels form and why methane is produced in anaerobic conditions. (HL)
Construct a systems diagram of the nitrogen cycle and explain the roles of bacteria in it. (HL)
Evaluate the Haber process and the evidence that the planetary boundary for nitrogen has been crossed. (HL)
Living things are built from a small number of chemical elements, above all carbon, hydrogen, oxygen and nitrogen. The Earth receives a constant input of energy from the Sun but almost no new matter, so these elements must be used again and again. A biogeochemical cycle is the pathway by which an element moves between organisms and the non-living parts of the planet, and back again.
The carbon and nitrogen cycles are studied here as systems, with stores and flows, because that view shows where human activities have changed them most: burning fossil fuels, clearing forests and making fertiliser. These changes link the cycles to
The official deck for this part of the syllabus.
What is a biogeochemical cycle?
What is the main role of biogeochemical cycles for living organisms?
With a free account, Augment remembers where you stopped and what you have practiced.
The biogeochemical cycle by which carbon moves between the atmosphere, organisms, soils, oceans and rocks through processes such as photosynthesis, respiration, decomposition, dissolving and combustion.
The process of capturing carbon dioxide from the atmosphere or from emissions and storing it in solid or liquid form, for example in plant biomass, soils, rocks or underground reservoirs.
The burning of a fuel or organic matter in oxygen, a transformation that releases energy as heat and light and returns stored carbon to the atmosphere as carbon dioxide.
The conversion of nitrate back into nitrogen gas by denitrifying bacteria in anaerobic conditions such as waterlogged soils, returning nitrogen to the atmosphere.
A carbon-rich fuel such as coal, oil or natural gas, formed over millions of years from the partly decomposed remains of ancient organisms buried in sediments.
The industrial process that combines nitrogen from the air with hydrogen, at high temperature and pressure over an iron catalyst, to make ammonia, mainly for fertilisers.
A plant, such as a pitcher plant or sundew, that traps and digests insects to obtain nitrogen and other nutrients missing from the waterlogged, nutrient-poor soils where it grows.
A plant of the pea and bean family, such as clover, beans, peas, lentils and soya, whose root nodules hold nitrogen-fixing bacteria.
A sedimentary rock made mostly of calcium carbonate, often from the shells and skeletons of marine organisms; the largest carbon store on Earth, holding carbon for hundreds of millions of years.
The production of methane by methanogenic microorganisms that break down dead organic matter in anaerobic conditions, for example in wetlands, rice paddies and the stomachs of ruminants.
The conversion of ammonium into nitrite and then nitrate by nitrifying bacteria in aerobic soil and water.
The ion NO₂⁻, an intermediate form of inorganic nitrogen produced from ammonium and then converted into nitrate during nitrification.
The biogeochemical cycle by which nitrogen moves between the atmosphere, soils, water and organisms, largely through transformations carried out by bacteria.
The conversion of unreactive nitrogen gas (N₂) from the atmosphere into ammonia or ammonium, carried out by nitrogen-fixing bacteria, by lightning or industrially by the Haber process.
Bacteria that convert atmospheric nitrogen into ammonia, either living freely in soil and water or in mutualistic association with plants, such as Rhizobium in the root nodules of legumes.
The ongoing decrease in the pH of seawater caused by the oceans absorbing carbon dioxide from the atmosphere, which also lowers the concentration of carbonate ions.
A waterlogged soil made of partly decomposed plant material that builds up because anaerobic conditions slow decomposition; a large carbon store that becomes a source when drained or burned.
All forms of nitrogen other than unreactive nitrogen gas (N₂), such as ammonia, ammonium, nitrate and nitrous oxide, which living things can use or which can pollute air and water.
The average length of time that an atom of an element, such as carbon, remains in a particular store before moving to another store.
A small swelling on the root of a plant such as a legume or alder that houses nitrogen-fixing bacteria in a mutualistic relationship with the plant.
A plant-eating mammal, such as a cow, sheep or goat, with a multi-chambered stomach in which microorganisms ferment plant material, producing methane.
A store that takes in more of an element than it releases over a period of time, so that the amount held in it is increasing; a net accumulation.
A store that releases more of an element than it takes in over a period of time, so that the amount held in it is decreasing; a net release.
At the scale of the whole planet, the Earth behaves almost as a closed system for matter: energy enters as sunlight and leaves as heat, but very little matter crosses the boundary. The carbon atoms in a leaf today have passed through the atmosphere, the ocean, rocks and other organisms many times before. Life can only continue because these atoms are released again after death and become available for new growth.
Each cycle connects the four great spheres of the Earth system: the biosphere, the atmosphere, the hydrosphere and the lithosphere. Some flows are fast (a leaf takes in carbon dioxide within seconds), and some are extremely slow (carbon locked in rock may stay there for hundreds of millions of years). The balance between fast and slow parts of the cycle has kept the composition of the atmosphere and oceans fairly stable for long periods.
Human societies now move elements faster than many natural processes do. Burning coal, oil and gas returns carbon to the atmosphere in decades that took millions of years to lock away. Industrial fertiliser production converts vast amounts of unreactive nitrogen gas from the air into forms that plants can use. When a flow into a store becomes much larger than the flow out, the store grows, and the systems that depend on it change: the climate warms, the oceans become less alkaline, and lakes and coastal seas are over-fertilised.
This is why the cycles are central to sustainability. Several of the planetary boundaries are measured directly on the carbon and nitrogen cycles, and the Sustainable Development Goals on climate action (SDG 13), life below water (SDG 14), life on land (SDG 15) and zero hunger (SDG 2) all depend on how these cycles are managed.
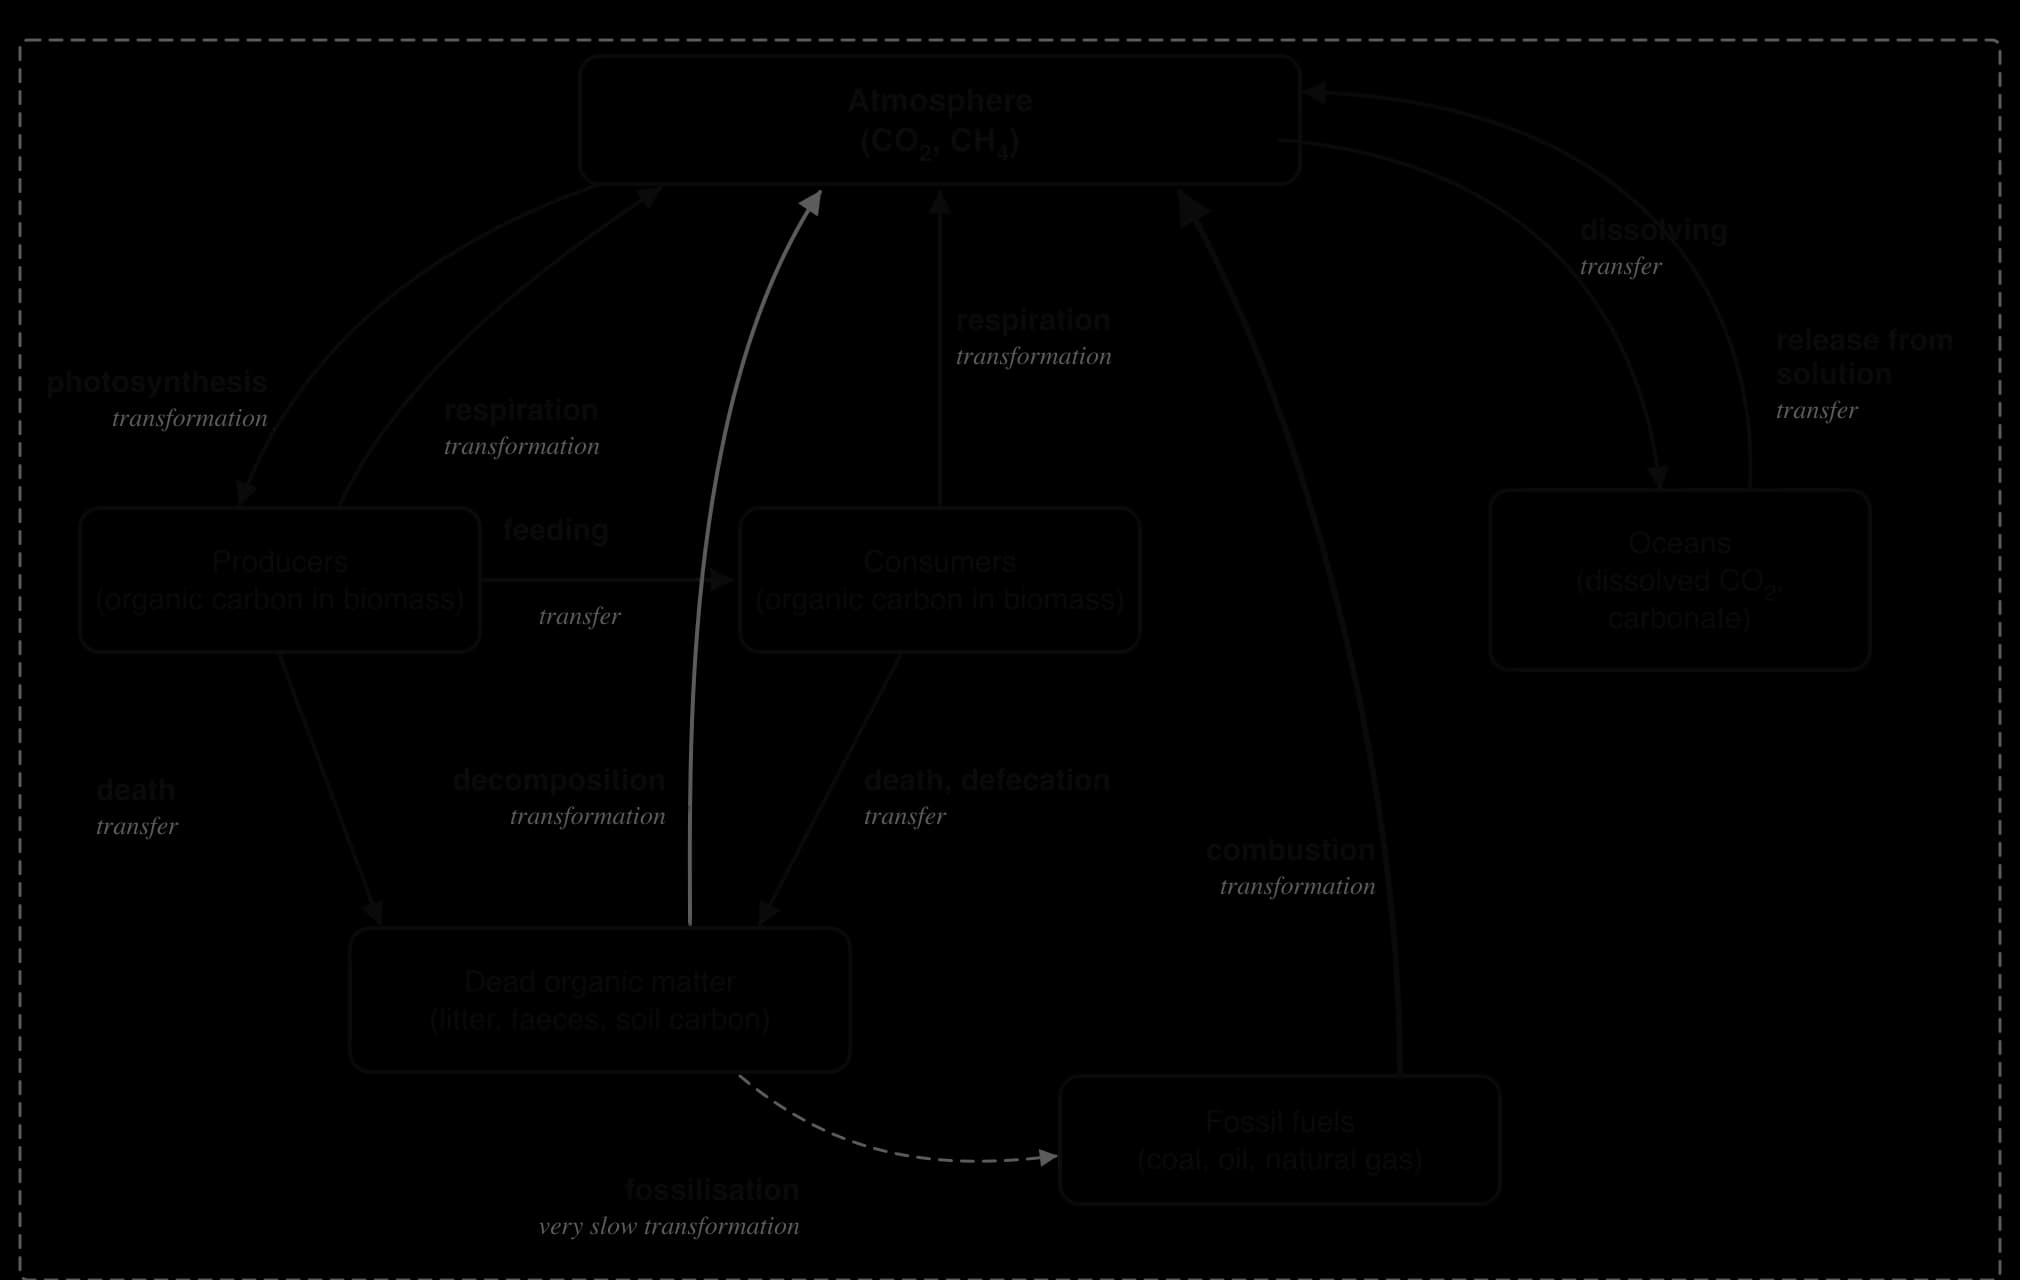
A biogeochemical cycle can be drawn as a systems diagram. As with any systems diagram, the stores are boxes and the flows are arrows labelled with the process that moves the element. Each flow is either a transfer (the element changes location but not its chemical form) or a transformation (the element changes its chemical form, state or energy). The three words store, sink and source describe what is happening to the amount held in a store over time.
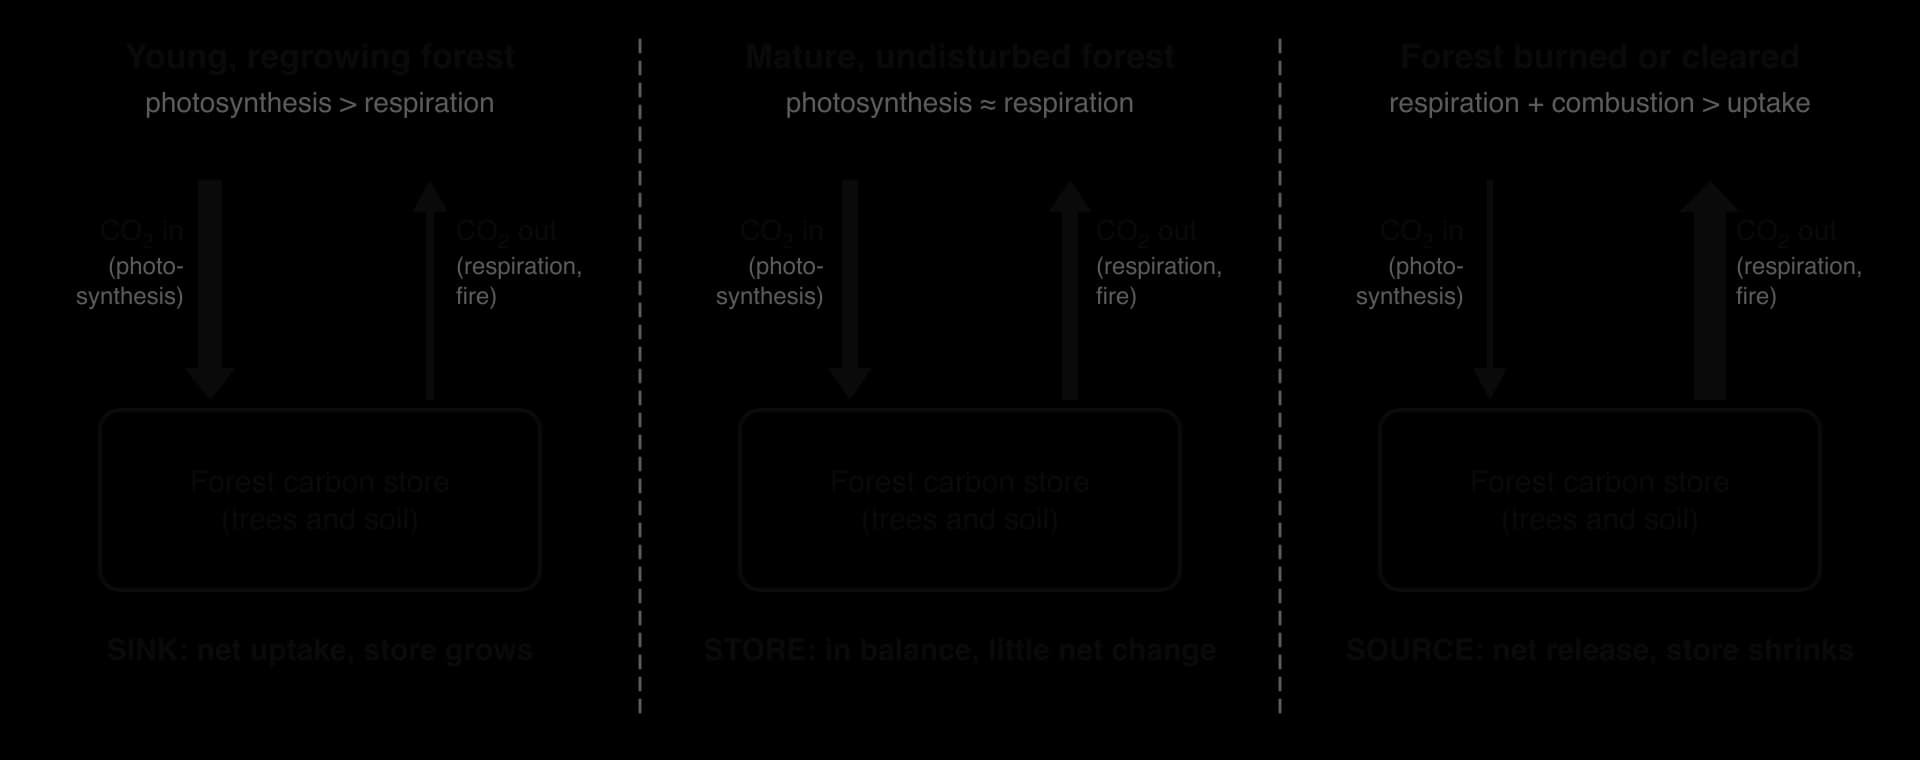
A store is any part of a cycle where an element is held for a time: the atmosphere, a forest, the soil, the ocean or a coal seam. A store is said to be in equilibrium when the flows into it balance the flows out, so the amount it holds stays roughly the same. An old, undisturbed forest is a good example: its trees take in carbon dioxide by photosynthesis, but almost as much carbon returns to the air through respiration, decay and the death of old trees.
A young forest growing on abandoned farmland is a carbon sink. Its trees are adding wood every year, so photosynthesis removes more carbon from the atmosphere than the forest returns by respiration and decomposition.
A forest that is burned or cleared is a carbon source. Fire turns the carbon in wood and leaves into carbon dioxide within hours, and the carbon in dead roots and exposed soil is released more slowly as it decays.
Term | Inputs compared with outputs | Change in the store | Example for carbon |
|---|---|---|---|
Store in equilibrium | Inputs ≈ outputs | Stays about the same | Mature, undisturbed forest |
Sink | Inputs > outputs | Increases (net accumulation) | Regrowing forest; the ocean today; a waterlogged peat bog |
Source | Outputs > inputs | Decreases (net release) | Burned forest; drained peatland; a burning coal seam |
Carbon is stored in two broad forms. Organic carbon is carbon in the compounds made by living things: the sugars, starch, cellulose, proteins and fats in organisms, dead organic matter in soils, and the fossil fuels coal, crude oil and natural gas, which formed from the remains of ancient organisms. Inorganic carbon is carbon that is not part of these compounds: carbon dioxide and methane in the atmosphere, carbon dioxide and carbonate ions dissolved in the ocean, carbonate minerals in soils, and the calcium carbonate of rocks such as limestone.
Store | Main form of carbon | Organic or inorganic |
|---|---|---|
Living organisms (plants, animals, microorganisms) | Carbohydrates, proteins, fats | Organic |
Dead organic matter and soil organic matter | Partly decomposed plant and animal remains, humus | Organic |
Crude oil, natural gas and coal | Hydrocarbons and other carbon compounds from ancient organisms | Organic |
Atmosphere | Carbon dioxide (CO₂) and small amounts of methane (CH₄) | Inorganic |
Oceans | Dissolved CO₂, hydrogencarbonate (HCO₃⁻) and carbonate (CO₃²⁻) ions | Mostly inorganic |
Soils | Carbonate minerals and organic matter | Inorganic and organic |
Sedimentary rocks such as limestone | Calcium carbonate | Inorganic |
The stores differ enormously in size. The deep ocean holds about forty times as much carbon as the atmosphere, and soils hold about twice as much. The atmosphere is one of the smaller stores, which is why adding carbon to it changes its concentration so quickly.
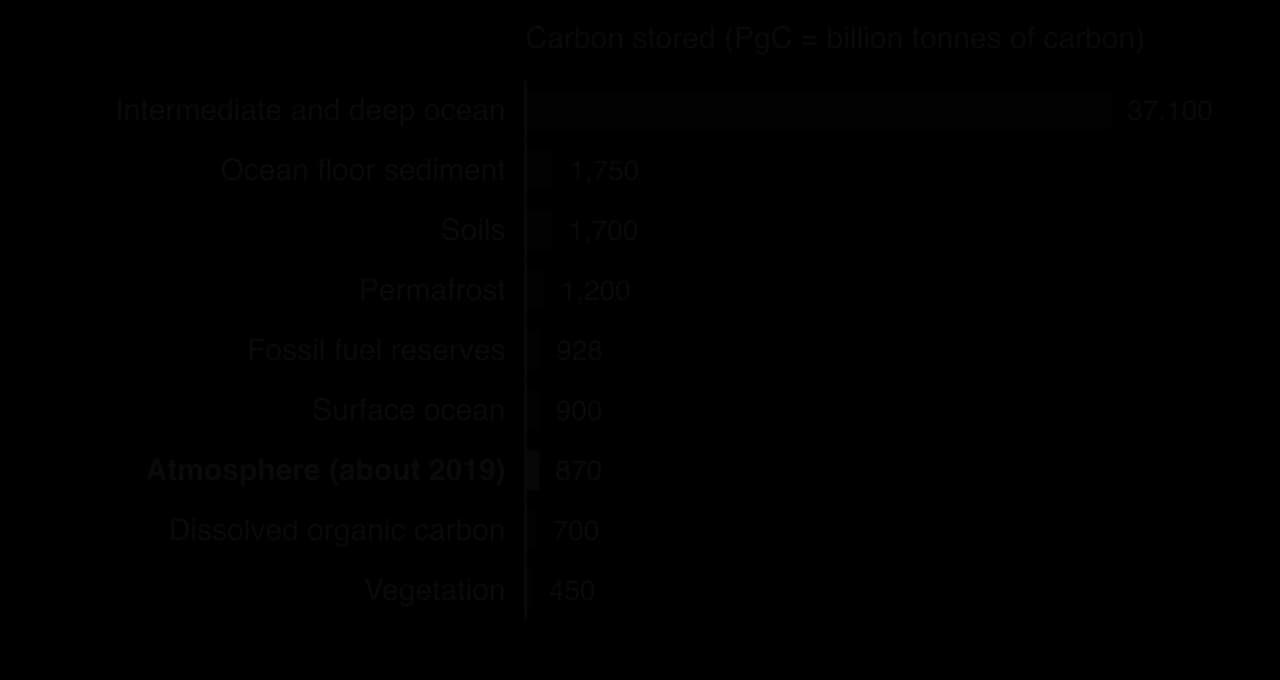
Rocks such as limestone hold far more carbon than any store on the chart, but very little of it moves on human timescales, so it is left out of charts of the fast carbon cycle.
Sources: IPCC AR6 Working Group I, Chapter 5 (2021).
Residence time depends on the size of the store and the size of the flows through it. A small store with large flows, such as the carbon in the leaves of a tropical forest, turns over in a few years. A large store with tiny flows, such as a deep coal seam that nobody mines, can keep its carbon for hundreds of millions of years. A rough estimate of residence time divides the size of a store by the rate at which carbon leaves it.
Carbon moves between stores through a small number of processes. Most of them are carried out by living things, and most are familiar from the study of energy flow in ecosystems. In the carbon cycle, what matters is where each process moves the carbon and whether it changes its chemical form.
Flow | From → to | What happens to the carbon | Transfer or transformation |
|---|---|---|---|
Photosynthesis | Atmosphere (or water) → producers | CO₂ is converted into glucose and then other organic compounds | Transformation |
Feeding (consumption) | Producers → consumers; consumers → consumers | Organic compounds move from one organism to another | Transfer |
Cellular respiration | Organisms → atmosphere (or water) | Glucose is broken down and the carbon released as CO₂ | Transformation |
Defecation (egestion) | Consumers → dead organic matter | Undigested organic matter leaves the body in faeces | Transfer |
Death | Organisms → dead organic matter | The carbon compounds of the body join the litter and soil | Transfer |
Decomposition | Dead organic matter → atmosphere and soil | Decomposers respire the organic matter, releasing CO₂ | Transformation |
Fossilisation | Dead organic matter → coal, oil, gas | Organic matter that does not fully decay is buried and slowly altered | Transformation (very slow) |
Combustion | Biomass and fossil fuels → atmosphere | Organic carbon is burned and released as CO₂ | Transformation |
Dissolving and release from solution | Atmosphere ↔ ocean | CO₂ gas moves into or out of the surface water | Transfer |
Photosynthesis and cellular respiration are the two largest flows between the atmosphere and the land. Photosynthesis by producers turns inorganic carbon into organic carbon; respiration by every organism, including decomposers, turns it back. Feeding by consumers, death and defecation only move organic carbon from one store to another without changing it, so they are transfers.
 YouTube
The balance between photosynthesis and respiration can be measured in the atmosphere itself. Since 1958 the concentration of carbon dioxide has been recorded at Mauna Loa in Hawaiʻi, a series known as the Keeling curve. Besides its long-term rise, from an annual mean of 315.98 ppm in 1959 to 427.35 ppm in 2025, the record shows a regular rise and fall within every year.
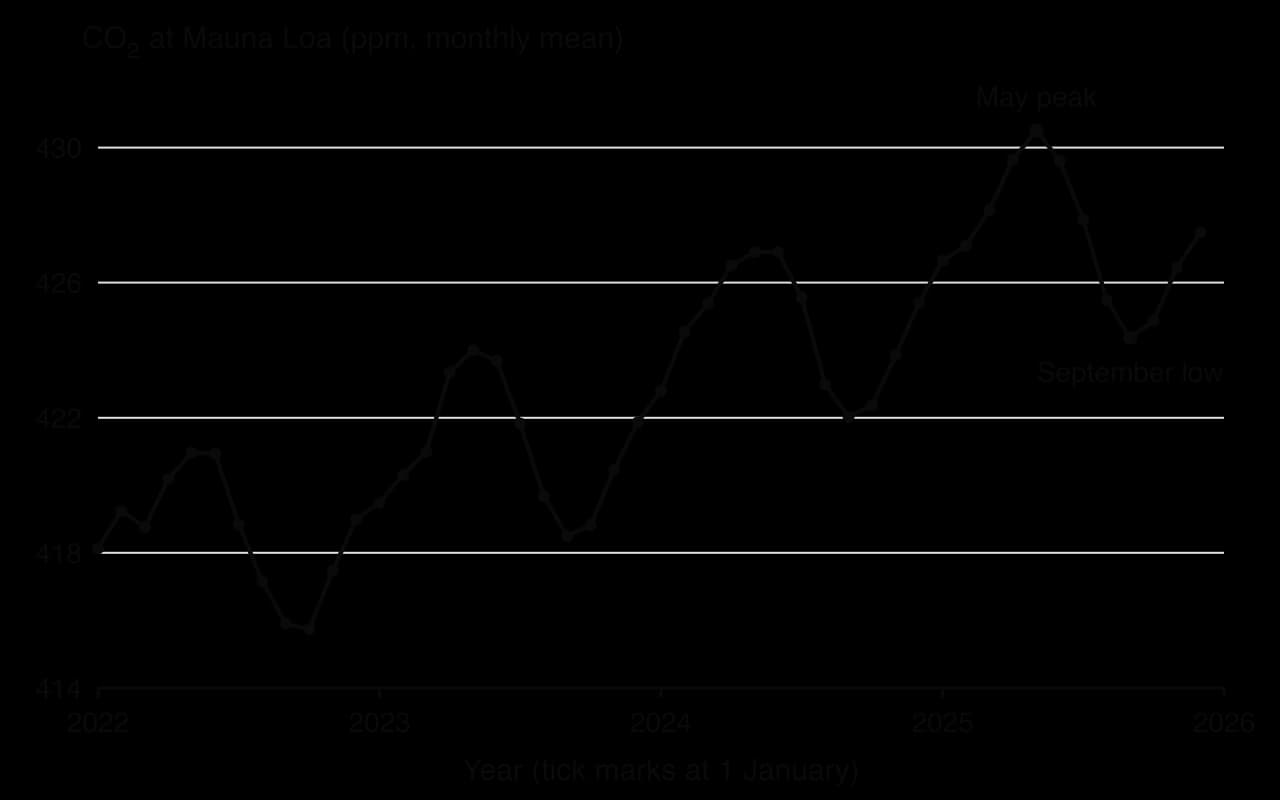
The yearly cycle comes from the land vegetation of the Northern Hemisphere, which holds most of the world’s land and forests. From late spring to early autumn, photosynthesis by growing leaves removes more carbon dioxide than respiration and decomposition release, so the concentration falls. In autumn and winter, leaves fall, photosynthesis slows and decomposition continues, so the concentration rises again. The underlying upward trend is caused mainly by the combustion of fossil fuels.
Sequestration happens naturally whenever a store acts as a sink. Trees sequester carbon as wood, which may last for centuries. Soils sequester carbon as roots, litter and humus, especially where cold or waterlogged conditions slow decay. Over geological time, organic matter that escapes decomposition can be buried and turned into coal, oil and natural gas, sequestering carbon for hundreds of millions of years.
Sequestration can also be engineered. Carbon capture and storage separates carbon dioxide from the exhaust of a power station or factory and pumps it into rock formations deep underground. Planting forests and changing farming methods aim to increase natural sequestration. How useful each method is depends on how long the carbon stays locked away and how much it costs per tonne, which is why these methods are evaluated as climate policy rather than as biology alone.
Whether an ecosystem is a store, a sink or a source can be worked out from its carbon budget. The total input is the carbon taken up by photosynthesis; the total output is the carbon released by the respiration of all organisms, including decomposers, plus any lost by fire, harvest or erosion.
Photosynthesis > respiration (and other losses): net uptake of CO₂. The ecosystem is a sink: a young, regrowing forest, a growing peat bog, a newly planted woodland.
Photosynthesis ≈ respiration: no net change. The ecosystem is a store in equilibrium: a mature forest that has reached its maximum biomass.
Respiration and other losses > photosynthesis: net release. The ecosystem is a source: a forest destroyed by fire or deforestation, drained peat, or soil that is ploughed every year.
The classification describes the present state, not the type of ecosystem. The same rainforest can be a sink in a wet year and a source in a drought year, when trees die and fires spread. Over decades, a forest that is regrowing after logging moves from source (immediately after clearing) to sink (while it regrows) to store (at maturity).
Coal, crude oil and natural gas formed when ecosystems in the distant past acted as carbon sinks. The remains of organisms were buried before they could decompose fully, and over millions of years this organic matter was turned into fossil fuels.
Left in the ground, a fossil fuel is a store with an almost unlimited residence time: some coal has held its carbon for more than 300 million years. When fossil fuels are mined and burned, the store becomes a source. Combustion releases in a few seconds carbon that took millions of years to accumulate, and the natural processes that would lock it away again, such as the formation of new rock, are far too slow to keep up.
Fossil fuel use releases inorganic carbon far faster than the oceans and land can absorb it. In 2023, fossil fuels and cement released about 10.1 billion tonnes of carbon (GtC), and land-use change, mainly deforestation, about 1.0 GtC more. Of this total of about 11.1 GtC, the ocean absorbed about 2.9 GtC and land vegetation about 2.3 GtC, and the remaining 5.9 GtC stayed in the atmosphere.
Carbon flow in 2023 | GtC per year | Share of human emissions |
|---|---|---|
Fossil fuels and cement (source) | 10.1 | 91% |
Land-use change, mainly deforestation (source) | 1.0 | 9% |
Taken up by the ocean (sink) | 2.9 | 26% |
Taken up by land vegetation (sink) | 2.3 | 21% |
Added to the atmosphere | 5.9 | 53% |
Sources: Friedlingstein et al., Global Carbon Budget 2024, _Earth System Science Data (2025)._
About half of each year’s emissions therefore stays in the air, and the concentration of carbon dioxide rises. The other half is sequestered by natural sinks, which have grown as atmospheric CO₂ has risen. Whether these sinks keep growing is one of the key uncertainties about the future climate, because warming, drought and deforestation can weaken them.
Agricultural land covers a large part of the Earth’s ice-free surface, and most of its carbon is in the soil, not in the crops. Whether farmland gains or loses carbon depends mainly on how the soil is managed: how often it is disturbed, whether it is covered by plants all year and whether it is waterlogged or drained. The same field can be a source under one set of techniques and a sink under another.
Heavy tillage (ploughing): turning the soil breaks up clumps of soil and lets in air, so aerobic decomposers break down soil organic matter faster and release CO₂. Bare, ploughed soil is also easily eroded, and the carbon in the eroded topsoil is lost from the field.
Draining wetlands and peat: peat forms in waterlogged, anaerobic conditions where decomposition is very slow, so it can hold carbon for thousands of years. Draining it lets oxygen in, decomposition speeds up and the dry peat can catch fire.
Monoculture with bare fallow periods: a single crop, harvested and removed each year, returns little organic matter to the soil, and soil left bare between crops loses carbon and is exposed to erosion.
Clearing forest or grassland for crops: the carbon in the natural vegetation and much of the soil carbon beneath it is lost in the first years after conversion.
Regenerative agriculture aims to rebuild soil organic matter. Its main methods are crop rotation (alternating crops, including legumes and grasses whose roots add organic matter), cover crops (plants grown between main crops so the soil is never bare) and zero tillage (sowing seed directly into the stubble of the previous crop without ploughing). Each keeps more carbon in roots and residues and slows decomposition, so the soil can act as a sink.
Longer timescales matter too. A timber plantation or an orchard stores carbon in wood for decades, unlike an annual crop that is harvested within months. What happens to the harvest is part of the budget: timber used in buildings keeps its carbon for the life of the building, while crops eaten or burned return their carbon to the atmosphere within a year.
Practice | Effect on soil carbon | Store, sink or source? |
|---|---|---|
Repeated deep ploughing | Faster aerobic decomposition; erosion | Source |
Draining peat or wetland for crops or plantations | Oxidation of peat; fire risk | Large source |
Monoculture with bare soil between crops | Little organic matter returned; erosion | Source |
Zero tillage | Less disturbance and decomposition | Sink (size debated) |
Cover crops and crop rotation with legumes | More roots and residues added | Sink |
Long-lived timber or tree crops | Carbon held in wood for decades | Sink, then store at maturity |
Large areas of lowland Sumatra and Kalimantan in Indonesia are peat swamp forest, a huge carbon store. Much of it has been drained and cleared for oil palm and other plantations. In the El Niño drought of 2015, fires on dried-out peat burned for weeks: they released around 600 million tonnes of greenhouse gases, comparable with Germany’s annual emissions, and on 26 of 44 days from early September their daily emissions exceeded the average daily emissions of the whole United States economy.
Sources: Global Fire Emissions Database and World Resources Institute, via Wikipedia, “2015 Southeast Asian haze” (2026).
Soil carbon sequestration is attractive because it also improves soil fertility, water retention and resistance to erosion. Its limits are real, however. Soils approach a new equilibrium after a few decades and then stop gaining carbon; the carbon can be lost again if the land is ploughed; and measuring small changes in soil carbon across a whole farm is difficult and expensive. Studies disagree on how much carbon zero tillage stores, partly because it can move carbon nearer the surface rather than increasing the total in the whole soil profile.
Carbon dioxide dissolves in seawater, and it also comes out of solution and returns to the air. Where the air holds more CO₂ than the surface water is in balance with, the gas dissolves; where the water holds more, it is released. Cold water dissolves more gas than warm water, so the cold oceans of high latitudes take up CO₂ and the warm tropical oceans release some of it.
Once dissolved, CO₂ reacts with water to form hydrogencarbonate and carbonate ions, which is why the ocean can hold so much more carbon than the atmosphere. Some of this carbon is carried to the deep ocean by sinking cold water, where it can stay for hundreds of years. Phytoplankton also take up dissolved CO₂ by photosynthesis; when they and the animals that eat them die, part of their organic carbon sinks into deep water and sediments.
Because the concentration of CO₂ in the air has risen, the ocean as a whole now absorbs more than it releases: it is a net sink. It took up about 2.9 GtC per year on average between 2014 and 2023, roughly a quarter of human emissions. The oceans cannot absorb carbon as fast as fossil fuel combustion releases it, because only the surface layer is in direct contact with the air and mixing into the deep ocean is slow.
Sources: Friedlingstein et al., Global Carbon Budget 2024 (2025).
The carbon dioxide absorbed by the ocean does not simply stay as dissolved gas. Some of it reacts with water to form carbonic acid, which releases hydrogen ions (H⁺). The more hydrogen ions there are, the lower the pH. This gradual fall in the pH of seawater is called ocean acidification.
CO₂ from the atmosphere dissolves in surface seawater.
Dissolved CO₂ reacts with water to form carbonic acid (H₂CO₃).
Carbonic acid splits into a hydrogen ion (H⁺) and a hydrogencarbonate ion (HCO₃⁻), so the pH falls.
Many of the extra hydrogen ions combine with carbonate ions (CO₃²⁻) already in the water, turning them into hydrogencarbonate. The concentration of carbonate ions therefore falls.
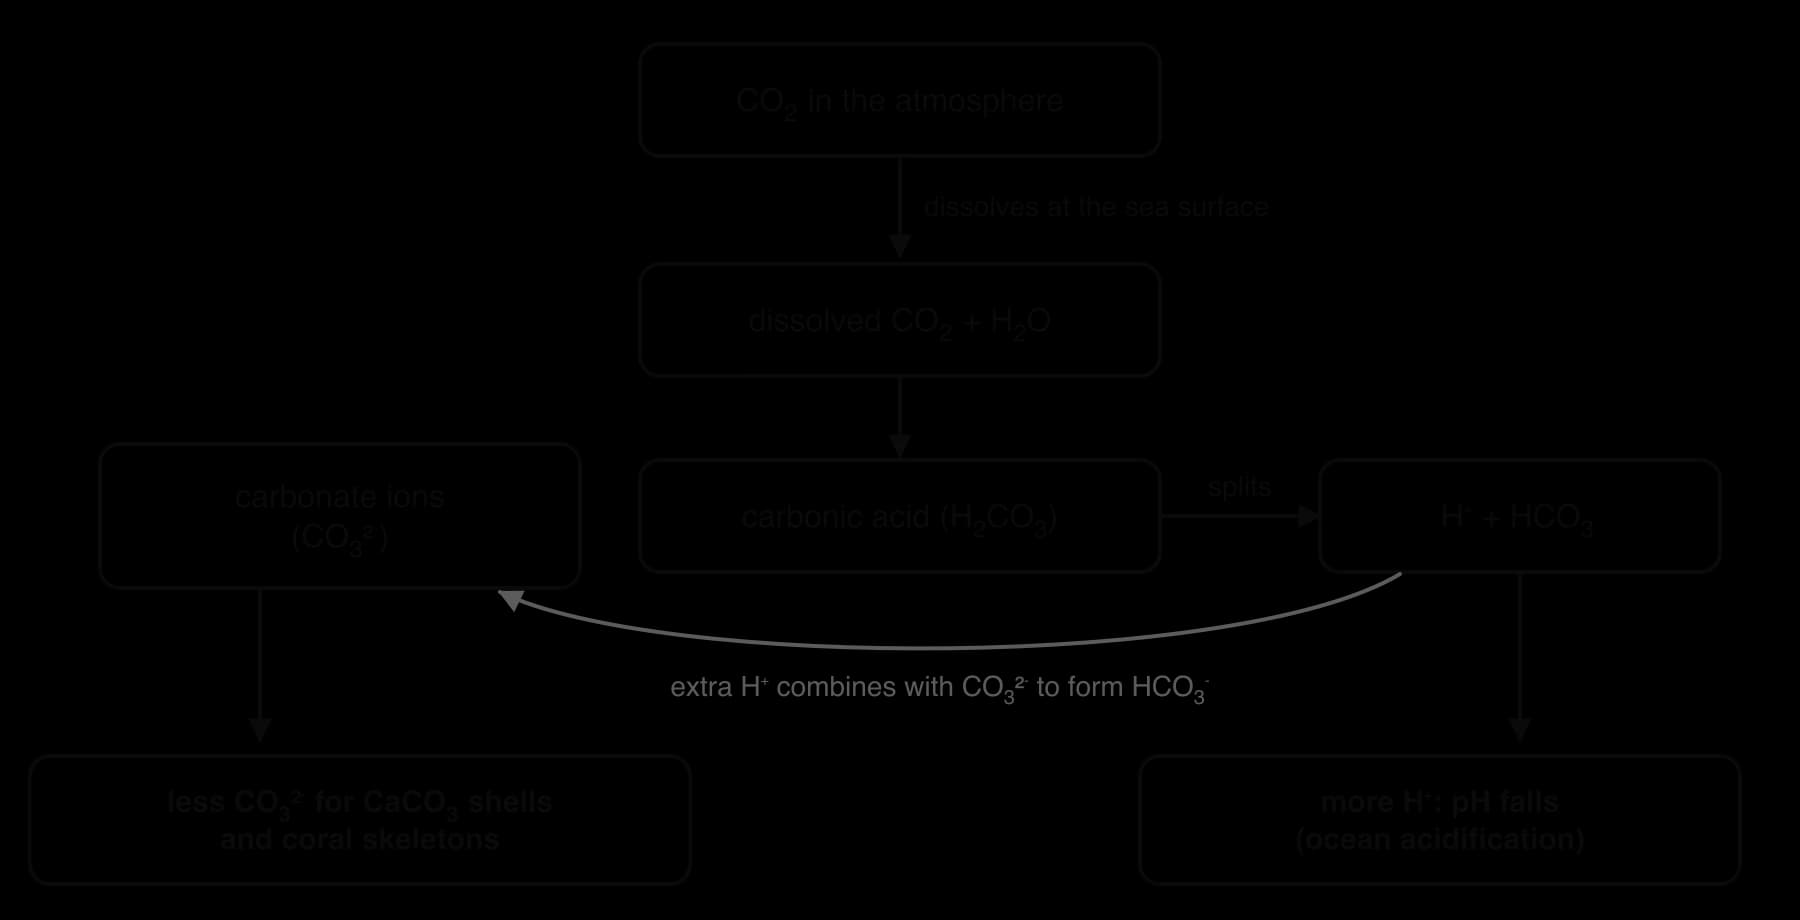
Surface ocean pH has fallen by about 0.1 units since pre-industrial times, from about 8.17 in 1850 to about 8.08 in 2021. Because the pH scale is logarithmic, a fall of 0.1 means about 26% more hydrogen ions. In the open subtropical oceans, the pH has been falling by about 0.016–0.019 units per decade since the 1980s.
Sources: IPCC AR6 Working Group I, Chapter 5 (2021); NASA Earth Observatory, “The Carbon Cycle” (2011, updated 2026); Wikipedia, “Ocean acidification” (2026).
Corals, molluscs (such as oysters, mussels, clams and the tiny swimming sea snails called pteropods), echinoderms such as sea urchins, coralline algae and some plankton build hard parts from calcium carbonate. This process, calcification, uses calcium ions and carbonate ions from seawater. When carbonate ions become scarcer, building shells and skeletons takes more energy, growth slows, and in the most corrosive water existing shells begin to dissolve.
The youngest stages are the most vulnerable, because larvae must build their first shell within hours or days. Reef-building corals lay down their skeletons more slowly, so reefs grow less and are more easily eroded, which also weakens their recovery after coral bleaching. Since many of these organisms are near the base of food webs or build habitats used by other species, the effects spread through marine ecosystems and to the fisheries and tourism that depend on them.
The Whiskey Creek shellfish hatchery in Netarts Bay, Oregon, supplied about 75% of the young oysters used in Pacific oyster farming on the west coast of the United States. In 2006 its larvae suffered up to 80% mortality, and heavy losses continued. By 2008 the die-offs were linked to periods of strong coastal upwelling, which brought CO₂-rich, corrosive water from depth to the surface. The hatchery installed monitoring equipment to avoid drawing in this water while the larvae formed their shells, and production recovered from 25% of historical levels in 2008 to 60–70% in 2012.
Sources: Kelly et al., “Narratives can motivate environmental action: the Whiskey Creek ocean acidification story”, _Ambio (2014)._
The planetary boundaries model measures ocean acidification by the saturation state of aragonite, the form of calcium carbonate used by corals and many molluscs: the higher the value, the easier it is to build shells. The boundary is set at 80% of the pre-industrial value, which recent reconstructions put at about 3.58, giving a boundary of 2.86. The 2025 Planetary Health Check estimated the current global value at 2.84, so ocean acidification became the seventh of the nine boundaries judged to have been crossed; the 2026 check confirmed it, at 2.85.
Sources: Potsdam Institute for Climate Impact Research, _Planetary Health Check 2025 and 2026; Wikipedia, “Planetary boundaries” (2026)._
Human activities have turned the fossil fuel store and many forests and soils into sources, while the atmosphere and the oceans have become sinks for the extra carbon. Measures to reduce these effects work in one of three ways: they reduce the flow from human sources, they protect existing stores so they do not become sources, or they increase the flow into sinks. The policies, laws and costs involved are part of climate change mitigation.
Measure | How it changes the carbon cycle | Example | Main limitation |
|---|---|---|---|
Low-carbon technologies (solar, wind, hydro, nuclear) | Reduce combustion of fossil fuels, the largest source | Renewables generated about 34% of the world’s electricity in 2025 | Intermittency, storage, materials and land use; electricity is only part of energy use |
Reducing fossil fuel use (efficiency, public transport, less demand) | Reduces the flow from the fossil store to the atmosphere | Building insulation, electric public transport | Depends on behaviour and investment; rebound effects |
Reducing deforestation | Protects a large store from becoming a source | Enforcement and the Soy Moratorium in the Brazilian Amazon | Enforcement depends on politics; pressure moves to other regions |
Reducing soil disruption | Keeps soil carbon in the store; can make soil a sink | Zero tillage, cover crops, protecting peat | Gains level off; easily reversed |
Reforestation and afforestation | Creates a new sink while trees grow | Restoring degraded tropical forest | Needs land; carbon lost again if forest burns |
Artificial sequestration (carbon capture and storage) | Moves carbon into a geological store | Sleipner gas field, Norway: CO₂ injected into rock about 1,000 m below the North Sea bed since 1996, over 13 million tonnes by 2011 | Expensive and energy-hungry; small scale so far |
Sources: Our World in Data, share of electricity from renewables (2026); Wikipedia, “Sleipner gas field” (2026).
No single measure is enough: cutting fossil fuel use is the only one that addresses the largest source, while the others protect stores or enlarge sinks. Removal methods such as reforestation, afforestation, carbon capture and storage and direct air capture are compared in detail in the study of climate change mitigation.
Perspective | Preferred measures | Reasoning |
|---|---|---|
Technocentric | Carbon capture and storage, direct air capture, new nuclear and renewable technology | Human ingenuity can solve the problem without large changes to lifestyles or growth. |
Anthropocentric | Carbon pricing, efficiency standards, managed reforestation and sustainable farming | Humans should manage the cycle carefully so that natural systems keep providing benefits for people now and in the future. |
Ecocentric | Protecting intact forests, peat and oceans, lower consumption, regenerative farming | Natural systems have value in themselves; the safest solution is to stop damaging them and to use less. |
Each view has a weakness. Technological removal is still far smaller than emissions; market and management approaches can be weakened by lobbying or poor enforcement; and large cuts in consumption are hard to achieve quickly in societies whose wealth depends on energy use. Low-income countries with small emissions also argue that the countries that have emitted most for longest should act first and pay most, an argument about environmental justice.
The Amazon basin holds the largest tropical rainforest on Earth, most of it in Brazil. Its trees and their roots hold about 123 billion tonnes of carbon, roughly a seventh of the carbon in the whole atmosphere. As a system, the forest has an input of carbon from photosynthesis and outputs through the respiration of trees, animals and decomposers, through fire and, since the 1970s, through clearing for farmland.
For most of the late twentieth century, measurements in undisturbed plots showed that the intact forest was a net carbon sink: its trees were growing slightly larger each year, taking up more carbon than they lost. The forest also recycles its own water: evapotranspiration from the forest supplies an estimated 25–35% of the region’s rainfall, so the loss of trees affects the regional climate as well as the carbon store.
Clearing accelerated with road building and settlement from the 1970s. Most cleared land in Brazil has become cattle pasture, with soy and other crops expanding onto older pasture and cleared land. Over the past 40–50 years about 17% of the forest in Amazonia has been lost, and about 89% of the converted land is pasture. Cattle ranching is responsible for about 80% of deforestation in the Brazilian Amazon.
Clearing usually means cutting the trees and burning them in the dry season, which turns the carbon in wood directly into CO₂. The edges of cleared areas become hotter and drier, trees there die more often, and fires escape into neighbouring forest. Selective logging opens the canopy, letting the forest floor dry out and burn more easily, so part of the remaining store also becomes a source.
Between 2010 and 2018, Brazilian scientists flew small aircraft upwards from near the ground through the lower atmosphere above four sites across Amazonia, taking 590 vertical profiles of carbon dioxide and carbon monoxide. Carbon monoxide comes mainly from fires, so it allowed the researchers to separate fire emissions from the uptake or release by the forest itself. Their results, published in 2021, showed that Amazonia as a whole was a net source of carbon.
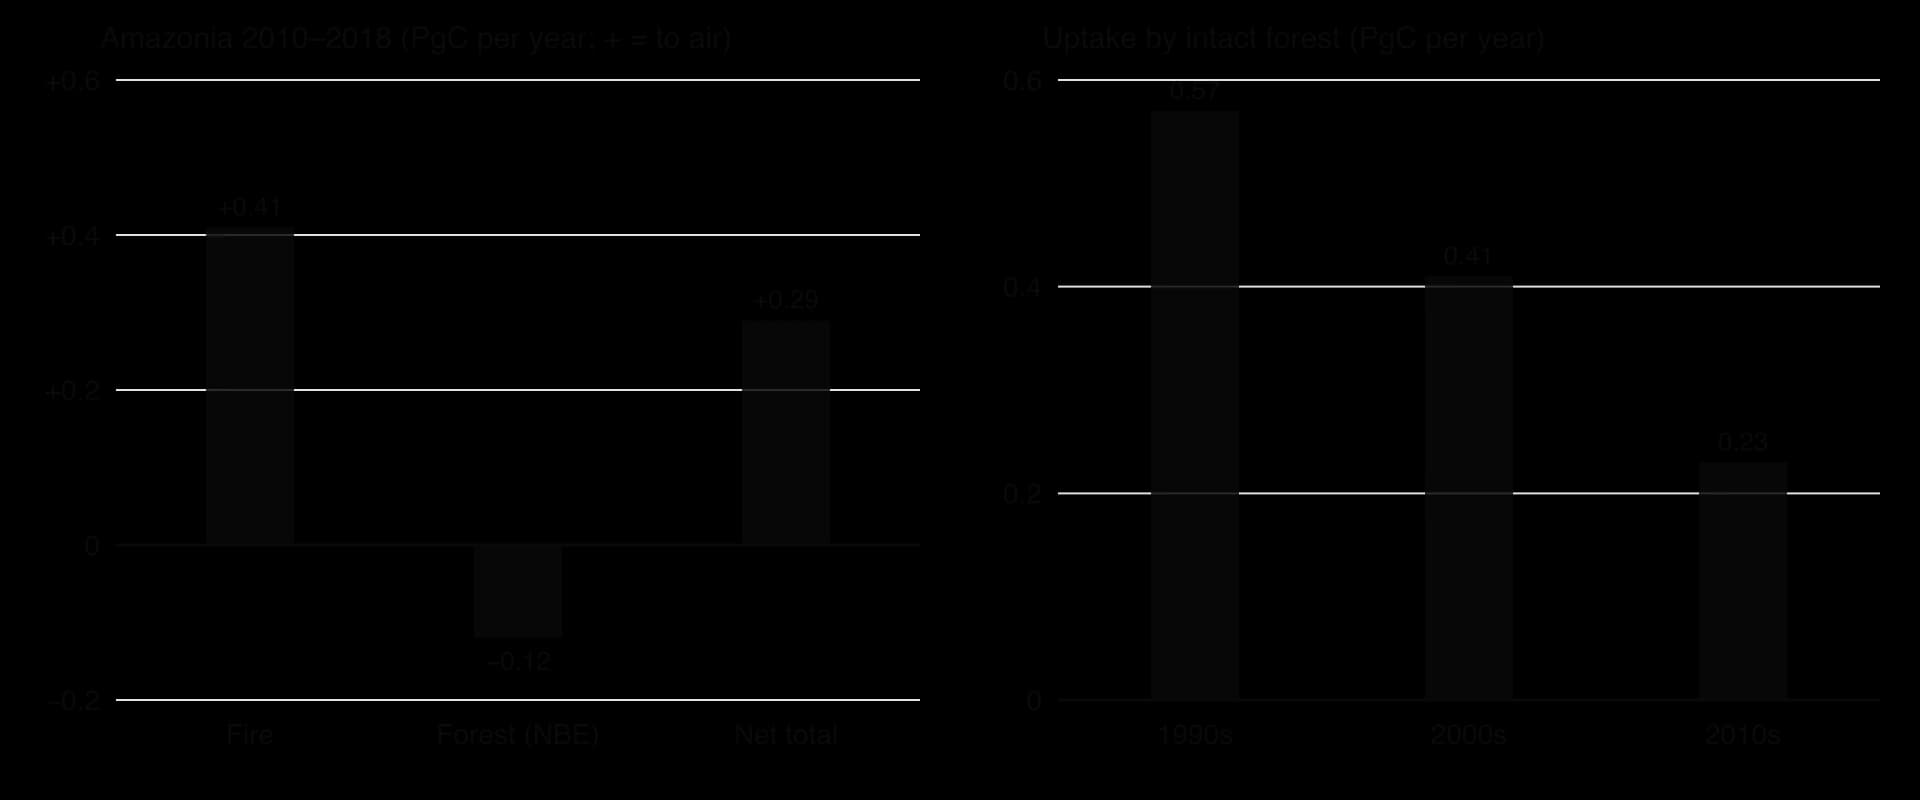
The picture differs across the basin. The south-east, where deforestation, warming and drying of the dry season have been greatest, was a net source even when fire emissions were left out: its remaining forest released more carbon than it took up. The less disturbed north-west was still close to balance. The intact-forest sink measured in forest plots across the basin fell from about 0.57 PgC per year in the 1990s to 0.41 in the 2000s and 0.23 in the 2010s, as tree deaths increased.
Sources: Gatti et al., “Amazonia as a carbon source linked to deforestation and climate change”, _Nature 595 (2021)._
The uncertainty in the total (±0.40 PgC per year) is larger than the value itself, so the conclusion that the whole basin is a source is not certain. The direction of change is clearer: the parts of the forest that have been cleared, degraded and dried the most have moved from sink to source, which is the sequence predicted by the store–sink–source model.
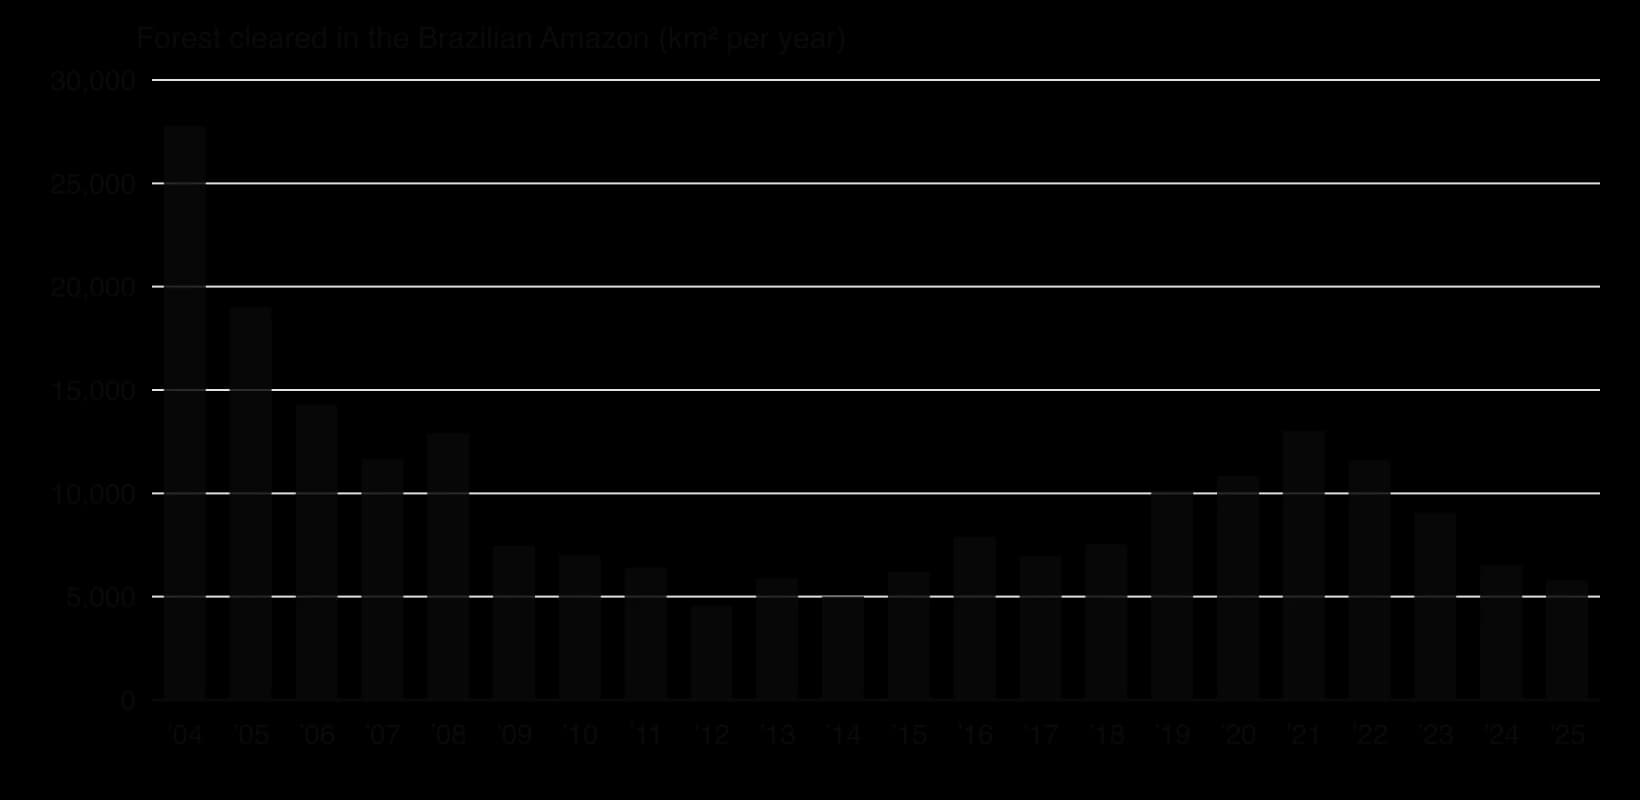
Enforcement and monitoring (from 2004): Brazil used near-real-time satellite alerts from its space research institute, INPE, to target inspections and fines, created protected areas and recognised Indigenous territories. Annual clearing fell from 27,772 km² in 2004 to 4,571 km² in 2012.
The Soy Moratorium (2006): major soy traders agreed not to buy soy grown on recently deforested land in the Brazilian Amazon. Before it, about 30% of soy expansion came at the expense of forest; eight years later, soy area had grown by 1.3 million hectares but only about 1% of that expansion replaced forest.
The Amazon Fund (2008): a fund managed by Brazil’s development bank, BNDES, paid for projects that reduce deforestation, with donations tied to measured results. Norway pledged US$1 billion in 2008, and Germany also contributed.
Weakened enforcement (2019–2022): funding and staff for environmental agencies were cut and laws weakened; Norway and Germany suspended payments to the Amazon Fund in 2019, and clearing reached 13,038 km² in the year to July 2021, the highest since 2006.
Renewed action (from 2023): enforcement was rebuilt, Norway and Germany agreed to resume funding the Amazon Fund and other countries pledged money, and annual clearing fell to an estimated 5,796 km² in 2025, the lowest since 2014.
Sources: INPE PRODES technical notes (2020–2025); Wikipedia, “Deforestation of the Amazon rainforest” and “Amazon Fund” (2026).
Stakeholder | Interest | Effect on the carbon cycle |
|---|---|---|
Cattle ranchers and soy farmers | Income and land; beef and soy are important exports | Clearing converts a store into a source; pasture holds far less carbon than forest |
Brazilian federal governments | Economic development, national sovereignty over the forest, international reputation | Enforcement has cut clearing sharply when funded and backed politically, and failed when weakened |
Indigenous peoples | Land rights, livelihoods and culture tied to the forest | Indigenous territories cover over a third of the Amazon but had only about 8% of its deforestation up to 2015; clearing inside them rose by 129% between 2013 and 2021 |
Importing countries and companies | Cheap commodities; pressure from consumers | Market agreements such as the Soy Moratorium reduce the incentive to clear |
Scientists | Understanding and avoiding a tipping point in the forest | Warn that further clearing and drying could turn large parts of the forest permanently into a source |
The record shows that a carbon store as large as the Amazon can be protected when monitoring, enforcement, market pressure and international funding work together. Clearing fell by more than 80% in the eight years after 2004. The same record shows how fragile these gains are: they depend on political will, and a few years of weak enforcement were enough to raise the rate of clearing by about 70% between 2018 and 2021.
From an ecocentric perspective, the forest has value in itself and as home to Indigenous peoples, so protection should not depend on carbon payments. A more anthropocentric view stresses the services the forest provides, including carbon storage and the rainfall it recycles, and supports paying landowners and governments to keep it standing. Ranchers and some governments argue that developed countries cleared their own forests long ago and should not restrict Brazil’s use of its land; this is an argument about fairness between nations as well as about carbon.
The Moratorium itself has limits. It covers soy, not cattle, which cause most clearing, and it applies only to the Amazon, so pressure can move to other ecosystems. Clearing figures also measure forest that is removed, not forest that is degraded by logging, edge effects and fire, so falling deforestation can hide a continuing loss of carbon, as the aircraft data showed for the south-east.
The Amazon shows every key idea about carbon stores in one system. An intact, mature forest is a huge store close to equilibrium; regrowing forest is a sink; clearing and fire turn it into a source; and climate change, through hotter and longer dry seasons, can tip even uncleared forest towards a net release. It also shows that the carbon cycle is managed through people and institutions: the flows of carbon changed when laws, markets and governments changed.
Sources: Gatti et al., _Nature (2021); INPE PRODES (2025); Wikipedia, “Deforestation of the Amazon rainforest” and “Amazon Fund” (2026)._
The fast carbon cycle moves carbon between the atmosphere, oceans, soils and living things over days to centuries. Beneath it runs a slow cycle in which carbon enters and leaves the rocks of the lithosphere. Its flows are tiny, about 10–100 million tonnes of carbon a year compared with thousands of millions of tonnes in the fast cycle, but its stores are by far the largest on Earth, and carbon takes about 100–200 million years to complete it.
Sources: NASA Earth Observatory, “The Carbon Cycle” (2011, updated 2026).

Reef-building corals, molluscs and many kinds of plankton, such as coccolithophores and foraminifera, build their hard parts from calcium carbonate, using dissolved calcium and carbonate ions. When they die, their shells and skeletons settle on the sea floor. Over millions of years these layers are buried, compacted and cemented into limestone, locking away the carbon they contain. Carbon in limestone can remain there for millions to hundreds of millions of years, until the rock is lifted up and weathered or carried down into the Earth and released by volcanoes.
Estimates of how much carbon these rocks hold differ widely, depending on which rocks are counted and how. A widely cited estimate for all sedimentary carbonate rocks is more than 60 million billion tonnes of carbon, over a thousand times the carbon in the oceans. NASA gives a far lower figure, about 65,500 billion tonnes, for the carbon in rocks. Even the lower figure is larger than all the other carbon stores combined, which is why limestone and other carbonate rocks are described as the largest carbon store.
Sources: Falkowski et al., _Science (2000); NASA Earth Observatory, “The Carbon Cycle” (2011, updated 2026); IPCC AR6 Working Group I, Figure 5.12 (2021)._
Not all limestone comes from living things: calcium carbonate can also form when it precipitates directly out of seawater. The biological route, however, is the main way carbonate is laid down in today’s oceans, which is why reefs and shell-building plankton are part of the carbon cycle as well as of marine ecosystems.
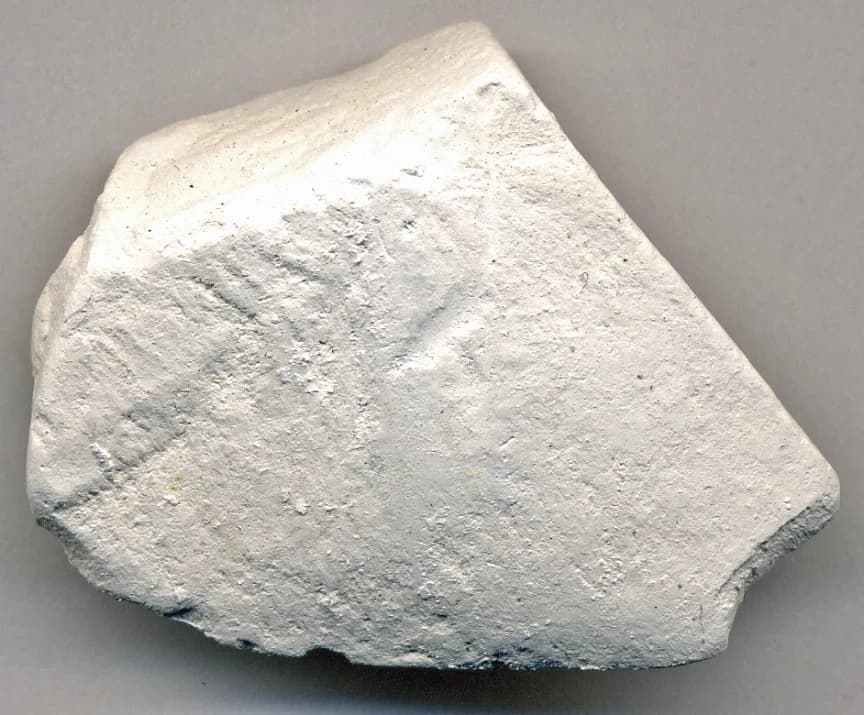
The White Cliffs of Dover rise to about 110 m above the English Channel. The chalk built up on the floor of a deep sea at only about half a millimetre a year, reaching hundreds of metres in thickness, and was later lifted above sea level by the same earth movements that formed the Alps. Each cliff is a carbon store laid down by plankton and kept out of the atmosphere for tens of millions of years.
Sources: Wikipedia, “White cliffs of Dover” (2026).
Fossil fuels formed from organic matter that was buried before decomposers could break it down. This happened where conditions were anaerobic, so aerobic decomposition was slow or stopped, and where sediment covered the remains quickly. Formation was greatest in particular geological eras when these conditions were widespread, and building up a significant store took tens of millions of years.
Fuel | Original organisms | Conditions of formation | Where it is stored |
|---|---|---|---|
Coal | Land plants, especially in swamp forests | Partly decomposed plant matter accumulated as peat in waterlogged swamps, then was buried and compressed | Seams within sedimentary rock |
Crude oil and natural gas | Marine plankton and other microscopic organisms | Remains settled on low-oxygen sea floors, were buried in mud and slowly altered by heat and pressure | Pores in rocks such as sandstone and limestone, trapped beneath impermeable rock |
A modern peat bog shows the first step of this process today: waterlogged, acidic and anaerobic conditions slow decomposition so much that plant remains build up faster than they decay. Most peat will never become coal, because that needs deep burial and millions of years, but it shows why oxygen supply controls how much carbon an ecosystem can store.
Methane (CH₄) is the simplest compound of carbon and hydrogen. It is a small store of carbon compared with carbon dioxide, but it matters because it is a far more potent greenhouse gas per molecule. Most of the methane released by natural ecosystems and by farming is made by microorganisms.
Methanogens are single-celled microorganisms that cannot survive in oxygen. They live where other decomposers have used up the oxygen, and they obtain energy by producing methane from the simple compounds left over when organic matter is broken down. Wherever organic matter decays without oxygen, methane is released instead of, or as well as, carbon dioxide.
Swamps, bogs and other wetlands: waterlogged soils and sediments are anaerobic just below the surface. Natural wetlands are the largest single source of methane.
Rice paddies: flooded fields create the same conditions as a swamp, and the rice plants supply organic matter to the soil.
Ruminants: cattle, sheep, goats and buffalo have a stomach chamber (the rumen) in which microorganisms ferment grass without oxygen. Methanogens in the rumen produce methane, which the animals breathe out and belch. This is called enteric fermentation.
Landfills and waste: buried food and garden waste decays without oxygen.
Termites: microorganisms in their guts digest wood anaerobically.
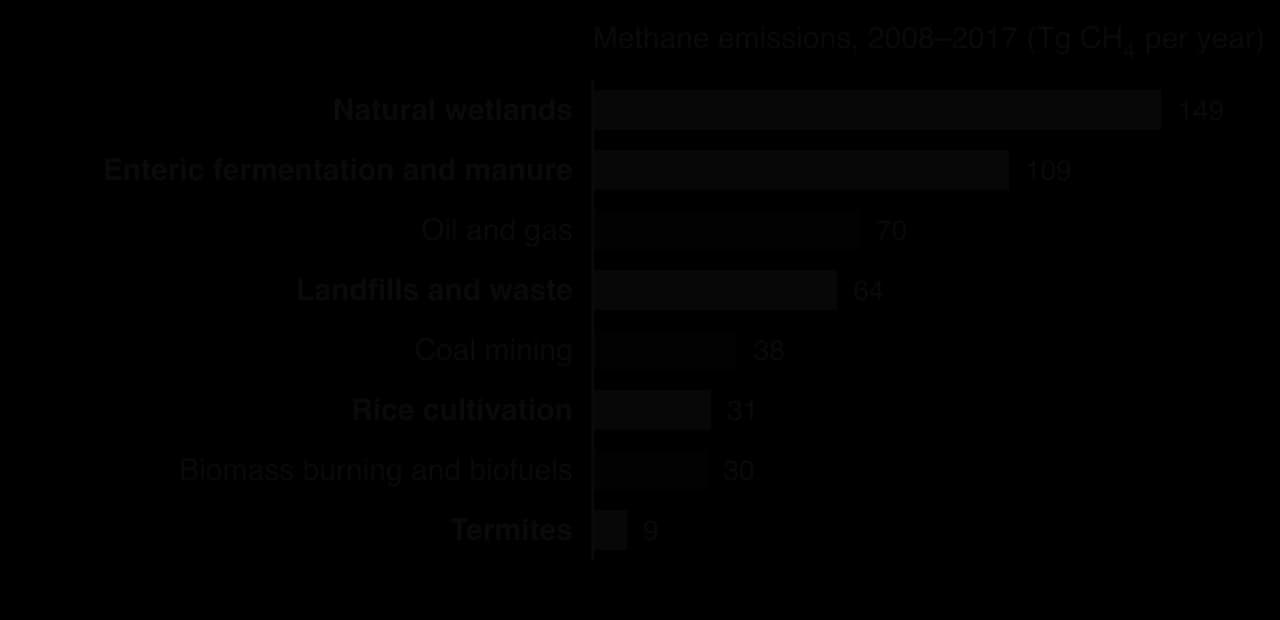
Not all methane is biological. Natural gas is mostly methane, so leaks from oil and gas wells, pipelines and coal mines are large sources too. Over the past two centuries, methane emissions have nearly doubled, mainly because of human activity.
Methane does not stay in the atmosphere for long. Its average residence time is about 9–10 years: about 90% of it is destroyed in the lower atmosphere by reaction with hydroxyl radicals (OH), and about 5% is taken up by bacteria in the soil. A lifetime of about 12 years is also quoted; that figure describes how long an extra pulse of methane takes to decay, which is slightly longer because added methane slows its own removal. In these reactions methane is oxidised to carbon dioxide and water, so its carbon rejoins the main carbon cycle as CO₂.
Sources: IPCC AR6 Working Group I, Chapter 5 (2021): steady-state lifetime 9.1 ± 0.9 years.
The short residence time has an important consequence. If methane emissions are cut, its concentration falls within about a decade, whereas extra carbon dioxide remains for centuries. Cutting methane is therefore one of the quickest ways to slow warming in the near term, although the CO₂ it eventually forms still adds to the long-term store in the atmosphere.
Measure | How it works | Evidence and limits |
|---|---|---|
Alternate wetting and drying of rice | Fields are drained for a few days at a time, so oxygen enters the soil and methanogenesis stops | Cuts seasonal methane by about half on average (up to 85% in some studies) and can save about 38% of irrigation water without lowering yields; farmers need reliable control of water and training |
Feed additives such as 3-NOP (Bovaer) | Blocks the enzyme methanogens use in the final step of making methane in the rumen | Cuts methane from dairy cows by about 30%; approved in the EU (2022) and USA (2024); a 2024 UK trial met consumer boycott calls |
Eating less ruminant meat and dairy | Fewer ruminants, so less enteric fermentation | Large potential; depends on culture, diets and farmers’ livelihoods |
Capturing landfill gas or digesting waste | Methane is collected and burned for energy instead of escaping | Turns CH₄ into CO₂ and replaces some fossil fuel; needs investment |
Sources: Wikipedia, “Alternate wetting and drying” and “3-Nitrooxypropanol” (2026).
Nitrogen is an essential part of proteins, DNA and chlorophyll, so every organism needs a supply of it. The atmosphere is about 78% nitrogen gas (N₂), but in this form nitrogen is almost useless to most living things: its two atoms are held by a triple bond that very few organisms can break. The nitrogen cycle is therefore mostly about converting nitrogen between this unreactive gas and the reactive forms that plants can absorb.
Store | Form of nitrogen | Organic or inorganic |
|---|---|---|
Organisms (producers, consumers, decomposers) | Proteins, DNA and other nitrogen-containing carbon compounds | Organic |
Dead organic matter (litter, faeces, urine, dead bodies) | Proteins, amino acids, urea | Organic |
Atmosphere | Nitrogen gas (N₂); small amounts of other nitrogen gases | Inorganic |
Soil and water | Ammonia (NH₃) and ammonium (NH₄⁺), nitrite (NO₂⁻) and nitrate (NO₃⁻) | Inorganic |
The atmosphere is by far the largest store, but it is available to living things only after nitrogen fixation. Plants take up nitrogen mainly as nitrate, and to a lesser extent as ammonium, through their roots. Animals obtain all their nitrogen by eating plants or other animals.
Four groups of bacteria carry out the key transformations. Each changes the chemical form of nitrogen, so each is a transformation in a systems diagram.
Nitrogen-fixing bacteria include free-living species in soil and water, cyanobacteria, and species that live inside the roots of particular plants, such as Rhizobium in the root nodules of legumes. Fixation needs a great deal of energy, which symbiotic bacteria obtain from the sugars supplied by their host plant.
Nitrification needs oxygen, so it takes place in well-aerated soils and water. The nitrate it produces is the main form in which plants take up nitrogen, but it is also very soluble and easily washed away.
Decomposers complete the cycle. When organisms die, or excrete urine and faeces, bacteria and fungi break down the proteins and amino acids in the dead organic matter and release the nitrogen as ammonium. This step is called ammonification. Nitrifying bacteria then convert the ammonium and the intermediate nitrite into nitrate, which plants can absorb again.
Process | Bacteria involved | Conversion | Conditions |
|---|---|---|---|
Nitrogen fixation | Free-living soil bacteria; Rhizobium in legume nodules; cyanobacteria | N₂ → ammonia (NH₃/NH₄⁺) | Needs a lot of energy |
Decomposition (ammonification) | Decomposers (bacteria and fungi) | Proteins and amino acids → ammonium (NH₄⁺) | Most soils |
Nitrification | Nitrifying bacteria (Nitrosomonas, Nitrobacter) | NH₄⁺ → nitrite (NO₂⁻) → nitrate (NO₃⁻) | Aerobic: needs oxygen |
Denitrification | Denitrifying bacteria (e.g. Pseudomonas) | NO₃⁻ → nitrogen gas (N₂) | Anaerobic: waterlogged soils, sediments |
The flows of the nitrogen cycle can be sorted in the same way as those of the carbon cycle. Mineral uptake by producers, consumption, excretion and death move nitrogen from one store to another without changing its form, so they are transfers. Fixation, ammonification, nitrification and denitrification change its chemical form, so they are transformations. Inside the plant, photosynthesis supplies the carbon compounds into which absorbed nitrate is built to make amino acids and proteins, another transformation.
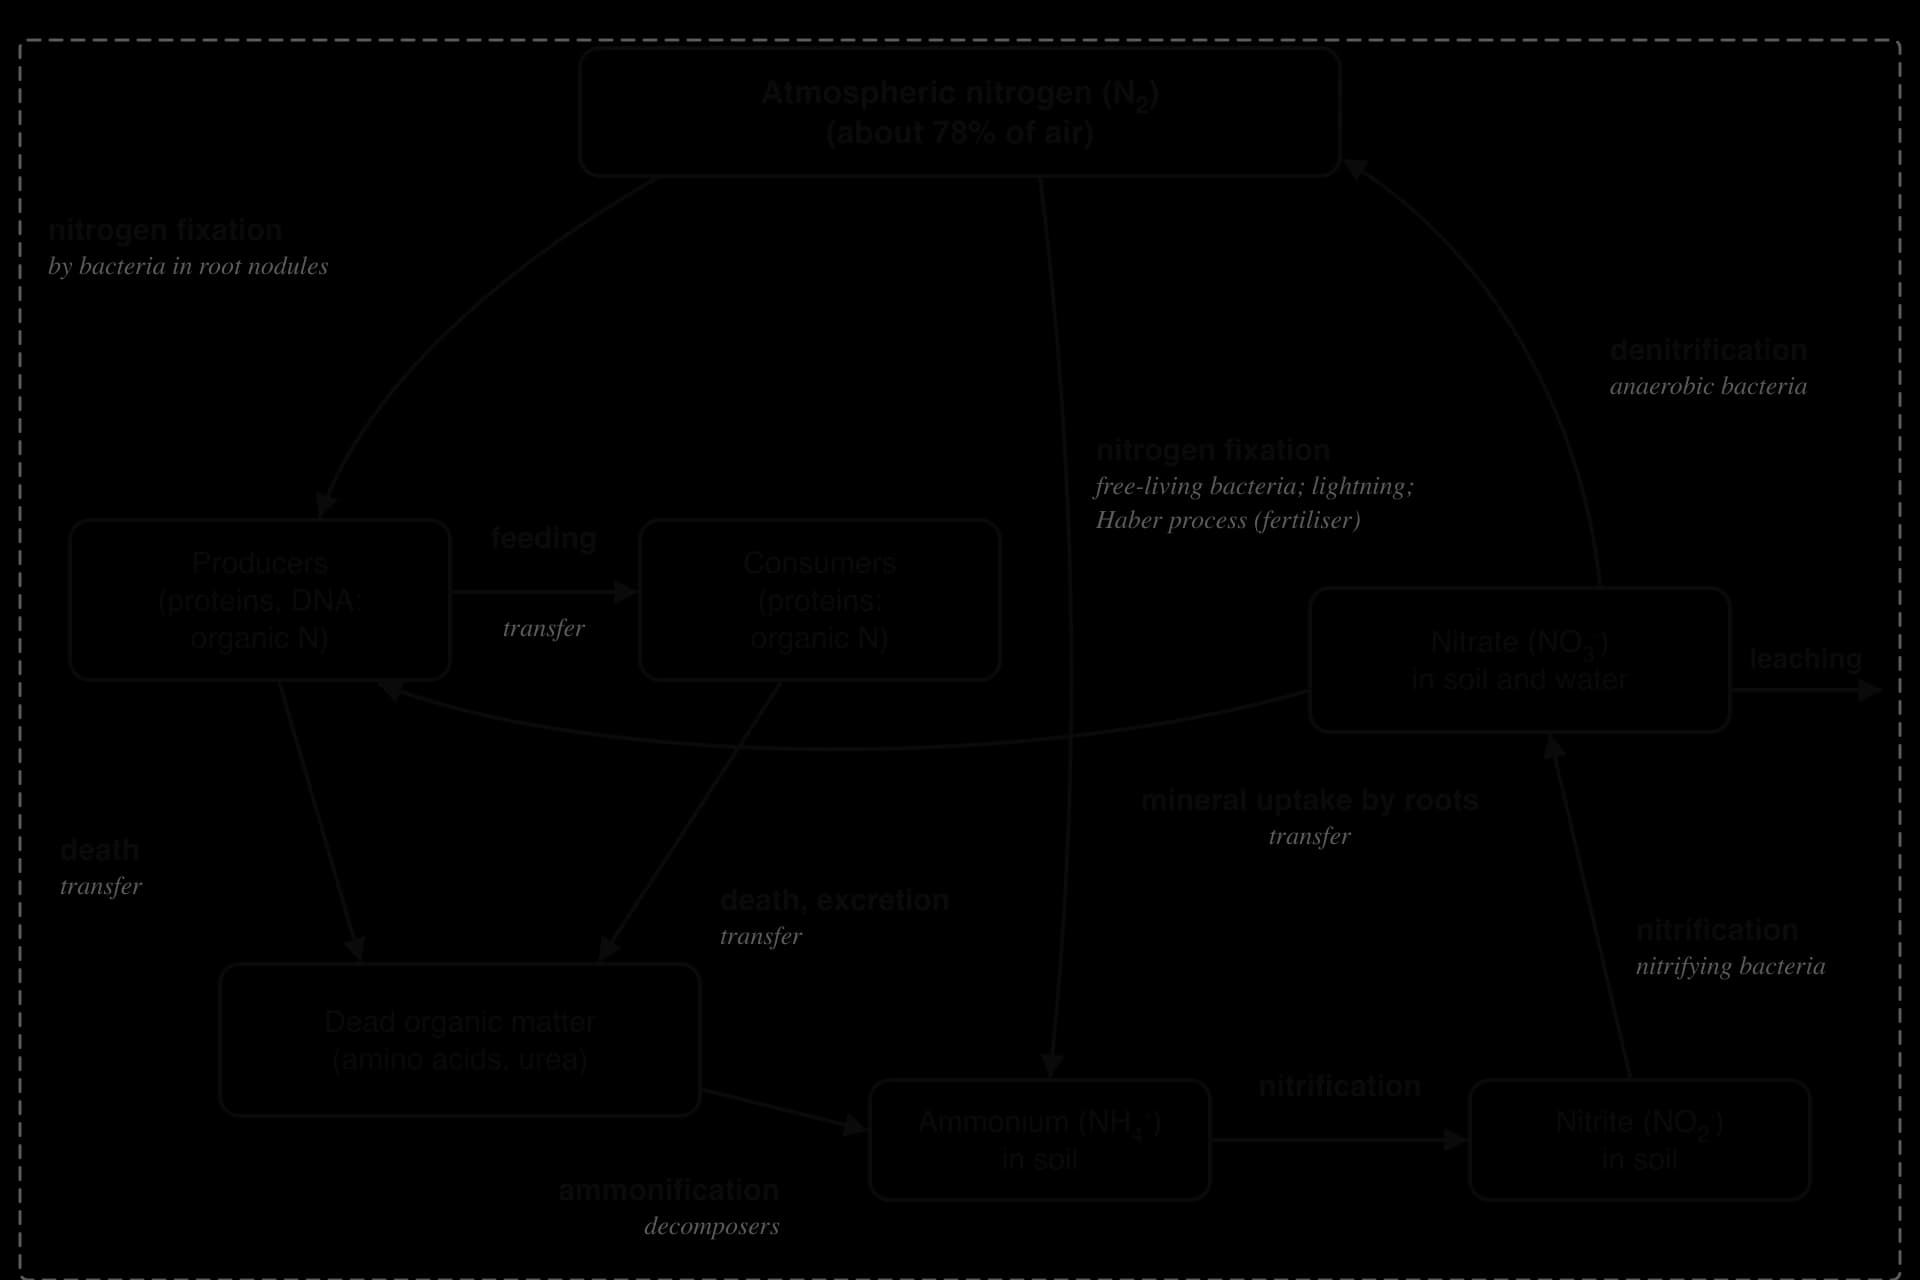
Flow | Transfer or transformation | Why |
|---|---|---|
Mineral uptake of nitrate and ammonium by roots | Transfer | Nitrate moves from the soil into the plant unchanged |
Consumption (feeding) | Transfer | Proteins move from prey to consumer |
Excretion and death | Transfer | Organic nitrogen moves to the dead organic matter store |
Leaching | Transfer | Nitrate is carried by water out of the soil into groundwater and rivers |
Assimilation into proteins (using the products of photosynthesis) | Transformation | Inorganic nitrate becomes organic nitrogen |
Nitrogen fixation, ammonification, nitrification, denitrification | Transformation | The chemical form of nitrogen changes |
 YouTube
Denitrification only happens where oxygen is absent, because denitrifying bacteria use nitrate only when there is no oxygen for respiration. In waterlogged soils, such as bogs, marshes and flooded fields, water fills the spaces between soil particles and oxygen cannot diffuse in. Denitrifying bacteria convert much of the nitrate to nitrogen gas, and the rest is easily washed out of the soil by leaching. Nitrifying bacteria, which need oxygen, are inhibited, so little new nitrate is made.
Waterlogged soils are therefore very poor in usable nitrogen, and plant growth is slow or stopped. Some plants have adapted by obtaining nitrogen from animals. Insectivorous plants such as pitcher plants, which drown insects in a pool of digestive fluid inside a modified leaf, and sundews, which trap them on sticky hairs, digest their prey and absorb the nitrogen released. They are typical of bogs, where most other plants struggle.
No plant can fix nitrogen on its own. Some have instead formed a mutualism with nitrogen-fixing bacteria: the bacteria live in root nodules, swellings that the plant grows on its roots, where they receive sugars and a low-oxygen environment, and in return supply the plant with ammonium.
Legumes (the pea and bean family: clover, peas, beans, lentils, soya, lupins, acacias) with Rhizobium bacteria.
Alders (Alnus) and several other trees and shrubs with Frankia bacteria, which can supply most or all of the host’s nitrogen.
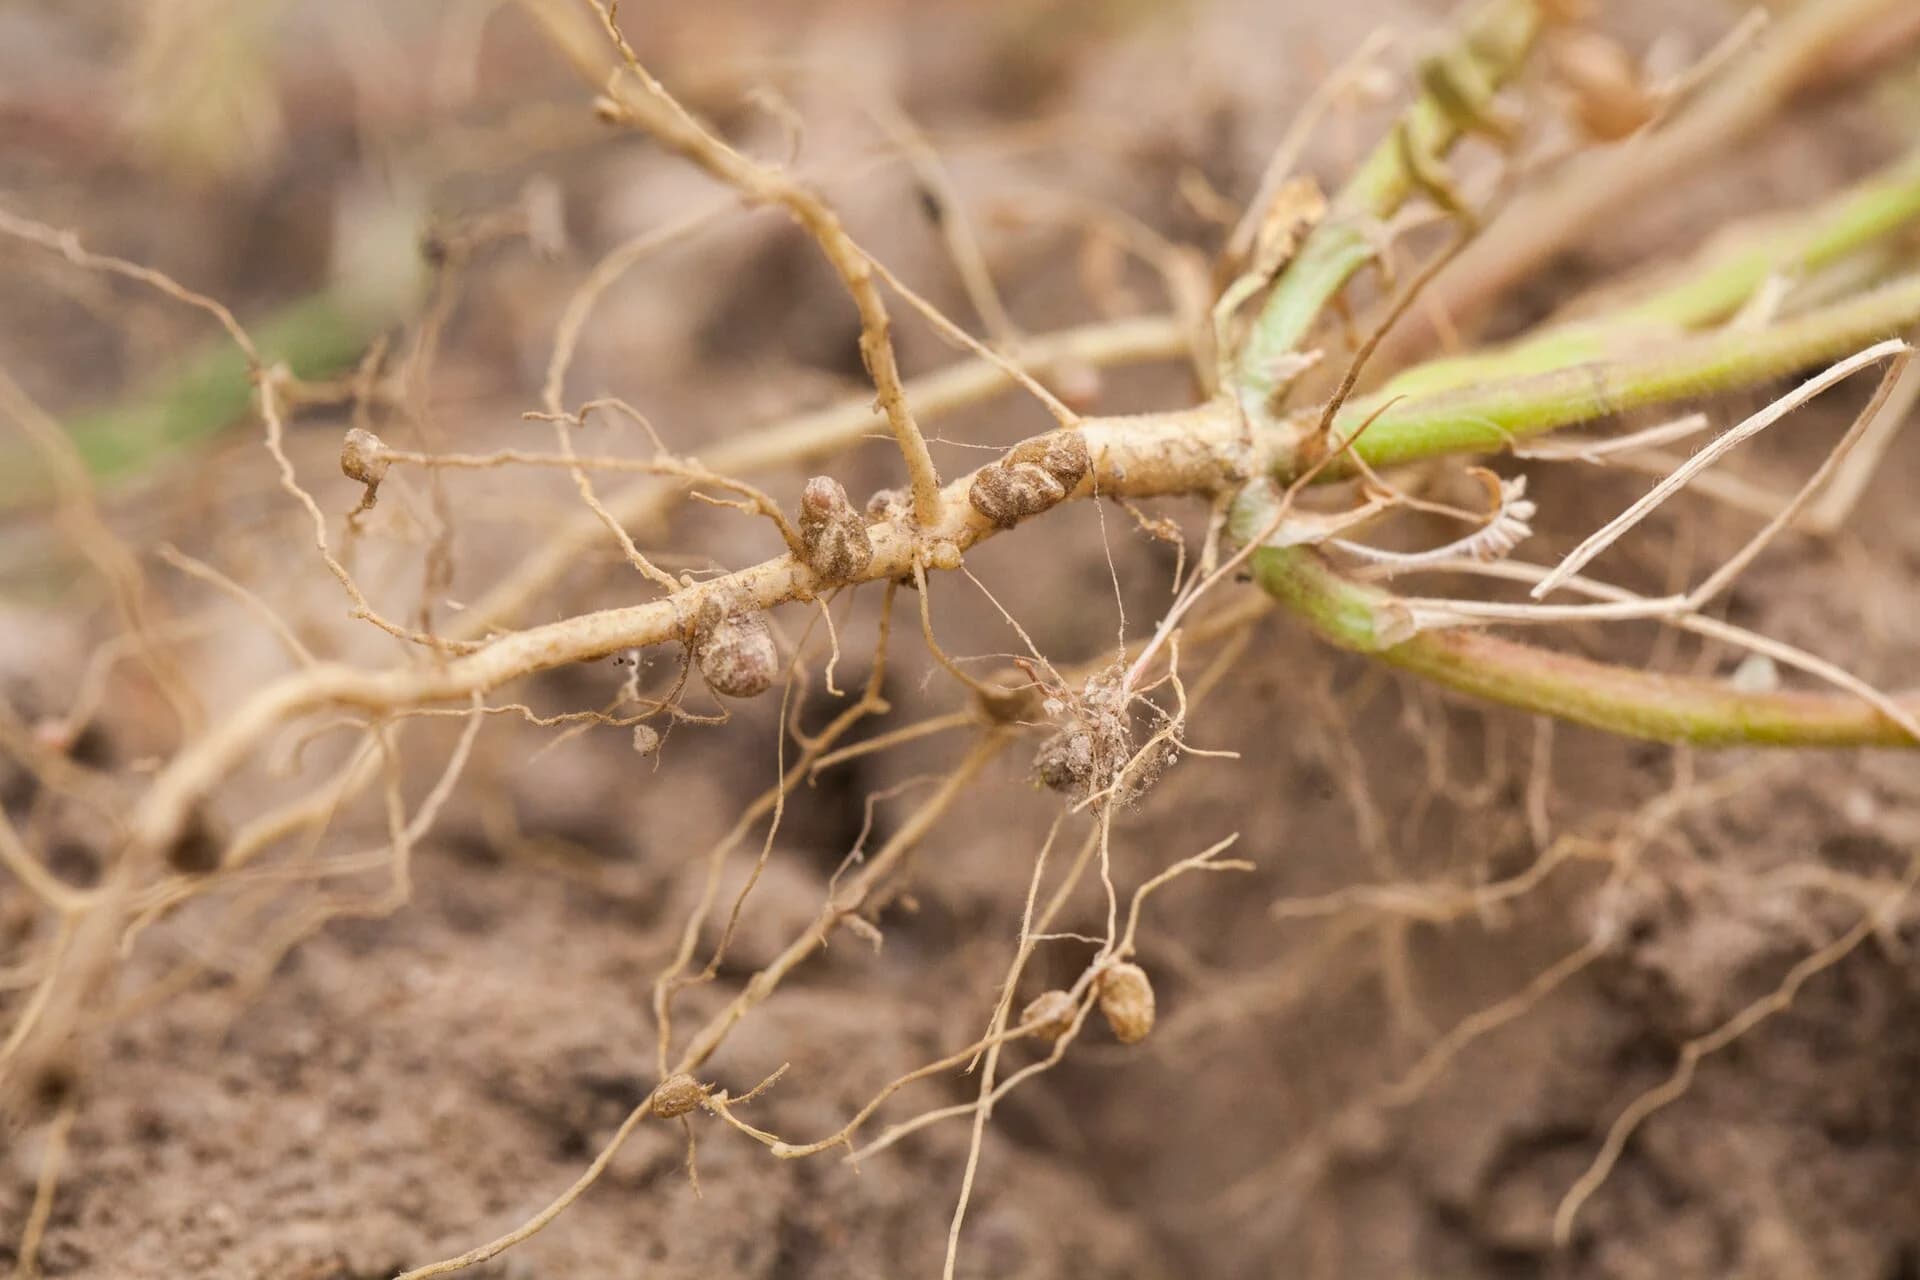
Where nitrogen limits growth, these plants have a strong competitive advantage, because they are not dependent on the small amounts of nitrate in the soil. They are often pioneer species on bare ground. After the 1980 eruption of Mount St Helens in Washington State, USA, the prairie lupine (Lupinus lepidus) and Sitka alder (Alnus viridis) were among the nitrogen-fixing pioneers on the new volcanic surfaces, and the soils beneath alder thickets became richer in nutrients and organic matter. Studies there also found that later trees did not always follow quickly, because dry conditions and other factors still limited them: adding nitrogen helps succession but does not guarantee it.
Sources: Titus, _Plant Ecology (2009); Titus and Bishop, Journal of Vegetation Science (2014)._
Farmers have used the same mutualism for thousands of years, by growing legumes in rotation with cereals or ploughing clover into the soil as green manure, so that the next crop benefits from the nitrogen fixed.
Human activity | Change to the nitrogen cycle | Consequence |
|---|---|---|
Deforestation | Removes the plants that take up nitrate; burning releases nitrogen gases; bare soil is leached and eroded | Nitrate lost from the soil into rivers; soil fertility falls, which is one reason cleared tropical land soon loses productivity |
Agriculture | Adds large amounts of fixed nitrogen as synthetic fertiliser and manure; legumes add biologically fixed nitrogen; harvests remove nitrogen from fields | Often less than half of applied nitrogen is taken up by crops; the rest is leached as nitrate or lost to the air as ammonia and nitrous oxide, a greenhouse gas |
Aquaculture | Fish and shrimp farms add uneaten feed and animal wastes rich in ammonium to the water | Nutrient enrichment of coastal waters and lakes, oxygen depletion near farms |
Urbanisation | Concentrates human food waste and sewage; impervious surfaces speed run-off; vehicles and power stations make nitrogen oxides | Nitrogen in sewage reaches rivers; nitrogen oxides add to air pollution and are deposited on land and water |
When nitrate leaches from farmland into rivers, lakes and coastal seas, it causes eutrophication. Phytoplankton grow rapidly, and when they die their decomposition uses up dissolved oxygen. The Mississippi River drains about 41% of the continental United States, including much of its farmland, and its nitrate creates a large dead zone in the Gulf of Mexico each summer; the largest measured, in 2017, covered more than 22,700 km².
Sources: Wikipedia, “Dead zone (ecology)” (2026).
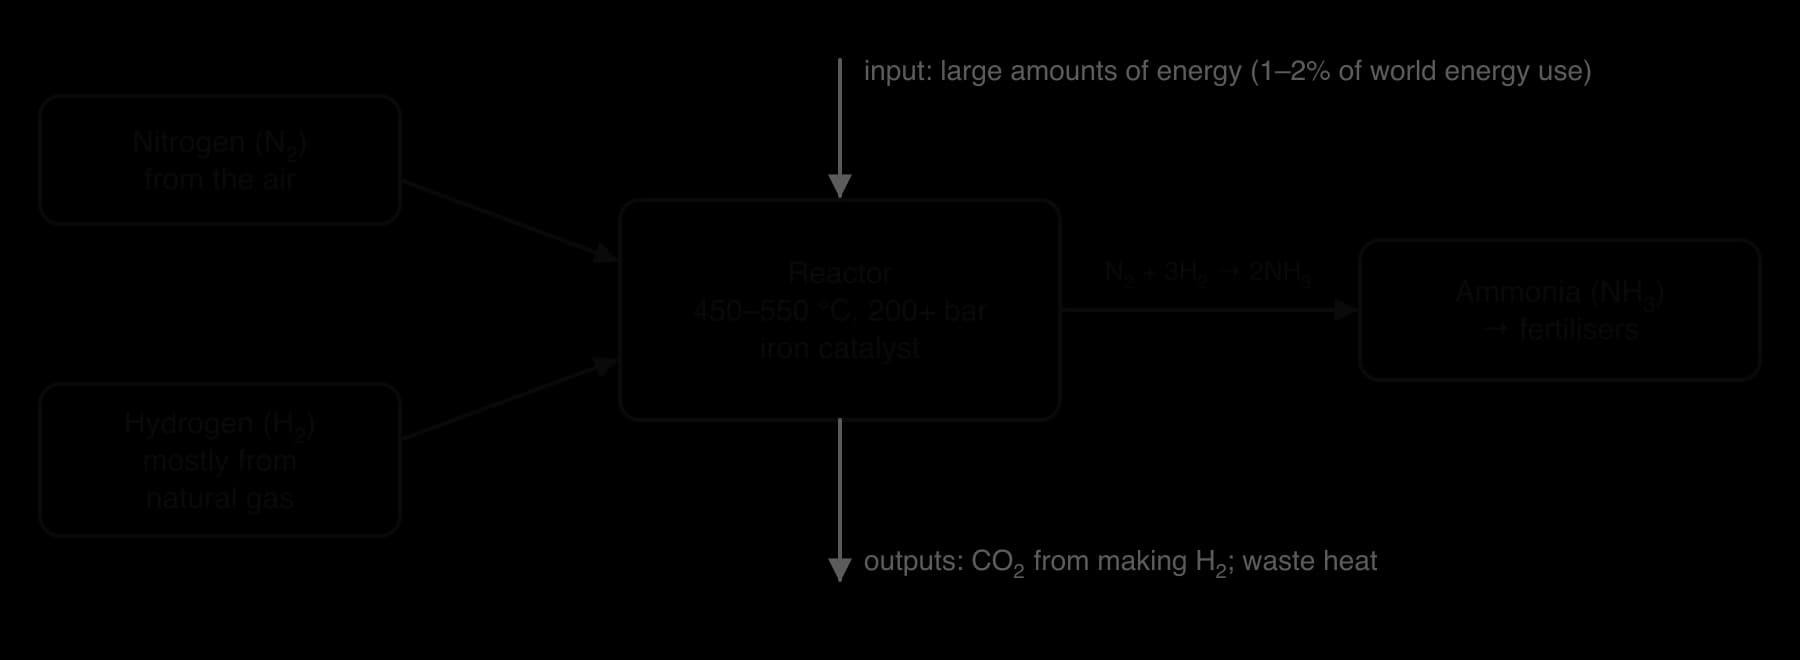
The process was developed by Fritz Haber and Carl Bosch, and ammonia was first made on an industrial scale in 1913 at the BASF plant at Oppau in Germany. Its overall reaction is N₂ + 3H₂ → 2NH₃. The ammonia is used mainly to make nitrogen fertilisers such as ammonium nitrate and urea. In 2018 about 230 million tonnes of ammonia were produced.
Advantages for crop yield and food supply | Disadvantages |
|---|---|
Removes nitrogen as a limiting factor, so crop yields per hectare rise greatly | Uses about 1–2% of the world’s energy and produces about 3% of global carbon emissions |
Supports a far larger human population: nearly half the nitrogen in human bodies today has passed through the Haber process | Most hydrogen comes from natural gas (or coal), so fertiliser prices and supply depend on fossil fuels |
Allowed the high-yielding crops of the Green Revolution to be grown widely | Less than half of applied nitrogen is typically used by the crop; the rest pollutes water (eutrophication, dead zones) and air |
Less land is needed to grow the same amount of food, which can spare forest from clearing | Nitrous oxide from fertilised soils adds to global warming; ammonia and nitrate deposition reduce biodiversity in nitrogen-poor ecosystems |
Sources: Wikipedia, “Haber process” (2026).
In the planetary boundaries model, nitrogen is one part of the boundary for biogeochemical flows. It is measured by the amount of nitrogen gas that humans deliberately convert into reactive forms each year, mainly through the Haber process and the growing of legume crops. The boundary is set at about 62 million tonnes (Tg) of nitrogen a year; the 2025 and 2026 Planetary Health Checks both estimated the current value at about 165 Tg N a year, more than two and a half times the boundary.

The evidence for crossing the boundary comes from the effects of reactive nitrogen in the environment: hundreds of coastal dead zones, rising nitrate in groundwater used for drinking, the loss of plant species adapted to nitrogen-poor soils, and the steady rise in atmospheric nitrous oxide, of which agriculture is the largest human source. Global dependence on synthetic fertilisers is the main cause. Because these changes accumulate in groundwater, soils and sediments, and can tip lakes and coastal seas into new states, some of their effects are likely to be irreversible on human timescales.
The boundary also raises questions of fairness. Nitrogen use is very uneven: some farming regions apply far more than crops can use, while many farmers in sub-Saharan Africa use too little fertiliser to feed their families, and their soils are being depleted of nitrogen. Bringing the cycle back within the boundary therefore means using less where there is excess and, in some places, more where there is too little.
Nitrogen pollution crosses borders through rivers, the air and international trade in food and fertiliser, so no country can solve it alone. In March 2019, the fourth UN Environment Assembly adopted a resolution on sustainable nitrogen management. In October 2019, governments meeting in Colombo, Sri Lanka, adopted the Colombo Declaration, endorsed by more than 30 countries, with the ambition to halve nitrogen waste by 2030. The declaration was prepared with technical support from the International Nitrogen Management System, a joint scientific programme of UNEP and the International Nitrogen Initiative supported by the Global Environment Facility.
Sources: Global Environment Facility, “Colombo Declaration calls for tackling global nitrogen challenge” (2019).
Level | Measures to bring nitrogen use back within the boundary |
|---|---|
Farm | Precision application (right amount, right time, right place); cover crops and legumes in rotation; better use of manure; buffer strips of vegetation along rivers |
National | Limits on fertiliser use in vulnerable catchments; sewage treatment that removes nitrogen; emission standards for vehicles and power stations; removing subsidies that encourage over-use; taxes on surplus nitrogen |
Global | Shared targets such as halving nitrogen waste; monitoring and data sharing; finance and technology for low-input farmers; diets with less meat in high-income countries, since livestock feed uses much of the world’s fertiliser |
The main obstacle is that nitrogen fertiliser is central to food security. Cutting its use too fast could reduce yields and raise food prices, which falls hardest on the poorest. A technocentric response emphasises precision farming, enhanced-efficiency fertilisers and green ammonia made with renewable hydrogen; an ecocentric response emphasises agroecology, legumes and lower meat consumption. Legal and economic tools, such as binding nitrate limits for water and taxes on nitrogen surpluses, show how law and economics can steer the cycle back towards a safe level.
Biogeochemical cycles appear in both papers. Paper 2 Section A often asks for a definition (sink, source, residence time), a labelled systems diagram, an explanation of a process such as ocean acidification, or a short calculation from a carbon budget. Paper 1 places the cycles in an unfamiliar ecosystem, such as a peatland, a mangrove coast or a farming region, and asks students to interpret data on stores and flows. Section B essays use the carbon cycle as evidence in questions on climate change, forests, farming and the oceans.
A longer explain question on ocean acidification:
The resource describes a coastal mangrove forest in a tropical estuary (hypothetical data). Part of the forest has been cleared for shrimp ponds.
Area | Carbon in vegetation (t C ha⁻¹) | Carbon in top 1 m of soil (t C ha⁻¹) | Net carbon flux (t C ha⁻¹ yr⁻¹; + = taken up) |
|---|---|---|---|
Intact mangrove | 150 | 500 | +2.0 |
Mangrove cleared 5 years ago for shrimp ponds | 5 | 320 | −30.0 |
Mangrove replanted 10 years ago | 60 | 480 | +6.0 |
Biogeochemical cycles move elements between organisms, the atmosphere, oceans and rocks, keeping them available to life; human activities now change several of these flows faster than natural processes can balance them.
A store holds an element; a sink shows net accumulation (inputs > outputs); a source shows net release (outputs > inputs).
Organic carbon is stored in organisms, dead organic matter and fossil fuels; inorganic carbon in the atmosphere, oceans, soils and rocks. Residence time is the average time an atom stays in a store.
Photosynthesis, respiration, decomposition and combustion are transformations; feeding, death, defecation and dissolving are transfers.
A young forest is a sink, a mature forest a store and a burned or cleared forest a source; farmland is a source or sink depending on tillage, drainage and cover.
Fossil fuels are stores formed by past sinks; burning them releases carbon faster than oceans and land can absorb it, so about half of emissions stay in the atmosphere.
Dissolved CO₂ lowers ocean pH and carbonate ion concentration, slowing calcification by corals and molluscs; the ocean acidification boundary was judged crossed in 2025.
Measures include low-carbon energy, less deforestation and soil disturbance, reforestation and artificial sequestration; the Amazon shows both success and reversal.
Limestone is the largest carbon store; coal formed from swamp plants and oil and gas from marine plankton, buried before full decay. (HL)
Methanogens produce methane in anaerobic conditions (wetlands, rice paddies, ruminants); methane lasts about 10 years before being oxidised to CO₂. (HL)
Bacteria drive the nitrogen cycle through fixation, ammonification, nitrification and denitrification; legumes and alders gain an advantage through nitrogen-fixing mutualisms. (HL)
The Haber process feeds billions but has pushed nitrogen fixation to about 165 Tg N a year against a boundary of 62, so global collaboration is needed. (HL)
I can outline how biogeochemical cycles keep elements available to living things.
I can distinguish a store, a sink and a source, with an example of each.
I can describe the main organic and inorganic carbon stores and calculate a residence time.
I can construct a carbon cycle systems diagram and label transfers and transformations.
I can explain how forests, farmland and oceans can be stores, sinks or sources, using the Amazon as evidence.
I can explain the chemistry of ocean acidification and its effect on calcifying organisms.
I can evaluate at least three measures to reduce human impacts on the carbon cycle.
I can explain how limestone and fossil fuels form and how methane is produced. (HL)
I can construct a nitrogen cycle systems diagram and explain the roles of bacteria. (HL)
I can evaluate the Haber process and the evidence that the nitrogen boundary is crossed. (HL)