Explain how energy flows and matter cycles through ecosystems, calculate productivity and transfer efficiency, construct pyramids, and explain how persistent pollutants such as DDT biomagnify up food chains.
Each is in the ESS glossary, with every other term in the subject.
An organism that synthesises its own organic compounds from inorganic carbon and other elements, using energy from light or from inorganic chemical reactions.
The increase in concentration of a persistent substance in an organism over its lifetime, because it is absorbed faster than it is broken down or excreted.
The increase in concentration of a persistent substance at each successive trophic level of a food chain, because biomass is lost in respiration while the substance is retained.
The mass of organic matter in an organism, population or trophic level, usually measured as dry mass per unit area, such as g m⁻² or kg m⁻².
The measurement of the energy content of a material by burning a dried sample completely, often in a bomb calorimeter, and measuring the heat released.
An animal that feeds mainly on other animals, as a secondary or higher consumer.
The process in all living cells that releases energy from glucose and other organic compounds for cell activities, producing carbon dioxide and water and losing some energy as heat.
Explain why ecosystems are open systems sustained by inputs of energy and matter, using the first and second laws of thermodynamics.
Outline the transformations of energy and matter in photosynthesis and cellular respiration, using word equations.
Describe the feeding strategies of consumers, with examples of herbivores, detritivores, predators, parasites, saprotrophs, scavengers and decomposers.
Construct food chains, food webs and systems diagrams of energy flow from data.
Explain why energy and biomass are lost along a food chain and why this limits the number of trophic levels.
Calculate gross and net productivity and the efficiency of energy transfer between trophic levels.
Construct pyramids of numbers, biomass and energy from data and explain why their shapes vary.
Explain how persistent pollutants such as DDT, PCBs, mercury and those carried on microplastics bioaccumulate and biomagnify.
Evaluate the effects of human activities on energy flows and matter transfers in ecosystems.
Distinguish between autotrophs and heterotrophs, and between photoautotrophs and chemoautotrophs. (HL)
Calculate primary and secondary productivity from field and laboratory data, and relate maximum sustainable yield to net productivity. (HL)
Explain ecological efficiency, the advantage of eating at lower trophic levels, and the increase in entropy as energy passes through ecosystems. (HL)
Every living thing needs a supply of energy to stay alive and a supply of matter to build its body. In almost every ecosystem, the energy arrives as sunlight, is captured by plants, algae and some bacteria, and then passes from organism to organism as food. The amount of energy that reaches each feeding level decides how many animals an ecosystem can support, why top predators are rare, and how much food people can harvest without damaging the system.
The official deck for this part of the syllabus.
What is an open system?
Explain why an ecosystem is an open system.
With a free account, Augment remembers where you stopped and what you have practiced.
An autotroph, usually a bacterium or archaeon, that makes organic compounds using energy released by exothermic inorganic chemical reactions rather than light.
The process by which chemoautotrophs make organic compounds from carbon dioxide using energy from oxidising inorganic substances such as hydrogen sulfide.
An organism that obtains its energy and carbon compounds by feeding on other organisms or their remains, rather than making its own food.
Dichlorodiphenyltrichloroethane, a persistent, fat-soluble organochlorine insecticide that biomagnifies in food chains; its breakdown product DDE causes eggshell thinning in birds of prey.
An organism, mainly a bacterium or fungus, that breaks down dead organic matter into inorganic substances, releasing nutrients back into the soil, water or air.
The breakdown of dead organic matter into simpler inorganic substances by decomposers and detritivores, which releases nutrients and carbon dioxide.
An animal that ingests dead organic matter such as fallen leaves, faeces and dead bodies, breaking it into smaller pieces, as earthworms and woodlice do.
The mass of a sample after all its water has been removed by drying to constant mass, used as a measure of the organic matter it contains.
The percentage of the energy received by one trophic level that is passed on to the next; typically 10% or less, but it varies between ecosystems, levels and species.
A diagram of stacked horizontal bars, one per trophic level, whose widths show the relative numbers, biomass or energy at each level.
The removal from the gut of undigested food that was never absorbed into the body, as faeces.
The one-way movement of energy through an ecosystem, entering mainly as sunlight, passing between trophic levels as chemical energy in food, and leaving as heat.
A systems diagram showing energy entering, passing between and leaving trophic levels, with arrows whose widths are often drawn in proportion to the size of each flow.
A measure of the disorder of a system and of how spread out its energy is; it increases in every energy transformation as energy is degraded to heat.
The physical law that energy can be transformed from one form to another but cannot be created or destroyed, so the total energy entering a system equals the total leaving or stored.
A sequence of organisms in which each feeds on the one before, showing the path of energy and biomass from a producer to higher consumers.
A network of interconnected food chains in an ecosystem, showing all the feeding relationships, including species that feed at more than one trophic level.
The total rate at which producers fix energy or carbon by photosynthesis or chemosynthesis per unit area per unit time, before respiratory losses.
The total gain in biomass or energy by an organism or trophic level per unit area per unit time, before any is lost in respiration.
The rate at which consumers absorb energy or biomass from food, equal to food ingested minus faecal losses, per unit area per unit time.
A method for estimating primary productivity on land by harvesting, drying and weighing the plant biomass in sample plots at intervals and calculating the gain per unit area per unit time.
An animal that feeds on living plants or algae, so it is a primary consumer.
An organism that cannot make its own organic compounds and obtains them by feeding on other organisms or their remains.
An opening in the sea floor, usually at a spreading ridge, from which hot, mineral-rich water emerges, supporting food webs based on chemosynthetic bacteria.
A method for measuring aquatic primary productivity by comparing the change in dissolved oxygen in clear and darkened bottles of water incubated together for a set time.
The largest harvest that can be taken from a population or trophic level every year without reducing its future availability, equal to its net productivity.
Plastic particles smaller than 5 mm, from broken-down plastic items or made small, which are eaten by many organisms and can carry adsorbed pollutants into food chains.
The rate at which producers store energy or biomass after their own respiratory losses, per unit area per unit time; NPP = GPP − R.
The gain in biomass or energy by an organism or trophic level per unit area per unit time that remains after respiratory losses; NP = GP − R.
The rate at which consumers store energy or biomass in new tissue after respiratory losses, per unit area per unit time; NSP = GSP − R.
Describes a substance that decomposers cannot break down, or break down only very slowly, so it persists in the environment for years.
An animal that feeds on both plants and animals, so it can occupy more than one trophic level.
A carbon compound made by living organisms, such as glucose, proteins and fats, that stores chemical energy and forms biomass.
A carbon-based chemical, such as DDT or PCBs, that resists breakdown, dissolves in fats, travels long distances and builds up in food chains.
An autotroph that uses light energy to make organic compounds by photosynthesis, such as a green plant, alga or cyanobacterium.
The process by which producers use light energy to convert carbon dioxide and water into glucose and oxygen, transforming light energy into chemical energy.
A group of persistent, fat-soluble industrial chemicals once used in electrical equipment, which biomagnify in food chains and harm the immune and reproductive systems of top predators.
A consumer that feeds on producers and so occupies the second trophic level, such as a herbivore.
The rate of production of biomass by autotrophs using an external energy source and inorganic carbon, per unit area per unit time, such as kg C m⁻² yr⁻¹.
An organism, such as a plant, alga or photosynthetic bacterium, that makes its own organic compounds from inorganic substances and forms the first trophic level.
The rate at which biomass or energy is gained by an organism, trophic level or ecosystem, per unit area per unit time.
An ecological pyramid showing the standing crop of biomass at each trophic level per unit area at one time, usually in g m⁻² of dry mass.
An ecological pyramid showing the energy flowing into each trophic level per unit area per unit time, usually in kJ m⁻² yr⁻¹; it is never inverted.
An ecological pyramid showing the number of individual organisms at each trophic level per unit area at one time.
The energy or biomass used in cellular respiration by an organism or trophic level and lost as heat, the R in NP = GP − R.
An organism, mainly a fungus or bacterium, that feeds by secreting digestive enzymes onto dead organic matter and absorbing the products.
An animal that feeds on the dead bodies of animals it has not killed itself, such as a vulture.
The physical law that every energy transformation degrades some energy into less useful forms, mainly heat, so no transformation is 100% efficient and entropy increases.
A consumer that feeds on primary consumers and so occupies the third trophic level.
The rate at which consumers gain biomass from carbon compounds absorbed and assimilated from the food they ingest, per unit area per unit time.
The management of forests and plantations to grow and harvest trees for timber, fuel and other products.
The biomass or number of organisms present in a trophic level or area at one particular time, as opposed to the rate at which it is produced.
The amount of a renewable resource that can be harvested per unit time without reducing the stock or its ability to provide the same yield in future.
A rough generalisation that about 10% of the energy at one trophic level passes to the next; real efficiencies vary widely, so it is neither fixed nor a true average.
A consumer that feeds on secondary consumers and so occupies the fourth trophic level.
The position an organism occupies in a food chain, counted by the number of feeding steps between it and the producers at the base.
Energy and biomass in ecosystems sit at the heart of the systems approach to the environment: an ecosystem can be drawn as storages of biomass linked by flows of energy and matter. The same ideas explain human choices, from the land needed to feed a population on beef rather than grain to the way some pesticides build up in the bodies of eagles and orcas. They therefore connect ecology to sustainability and to the different perspectives people bring to food, farming and pollution.
An ecosystem can be described like any other system, by its storages (such as the biomass of plants or of animals) and the flows between them. Ecologists distinguish two kinds of flow. A transfer moves energy or matter from one place to another without changing it, as when a zebra eats grass and the grass tissue moves into the zebra. A transformation changes its form, as when light energy becomes chemical energy in photosynthesis.
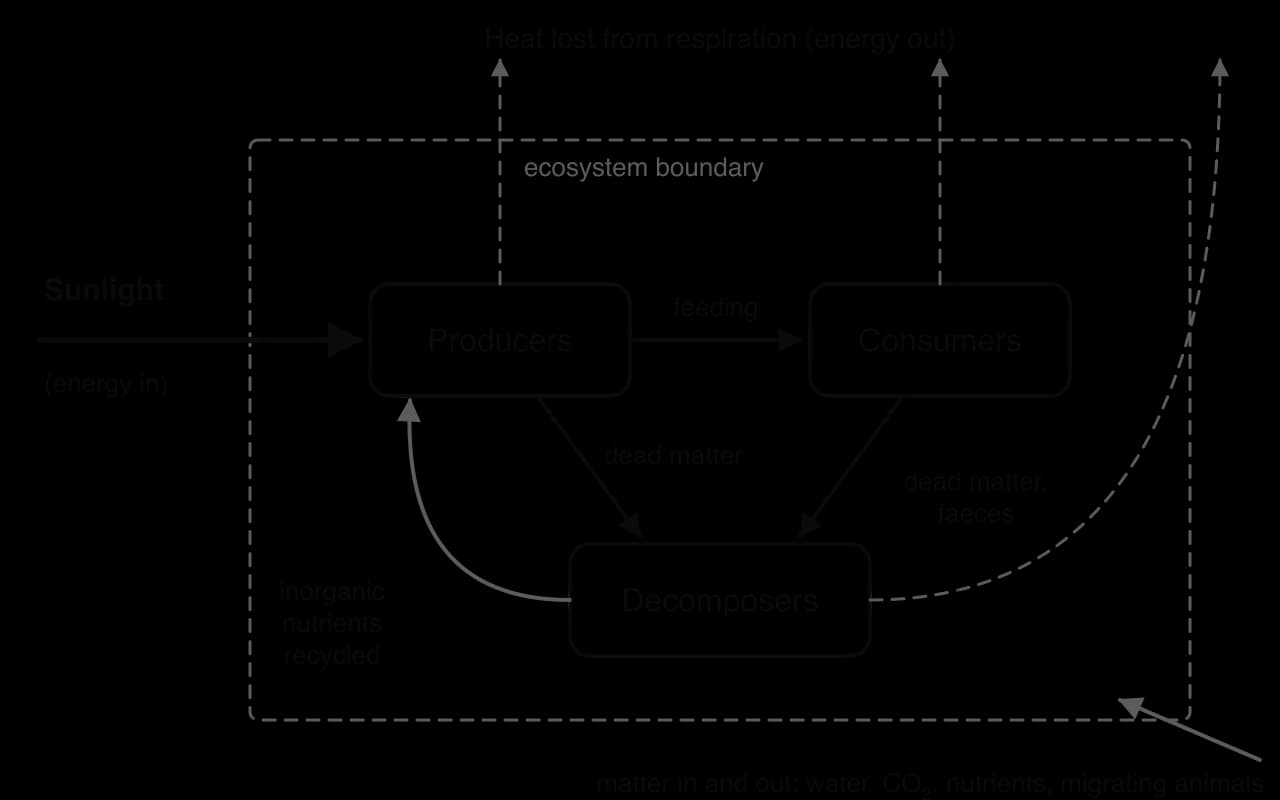
Ecosystems are open systems, sustained by supplies of both energy and matter that cross their boundaries: energy enters mainly as sunlight and leaves as heat, while water, gases, nutrients and migrating or harvested organisms move in and out. Inside the boundary, matter is recycled again and again by decomposers, but energy is not.
This difference between energy and matter is central to ecology. Matter can be reused: the carbon atom in a dead leaf can return to the air as carbon dioxide and be taken up again by another leaf. Energy cannot be reused in the same way, because each time it is transformed some of it becomes heat, which living things cannot turn back into food. An ecosystem therefore depends on a constant supply of new energy, while it can run for a very long time on the same atoms.
Two physical laws govern every energy change in an ecosystem. They were worked out by physicists studying steam engines, but they apply just as strictly to a leaf or a lion. Together they explain why food chains are short and why so much of the energy captured by plants never reaches an animal.
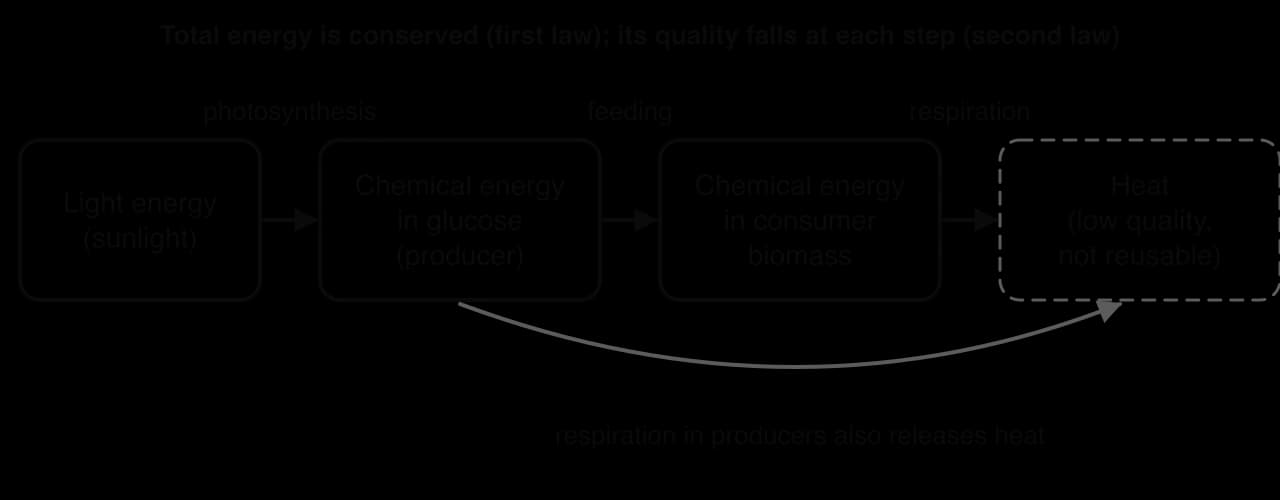
The first law of thermodynamics means that energy in an ecosystem can always be accounted for. Light energy absorbed by a leaf is transformed into chemical energy stored in sugar. When a caterpillar eats the leaf, that chemical energy is transferred to the caterpillar. When the caterpillar moves, the chemical energy is transformed into kinetic energy and finally into heat. At no point does energy appear from nowhere or vanish.
This is why ecologists can draw energy budgets. For any organism or trophic level, the energy taken in must equal the energy stored as new biomass plus the energy lost as heat and in waste. If 100 units of energy enter a trophic level and 10 units are stored as new biomass, then 90 units must have left in other forms.
The second law of thermodynamics is about the quality of energy rather than its amount. Light and chemical energy are concentrated, high-quality forms that can do useful work, such as building proteins or contracting muscles. Heat is a dispersed, low-quality form. Every time energy is transformed, part of it is degraded to heat, so the useful energy available after the transformation is always less than before.
In ecosystems the largest losses happen in cellular respiration, the process by which organisms release energy from food. A typical animal uses most of the energy it absorbs to stay alive (moving, keeping warm, repairing tissues, pumping blood), and almost all of this ends up as heat. Only a small fraction is stored in new body tissue that a predator could later eat.
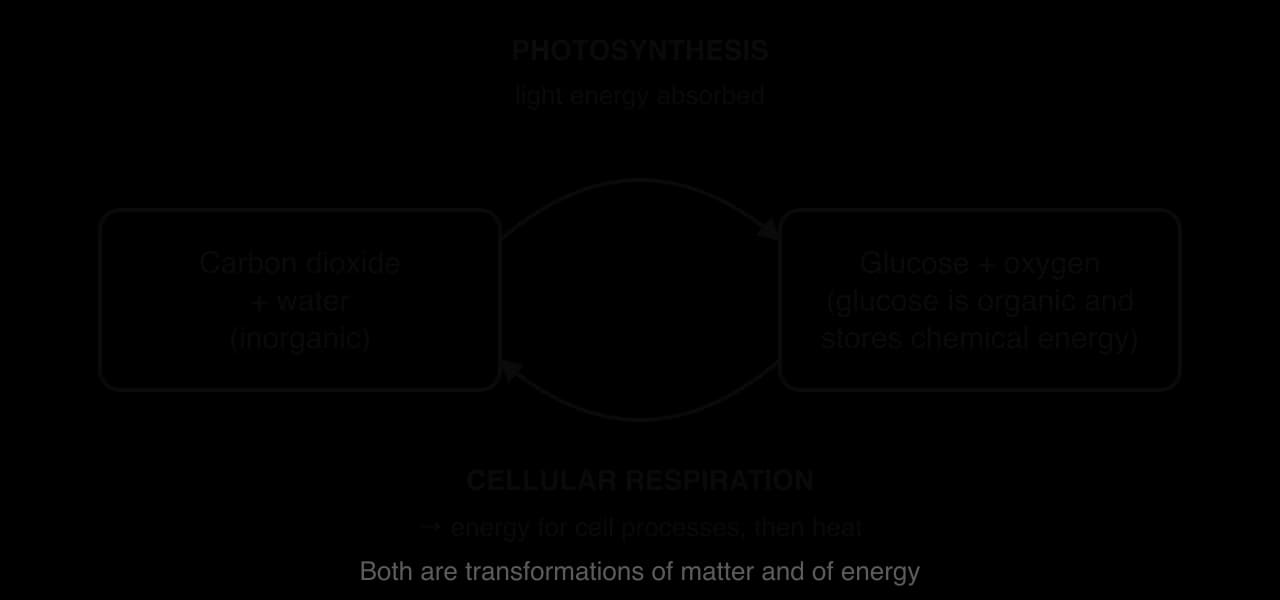
Two chemical processes move energy and matter into and out of living things. Photosynthesis brings energy into the living world and builds organic matter. Cellular respiration releases that energy for use and returns matter to its inorganic form. Both are transformations: they change the chemical nature of matter and the form of energy.
The process can be summarised by a word equation:
The inputs are inorganic: carbon dioxide from the air or water and water from the soil or surroundings. The output, glucose, is an organic compound, a carbon compound that stores chemical energy. Some glucose is used straight away in respiration. The rest is converted into other carbon compounds, such as starch for storage, cellulose for cell walls, and (with nutrients such as nitrogen from the soil) proteins and fats. These compounds make up the plant’s biomass, the organic matter that all other organisms in the ecosystem ultimately depend on.
Producers are typically green plants on land, algae and phytoplankton in water, and photosynthetic bacteria such as cyanobacteria. They are the only organisms that bring new energy into most ecosystems. Tropical rainforest trees, savanna grasses, kelp forests and the microscopic phytoplankton that colour the sea green all play the same role: they capture sunlight and turn it into food.
Aerobic respiration, the most common form, is summarised by this word equation:
Respiration happens in every living cell, in plants as well as animals, day and night. It releases the chemical energy stored in glucose in a form that cells can easily use for active processes: building molecules, moving substances across membranes, contracting muscles and dividing. The carbon dioxide and water produced are inorganic, so respiration returns matter to the environment in the form producers can take up again.
Respiration is not 100% efficient. Some of the chemical energy released is transformed straight into heat, and the energy used for cell activities also ends up as heat. Heat cannot be turned back into chemical energy by any organism, so it is eventually lost from the body to the surroundings and from the ecosystem to space.
Feature | Photosynthesis | Cellular respiration |
|---|---|---|
Where it happens | Producers only (cells with chlorophyll) | All living cells, including producers |
Energy transformation | Light energy → chemical energy in glucose | Chemical energy in glucose → energy for cell processes, then heat |
Matter transformation | Inorganic (CO₂, water) → organic (glucose) + oxygen | Organic (glucose) + oxygen → inorganic (CO₂, water) |
When | Only in light | All the time |
Effect on biomass | Increases it | Decreases it |
Because both processes run in a producer, a plant gains biomass only when photosynthesis is faster than its own respiration. On a sunny day a leaf fixes far more carbon than it respires, but at night it only respires. The difference between the two over a whole year is the plant’s growth, the basis of the ideas of gross and net productivity.
All organisms that cannot make their own food are consumers. They obtain chemical energy, and the carbon compounds they need to build their bodies, from the organic matter of other organisms, living or dead. Consumers have evolved a great variety of feeding strategies, and the strategy decides where an organism sits in the flow of energy through an ecosystem.
Strategy | How it obtains food | Example |
|---|---|---|
Herbivore | Eats living plants or algae (a primary consumer) | Blue wildebeest grazing grasses on the Serengeti plains, Tanzania |
Predator (a carnivore) | Kills and eats other animals (predation) | Lion hunting zebra; leopard seal catching penguins |
Parasite | Lives in or on a living host and feeds on it, usually without killing it quickly (parasitism) | Tapeworm in the gut of a mammal; ticks on cattle |
Scavenger | Eats the bodies of animals it did not kill | Vultures at a carcass on the savanna |
Detritivore | Ingests dead organic matter (detritus) and breaks it into small pieces | Earthworms pulling leaf litter into the soil; woodlice |
Saprotroph | Secretes enzymes onto dead matter and absorbs the digested products | Bracket fungi on a dead tree; many soil bacteria |
Decomposer | Breaks dead matter down into inorganic substances (most are saprotrophs) | Bacteria and fungi in soil and sediment |
Many animals do not fit neatly into one category. An omnivore such as a brown bear eats berries, roots, insects and salmon, so it feeds on several trophic levels. Hyenas both hunt and scavenge. Detritivores and saprotrophs differ in how they feed: a detritivore eats dead matter and digests it inside its gut, while a saprotroph digests it outside its body and absorbs the products.
Together, detritivores and decomposers carry out decomposition. They feed on dead leaves, wood, faeces and bodies from every level of the ecosystem. In a forest, most of the energy fixed by trees is never eaten by herbivores at all; it reaches the soil as fallen leaves, dead roots and wood and is used by decomposers. Their respiration releases this energy as heat, and their breakdown of organic matter releases nutrients such as nitrate and phosphate that producers need.
The simplest way to show who eats whom is a food chain. It starts with a producer and follows the organic matter, and the energy in it, as it passes to primary consumers that eat the producer, then to secondary consumers that eat the primary consumers, and so on to tertiary consumers and beyond.
Each stage in a food chain is a trophic level. Producers are trophic level 1, primary consumers level 2, secondary consumers level 3 and tertiary consumers level 4. As food passes from one level to the next, the carbon compounds and the chemical energy they contain are transferred with it.
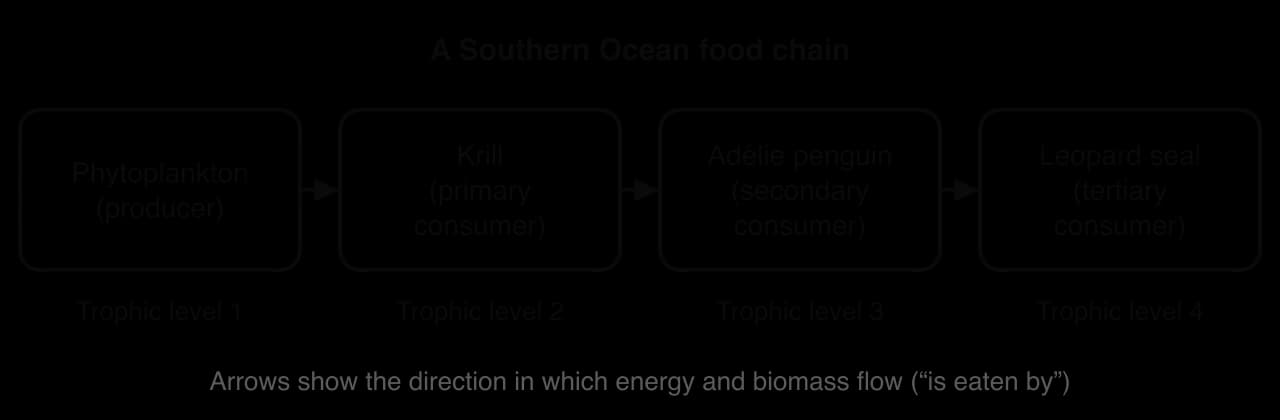
The arrows in a food chain always point in the direction of energy flow, from food to feeder. In the Southern Ocean chain, phytoplankton fix energy from sunlight; Antarctic krill (Euphausia superba) graze on them; Adélie penguins eat krill; and leopard seals eat penguins. The same krill also feed whales, fish and seabirds, which is one reason food chains are only a simplified model.
Decomposers are usually left out of food chains, because they feed on dead matter from every trophic level rather than at one position in the chain. They are nevertheless essential to energy flow. In many ecosystems more energy passes through decomposers than through all the herbivores and carnivores together, and their respiration is one of the largest outputs of heat. In a food web or energy flow diagram they are usually drawn as a separate box receiving dead matter from every level.
In real ecosystems, most species eat more than one kind of food and are eaten by more than one predator. A food web links all these food chains together. It shows the complexity of trophic relationships far better than a single chain, and it shows that some species feed at more than one trophic level.
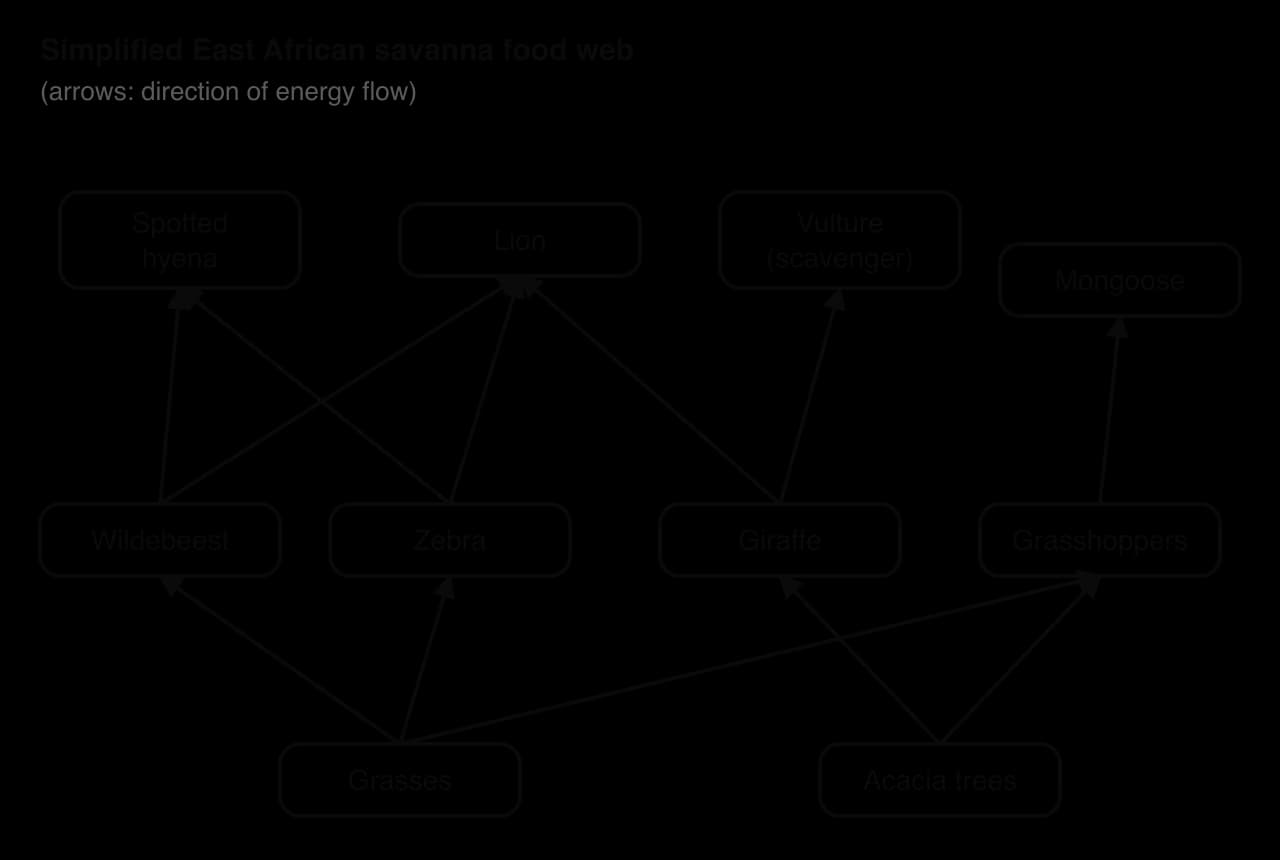
Food webs help explain the stability of ecosystems. If disease reduces the number of zebra, lions can switch to more wildebeest or giraffe, so the lion population is buffered. A web with many links is usually more resilient than one with few. They also show how a change at one point can spread: if grasshoppers decline, mongooses lose their main food, and grasses may grow faster.
An organism can occupy different trophic levels in different chains. A brown bear eating berries is a primary consumer; when it eats salmon that ate smaller fish, it is a tertiary or quaternary consumer. For this reason ecologists often describe the trophic level of an omnivore as an average.
 YouTube
Only part of the energy in one trophic level ever reaches the next. The losses happen in four stages, each of which removes energy or organic matter from the chain.
Not all available food is harvested. Herbivores do not eat every plant, and predators do not catch every prey animal. Roots, wood and well-defended prey are often left.
Not all harvested food is consumed. Predators leave bones, fur and skin; grazers drop leaves and stems.
Not all consumed food is absorbed. Some is indigestible (cellulose, bone, hair) and leaves the body as faeces. This is egestion.
Not all absorbed food is stored as new biomass. Most absorbed energy is used in cellular respiration to stay alive and is lost as heat; some is lost in urine.
The energy that escapes stages 1–3, in uneaten and dead matter and in faeces, is not lost from the ecosystem straight away. It passes to decomposers and detritivores, which eventually respire it and release it as heat. Only the energy stored in new tissue, after all four losses, can be eaten by the next trophic level. No transfer between trophic levels is ever 100% efficient.
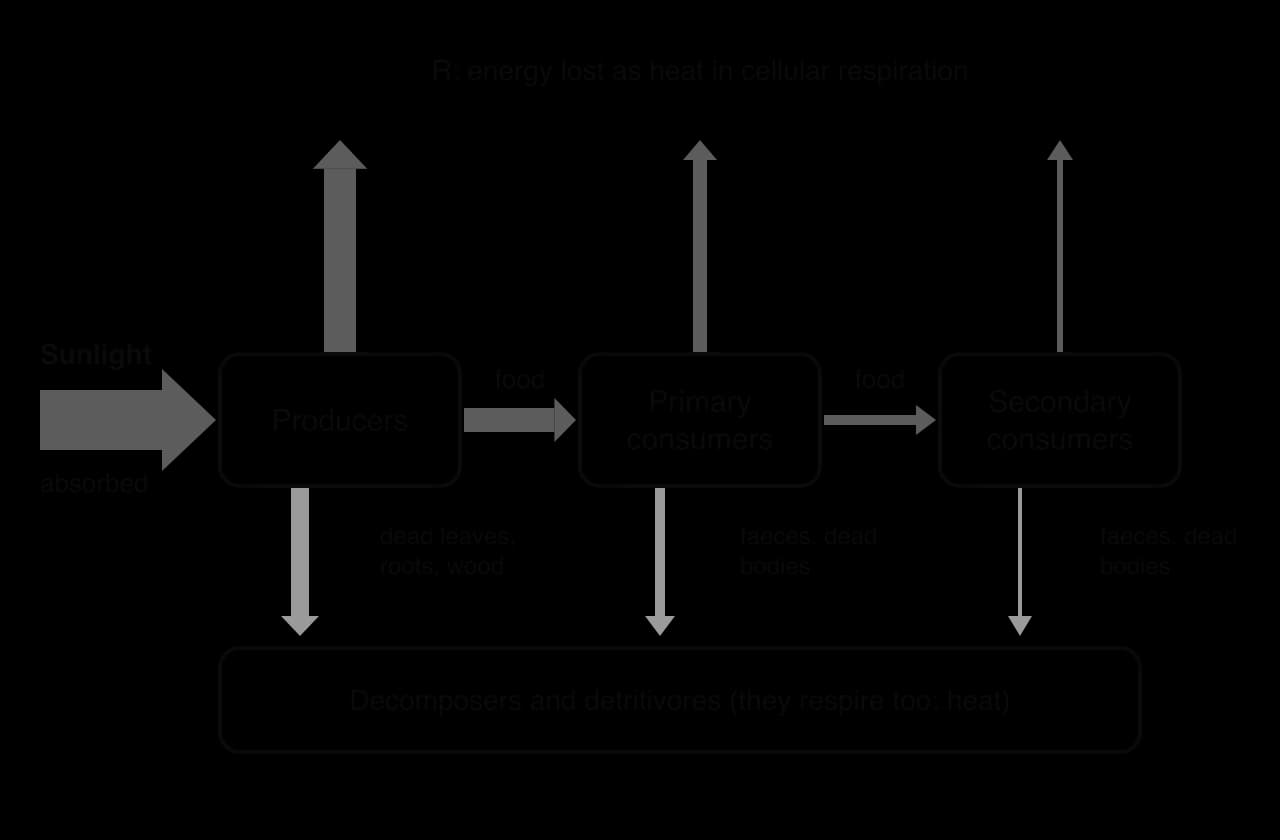
An energy flow diagram (sometimes called a Sankey diagram when arrow widths are to scale) is the clearest model of these losses. Storages are boxes for each trophic level; flows are arrows labelled with the process. Respiration is drawn as heat leaving each box, and dead matter and faeces as arrows to decomposers, which also release heat. The energy flow through the ecosystem is therefore one-way: in as light, out as heat.
Ecologists measure how fast organisms gain biomass or energy, because the rate of gain, not just the amount present, decides how much food is available to the next level. Productivity is the rate of gain in biomass or energy per unit area per unit time.
Not all of this gain is kept. Every organism uses part of what it takes in to stay alive, so ecologists also measure what remains.
The two are linked by the respiratory loss R, the biomass or energy used in cellular respiration:
Gross productivity is everything an organism takes in and absorbs; net productivity is what it keeps as new tissue, which is what the next trophic level could eat. For producers, GP is the energy fixed by photosynthesis. For consumers, GP is the food they absorb (food eaten minus faeces). Units combine an amount, an area and a time, for example g m⁻² yr⁻¹ for biomass or kJ m⁻² yr⁻¹ for energy.
Respiratory losses are usually a larger share of gross productivity in consumers than in producers. Animals move to find food and escape predators, pump blood and, in birds and mammals, keep their bodies warm. All of this needs energy from respiration. A plant does not move or keep warm, so it keeps a larger fraction of what it fixes. Among animals, endotherms such as mammals and birds lose far more to respiration than ectotherms such as insects and fish of the same size.
Net productivity is the new biomass added to a trophic level each year. If people or animals remove no more than this each year, the biomass left behind stays the same and can produce the same amount again next year. The net productivity of any organism or trophic level is therefore the maximum sustainable yield (MSY) that can be harvested without reducing future availability. A fishery that takes more than the net productivity of the stock is eating into the stock itself, which will shrink.
In practice, net productivity changes with the size of the stock, the weather and other factors, so managers apply MSY with caution. How fishing effort and catch quotas are set around MSY is a question for aquatic food production systems; the ecological basis is simply that only the net growth can be harvested for ever.
Because energy is lost at every transfer, each trophic level receives much less energy than the one below. Typically 10% or less of the energy flowing into one level becomes available to the next. This figure is often called the ten per cent rule, but it is a rough generalisation rather than a law.
The consequence is that energy runs out quickly up a food chain. If producers fix 10,000 kJ m⁻² yr⁻¹ and transfers are about 10%, primary consumers receive about 1,000, secondary consumers about 100, tertiary consumers about 10 and quaternary consumers about 1 kJ m⁻² yr⁻¹. A fifth or sixth level would receive so little energy that it could not support a breeding population. For this reason most food chains have three to five trophic levels, and top predators such as tigers, eagles and great white sharks are always rare.
The efficiency of transfer between two trophic levels is the percentage of the energy at one level that reaches the next:
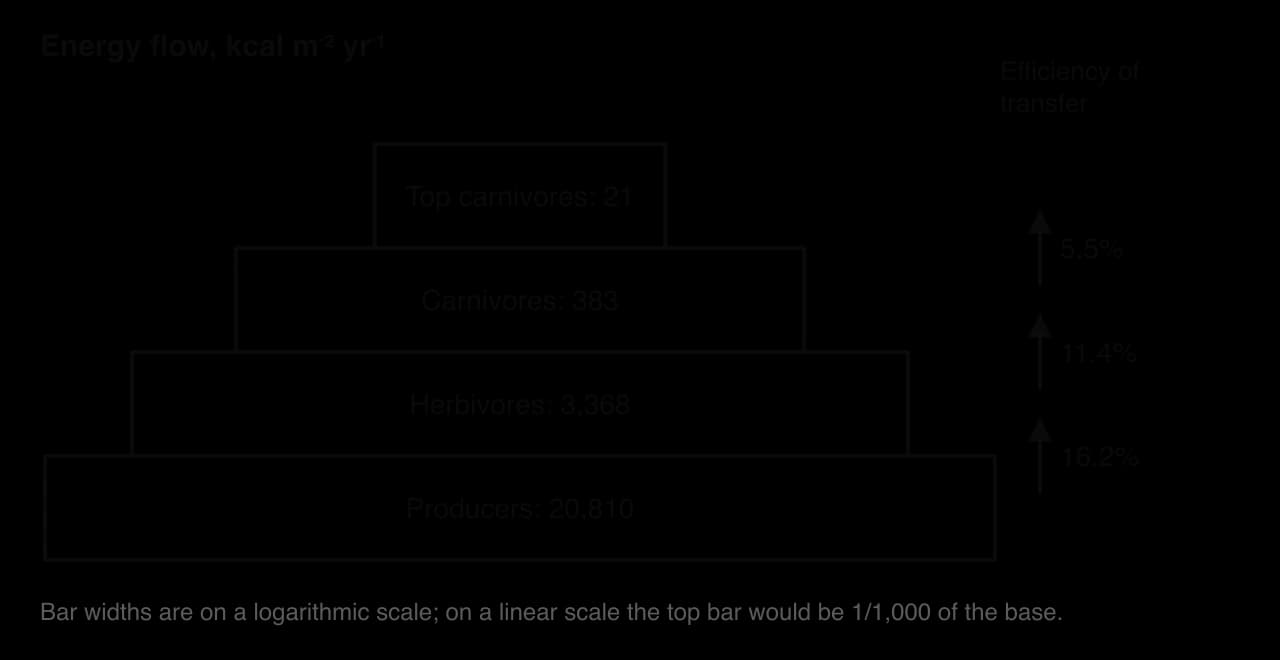
A classic data set comes from Silver Springs, a clear spring-fed river in Florida, USA, where Howard T. Odum measured the energy flowing through each trophic level in the 1950s. Producers (aquatic plants and algae) had a gross productivity of 20,810 kcal m⁻² yr⁻¹. The energy flowing into herbivores was 3,368, into carnivores 383 and into top carnivores 21 kcal m⁻² yr⁻¹; a further 5,060 kcal m⁻² yr⁻¹ passed to decomposers.
Sources: Odum (1957), as reported in OpenStax, Biology 2e (2018).
To compare trophic levels, ecologists need to measure how much organic matter each one contains. Fresh organisms are mostly water, and the water content varies greatly (a lettuce leaf is over 90% water, a seed much less), so fresh mass is a poor measure of organic matter. Instead, samples are dried.
Collect a sample of known area, for example all the plant material above ground in a 0.25 m² quadrat, cut at soil level.
Weigh an empty container, then the container with the fresh sample.
Dry the sample in an oven at a low temperature (around 60–80 °C is commonly used, so that the organic matter is not burned).
Weigh it, return it to the oven, and reweigh at intervals until two readings in a row are the same. This is drying to constant mass: all the water has gone.
Scale up from the sample area to a standard area, such as 1 m², and to a whole trophic level if needed.
Dry mass is a good approximation of the mass of organic matter, because water makes up most of the inorganic matter in an organism. A small part of the dry mass is minerals, which could be found by burning the sample and weighing the ash.
The energy stored in biomass is measured by calorimetry. A small, dried and weighed sample is burned completely in pure oxygen inside a sealed bomb calorimeter surrounded by a known mass of water. The rise in the water’s temperature gives the energy released, which is converted to energy per gram of dry mass. Multiplying by the dry mass per square metre gives the energy stored per square metre, and repeating over time gives a rate.
Both methods destroy the organisms sampled, which is acceptable for small amounts of grass but not for trees, rare plants or animals. For this reason, measurements are usually limited to plant material, and the dry mass of large organisms is estimated from smaller samples or from relationships between size and mass. Roots are hard to collect completely, so below-ground biomass is often underestimated. Scaling up from a few small samples to a whole ecosystem assumes that the samples are representative, which is rarely fully true.
An ecological pyramid is a model of a food chain or web made of horizontal bars, one for each trophic level, stacked with producers at the bottom. The width of each bar shows the relative size of the trophic level. There are three kinds, and they measure different things.
Pyramid | What each bar shows | Typical units | Can it be inverted? |
|---|---|---|---|
Pyramid of numbers | Number of individuals at each level, per unit area, at one time | individuals m⁻² (or per hectare) | Yes |
Pyramid of biomass | Dry mass of organisms at each level, per unit area, at one time | g m⁻² or kg m⁻² | Yes, occasionally |
Pyramid of energy | Energy flowing into each level, per unit area, per unit time | kJ m⁻² yr⁻¹ | No, never |
Pyramids of numbers and biomass describe the standing crop: what is present at a particular moment. A pyramid of energy describes a flow: how much energy passes into each level over a period. Some books call it a pyramid of productivity for this reason.
Because energy is lost at every transfer, each level normally contains less energy, less biomass and fewer individuals than the level below. In a grassland, millions of grass plants support thousands of grasshoppers, which support hundreds of birds and a few hawks. The pyramid narrows upwards in every measure.
Pyramids of numbers can be inverted, wholly or in part, when organisms at one level are very different in size. One oak tree can feed thousands of caterpillars, which feed a smaller number of birds, so the bottom bar (one tree) is narrower than the one above it. Parasites can invert the top of a pyramid: one bird may carry hundreds of fleas.
Pyramids of biomass are occasionally inverted in some open oceans and lakes. Phytoplankton are tiny, reproduce within days and are eaten almost as fast as they grow, so at any moment their standing biomass can be smaller than that of the zooplankton grazing on them. Over a year, though, the phytoplankton produce far more biomass than the zooplankton; their small standing crop is offset by a very fast turnover.
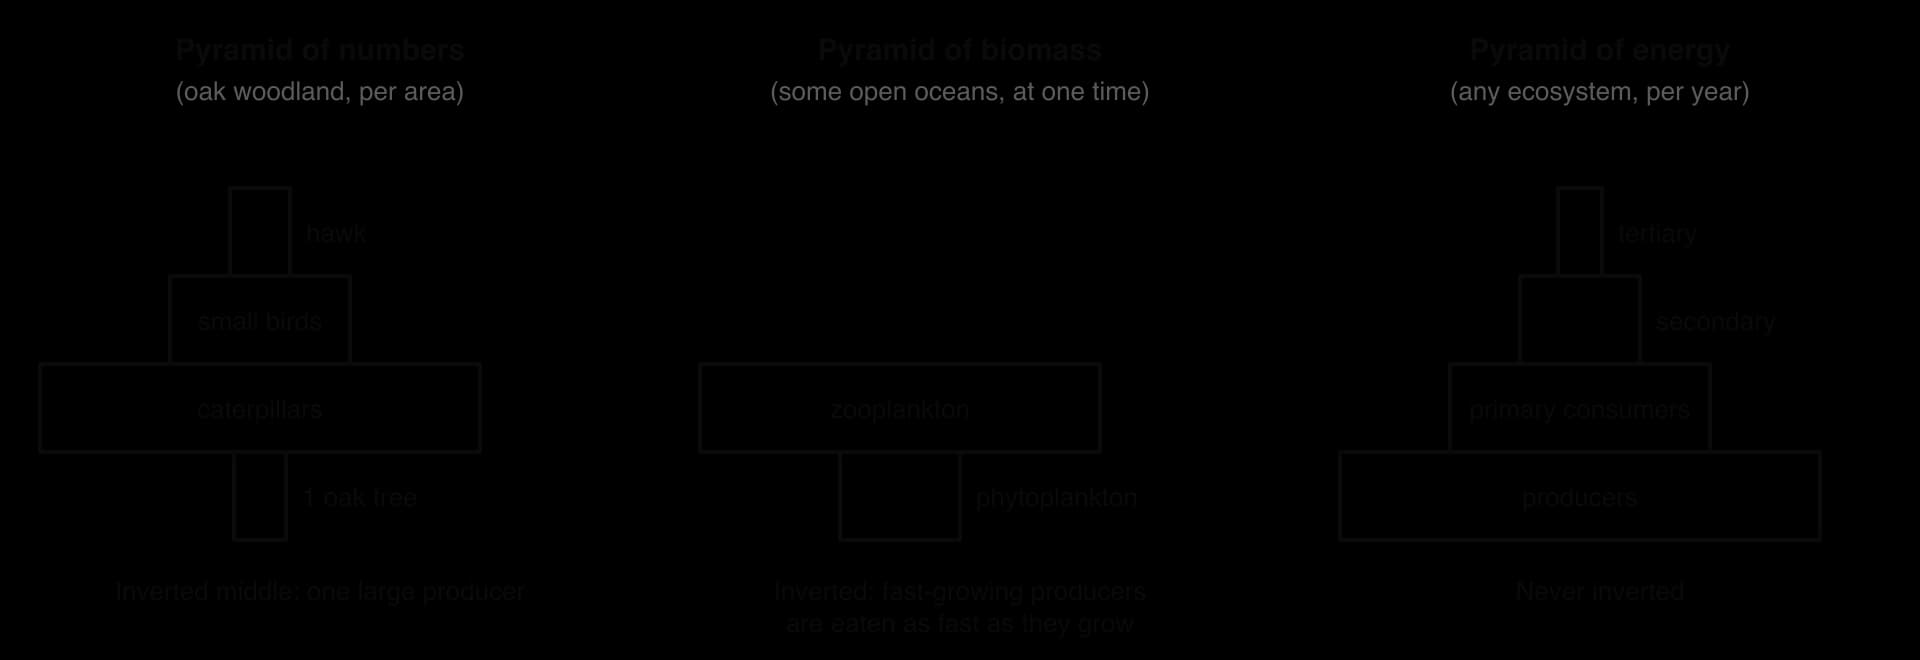
Pyramids of energy can never be inverted, because of the second law of thermodynamics. A trophic level cannot receive more energy than the level below it supplies, and some energy is always lost as heat in the transfer. This makes them the most informative of the three.
Pyramid | Strengths | Limitations |
|---|---|---|
Numbers | Quick and cheap to collect by counting; no organisms destroyed | Ignores size (one oak = one aphid); numbers can be huge and hard to draw to scale; omnivores hard to place |
Biomass | Takes account of size; dry mass is a fair measure of organic matter | Organisms must be killed and dried; a snapshot that ignores turnover rate, so can mislead (plankton); seasonal changes |
Energy | Shows true energy flow; never inverted; allows efficiencies to be calculated and ecosystems compared | Hard and slow to measure; requires data over a whole year; species feeding at several levels are hard to assign |
Most substances that organisms take in are broken down, used or excreted. Some pollutants are different: they are non-biodegradable or break down only very slowly, and organisms have no efficient way to excrete them. These persistent pollutants include the insecticide DDT, industrial polychlorinated biphenyls (PCBs) and the metal mercury in the form of methylmercury. DDT and PCBs are persistent organic pollutants (POPs): carbon-based chemicals that resist breakdown, travel long distances in air and water, and dissolve in fats rather than water.
A second process acts between organisms rather than within one, and it depends on the feeding links of the food chain.
Bioaccumulation happens inside one organism over time. A fish that takes in a little mercury each day with its food and through its gills, but excretes almost none, builds up a higher and higher concentration as it ages. Older and larger individuals of the same species usually carry the highest loads.
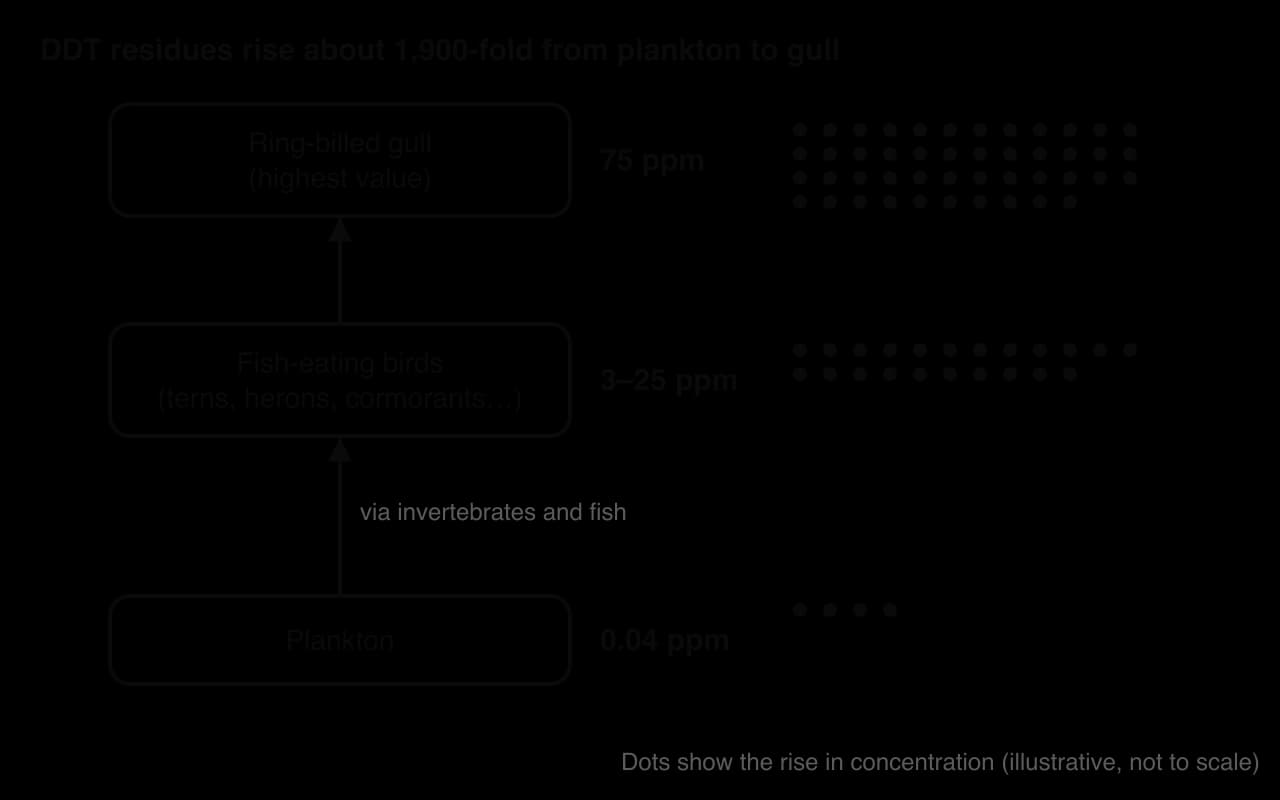
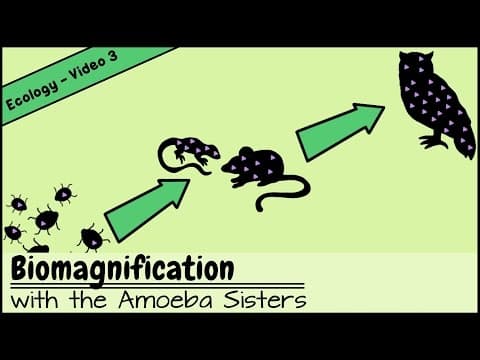
Biomagnification happens between trophic levels, and it is a direct result of energy losses in food chains. A predator eats many prey over its life. Most of the biomass of that prey is respired away as carbon dioxide and water or egested, but the fat-soluble pollutant stays behind in the predator’s fat. The pollutant is concentrated into a much smaller mass of tissue. Repeated at each level, this raises concentrations by factors of thousands or more from plankton to top predators.
Sources: Woodwell, Wurster and Isaacson, _Science 156 (1967); Ehrlich, Dobkin and Wheye, “DDT and Birds”, Stanford University._
Mercury released by industry, coal burning and gold mining is converted by bacteria in sediments into methylmercury, which is absorbed easily but excreted very slowly. It biomagnifies up marine food chains: herring contain about 0.01 parts per million (ppm), while sharks can contain more than 1 ppm. Long-lived predatory fish such as sharks, swordfish and tuna carry the highest loads, which is why many health agencies advise pregnant women to limit how much of them they eat.
In Minamata, Japan, a chemical factory owned by the Chisso Corporation discharged mercury-contaminated wastewater into Minamata Bay between 1932 and 1968, including methylmercury from about 1951. The mercury bioaccumulated and biomagnified in fish and shellfish, which were the staple food of local fishing families. The resulting neurological illness, identified in 1956 and named Minamata disease, affected cats and people; the highest hair mercury recorded in a patient was 705 ppm, against an average of 4 ppm for people living outside the area. By March 2001, 2,265 people had been officially recognised as victims.
Sources: Wikipedia, “Minamata disease” and “Biomagnification”, accessed October 2026.
PCBs were used in electrical equipment and paints until they were banned in most countries in the 1970s and 1980s, yet they still biomagnify today because they persist in sediments and fat. A study of more than 1,000 stranded or sampled whales and dolphins around Europe found that striped dolphins, bottlenose dolphins and killer whales (Orcinus orca) carried mean PCB concentrations in their blubber well above all known toxicity thresholds for marine mammals. Some small killer whale populations in the north-east Atlantic were producing very few young, which is consistent with PCB damage to reproduction. Killer whales are top predators that eat other marine mammals and large fish, so the PCBs they take in have already been concentrated through several trophic levels below them.
Sources: Jepson et al., _Scientific Reports 6 (2016)._
 YouTube
Microplastics are plastic particles smaller than 5 mm. Some are made small (microbeads, the resin pellets from which plastic goods are moulded), but most form as larger items such as bags, bottles, fishing gear and synthetic clothing break down into fragments and fibres. They are now found from the sea surface to the deepest ocean trenches and are eaten by animals at every trophic level, from zooplankton and mussels to fish, seabirds and whales.
Microplastics matter in food chains for two reasons. First, they are themselves non-biodegradable and can pass from prey to predator. In a laboratory experiment, mussels (Mytilus edulis) were fed tiny fluorescent plastic spheres and then fed to shore crabs (Carcinus maenas); the spheres were later found in the crabs’ blood, gills, stomach and ovaries. Second, plastic surfaces attract persistent organic pollutants dissolved at low concentrations in seawater. Polypropylene resin pellets collected on Japanese coasts carried PCBs and DDE, and clean pellets left in the sea picked up these pollutants steadily within days.
An animal that eats microplastics may therefore take in a dose of concentrated POPs with them, adding a route by which these chemicals enter food chains and then biomagnify. Microplastics have even reached the deepest ecosystems on Earth. In amphipods (small crustaceans that scavenge on the sea floor) collected from six Pacific trenches, including the Mariana Trench, at depths of 7,000 to 10,890 m, 65 of the 90 individuals examined (over 72%) contained at least one microparticle.
Sources: Farrell and Nelson, _Environmental Pollution 177 (2013); Mato et al., Environmental Science & Technology 35 (2001); Jamieson et al., Royal Society Open Science 6 (2019)._
Plastic pollution in the oceans more broadly, including how it collects in ocean gyres and how it can be managed, is part of the study of water pollution.
Human activities alter the flows of energy and matter through ecosystems at every scale, from a single field to the whole biosphere. Four activities have the largest effects: burning fossil fuels, deforestation, urbanisation and agriculture.
Activity | Effect on energy flows | Effect on matter transfers |
|---|---|---|
Burning fossil fuels | Releases ancient chemical energy stored by photosynthesis millions of years ago; air pollutants and climate change can reduce primary productivity | Transfers carbon from long-term stores to the atmosphere as CO₂; adds sulfur and nitrogen oxides that cause acid deposition |
Deforestation | Removes a large store of biomass and the photosynthetic capacity of the forest; food webs that depended on it collapse | Releases carbon as CO₂ by burning and decomposition; reduces transpiration and nutrient cycling; increases soil erosion |
Urbanisation | Replaces vegetation with buildings and roads, cutting primary productivity almost to zero over large areas | Interrupts nutrient and water cycles (sealed surfaces, fast run-off); concentrates waste and pollutants |
Agriculture | Replaces diverse natural food webs with simple chains (crop → people or livestock); diverts net productivity to people | Removes biomass and nutrients at harvest; adds fertilisers and pesticides; can degrade soil |
Carbon dioxide is one of the raw materials of photosynthesis, so a higher concentration in the air can increase the rate of photosynthesis in many plants, at least where water and nutrients are not limiting. This CO₂ fertilisation effect is one reason why forests and oceans currently absorb part of human emissions. However, the same activities that raise CO₂ also release other pollutants and cause global warming.
Ground-level ozone damages leaves, drought and heat stress close the pores in leaves and slow photosynthesis, and warming oceans become more stratified, reducing the nutrient supply to phytoplankton. Taken together, these effects are projected to lower primary productivity in many regions, so extra CO₂ cannot be relied on to offset the damage.
When natural ecosystems are converted to farmland or cities, the standing biomass, the number of trophic links and the photosynthetic capacity all fall. In the Cerrado, the tropical savanna of central Brazil, large areas of native woodland and grassland have been cleared for soy farming and cattle pasture. Much of the Cerrado’s biomass is below ground in deep roots, which are lost or burned when land is cleared for charcoal and crops. The varied food webs of the savanna are replaced by a single crop or a single grazing animal.
Sources: Wikipedia, “Cerrado”, accessed October 2026.
These changes connect energy flow to several planetary boundaries. Removing biomass and simplifying food webs erodes biosphere integrity, while releasing stored carbon pushes the climate boundary. They also link to the Sustainable Development Goals on life on land (SDG 15) and climate action (SDG 13).
Perspective | How it views human use of ecosystem productivity | Typical response |
|---|---|---|
Technocentrism | Productivity can be raised by technology to meet human needs | High-yield crops, fertilisers, genetic engineering, vertical farming |
Anthropocentrism | Ecosystems should be managed for human benefit, but sustainably | Harvest within MSY, protect forests for their services, regulate pollutants |
Ecocentrism | Other species have a right to the energy and habitat they depend on | Reduce human appropriation of productivity, protect wild land, eat lower on the food chain |
Each perspective draws on the same ecology but weighs it differently. A technocentrist sees the low efficiency of food chains as a problem to be engineered around; an ecocentrist sees it as a reason for people to take less. Most real policies combine elements of all three.
DDT (dichlorodiphenyltrichloroethane) is an organochlorine insecticide whose ability to kill insects was discovered by the Swiss chemist Paul Müller in 1939. It was used during the Second World War to control the mosquitoes and lice that spread malaria and typhus, and by October 1945 it was on public sale in the United States. Cheap, long-lasting and effective, it was sprayed on cropland, forests, wetlands and towns across North America to control crop pests and mosquitoes.
The system involved is a set of food chains in farmland, lakes, wetlands and estuaries. On the coasts of the north-eastern United States, chains ran from plankton through shrimp and small fish to fish-eating birds such as ospreys (Pandion haliaetus), herons, cormorants and gulls. Inland and along rivers, bald eagles (Haliaeetus leucocephalus) fed on fish and waterbirds, and peregrine falcons (Falco peregrinus) hunted other birds. All of these predators occupy the third, fourth or fifth trophic level.
DDT entered ecosystems as an input of sprayed chemical, washed off fields into rivers and estuaries, and settled in sediments and marsh soils. Because it is almost insoluble in water but dissolves readily in fats, it was absorbed by plankton and small organisms and stored in their fat rather than excreted. It is also persistent: depending on conditions, its half-life in soil ranges from about 22 days to 30 years, and its main breakdown product, DDE, is just as persistent.
Each predator ate many prey over its life. Most of the prey biomass was respired or egested, but the DDT and DDE stayed in the predator’s fat. The pesticide therefore bioaccumulated in each individual and biomagnified at each trophic level. Adult birds were rarely killed outright. Instead, DDE interfered with the transport of calcium carbonate into the eggshell in the female’s shell gland, so the birds laid thin-shelled eggs that cracked under the weight of the brooding parent.
A study of a salt marsh on the south shore of Long Island, New York, published in 1967, measured DDT residues at different trophic levels. The marsh soil held on average more than 13 pounds of DDT residues per acre (about 15 kg per hectare) after years of spraying for mosquito control. Concentrations rose with trophic level through more than three orders of magnitude, from 0.04 ppm in plankton to 75 ppm in a ring-billed gull, and birds carried 10 to 100 times more than fish. These levels approached those found in animals dying of DDT poisoning.
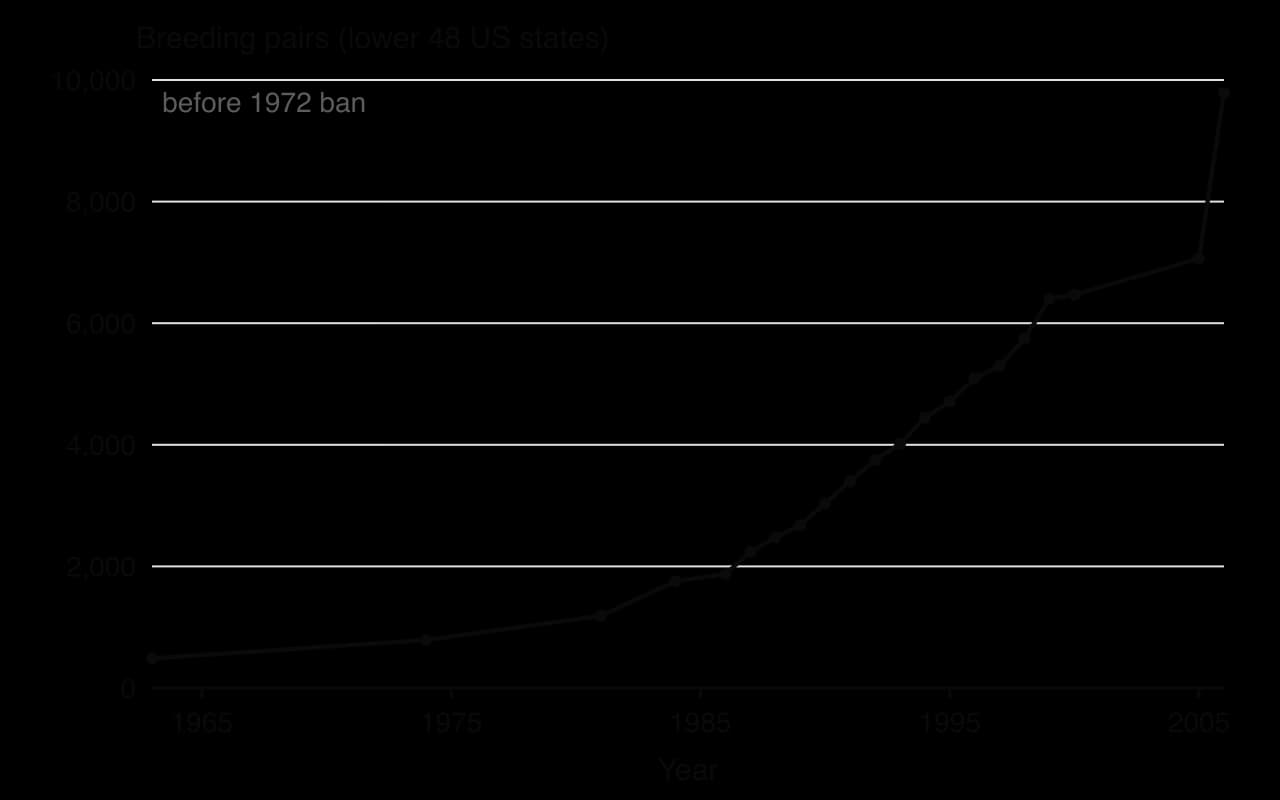
United States use of DDT peaked at about 36,000 tonnes in 1959, and more than 600,000 tonnes were applied before the ban; world production peaked at 82,000 tonnes a year in 1963. By the early 1960s, bald eagles in the 48 contiguous states had fallen to fewer than 500 nesting pairs, from an estimated 300,000–500,000 birds in the early eighteenth century. The peregrine falcon disappeared as a breeding bird from the eastern United States and south-eastern Canada, and brown pelican and osprey populations crashed.
Sources: Woodwell, Wurster and Isaacson, _Science 156 (1967); US Fish and Wildlife Service, bald eagle population data (2015) and species profile (2025); Wikipedia, “DDT” and “Bald eagle”, accessed October 2026._
Evidence that DDT was harming wildlife reached a wide public through Rachel Carson’s book Silent Spring (1962). Scientists measured DDE in eggs and showed that higher concentrations matched thinner shells. A lawsuit by a conservation group led a US court to order the new Environmental Protection Agency (EPA) to review DDT, and after months of hearings in 1971–1972, the EPA cancelled most uses in 1972, keeping only some public-health uses. A federal appeals court upheld the ban in 1973.
Several other measures worked alongside the ban. The bald eagle was already protected from hunting and egg collecting by a 1940 law. It was listed as endangered in 1967 and protected under the Endangered Species Act; nest sites were protected and captive-bred peregrines were released. In 2004 the Stockholm Convention on Persistent Organic Pollutants came into force, banning agricultural use of DDT worldwide and restricting it to the control of disease-carrying insects.
The response can be read through the three-level model of pollution management. The ban acted at the first level, stopping the human activity that produced the pollutant. Habitat protection and captive breeding acted at the third level, restoring damaged populations. Nothing could quickly clean the DDT already stored in sediments and fat, which is why recovery took decades.
By the measure of its main goal, the response was a clear success. Breeding pairs of bald eagles in the lower 48 states rose to 9,789 by 2006, the species was moved from endangered to threatened in 1995 and removed from the endangered species list on 28 June 2007. The US Fish and Wildlife Service estimated about 316,700 bald eagles, including about 71,400 breeding pairs, from 2018–2019 surveys. Peregrine falcons and ospreys also recovered.
The evidence for DDT’s role is strong but not simple. Hunting, habitat loss and other organochlorine pesticides also harmed birds of prey, and the eagles’ recovery owed something to each of the other protections. The ban was based on field correlations and laboratory studies of eggshells rather than proof of every mechanism, so it can be seen partly as an early application of the precautionary principle: acting on strong evidence of serious harm before every detail is known.
Stakeholder or perspective | View of DDT | Reasoning |
|---|---|---|
Farmers and pesticide manufacturers (1960s) | Opposed a ban | DDT was cheap and effective; alternatives were costlier; the industry disputed the evidence |
Conservationists and many scientists (ecocentric) | Supported a ban | Biomagnification threatened top predators and whole ecosystems; wildlife has value in itself |
US regulators (anthropocentric, managerial) | Banned most uses but kept public-health exemptions | Weighed harm to wildlife and possible human health risks against benefits |
Public-health agencies in malaria-endemic countries | Support limited indoor use | Malaria kills many people; indoor spraying of house walls uses far less DDT than farm spraying |
Technocentric view | Replace DDT with newer pesticides and technologies | Pyrethroids, bed nets and new drugs can control insects with less persistence |
The global picture is more complicated than the American one. In 2006 the World Health Organization recommended indoor residual spraying with DDT in regions where malaria is a major problem, because it repels and kills mosquitoes on house walls. In Sri Lanka, spraying cut malaria from about a million cases a year to 18 in 1963; after the programme was halted to save money, cases rebounded to about 600,000 by 1968.
Yet heavy agricultural use had already made many mosquitoes resistant to DDT, so it is no longer effective in parts of India and elsewhere. India remains the main producer and user of DDT, while most countries aim to phase it out entirely. This is a genuine trade-off between protecting people from disease and protecting ecosystems from a persistent pollutant, and it falls hardest on lower-income countries in the tropics.
Sources: Wikipedia, “DDT”, accessed October 2026 (citing WHO and the Stockholm Convention).
The DDT case links several ideas about energy and biomass. Trophic levels explain who was exposed most; the loss of biomass in respiration at each transfer explains why the concentration rose at each level; and the long life and high trophic level of birds of prey explain why they were the first to show harm.
The case also shows a pollutant changing a whole ecosystem without killing most organisms directly, by acting on the reproduction of species at the top of the food web. Finally, it shows that a ban at the source (the first level of management) works, but slowly when the pollutant is persistent, and that the same chemical can be judged very differently depending on whose health and livelihoods are at stake.
Every organism on Earth obtains its carbon compounds in one of two ways. Either it makes them from simple inorganic substances, or it takes them ready-made from other organisms. This divides all life into two groups.
All other organisms depend on the carbon compounds that autotrophs make.
Autotrophs are the producers of every ecosystem. Heterotrophs include all animals and fungi and most bacteria: herbivores, carnivores, parasites, detritivores and saprotrophs all depend, directly or indirectly, on the carbon compounds made by autotrophs. Autotrophs themselves differ in where they obtain the energy to build those compounds.
Photoautotroph | Chemoautotroph | |
|---|---|---|
Energy source | Light | Exothermic (energy-releasing) reactions of inorganic chemicals, such as oxidising hydrogen sulfide, ammonia or iron |
Process | Photosynthesis | Chemosynthesis |
Carbon source | Carbon dioxide | Carbon dioxide |
Examples | Plants, algae, phytoplankton, cyanobacteria | Sulfur-oxidising bacteria at hydrothermal vents; nitrifying bacteria in soil |
Where they dominate | Almost all sunlit ecosystems | Places with little or no light but a supply of reduced chemicals |
Chemoautotrophs live in many ecosystems, including ordinary soils, where nitrifying bacteria gain energy by oxidising ammonium. They become the main energy source for whole food webs only where there is little or no light. The best-known examples are deep-sea hydrothermal vents, openings in the sea floor along volcanic ridges where seawater heated by magma rises back out of the rock. The water emerges at temperatures from about 60 °C to over 400 °C, into surroundings at about 2 °C, and carries dissolved hydrogen sulfide and metals.
Communities around vents were first observed directly in 1977 on the Galápagos Rift in the eastern Pacific. Bacteria there oxidise hydrogen sulfide and use the energy released to fix carbon dioxide into organic compounds. Giant tube worms (Riftia pachyptila) have no mouth or gut: they house the bacteria inside their bodies and absorb the organic compounds they make, while the worms’ red plumes take up the chemicals the bacteria need. Clams, mussels, shrimps, crabs and fish feed on the bacteria or on the animals that host them.
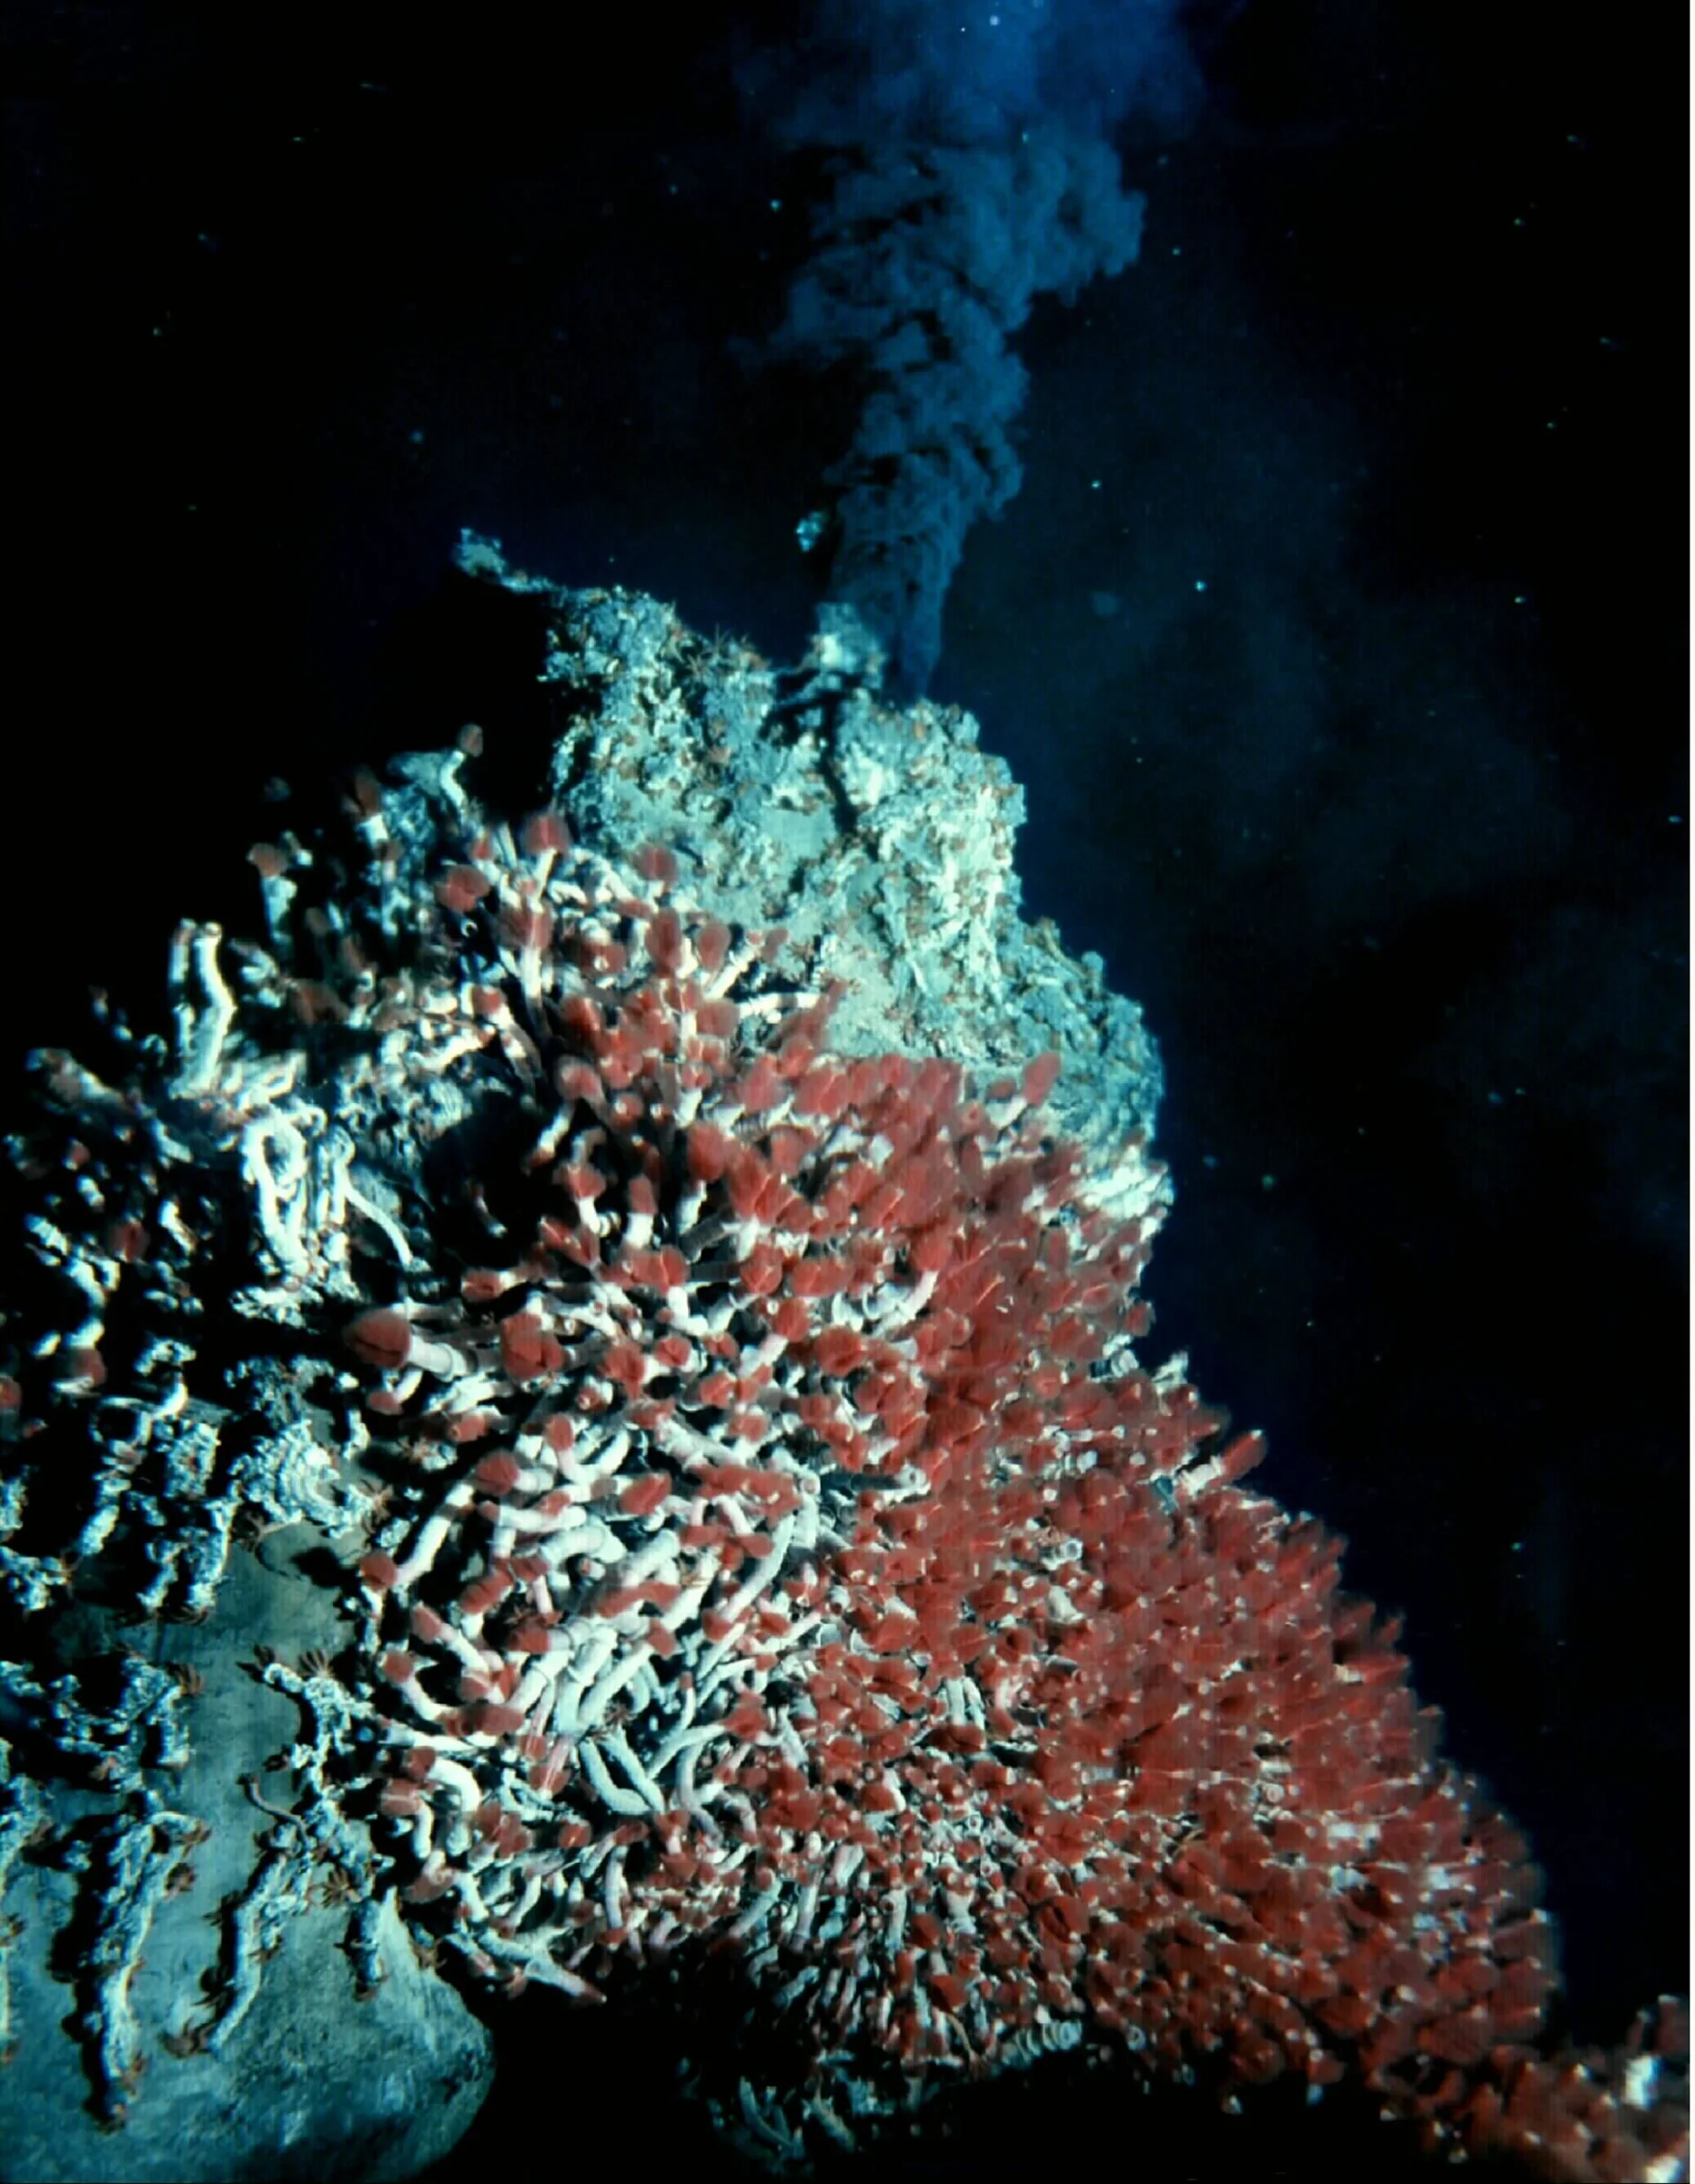
Vent ecosystems are not wholly independent of the Sun, because the oxygen many vent bacteria use comes from photosynthesis at the surface. They nevertheless show that the first trophic level can be built on chemical energy, which widens the idea of a producer and has encouraged the search for life in dark, chemically active places on other worlds.
Sources: Wikipedia, “Hydrothermal vent”, accessed October 2026.
Primary productivity is usually expressed as kg of carbon m⁻² yr⁻¹, because carbon is the element being fixed, although g m⁻² yr⁻¹ of dry biomass or kJ m⁻² yr⁻¹ of energy are also used. As with all productivity, it has a gross and a net form.
Gross primary productivity (GPP) is the total rate of carbon or energy fixation by producers. Net primary productivity (NPP) is what remains after the producers’ own respiration, R. NPP is the basis for every food chain: it is the new plant growth that is available to primary consumers and decomposers, and the plant growth that farmers and foresters can harvest sustainably.
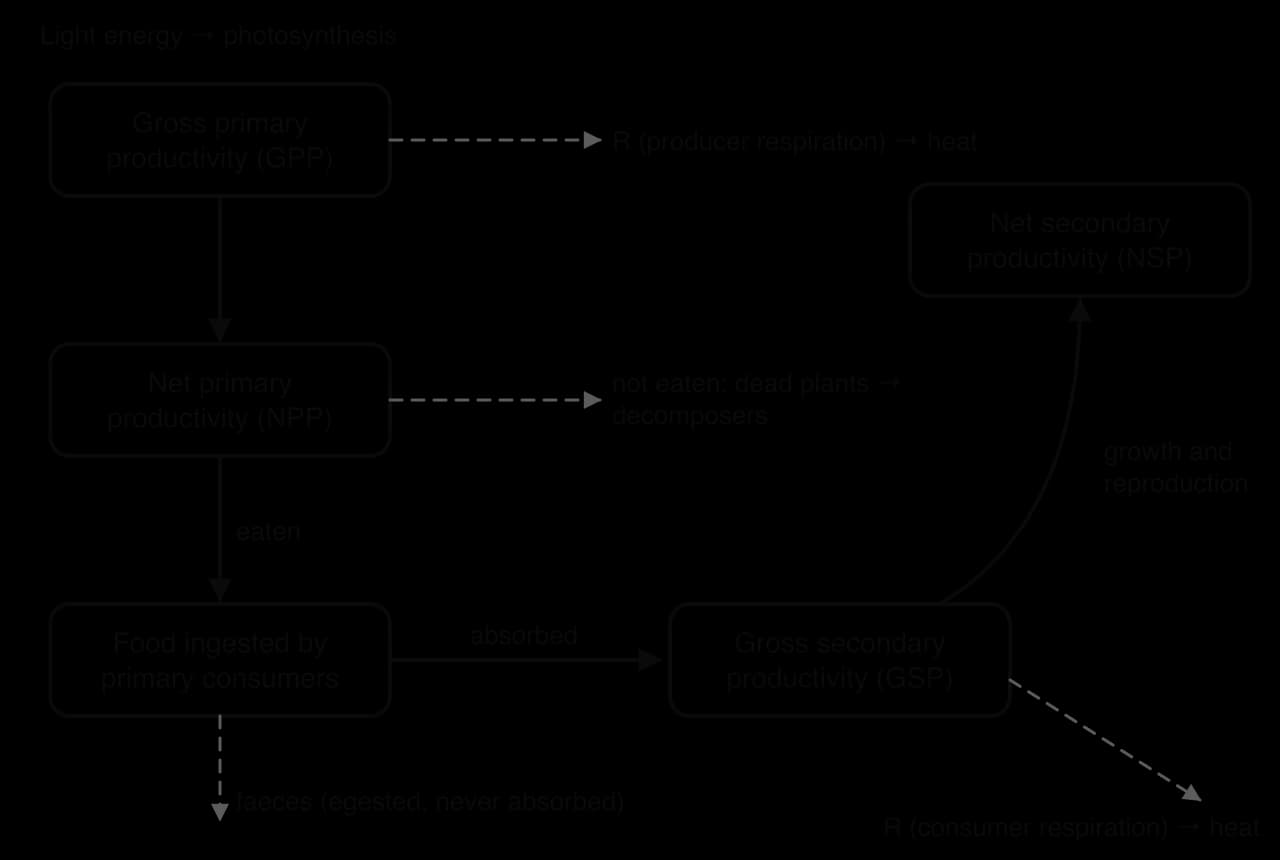
In water, the rate of photosynthesis can be followed by the oxygen it releases. In the light and dark bottle method, three bottles are filled with water from the same depth. The dissolved oxygen in the first is measured straight away. The second (light) bottle is clear, and the third (dark) is wrapped in foil so no photosynthesis can occur. Both are suspended at the original depth for a set time, usually 24 hours, and their oxygen is then measured.
Dark bottle: oxygen falls, because only respiration happens. Initial − dark = R.
Light bottle: oxygen changes by photosynthesis minus respiration. Light − initial = NPP.
GPP = NPP + R = light − dark.
On land, NPP can be estimated with the harvest method. In a grassland or crop, plants are harvested from randomly placed quadrats of known area at the start of the growing season and again after a set period. Each sample is dried to constant mass. The increase in dry mass per square metre, divided by the time between harvests, gives the net primary productivity. To estimate GPP, the respiration rate must be added, for example from the loss of dry mass of a sample kept in the dark for a known time.
Secondary productivity is the productivity of heterotrophs. Not everything a consumer eats becomes part of its body. The food that passes through the gut without being digested or absorbed leaves as faeces; it was never part of the animal’s biomass, so it does not count. What is absorbed is called assimilation, or gross secondary productivity (GSP). Respiration then uses part of it, and the rest is net secondary productivity (NSP), the new tissue added by growth and reproduction.
Secondary productivity uses the same units as primary productivity. It can be measured in the laboratory by feeding animals such as caterpillars or locusts a known mass of food, collecting their faeces, and measuring their gain in mass over several days, with dry masses estimated from fresh masses using samples. In the field it is much harder, because animals move, and it is usually estimated from changes in population biomass.
Maximum sustainable yields are the net primary or net secondary productivity of a system: the amount of new biomass produced each year that could be removed without reducing the stock. A harvest larger than this eats into the standing crop, so future yields fall. The idea applies to three kinds of system.
System | What is harvested | MSY corresponds to | Example and difficulty |
|---|---|---|---|
Natural | Wild fish, game, wild plants, fuelwood | The net productivity of the wild population | Ocean fish stocks: productivity varies with recruitment and climate, and the stock size is uncertain, so harvests set at an estimated MSY often turn out too high |
Agricultural | Crops and livestock | The NPP of the crop, or the NSP of the livestock herd | Grazing land: a herd that eats more than the grass NPP causes overgrazing and soil erosion |
Silviculture (forestry) | Timber, pulp, fuelwood from managed forests | The annual growth increment of the trees (wood NPP) | A plantation harvested on a rotation no faster than the trees regrow; old-growth forest grows slowly, so its sustainable yield is low |
In each case, MSY is a model with limits. NPP varies from year to year, so a fixed harvest can exceed it in bad years. Removing biomass also removes nutrients, which must be replaced. Harvesting at MSY leaves no margin for error, so managers often set a lower harvest to allow for uncertainty. A sustainable yield is any harvest that does not reduce the stock’s future productivity; the maximum is just the largest of these.
Because energy is lost at every transfer, much more food energy is available to people who eat producers than to people who eat animals. If a field of grain produces 10,000 kJ of food, people eating the grain directly obtain close to that amount; if the grain is fed to cattle, and only about 10% becomes beef, people obtain about 1,000 kJ. The same land can therefore support many more people on a plant-based diet than on a meat-based one.
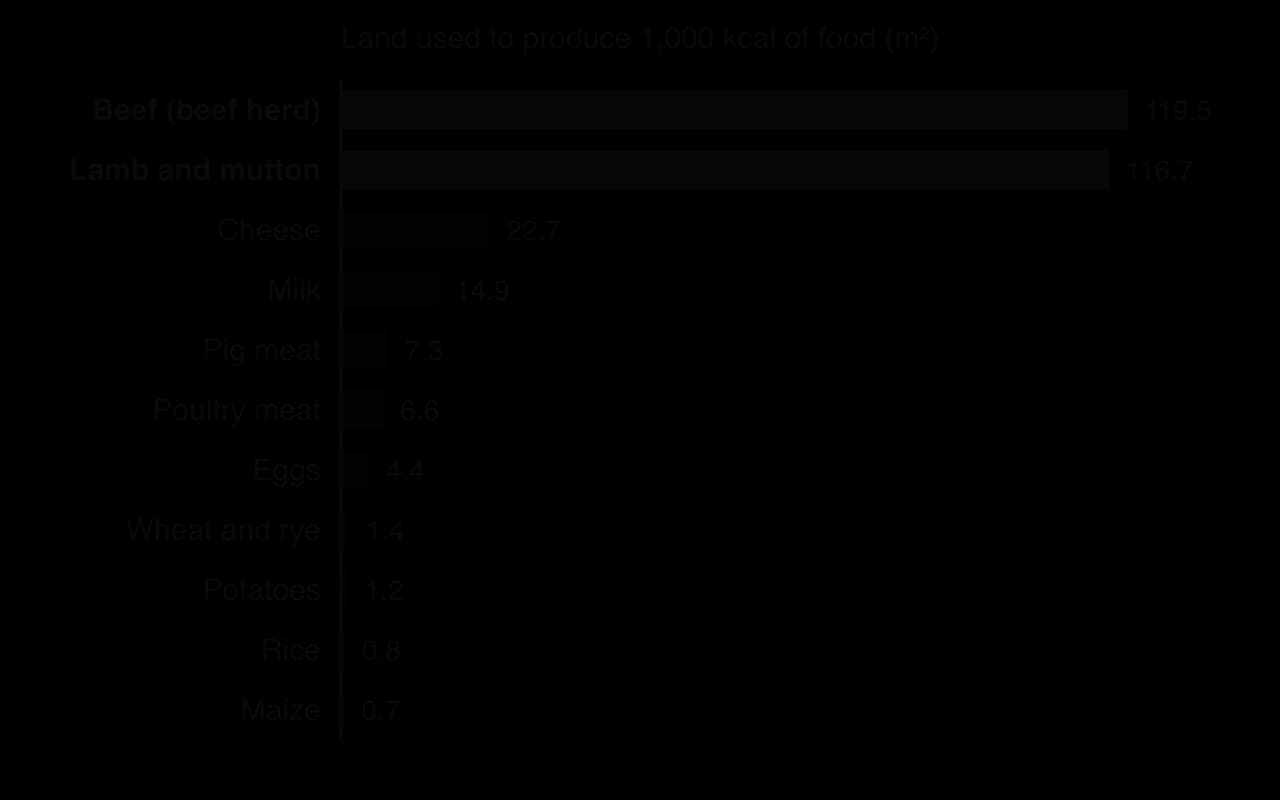
The real-world data match the ecology. Global averages compiled from about 38,700 farms show that beef and lamb need over 100 m² of land per 1,000 kcal, while staple crops need 1 m² or less. Poultry and pig meat lie in between, partly because chickens and pigs convert feed to meat more efficiently than cattle and sheep do. Eggs and farmed fish are also relatively efficient.
Eating lower in the food chain is one of the most effective ways for individuals to reduce the land, water and greenhouse gas emissions needed to feed them, and it links to food security for a growing population and to SDG 2 (zero hunger).
Yet the issue is not purely ecological. Livestock on rangeland convert grass that people cannot digest into food, and for many pastoralist communities, from the Maasai of East Africa to Sámi reindeer herders, animals are central to culture and livelihoods. Whether people have a duty to eat lower in the food chain, and whether it is fair to expect this equally of rich and poor, are ethical questions as well as scientific ones.
Sources: Our World in Data, “Land use per 1000 kcal” (Poore and Nemecek, 2018), downloaded October 2026.
Ecological efficiency is commonly around 10%, but the figure is neither fixed nor a true average. Measured values range roughly from below 5% to above 20%, depending on the ecosystem, the trophic level and the species. In Silver Springs it fell from 16.2% between producers and herbivores to 5.5% between carnivores and top carnivores.
Factor | Effect on ecological efficiency | Example |
|---|---|---|
Endotherms versus ectotherms | Mammals and birds respire much more energy to keep warm, so less is stored as tissue for the next level | The proportion of absorbed energy stored as growth is roughly ten times higher in ectotherms; a caterpillar stores about 18%, a squirrel eating acorns as little as 1.6% |
Digestibility of food | Indigestible material (cellulose, lignin, bone, fur) is egested, lowering efficiency | Herbivores eating woody plants are less efficient than predators eating soft-bodied prey |
Activity and life style | Active hunters and long-distance migrants respire more | Sharks and tuna versus sessile filter-feeders |
Type of ecosystem | Aquatic food chains, with small, soft, fast-growing producers and many ectotherms, often transfer more efficiently than terrestrial ones | Phytoplankton → zooplankton compared with trees → deer |
Sources: OpenStax, Biology 2e (2018).
The second law of thermodynamics can be stated in terms of entropy: in any energy transformation, the total entropy of a system and its surroundings increases. Concentrated chemical energy in glucose has low entropy; heat dispersed into the surroundings has high entropy. Every time energy passes along a food chain, part of it is converted to heat and the total entropy rises, which is another way of saying that useful energy is lost at every trophic level.
Living things are highly ordered: a cell, a tree or an elephant is a low-entropy structure. They stay organised only by constantly taking in high-quality energy and releasing low-quality heat. Most of this release happens in cellular respiration, which breaks complex molecules into simple carbon dioxide and water and gives out heat. The organism keeps its own entropy low at the cost of a larger increase in the entropy of its surroundings. When the supply of energy stops, the order cannot be maintained, and on death the body is broken down by decomposers into simple, disordered molecules.
At ecosystem scale, sunlight is a low-entropy input that sustains the complex, ordered structure of food webs; the heat leaving the ecosystem carries away the entropy produced. The increase in entropy as biomass passes through ecosystems is therefore the underlying reason for the shape of pyramids of energy, the shortness of food chains and the impossibility of recycling energy.
Energy and biomass appear in every part of the external assessment. Paper 1 often gives an unfamiliar food web, pyramid or energy-flow data and asks you to calculate efficiencies or productivity and explain the pattern. Paper 2 Section A tests definitions, short explanations and calculations, and Section B essays use the ideas in questions on food production, pollution and sustainability.
A data-based item might look like the next one. Read the units carefully: some questions give values per square metre per day, others per year.
The following resource is hypothetical, written for practice. It describes a lake in which an invasive fish has been introduced.
Trophic level | Organisms | Energy flow before introduction (kJ m⁻² yr⁻¹) | Energy flow 10 years after introduction (kJ m⁻² yr⁻¹) | Mercury in tissue after introduction (ppm) |
|---|---|---|---|---|
1 | Phytoplankton | 8,000 | 8,000 | 0.002 |
2 | Zooplankton | 960 | 960 | 0.01 |
3 | Small native fish | 96 | 60 | 0.08 |
4 | Predatory native fish | 8 | 2 | 0.4 |
4 | Invasive predatory fish | — | 9 | 0.6 |
Ecosystems are open systems: energy flows through them (in as light, out as heat), while matter is recycled by decomposers and producers.
The first law of thermodynamics says energy is conserved; the second law says every transformation degrades some energy to heat, so no transfer is 100% efficient.
Photosynthesis transforms light energy into chemical energy in glucose; cellular respiration releases it for cell processes and ends as heat.
Producers form the first trophic level; consumers include herbivores, predators, parasites, scavengers, detritivores, saprotrophs and decomposers.
Food chains and webs show energy and biomass flowing from producers to consumers; arrows point from food to feeder.
Energy is lost at each step because not all food is harvested, eaten or absorbed, and most absorbed energy is respired; NP = GP − R.
Typically 10% or less of the energy at one level reaches the next, which limits food chains to about four or five levels.
Pyramids of numbers and biomass show standing crop and can be inverted; pyramids of energy show flow per unit time and never are.
Persistent, fat-soluble pollutants such as DDT, PCBs and methylmercury bioaccumulate in organisms and biomagnify up food chains; microplastics can carry them.
Burning fossil fuels, deforestation, urbanisation and agriculture reduce biomass and photosynthetic capacity and disrupt food webs.
Autotrophs (photoautotrophs and chemoautotrophs) make carbon compounds; heterotrophs obtain them from others; vent food webs depend on chemosynthesis. (HL)
NPP and NSP are the maximum sustainable yields of a system; eating lower in the food chain supports more people per hectare; ecological efficiency varies and entropy rises at every transfer. (HL)
I can explain why an ecosystem is an open system in which energy flows and matter cycles.
I can state the first and second laws of thermodynamics and apply them to food chains.
I can write the word equations for photosynthesis and respiration and describe them as transformations.
I can describe the feeding strategies of consumers with an example of each.
I can construct food chains, food webs and energy flow diagrams from data.
I can calculate net productivity and the efficiency of energy transfer, with units.
I can construct pyramids of numbers, biomass and energy and explain inverted shapes.
I can explain bioaccumulation and biomagnification using DDT and the birds of prey of North America.
I can evaluate how human activities affect energy flows and matter transfers.
I can distinguish autotrophs from heterotrophs and photoautotrophs from chemoautotrophs. (HL)
I can calculate primary and secondary productivity from light and dark bottle, harvest and feeding data. (HL)
I can explain ecological efficiency, the benefit of eating lower trophic levels and the role of entropy. (HL)