Notes on 3.1 Biodiversity and evolution
Learning objectives
Outline biodiversity at the levels of habitat, species and genetic diversity.
Explain how each level of biodiversity contributes to the resilience of ecological systems.
Explain how evolution by natural selection produces biodiversity, using variation, overproduction, competition and differential survival.
Describe how speciation occurs when populations become isolated and adapt differently.
Distinguish between species richness and species evenness.
Calculate Simpson’s reciprocal index from sample data and use it to compare ecosystems and monitor change.
Evaluate ways of gathering biodiversity knowledge, including citizen science and parabiologists.
Explain how mutation, sexual reproduction and reproductive isolation lead to new species, with two contemporary examples. (HL)
Explain why biodiversity hotspots and island endemism occur. (HL)
Discuss how human activities and artificial selection alter selective pressures and genetic diversity. (HL)
Outline the geological timescale, the five mass extinctions and the evidence for a sixth. (HL)
Evaluate the case for and against the Anthropocene as a geological epoch. (HL)
Introduction
Biodiversity is the variety of life, from the genes inside one population to the range of habitats across a whole region. It matters because ecosystems with more biodiversity tend to keep working when they are disturbed, and because people depend on that variety for food, medicines, materials and cultural life.
All of this variety is the product of evolution over about 3.5 billion years. Studying biodiversity therefore joins two ideas: how living diversity arose through natural selection and speciation, and how it can be measured, so that changes caused by human activity can be detected and managed. Seen as a system, biodiversity is a storage built up by slow evolutionary inputs and depleted much faster by extinction; different perspectives give it intrinsic, economic or cultural value.
What biodiversity is
The word biodiversity is short for “biological diversity”. It describes how many different kinds of living things there are, and how different they are from each other. Ecologists study it at three levels, because variety exists at the scale of whole landscapes, of the species that live in them, and of the individuals within each species.
Habitat diversity
A habitat is the place where a species normally lives. An area with many kinds of habitat (rocky shore, sand dune, salt marsh, woodland) offers many different sets of conditions and resources, so it can support many different communities of species. Habitat diversity is therefore the broadest level, and losing a whole habitat removes every species that depends on it.
Species diversity
A species is a group of organisms that can interbreed to produce fertile offspring. Species diversity depends on two things: how many species are present and how evenly the individuals are shared among them. A woodland with 20 tree species, each fairly common, is more diverse than one with 20 species in which a single species makes up almost every tree.
Genetic diversity
Individuals of the same species are not identical. They carry different versions (alleles) of the same genes, which is why people differ in height or blood group and why wheat plants differ in resistance to disease. Genetic diversity is the range of these genes and alleles within a species. A species with high genetic diversity contains individuals that respond differently to drought, disease or heat, so some are likely to survive a change that kills others.
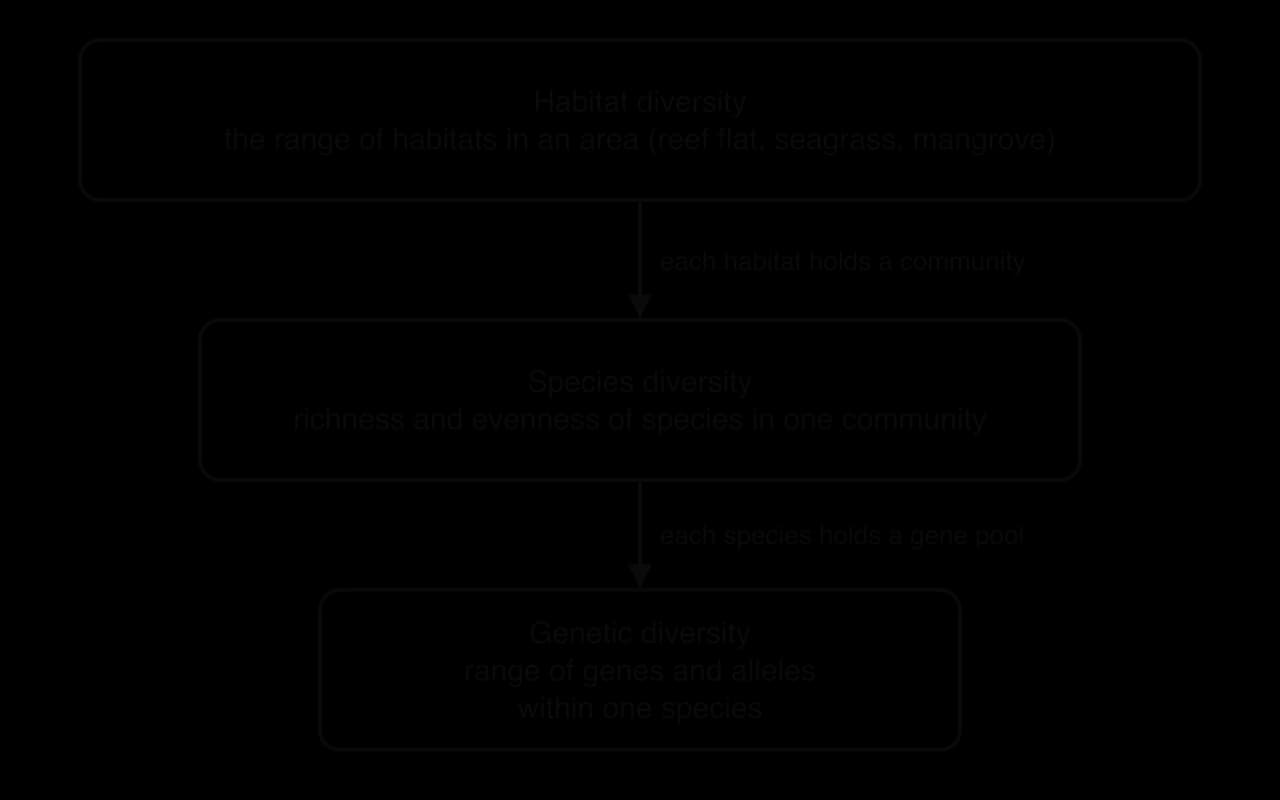
A coral reef such as the Great Barrier Reef shows all three levels in one place. Its habitat diversity includes reef crest, lagoon, seagrass meadow and mangrove fringe; its species diversity includes corals, fish, molluscs and algae in many combinations; and within a single coral species, colonies differ genetically in how well they tolerate warm water. A complete picture of the reef’s biodiversity needs all three.
Level | What varies | Example of high diversity | How it is usually measured |
|---|---|---|---|
Habitat | Types of habitat or ecosystem in an area | A coastline with dunes, salt marsh, mudflat and rocky shore | Mapping and counting habitat types, often from satellite images |
Species | Number of species and their relative abundance | A tropical rainforest plot with hundreds of tree species | Sampling and a diversity index such as Simpson’s reciprocal index |
Genetic | Genes and alleles within a species | A wild rice population with many locally adapted varieties | DNA analysis, or differences in heritable traits |
Biodiversity and resilience
Resilience is the capacity of a system to resist damage and to recover from, or adapt to, a disturbance, so that it avoids crossing a tipping point. Ecosystems with more biodiversity are generally more resilient, and each of the three levels contributes in a different way.
How each level adds resilience
Genetic diversity gives a population the raw material to survive change. When a new disease, a hotter summer or a drought arrives, individuals that carry resistant alleles survive and reproduce, and the population can adapt over generations. A genetically uniform population may be wiped out by a single pathogen.
Species diversity means that several species often carry out similar roles, such as pollination, grazing or nitrogen fixation. If one species declines, another can partly take over its role, so the ecosystem keeps functioning. More species also means more links in the food web, so consumers can switch to other prey when one food source fails.
Habitat diversity provides refuges and sources of recolonisation. After a fire, flood or storm, species can survive in undamaged habitats nearby and spread back into the disturbed area.
Larger storages and more interconnections make a system harder to push past a tipping point. A diverse grassland with many grass and herb species usually loses less of its productivity in a drought than a sown pasture of one grass, because some species tolerate dry conditions better than others. The same reasoning applies to human food systems, forests managed for timber and fisheries.
Evolution: where biodiversity comes from
The roughly two million species that scientists have described, and the many more not yet named, all descend from early single-celled life. The process that produced them is evolution, the gradual change of populations over many generations. Biodiversity arises from evolution in two ways: populations change to fit their environments, and populations split into separate species.
Three words in this definition are essential. “Cumulative” means that small changes add up over time. “Heritable” means only characteristics that are passed on in genes count: a muscle built by exercise or a scar from an injury is not inherited and does not evolve. “Population or species” means that evolution is a change in a group, measured as a change in how common certain characteristics or alleles are.
Natural selection is the main mechanism that drives evolutionary change. It operates continuously, in every generation of every population, and over time spans of up to billions of years. Small changes in each generation, repeated over thousands or millions of generations, are enough to produce the whole range of living things, from bacteria to whales.
How natural selection works
Charles Darwin and Alfred Russel Wallace proposed natural selection independently in 1858. Their explanation rests on a few observations that can be checked in any population, and on the conclusions that follow from them. Each step depends on the one before.
The steps of natural selection
Variation. Individuals in a population differ in their characteristics, such as beak size, colour or resistance to disease. Much of this variation is genetic, so it is heritable.
Overproduction. Organisms produce more offspring than the environment can support. A cod can release millions of eggs a year, and even slow-breeding elephants could increase rapidly if all young survived.
Competition for limited resources. Because resources such as food, water, space, light and mates are limited, individuals compete for them and many die before they reproduce. This links directly to carrying capacity.
Differences in adaptation affect survival and reproduction. Individuals whose variations suit the current environment are more likely to survive and to reproduce. The factor that makes the difference is called a selective pressure.
Inheritance. The survivors pass their advantageous alleles to their offspring.
Change over generations. The advantageous alleles and characteristics become more frequent in the population. Repeated over many generations, this produces adaptations and can change the population a great deal.
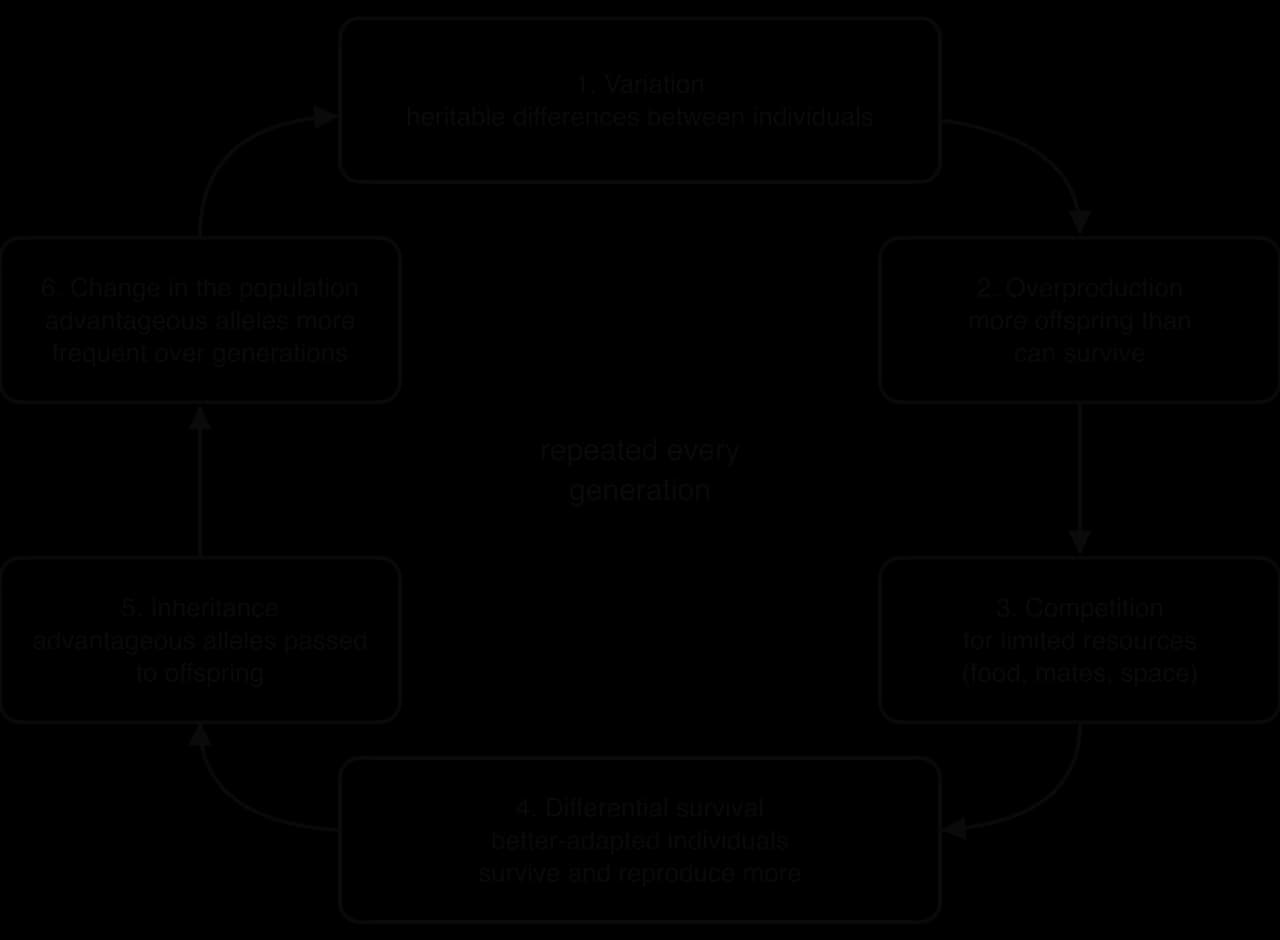
Selective pressures can be abiotic, such as temperature, drought or salinity, or biotic, such as predators, parasites, disease and competitors. A change in the environment changes which variations are favoured. If the environment then changes back, selection can reverse direction, as the finches of Daphne Major show.
Directional change in a population
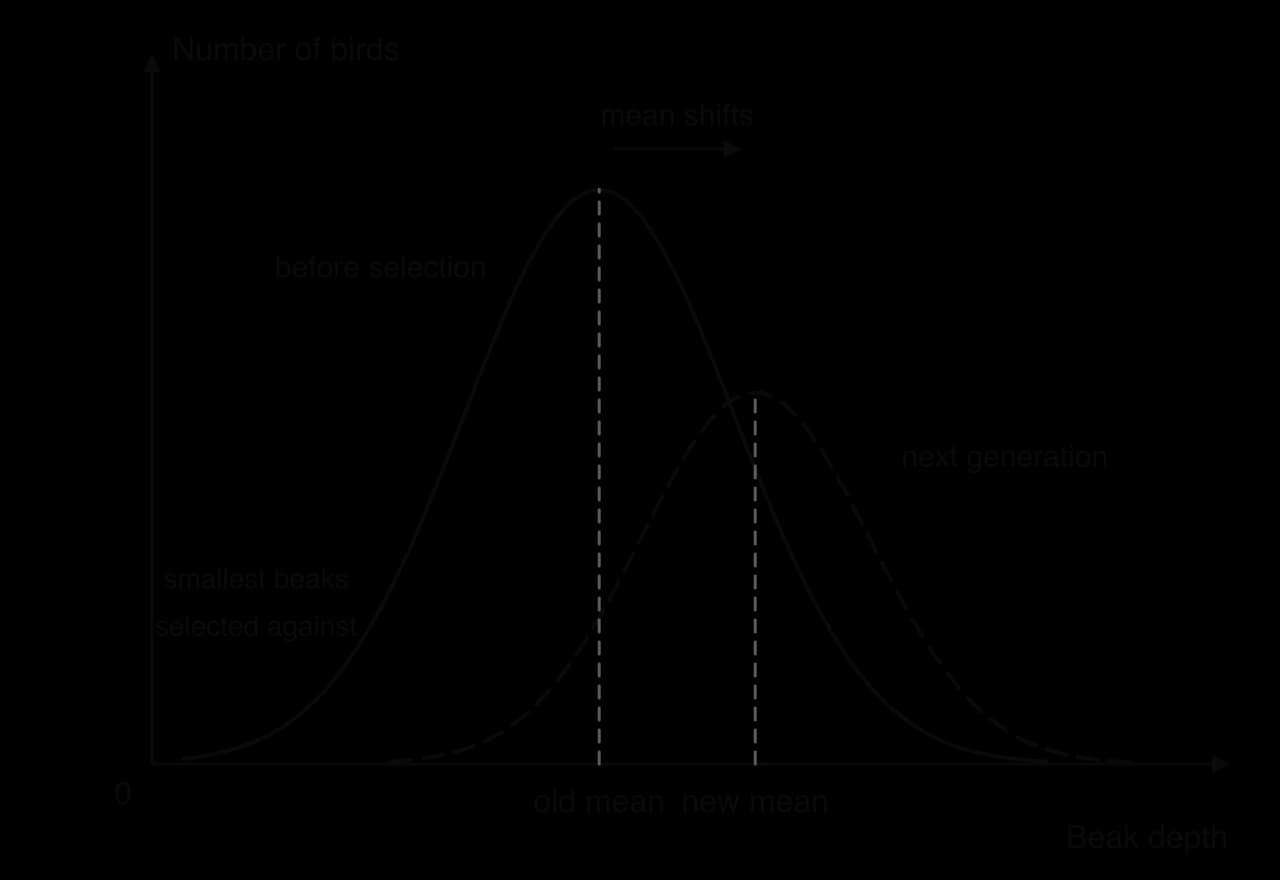
When one extreme of a characteristic is favoured, the average of the population shifts in that direction over generations. This is called directional selection. If individuals with larger beaks survive a drought better, the next generation has a larger mean beak size, although small-beaked and large-beaked individuals are both still present.
The peppered moth
The peppered moth, Biston betularia, occurs in a pale speckled form and a dark (melanic) form. The first dark moth was recorded in Manchester in 1848, during the Industrial Revolution, when soot from burning coal had blackened tree trunks and killed the pale lichens on them. By 1895 about 98% of the peppered moths around Manchester were dark. Birds found and ate the pale moths more easily on the dark bark, so the dark allele became more frequent.
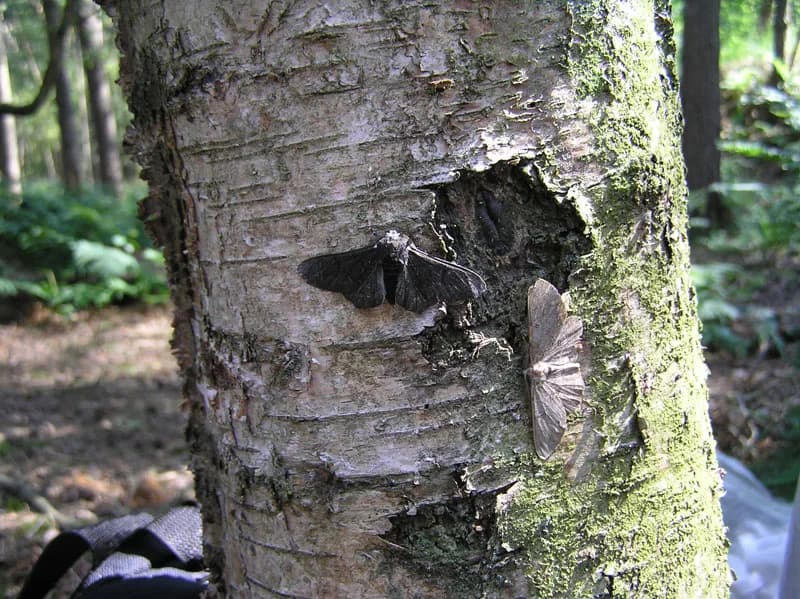
After clean air laws reduced soot from the 1950s onwards, lichens returned and the pale form became common again. A six-year field study near Cambridge, published in 2012 and using 4,864 moths, confirmed that birds ate more of the moths that did not match their background. The example shows natural selection acting on existing heritable variation, with the direction of selection set by the environment.
 YouTube
Speciation: how new species form
Natural selection changes populations. Speciation is what happens when the changes go far enough that one species becomes two. It is the process that has multiplied the number of species on Earth and is therefore the direct source of species diversity.
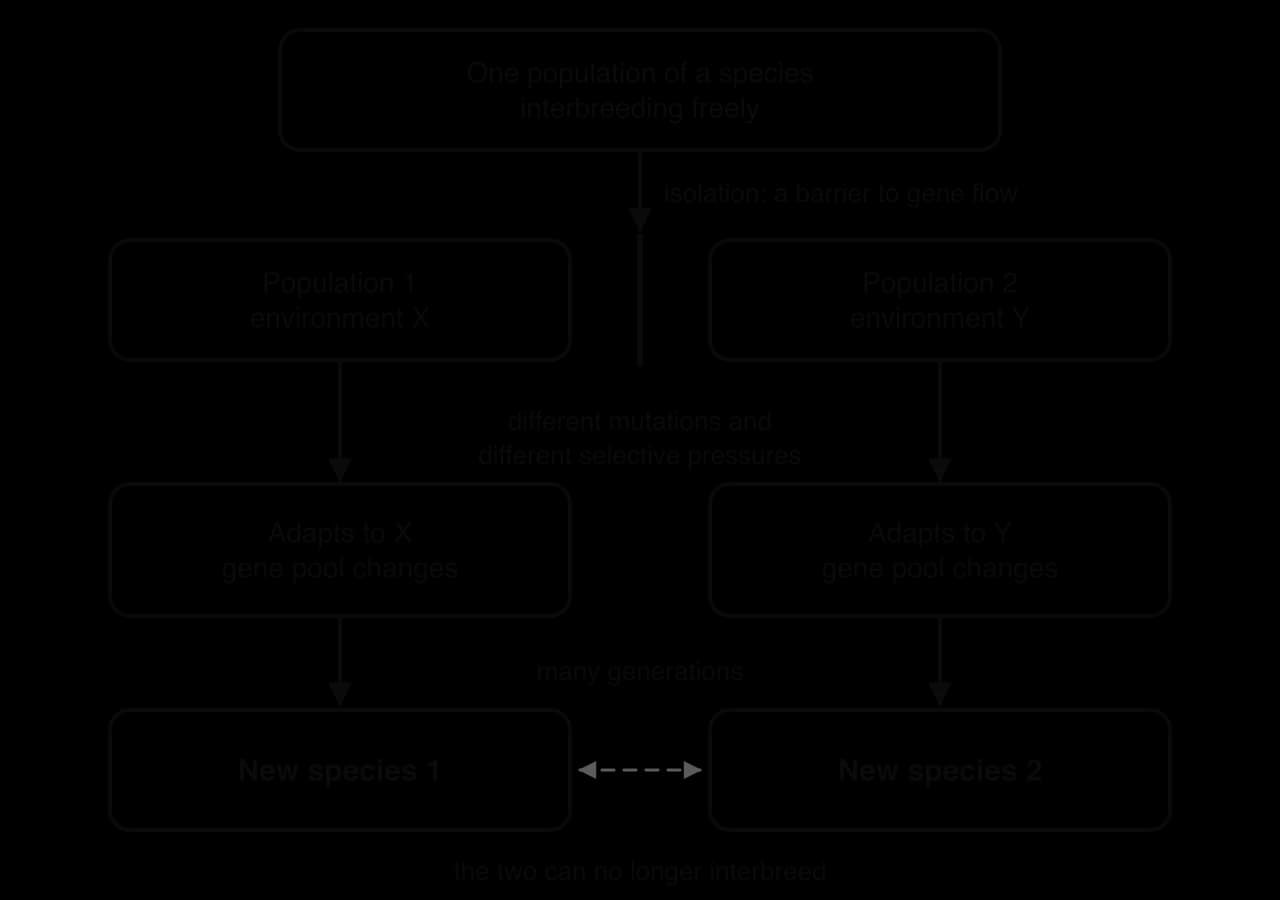
The stages of speciation
Isolation. A population becomes separated from the rest of its species, so that individuals in the two groups no longer interbreed. Gene flow between them stops.
Different conditions. The separated populations live under different conditions: different climate, food, predators or competitors. Each therefore experiences different selective pressures.
Different evolution. Natural selection favours different variations in each population, and new variations that arise in one population do not spread to the other. Over many generations their gene pools become increasingly different.
Reproductive isolation. Eventually the populations are so different (in genes, anatomy, timing of breeding or courtship behaviour) that, even if they meet again, they cannot interbreed to produce fertile offspring. They are now separate species.
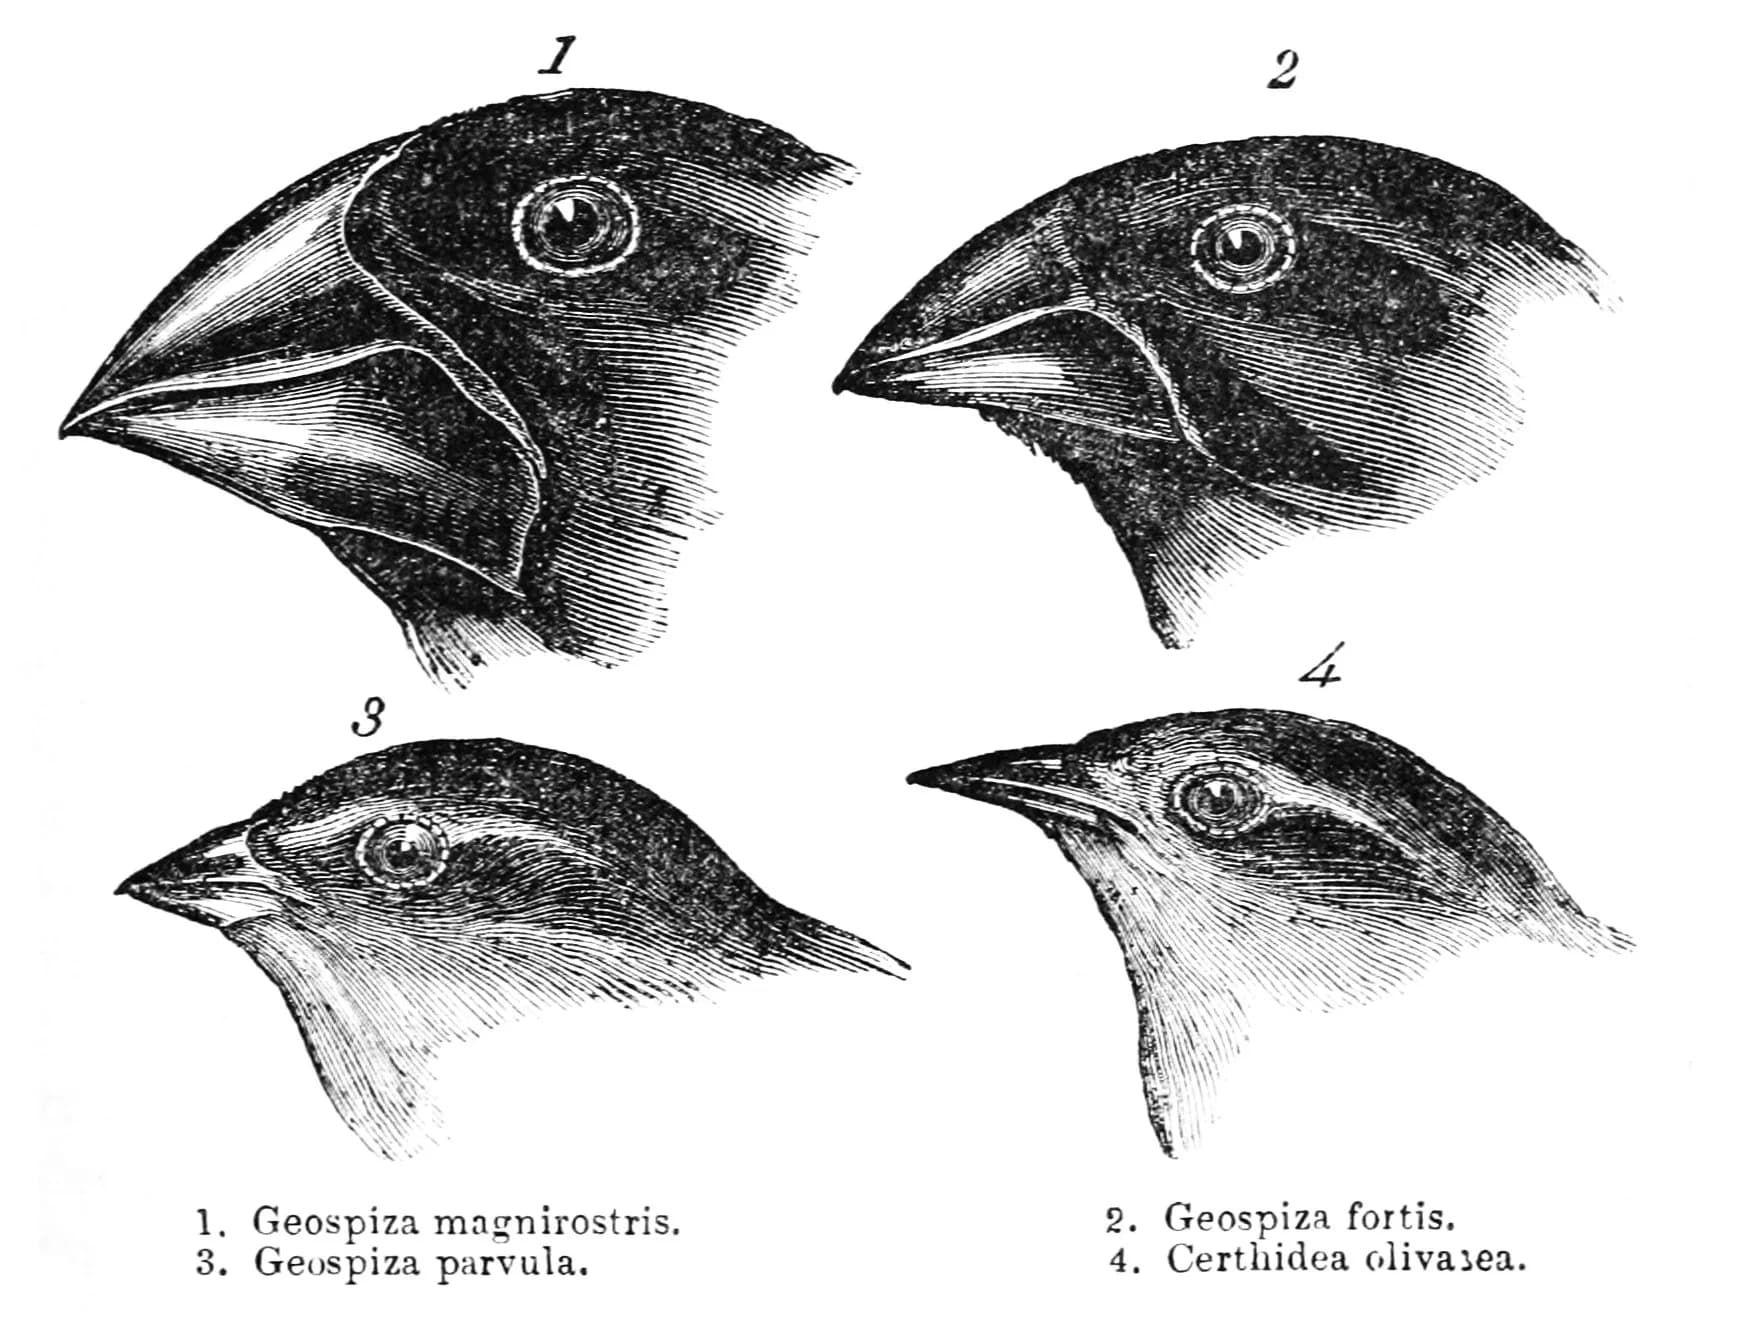
The Galápagos finches are the classic example. Their ancestors reached the islands from South America, and populations on different islands adapted to different foods. The result is a group of closely related species whose beaks range from the heavy, nut-cracking beak of the large ground finch to the thin, probing beak of the warbler finch. The rise of many species from one ancestor, each adapted to a different niche, is called adaptive radiation.
Species richness and species evenness
Comparing the biodiversity of two places needs a way to measure species diversity. Two separate properties matter. The first is how many species are present. The second is how the individuals are shared among those species.
Richness is the simplest measure to collect: it only requires listing the species found. It says nothing about how common each one is.
Richness alone can mislead. Two communities can contain the same four species and the same total number of individuals, yet be very different. In the first, each species is equally common. In the second, one species dominates and the others are rare, so a visitor would mostly encounter just one species.
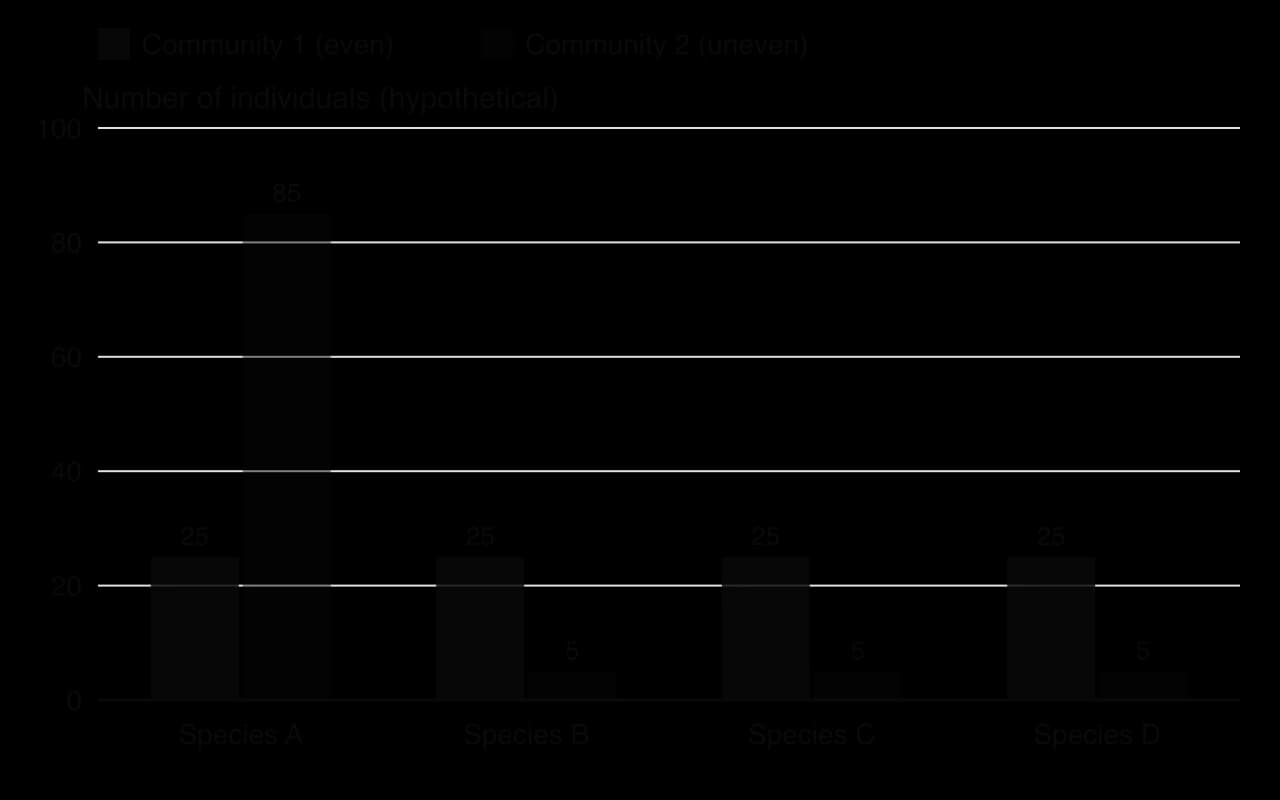
Evenness matters for biodiversity because rare species are more vulnerable. A species represented by five individuals can disappear after one bad season, while a dominant species usually persists. An uneven community often indicates that something, such as pollution, grazing, trampling or an invasive species, is favouring one tolerant species at the expense of others. High evenness usually indicates a more stable, less disturbed community in which many species share resources.
Simpson’s reciprocal index
A diversity index combines richness and evenness into a single number, so that communities can be compared fairly and changes can be tracked over time. The most widely used index in environmental studies at this level is Simpson’s reciprocal index, symbol .
is the total number of individuals of all species in the sample.
is the number of individuals of a single species.
(sigma) means “the sum of”: is worked out for every species and the results are added.
What the value means
The index is based on probability. The bottom line, divided by the top line, is the chance that two individuals picked at random from the sample belong to the same species. When one species dominates, that chance is high, so its reciprocal is low. When many species are equally common, the chance is low and is high.
D = 1 is the lowest possible value. It occurs when every individual in the sample belongs to one species, so there is no diversity at all.
Higher D means higher diversity. For a perfectly even community, D is close to (slightly above) the number of species, so a sample of four equally common species gives a D of just over 4.
D has no units, because it is a ratio of two numbers of individuals.
Calculating D step by step
A table is the clearest way to organise the working when there are several species. Writing each in its own column makes errors easy to spot, and a species with only one individual contributes to the sum but still counts towards .
Monitoring change over time
Because D summarises a whole community in one number, it is useful for monitoring. A falling value at the same site over several years suggests that a disturbance is reducing evenness, richness or both. A rising value after a management change, such as fencing out livestock or restoring a wetland, is evidence that the management is working.
Sampling to compare diversity fairly
A diversity index is only as good as the sample it comes from. The sampling methods themselves (quadrats, transects, pitfall traps, sweep nets) are those used for population studies. For a fair comparison of two sites, the samples must be collected in the same way.
Same type of organism. Compare ground plants with ground plants, or stream invertebrates with stream invertebrates. A value for birds cannot be compared with a value for plants.
Same ecosystem type. Comparing a sand dune with a rainforest says little about human impact, because the two would differ greatly even if both were undisturbed.
Same method and effort. Use the same quadrat size, number of quadrats, trap type and sampling time at each site. More effort usually finds more species.
Random sampling within each site, to avoid bias towards areas that look interesting.
Same season and conditions, since many organisms are active or visible only at certain times of year or day.
Consistent identification. Use the same dichotomous key or app, or the same person, so that species are not confused or split differently at each site.
Strengths and limitations of the index
Strengths | Limitations |
|---|---|
Combines richness and evenness in one number, so sites can be ranked and compared | Two very different communities can give the same value, so the species list should be kept alongside D |
Simple to calculate from counts, with no need to name species formally, only to tell them apart | Treats all species as equal: a rare endemic species counts the same as a common weed |
Allows change at one site to be monitored over time with the same method | Sensitive to sampling effort, identification errors and the time of year |
Less affected by very rare species than richness alone, so a single chance find does not change it much | Hard to apply to organisms that cannot be counted as individuals, such as grasses and mosses, unless percentage cover is used instead |
Gathering biodiversity knowledge
Effective conservation depends on knowing what lives where, how many there are and whether numbers are rising or falling. Global and regional data show which species and habitats are most threatened and where protection would achieve most. These large datasets are built from many local surveys, collected by people with very different levels of training.
Who collects the data
Government-funded agencies and universities run national monitoring schemes, herbaria and museum collections, and long-term research sites. Their data are usually the most consistent, but funding is limited and is concentrated in wealthier countries.
Voluntary organisations (charities and conservation NGOs) organise surveys of birds, butterflies, bats or plants, often using trained volunteers who repeat the same counts every year.
Citizen science, in which members of the public record observations, usually with smartphone apps. By October 2026 the iNaturalist platform held more than 358 million verifiable observations from over 5 million observers, and the Global Biodiversity Information Facility (GBIF), which combines records from thousands of institutions and projects, held almost 4 billion occurrence records.
Parabiologists (also called parataxonomists): local people trained to collect, sort and record specimens. The approach began in the late 1980s, when Daniel Janzen and Winnie Hallwachs trained the first group in Costa Rica in 1989 for the national biodiversity institute (INBio). Work in the Área de Conservación Guanacaste, where many parataxonomists have been employed, has led to about 10,000 new species being identified there by 2017.
Indigenous peoples and local communities, whose traditional ecological knowledge of species, seasons and habitats has been built up over generations and can be recorded and combined with scientific surveys when communities agree to share it.
Sources: iNaturalist and GBIF public data counts (accessed October 2026); Wikipedia, “Parataxonomist” (2026).
Evaluating the methods
Method | Strengths | Limitations |
|---|---|---|
Professional surveys | Accurate identification; standard methods; long-term records | Expensive; few sites; experts concentrated in wealthier countries |
Citizen science | Huge numbers of records over wide areas and long periods; low cost; builds public awareness and support | Records cluster near cities and roads and on attractive species such as birds; identification errors; uneven effort over time |
Parabiologists | Cover remote, species-rich places; create local jobs and skills; combine local knowledge with scientific methods | Need training and long-term funding; data quality depends on supervision and expert checking |
Indigenous and local knowledge | Long time depth; detailed knowledge of species use and seasonal change | May not be written down or match scientific categories; questions of consent and who benefits from the knowledge |
Biodiversity knowledge is unequal. Most species live in tropical countries, yet much of the funding, specialist training and published research has been based in Europe and North America, and well-studied groups such as birds and mammals receive far more attention than insects, fungi or soil organisms. Training parabiologists and supporting local scientists in tropical countries is one way to close this gap, and it gives the communities who live alongside biodiversity a greater role in decisions about it. Who owns biodiversity data, and who benefits from it, is a question of environmental justice as well as of science.
Case study: natural selection in Darwin’s finches on Daphne Major
Context
Daphne Major is a small volcanic island in the Galápagos archipelago, Ecuador, about 1,000 km west of the South American mainland. It has no permanent human population and very little vegetation, so the number of seeds available to birds depends almost entirely on rain in a short wet season. Its main resident is the medium ground finch, Geospiza fortis, which feeds mostly on seeds and cracks them with its beak.
In 1973 the biologists Peter and Rosemary Grant began what they planned as a two-year study of the island’s finches. It became one of the longest continuous studies of a wild animal population. Every year they caught, measured and ringed almost every finch on the island, recorded which birds bred with which, and measured the seeds available. Because they knew the parents of each bird, they could also show that beak size is strongly heritable.
What happened
Drought of 1977. Only 24 mm of rain fell during the 1977 wet season. Few plants produced seeds, and the small, soft seeds that medium ground finches normally prefer were soon eaten. The remaining food was mostly large, hard seeds, which only birds with deep, strong beaks could crack. The population of medium ground finches fell from about 1,400 to a few hundred birds within about two years. Survival was not random: large birds with deep beaks survived best.
El Niño of 1982–83. An El Niño event brought about eight months of heavy rain instead of the usual two. Plants with small seeds spread across the island. Now birds with smaller beaks, which handle small seeds more efficiently, had the advantage, and the average beak size of the population fell by about 2.5%. Selection had reversed direction because the environment had changed.
Drought of 2004. By this time the large ground finch, Geospiza magnirostris, had settled on the island (it established a breeding population there in the early 1980s). During the 2004 drought it out-competed the medium ground finch for the large seeds. Medium ground finches with the largest beaks, which overlapped most with their larger competitor, died in greater numbers, and selection favoured smaller beaks. This shift, in which competition between two species drives them to become more different, is called character displacement.
Data
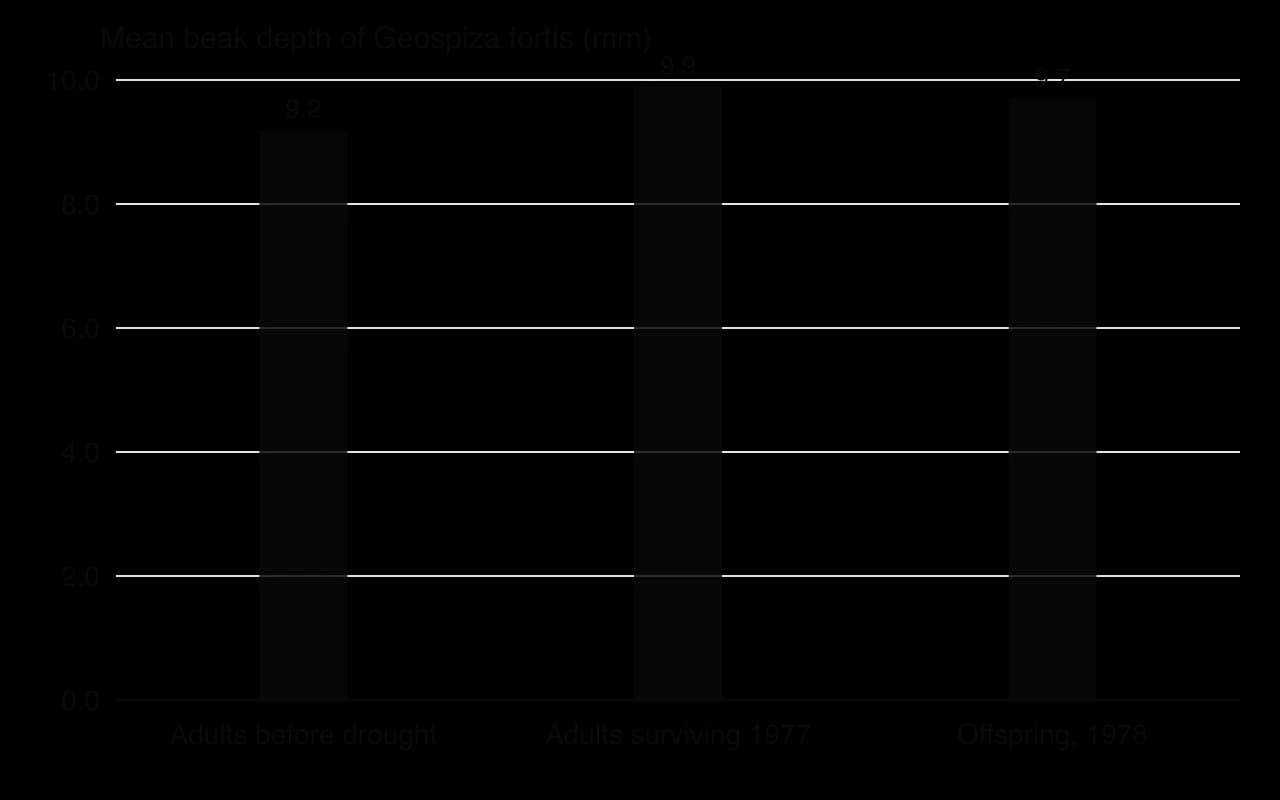
Measurements of the medium ground finch before and after the 1977 drought show natural selection directly. The survivors had deeper beaks on average than the population before the drought, and their offspring, hatched in 1978, inherited deeper beaks than the pre-drought generation.
Event | Change in seed supply | Variation favoured | Effect on the population |
|---|---|---|---|
1977 drought (24 mm rain) | Small seeds used up; large, hard seeds left | Larger, deeper beaks | Population fell from about 1,400 to a few hundred; mean beak depth rose by about 0.7 mm |
1982–83 El Niño (about 8 months of rain) | Abundant small, soft seeds | Smaller beaks | Mean beak size fell by about 2.5% |
2004 drought, with large ground finches present | Large seeds taken by a stronger competitor | Smaller beaks | Large-beaked medium ground finches died more often: character displacement |
Sources: The Open University, OpenLearn, “Natural selection in Darwin’s finches” (accessed 2026); Wikipedia, “Medium ground finch” and “Peter and Rosemary Grant” (2026); Boag and Grant, _Science 214 (1981)._
Interpretation and evaluation
The Daphne Major study is strong evidence for natural selection because every step can be measured in the field. Variation in beak depth was recorded for nearly every bird; heritability was shown by comparing parents and offspring; overproduction and competition were visible as many young birds died when seed ran short; and differential survival was linked to beak depth by recording which individuals lived. The change in the next generation then showed inheritance.
The study also has limits. It concerns one small island and a few species, so its findings may not apply to large, mobile populations elsewhere. Selection in one direction was often reversed a few years later, so over three decades the population fluctuated rather than changing steadily. Whether the Big Bird lineage is truly a new species is debated, since it is recent and some hybridisation may still occur.
Perspective | How Daphne Major is seen |
|---|---|
Scientific | A natural laboratory where long-term data can test evolutionary theory; the value of decades of monitoring over short studies |
Ecocentric | An intact island ecosystem with intrinsic value, worth protecting from introduced species and disturbance |
Anthropocentric and economic | Part of the Galápagos brand that draws large numbers of tourists to Ecuador; the islands’ evolutionary story has economic value |
Conservation management | Strict access rules for uninhabited islands such as Daphne Major limit the risk of introducing invasive species or disease |
What it shows
The finches demonstrate every part of natural selection (variation, overproduction, competition for limited resources and differential survival and reproduction), and show that it can be measured within a few years when the selective pressure is strong. Selection follows the environment, so a change in rainfall can reverse its direction. Competition between species can push them apart, which is one route by which biodiversity increases. The Big Bird lineage suggests how isolation of a small group can begin the formation of a new species. Long-term data sets such as this are themselves a form of biodiversity knowledge that conservation relies on.
Sources: Grant and Grant, long-term Daphne Major study (1973–2012); The Open University (accessed 2026); Wikipedia (2026).
Mutation, sexual reproduction and genetic diversity (HL only)
Natural selection can only act on variation that already exists. Two processes supply it. Mutation is the original source of every new allele; sexual reproduction does not create new alleles but produces new combinations of existing ones in every generation.
Mutations happen by chance, when DNA is copied with errors or is damaged by radiation or certain chemicals. Most have no noticeable effect, some are harmful, and a few happen to be beneficial in a particular environment. A mutation does not arise because an organism needs it. The dark form of the peppered moth, for example, is caused by a mutation in which a piece of mobile DNA was inserted into a gene that affects wing colour; it became common only because the environment later favoured it.
In sexual reproduction each parent passes on only half of its alleles, chosen at random when gametes are made, and gametes from two different parents combine at fertilisation. Each offspring is therefore genetically unique (except identical twins). Species that reproduce only asexually, such as banana plants grown from cuttings, produce offspring that are almost genetically identical to the parent, so the variation available to selection is very small.
Process | What it does to genetic diversity | How often |
|---|---|---|
Mutation | Creates new alleles that did not exist before | Rare per gene, but frequent across a whole genome and population |
Sexual reproduction | Reshuffles existing alleles into new combinations in every offspring | Every generation |
Natural selection | Changes the frequency of alleles; can reduce diversity by removing unfavoured alleles | Continuously |
Reproductive isolation and contemporary speciation (HL only)
A new species forms only when gene flow between populations stops for long enough for them to diverge. Reproductive isolation can arise in several ways, which fall into two groups: separation by geography, or separation within the same area through differences in ecology or behaviour.
Type of isolation | How it stops gene flow | Example |
|---|---|---|
Geographical isolation | A physical barrier such as a river, sea, mountain range or gap in habitat separates the populations | Bonobos and common chimpanzees on opposite sides of the Congo River |
Ecological isolation | Populations in the same area use different habitats, foods or hosts, so they rarely meet to mate | Apple-feeding and hawthorn-feeding flies that mate on different fruit |
Behavioural isolation | Differences in courtship, song, mating time or mate choice mean individuals do not recognise each other as mates | Differences in song between the Big Bird finch lineage and the resident species; flies emerging at different times of year |
Speciation that follows geographical isolation is called allopatric speciation (“other homeland”). Speciation without a physical barrier, through ecological or behavioural isolation inside the same area, is sympatric speciation (“same homeland”). Allopatric speciation is thought to be the more common route, because a physical barrier stops gene flow completely.

Bonobos and chimpanzees: allopatric speciation
The bonobo, Pan paniscus, and the common chimpanzee, Pan troglodytes, are the closest living relatives of humans and of each other. Bonobos live only south of the Congo River, in the Democratic Republic of the Congo, while chimpanzees live to the north and across central and West Africa. Neither species swims well, so the wide river forms a barrier to gene flow. Genetic studies estimate that the two lineages split about 0.9 million years ago.
Once separated, the populations evolved differently. Bonobos live in groups in which females are dominant and conflicts are often settled without violence, and they eat mostly fruit; chimpanzees live in male-dominated groups and eat a wider range of foods, including meat. Genetic data show that small amounts of interbreeding occurred at least twice within the last 550,000 years, which is a reminder that speciation is gradual. Today the two species do not meet in the wild, because the river keeps them apart.
The apple maggot fly: sympatric speciation in progress
The fly Rhagoletis pomonella is native to North America, where it laid its eggs in the fruit of hawthorn trees. Apple trees were introduced by European settlers, and between about 1800 and 1850 some flies began to use apples instead. These flies live in the same places as the hawthorn flies, so there is no physical barrier between them.
Two differences keep the groups apart. The flies mate on the fruit of their host tree, so apple flies mostly meet other apple flies. Apples also ripen earlier than hawthorn fruit, and apple flies now emerge as adults earlier in the year. Gene flow between the two “host races” has fallen, and they differ genetically. They are not yet fully separate species, which makes the fly an example of sympatric speciation observed while it is happening.
Islands and endemism
An endemic species is one found naturally in only one place. Isolated islands have unusually high proportions of endemic species, for several linked reasons:
Few colonists arrive across the sea, so each founding population is small and genetically different from the mainland population.
Isolation stops gene flow with the mainland, so island populations evolve independently.
Many niches are empty because mainland competitors and predators never arrived, so colonists can diversify into them (adaptive radiation, as in the Galápagos finches).
Each island in an archipelago can act as a separate isolated population, multiplying the number of species.
Madagascar has been separated from India for about 88 million years and from Africa for far longer. More than 80% of its 14,883 plant species, over 90% of its reptile species and more than 60% of its mammal species are found nowhere else; all of its lemurs, more than 100 species and subspecies, are endemic. The same isolation that produced so many species makes them vulnerable: an endemic species has no population elsewhere to recolonise from if it is lost.
Sources: Wikipedia, “Bonobo”, “Rhagoletis pomonella” and “Wildlife of Madagascar” (2026).
Biodiversity hotspots (HL only)
Species are not spread evenly across the Earth. Diversity is generally highest near the equator and declines towards the poles, and within each latitude it is highest in warm, wet, structurally complex habitats such as tropical rainforests and coral reefs. In 1988 and 2000 the ecologist Norman Myers proposed that conservation should concentrate on places that are both exceptionally rich in endemic species and seriously threatened.
Thirty-six regions now meet this definition, including Madagascar and the Indian Ocean Islands, Sundaland, the Tropical Andes, the Atlantic Forest of Brazil, the Western Ghats and Sri Lanka, and the Cape Floristic Region of South Africa. Together they cover only about 2.4% of the Earth’s land surface but support nearly 60% of the world’s plant, bird, mammal, reptile and amphibian species, a large share of them endemic.
Many hotspots are tropical for reasons that combine climate and history. High temperatures, abundant rainfall and year-round sunlight give high net primary productivity and many niches; tropical regions were less disturbed by the ice ages, so lineages have had longer to diversify; and complex forest structure creates many microhabitats. Several hotspots, such as the Cape Floristic Region, the Mediterranean Basin and California, are not tropical but have unusual climates or long isolation.
Arguments for focusing on hotspots | Arguments against relying on them alone |
|---|---|
Protects a large share of species, especially rare and endemic ones, on a small area | Based mainly on plants; areas rich in other groups may be missed |
Directs limited funding where threat and irreplaceability are both high | Ignores the cost of conservation, which varies greatly between places |
Easy to communicate to governments and donors | Overlooks species-poor but important ecosystems (tundra, open ocean) and ecosystem services elsewhere |
Sources: Wikipedia, “Biodiversity hotspot” (2026); Myers et al., _Nature 403 (2000)._
Human activities as selective pressures (HL only)
Humans now set many of the selective pressures that wild populations face. Hunting and harvesting remove individuals with particular traits; pollution and climate change alter the conditions organisms must tolerate; and cities, farmland and reservoirs create habitats that did not exist before. When the pressure is strong and consistent, populations can evolve within decades.
Hunting, poaching and harvesting remove the individuals people want most, such as those with large tusks, horns or bodies. Heavy fishing tends to favour fish that mature at a smaller size and younger age, because large fish are caught before they breed.
Climate change shifts the timing of seasons and the temperature range, favouring individuals that breed earlier or tolerate heat.
Pollution created a dark background for peppered moths and favoured the dark form; pesticides and antibiotics favour resistant insects and bacteria.
New habitats such as cities favour individuals that tolerate noise, light and people.
Tuskless elephants in Gorongosa
Gorongosa National Park in central Mozambique lost most of its large animals during the civil war from 1977 to 1992. Both sides killed elephants for ivory to pay for weapons and supplies, and by 1992 the park’s elephant population had fallen by more than 90%. Tusks are the target of poachers, so tusked elephants were far more likely to be killed than tuskless ones.
A small proportion of female African elephants are naturally born without tusks, usually about 2% where there is little poaching. In Gorongosa the proportion of tuskless females was about 18.5% before the war and rose to about one in two among the females that survived it. Among females born after the war (1995–2004), about one in three was tuskless, compared with about one in five born before the war. A study published in 2021 linked tusklessness to a dominant mutation on the X chromosome, involving the gene AMELX, which is passed from mothers and appears to be lethal to male embryos.
Group of female elephants | Share tuskless |
|---|---|
Typical African population with little poaching | About 2% |
Gorongosa, before the war (1977) | About 18.5% |
Gorongosa, females that survived the war | About 50% |
Gorongosa, females born 1995–2004 | About 33% |
Sources: Campbell-Staton et al., _Science 374 (2021), as reported by ScienceAlert (2021); Wikipedia, “Gorongosa National Park” (2026)._
The case shows human hunting acting as a strong selective pressure: in a few decades it changed a prominent trait of a keystone species. Tusks are used to dig for water and minerals and to strip bark, so a mostly tuskless population may affect vegetation and other species differently, and because the allele kills male embryos, it may also affect the population’s growth. From an ethical perspective, the change raises the question of whether humans have a duty to reverse evolutionary harm they have caused; from an economic perspective, it shows that ivory revenue carried hidden long-term costs.
Artificial selection and genetic resilience (HL only)
For about 10,000 years farmers have chosen which plants and animals to breed from, keeping seeds from the highest-yielding plants and breeding from the most productive cows. This deliberate choice has produced modern wheat, maize, rice, cattle and dogs from wild ancestors.
Natural selection | Artificial selection | |
|---|---|---|
What chooses | The environment (selective pressures) | Humans, deliberately |
Traits favoured | Those that increase survival and reproduction in the wild | Those useful to people (yield, size, taste, docility), even if they reduce survival in the wild |
Effect on genetic diversity | Usually maintains some diversity, because environments vary | Usually reduces it, because a few chosen individuals provide most of the next generation |
Speed | Usually slow, faster under strong pressure | Can be rapid, over a few generations |
Artificial selection narrows the gene pool. Breeders select from a small number of the best individuals, and many crops are now grown as a few high-yielding varieties, or even as clones. A crop that is genetically uniform has no resistant individuals when a new disease or pest arrives, so the whole crop can fail at once.
Bananas and potatoes
Bananas for export are grown from cuttings, so all plants of one variety are almost genetically identical. Until the mid-20th century the export trade relied on the Gros Michel variety, which was almost wiped out in commercial plantations during the 1950s by a soil fungus causing Panama disease (Race 1). The industry switched to the resistant Cavendish, which now makes up around 99% of bananas exported to developed countries. A new strain, Tropical Race 4, discovered in Taiwan in 1989, attacks Cavendish; it reached Colombia in 2019, and no fungicide controls it.
In Ireland in the 1840s, a large share of the potatoes grown were of one variety, the Lumper, propagated from tubers rather than seed. When potato blight (Phytophthora infestans) arrived in 1845, it spread rapidly through the uniform crop. Genetic uniformity was only one cause of the famine that followed: dependence on a single crop, poverty, land ownership and the export of other food from Ireland all turned crop failure into disaster, in which about one million people died and over one million emigrated.
Sources: Wikipedia, “Panama disease”, “Cavendish banana” and “Great Famine (Ireland)” (2026).
The value of genetic diversity
Perspective | Why genetic diversity is valued |
|---|---|
Economic | Wild relatives and traditional varieties carry alleles for disease resistance, drought tolerance and yield that breeders use to protect harvests worth billions of dollars; seed banks store them as insurance |
Environmental | Genetic diversity is the basis of resilience: diverse populations can adapt to climate change, new diseases and pests |
Social and cultural | Traditional varieties are part of local diets, farming knowledge and identity, and often suit local conditions without costly inputs |
Ethical | Species and varieties shaped over thousands of years by farmers and nature may have value in themselves and for future generations |
The response to lost genetic diversity is partly technocentric: storing seeds in banks such as the Svalbard Global Seed Vault (opened 2008), and using genetic modification or gene editing to add resistance. More ecocentric approaches favour growing diverse mixtures of varieties, protecting wild relatives in their natural habitats and supporting farmers who keep traditional varieties in use.
Earth history, fossils and the geological timescale (HL only)
The Earth formed about 4.54 billion years ago. The oldest widely accepted evidence of life is about 3.5 billion years old: stromatolites, layered mounds built by microbes, preserved in 3.48-billion-year-old rocks of the Dresser Formation in Western Australia. For most of Earth history life was microscopic and single-celled. Large, complex animals appear in abundance in the fossil record only from about 539 million years ago, the start of the Phanerozoic eon (“visible life”).
Processes that act over these immense timescales (natural selection, speciation, extinction, the movement of continents and changes in climate and sea level) have together produced the present diversity of life. Evolution is slow in human terms but has had billions of years in which to work.
Fossils as evidence of evolution
A fossil is the preserved remains or traces of an organism, usually in sedimentary rock: bones, shells, leaves, footprints or burrows. Sedimentary rocks build up in layers, with younger layers on top of older ones, so fossils lower down are older. The fossil record is the sequence of fossils through these layers.
The same types of fossil occur in the same order in rocks all over the world, from simple to more complex forms, which matches the predictions of evolution.
Transitional fossils show intermediate features between groups, such as early birds with teeth and clawed wings, or early whales with hind limbs.
Species appear, persist for a time and disappear; most species that have ever lived are now extinct.
Radiometric dating of volcanic layers between sediments gives the age of the fossils in years.
The fossil record is incomplete. Soft-bodied organisms rarely fossilise, many rocks have been eroded or changed by heat and pressure, and only a small fraction of fossils has been found. Gaps are therefore expected and do not count against evolution; new fossils have repeatedly filled gaps predicted by it.
Dividing time: eons, eras, periods and epochs
Geologists divide Earth history into a hierarchy of units: eons are divided into eras, eras into periods, and periods into epochs (and then ages). The boundaries are placed where the rocks record a major geological or biological event, especially a marked change in the fossils found in them. Many boundaries coincide with extinctions, after which new groups of species appear in the layers above.
Epochs are the units most relevant to recent Earth history, and the ones at the centre of the debate about human impact.
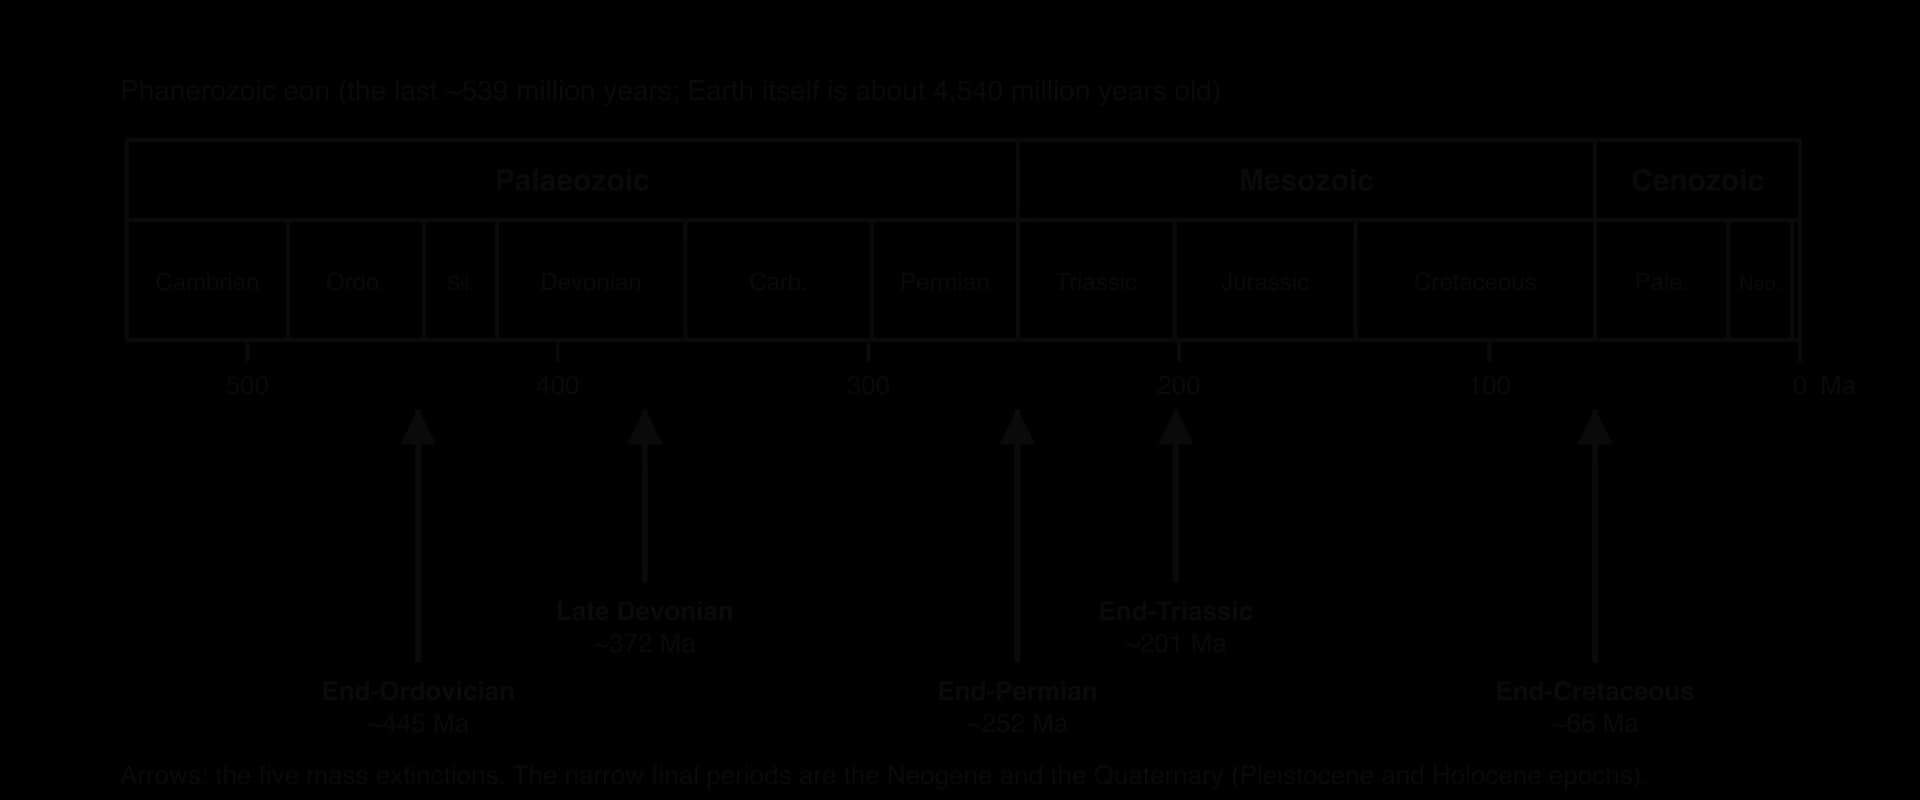
Unit | Example | Typical length | Boundary marked by |
|---|---|---|---|
Eon | Phanerozoic (539 million years ago to now) | Hundreds of millions to billions of years | The largest changes, such as the appearance of abundant complex life |
Era | Cenozoic (66 million years ago to now) | Tens to hundreds of millions of years | Major extinctions and shifts in dominant life |
Period | Quaternary (2.58 million years ago to now) | Millions to tens of millions of years | Significant changes in fossils and environment |
Epoch | Holocene (11,700 years ago to now) | Thousands to millions of years | Changes in strata and fossils; for the Holocene, the end of the last glacial period |
Each boundary is fixed at one agreed reference point in a real sequence of rock or sediment somewhere in the world, called a Global Boundary Stratotype Section and Point and known informally as a golden spike. Geologists elsewhere then match their own rock layers to that point using fossils, chemical signals or dated layers.
Sources: Wikipedia, “Geologic time scale” and “Earliest known life forms” (2026).
Mass extinctions (HL only)
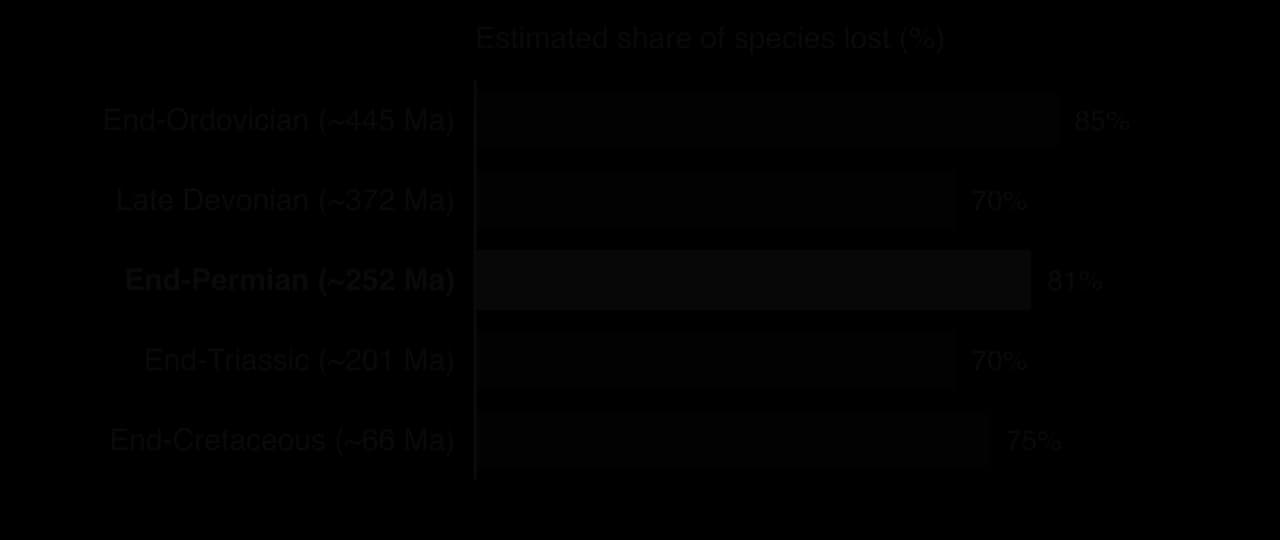
Extinction is a normal part of evolution: species are always disappearing at a low “background” rate as conditions change and competitors evolve. A mass extinction is different in scale and speed. Over a geologically short time, a large share of all species across many groups and habitats dies out.
Mass extinction | Approximate date | Estimated species lost | Main proposed causes |
|---|---|---|---|
End-Ordovician | 445–444 million years ago | About 85% | Global cooling and glaciation, falling sea level; volcanism and loss of ocean oxygen also proposed |
Late Devonian | About 372 million years ago (with a further pulse at 359) | At least 70% | Loss of oxygen in the oceans, possibly from nutrients washed off land as plants spread; volcanism and climatic change |
End-Permian (“Great Dying”) | About 252 million years ago | About 81% of marine species and about 70% of land vertebrate species | Huge volcanic eruptions of the Siberian Traps releasing CO₂, causing warming, ocean acidification and loss of oxygen |
End-Triassic | About 201 million years ago | About 70–75% | Flood basalt volcanism as the supercontinent Pangaea began to split |
End-Cretaceous (K–Pg) | About 66 million years ago | About 75% | Asteroid impact at Chicxulub, Mexico, with large-scale volcanism in India as a possible contributing factor |
Sources: Wikipedia, “Extinction event” (2026), based on Raup and Sepkoski and later studies.
The causes of past mass extinctions fall into a few groups, often acting together: movement of tectonic plates (which changes ocean currents, climate and sea level), super-volcanic eruptions, rapid climate change, changes in sea level, and meteorite impact. Most involve a sudden change in the carbon cycle and climate that was too fast for many species to adapt to.
Recovery and rapid speciation
After each mass extinction, the survivors faced a world with many empty niches: food, space and ways of life no longer used by any species. With little competition, surviving groups diversified rapidly into these niches, producing many new species in a burst of adaptive radiation. Recovery of total diversity nevertheless took millions of years; after the end-Permian event, land vertebrate communities took around 30 million years to recover fully.
The end-Cretaceous extinction removed the non-bird dinosaurs, which had been the dominant large land animals since the start of the Jurassic, about 135 million years earlier. Small mammals survived and, over the following 10–20 million years, diversified into large herbivores, carnivores, bats and whales. The present dominance of mammals, including humans, is therefore partly the result of an asteroid impact 66 million years ago.
The sixth mass extinction
Many scientists argue that a sixth mass extinction is now under way, and that, unlike the previous five, it is caused by one species. The current rate of species extinction is estimated to be at least tens to hundreds of times higher than the average rate over the past 10 million years. A 2019 global assessment by IPBES estimated that about 1 million of the world’s roughly 8 million animal and plant species are threatened with extinction, many within decades.
The five past mass extinctions | The present (sixth) extinction | |
|---|---|---|
Cause | Natural: volcanism, impacts, climate and sea-level change, plate movement | Anthropogenic: habitat loss, overexploitation, invasive species, pollution and climate change |
Speed | Thousands to millions of years | Decades to centuries |
Scale so far | At least 70% of species lost | A much smaller share lost so far, but rates far above background and very many species threatened |
Recovery | Millions of years, by rapid speciation into empty niches | Recovery over human timescales is impossible; prevention is the only option |
The term is debated. Measured by the share of species already lost, the present event is far smaller than the past five, and some scientists prefer to speak of an extinction crisis that could become a mass extinction. Others point out that if present rates continue, the loss of three-quarters of species could be reached within centuries. Linked to this, the planetary boundaries model treats biosphere integrity as one of the boundaries already crossed.
Sources: Wikipedia, “Extinction event” (2026); IPBES Global Assessment (2019).
The Anthropocene (HL only)
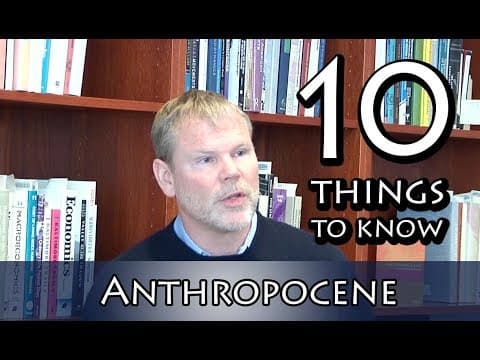
Human activity has changed the atmosphere, oceans, land surface and living world so much that many scientists argue the Earth has left the Holocene and entered a new epoch. The term was used informally by the ecologist Eugene Stoermer in the 1980s and was popularised in 2000 by the atmospheric chemist Paul Crutzen.
Evidence in the geological record
For a new epoch to be recognised, human impacts must leave a distinct, worldwide signal in the rock and sediment layers forming now, which future geologists could detect. Several such signals already exist.
Chemical pollution signals accumulating in sediments and ice: lead from petrol, nitrogen and phosphorus from fertilisers, persistent pesticides, and a sharp rise in CO₂ and methane in ice cores.
Spherical carbonaceous fly ash particles from burning coal and oil, which rise sharply in sediments worldwide from about 1950.
Deposits from nuclear weapons testing: plutonium and carbon-14 from atmospheric tests in the 1950s and early 1960s, spread across the whole planet and peaking in the early to mid-1960s.
Mixing of native and non-native species: crops, livestock, pests and invasive species moved between continents, so future fossil assemblages will contain species far from their natural ranges, and vast numbers of domestic chicken bones in landfill.
Modified sedimentary systems: dams trap river sediment, mining and construction move more rock than natural erosion, and coastlines and sea beds are reshaped by dredging and trawling.
Minerals and materials made by humans: concrete, aluminium, plastics and microplastics, and tens of thousands of synthetic mineral-like compounds that do not occur naturally; preserved human-made objects are called technofossils.
Candidate golden spikes
Choosing when the Anthropocene began means choosing a signal that appears at the same time all over the world. Three candidates have been widely discussed.
Candidate start | Signal | What caused it | Strengths and weaknesses |
|---|---|---|---|
1610 | A dip of about 7–10 ppm in atmospheric CO₂, recorded in Antarctic ice (the “Orbis spike”) | After European arrival in the Americas, tens of millions of Indigenous people died from disease and violence; abandoned farmland regrew as forest and absorbed carbon. The same period mixed species between the Old and New Worlds | Global and linked to a world-changing human event, but a small signal, and it marks colonisation rather than industrial change |
About 1950 | A sharp rise in spherical fly ash particles in sediments, together with plastics and other markers | Fossil-fuel burning in the “Great Acceleration” of population, industry and consumption after the Second World War | Many markers change together, but fly ash is not equally present everywhere |
1964 | Peak of carbon-14 (and plutonium) from nuclear weapons tests | Atmospheric nuclear testing, ended by the 1963 Partial Test Ban Treaty | A sharp, global and precisely dated signal, but caused by a short-lived activity |
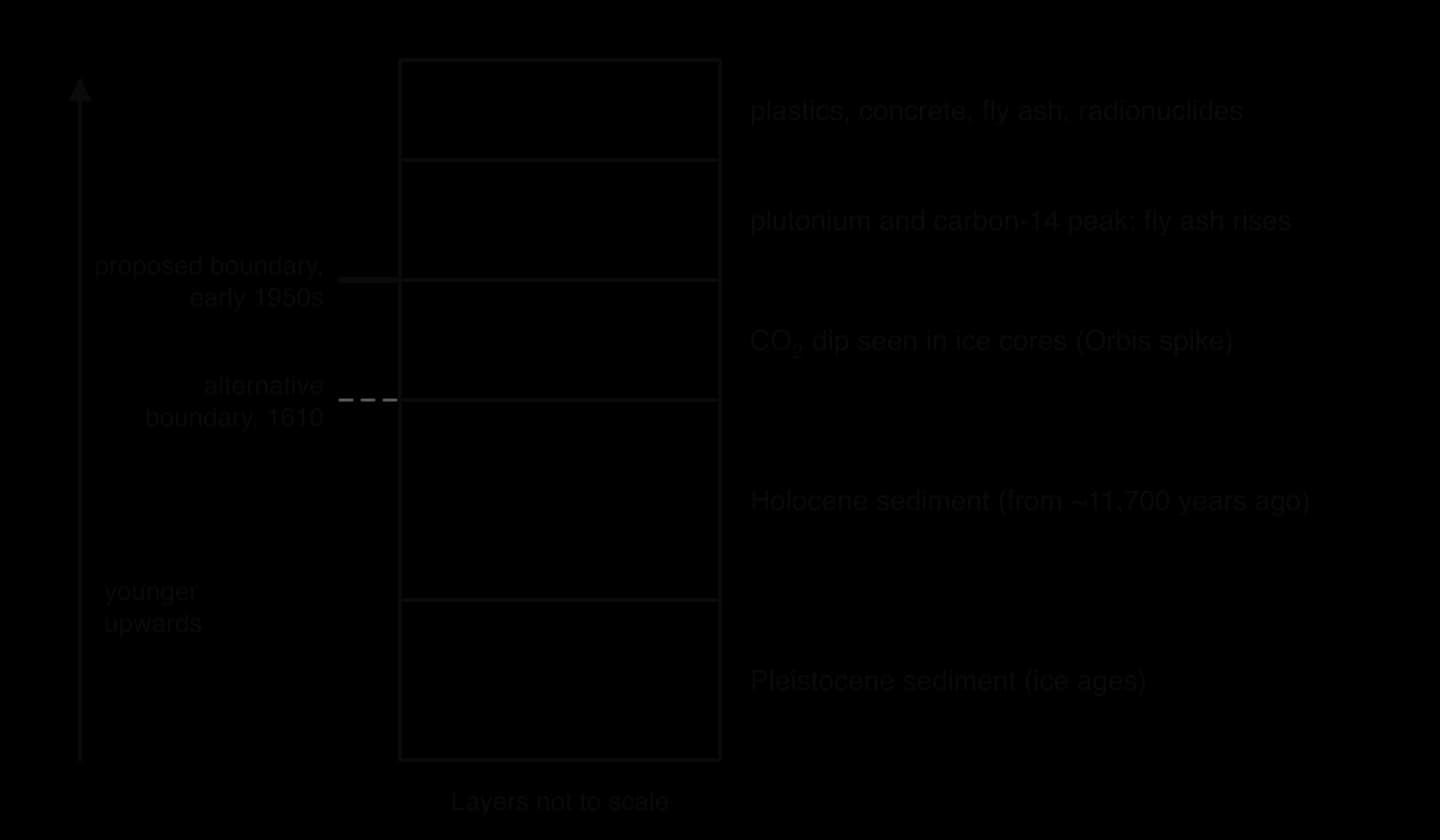
In 2023 the Anthropocene Working Group proposed Crawford Lake in Ontario, Canada, as the reference site, with the boundary at a rise in plutonium from hydrogen bomb tests in the early 1950s. In March 2024 the proposal was rejected by 12 votes to 4, with 2 abstentions, in the subcommission that decides on Quaternary time units, and the International Union of Geological Sciences confirmed the decision. The Anthropocene is therefore not a formal epoch, and the Holocene continues officially, but the term remains in wide informal use by scientists and others.
Sources: Wikipedia, “Anthropocene” and “Orbis spike” (2026); Lewis and Maslin, _Nature 519 (2015)._
Evaluating the Anthropocene
Arguments for a new epoch | Arguments against formalising it |
|---|---|
Human impacts are global, rapid and recorded in sediments and ice worldwide | A boundary in the early 1950s would make the epoch only about 70 years old, very short for a unit that usually lasts thousands of years or more |
Many changes (extinction, species mixing, novel materials) are effectively irreversible on geological timescales | Human influence began gradually, thousands of years ago with farming and forest clearance, so any single date is arbitrary |
Naming it focuses public and political attention on human responsibility for the Earth system | The term can be used as a political or cultural label more than a geological one |
Many markers change together around 1950, giving a clear boundary | Treating “humanity” as one cause hides the very unequal contributions of different countries and groups |
Different perspectives see the debate differently. To many Earth scientists the question is purely stratigraphic: is there a clear, global boundary in the rocks? To environmentalists and many social scientists the term is useful because it states that humans are now a geological force with responsibility for the future of the biosphere. Some critics, including Indigenous scholars, argue that the 1610 date shows that colonisation, not humanity in general, drove the change, which links the debate to environmental justice.
 YouTube
Exam practice
Questions on biodiversity and evolution appear in both papers. Paper 2 Section A often asks for definitions of the three levels of biodiversity, an outline of the steps of natural selection, or a calculation of Simpson’s reciprocal index from a table, followed by a comparison of two sites. Paper 1 can supply survey data from an unfamiliar place and ask you to calculate, compare and evaluate. In Section B essays, the evolution and diversity content is usually combined with threats and conservation, so knowing named examples (Daphne Major, the peppered moth and, at HL, Gorongosa’s elephants, bonobos and apple maggot flies) earns credit across many questions.
Calculations of Simpson’s reciprocal index are usually followed by a comparison or an evaluation, which carries as many marks as the arithmetic.
Paper 2 Section A-style questions
Calculation items usually supply a small table of counts. The formula is printed on the paper, so the marks are for correct substitution and for interpretation.
Resource for the next question (hypothetical data). Students sampled aquatic invertebrates upstream and downstream of a farm drain, using the same kick-sampling method for three minutes at each site.
Species | Upstream (n) | Downstream (n) |
|---|---|---|
Mayfly nymph | 14 | 2 |
Caddis fly larva | 10 | 1 |
Freshwater shrimp | 12 | 6 |
Water louse | 4 | 21 |
Bloodworm | 0 | 10 |
Resilience questions reward a clear chain of cause and effect from genes to population survival.
Paper 1-style data question
Resource for the Paper 1-style question (hypothetical data). A national park in a tropical country monitors ground-dwelling ants in forest plots using identical pitfall traps. Plot X is in undisturbed forest; plot Y is in forest that was selectively logged ten years ago.
Plot X (undisturbed) | Plot Y (logged) | |
|---|---|---|
Species richness | 18 | 11 |
Total individuals (N) | 240 | 236 |
Simpson’s reciprocal index (D) | 12.6 | 3.1 |
Share of individuals belonging to the most common species | 14% | 52% |
Paper 2 Section B-style essay
HL questions
A 9-mark HL part rewards a balanced argument that uses named evidence and ends in a clear judgement.
Summary
Biodiversity is the total diversity of living systems at three levels: habitat, species and genetic diversity.
Each level adds resilience: genetic diversity allows adaptation, species diversity provides back-up roles, and habitat diversity gives refuges.
Evolution is the cumulative change in heritable characteristics of a population; natural selection is its main mechanism.
Natural selection requires heritable variation, overproduction, competition for limited resources and differential survival and reproduction, so advantageous alleles become more frequent.
Speciation occurs when isolated populations adapt differently until they can no longer interbreed.
Species diversity depends on richness (number of species) and evenness (how equal their populations are).
Simpson’s reciprocal index, D = N(N − 1) / Σn(n − 1), rises with richness and evenness; its lowest value is 1; fair comparisons need the same organisms, ecosystem and method.
Biodiversity knowledge comes from professional surveys, voluntary groups, citizen science, parabiologists and Indigenous knowledge, each with strengths and biases.
Mutation creates new alleles and sexual reproduction recombines them; isolation may be geographical, ecological or behavioural (bonobos, apple maggot fly). (HL)
Islands have many endemic species, and biodiversity hotspots hold much of the world’s species on a small, threatened area. (HL)
Human hunting and artificial selection change selective pressures and reduce genetic diversity and resilience (tuskless elephants, Cavendish bananas). (HL)
Five past mass extinctions were followed by rapid speciation; the present human-caused extinction and the proposed (not formalised) Anthropocene are recorded in the geological layers forming today. (HL)
Self-check
- To do:
I can outline habitat, species and genetic diversity with an example of each.
- To do:
I can explain how each level of biodiversity contributes to resilience.
- To do:
I can explain the steps of natural selection using the peppered moth or Daphne Major finches.
- To do:
I can describe how speciation occurs and tell it apart from evolutionary change within a species.
- To do:
I can distinguish species richness from species evenness.
- To do:
I can calculate Simpson’s reciprocal index and use it to compare two sites or monitor change.
- To do:
I can evaluate citizen science, parabiologists and other ways of gathering biodiversity data.
- To do:
I can explain how mutation, sexual reproduction and reproductive isolation lead to speciation, using bonobos and apple maggot flies. (HL)
- To do:
I can explain island endemism and the hotspot concept. (HL)
- To do:
I can discuss human-driven selection and the risks of artificial selection, with named examples. (HL)
- To do:
I can outline the geological timescale and the five mass extinctions, and compare them with the present. (HL)
- To do:
I can evaluate whether the Anthropocene should be a formal epoch. (HL)