
Describe, compare and evaluate the six research methods in psychology, from experiments to case studies, and design a study by choosing a method, variables, hypotheses and controls that fit a research question.
Each is in the Psychology glossary, with every other term in the subject.
A prediction that there will be an effect of the independent variable on the dependent variable, or a relationship between variables; it may be directional (stating which way) or non-directional.
A detailed, usually long-term investigation of a single individual, group, event or community, using several methods such as interviews, observations and records.
A question with a fixed set of possible answers, such as yes/no, multiple choice or a rating scale, which produces quantitative data.
A longitudinal study that follows a group of people who share a characteristic, such as being born in the same year and place, measuring them repeatedly over time.
A person who appears to be a participant or bystander but is working for the researcher and follows a script as part of the procedure.
An extraneous variable that changes systematically with the independent variable, so that its effect cannot be separated from the effect of the independent variable.
The group or condition in an experiment that does not receive the treatment or manipulation, providing a baseline against which the experimental condition is compared.
An observation carried out in a setting arranged by the researcher, often a laboratory, so that every participant meets the same situation and behaviour can be recorded systematically.
Describe the six research methods used in psychology (experiments, observations, surveys or questionnaires, interviews, correlational studies and case studies) and their main sub-types.
Explain the difference between quantitative and qualitative research and the kind of data each method produces.
Explain independent, dependent, extraneous and confounding variables, and how researchers write operationalised null and alternative hypotheses.
Compare and contrast laboratory, field, natural and quasi-experiments, and the independent samples, repeated measures and matched pairs designs.
Explain how experimental controls, random allocation and counterbalancing deal with extraneous variables, and why uncontrolled variables limit causal conclusions.
Evaluate the strengths and limitations of each method, including the effects of ethical considerations on what research can be done.
Design a study to investigate a research question, justifying the choice of method, variables and design.
Discuss a published study with reference to its method and to the concepts of causality, measurement and bias.
A research method is a systematic way of collecting data to answer a question about behaviour. Psychology uses six main methods: experiments, observations, surveys or questionnaires, interviews, correlational studies and case studies. Each one collects a different kind of evidence, and each allows some conclusions but not others, so knowing the methods is the basis for judging any claim that psychology makes.
Methods are part of research methodology, the wider study of how research is planned and carried out. The choice of method decides whether a study can test
With a free account, Augment remembers where you stopped and what you have practiced.
A number between −1 and +1 that shows the strength and direction of the relationship between two variables; values near zero mean little or no linear relationship.
A research method that measures two or more variables as they naturally occur and tests whether and how strongly they are related, without manipulating either variable.
A control for order effects in a repeated measures design in which participants complete the conditions in different orders, for example half in the order AB and half in the order BA.
An observation in which the participants do not know that they are being observed, for example because the observer is hidden or poses as an ordinary member of the group.
The variable that the researcher measures in an experiment, expected to change as a result of the independent variable.
A research method in which the researcher manipulates an independent variable and measures its effect on a dependent variable while controlling other variables, so that cause and effect can be tested.
The procedures used to stop extraneous variables affecting the dependent variable, such as standardised instructions, random allocation, counterbalancing, control groups and blinding.
Any variable other than the independent variable that could affect the dependent variable and so must be controlled or accounted for.
An experiment carried out in a real-world setting, such as a school, street or workplace, in which the researcher still manipulates the independent variable.
A group interview in which a small group of participants, usually about four to ten, discuss a topic together, guided by a moderator.
A precise, testable prediction of the relationship between variables in a study, stated in operationalised terms.
An experimental design in which different participants take part in each condition, so each person experiences only one level of the independent variable.
The variable that the researcher manipulates or compares in an experiment, to test its effect on the dependent variable.
A self-report research method in which a researcher asks participants questions face to face, by phone or online and records their spoken answers.
An experiment carried out in a controlled, artificial setting where the researcher manipulates the independent variable and keeps other variables as constant as possible.
A rating scale on which participants show how far they agree or disagree with a statement, usually on five or seven points from strongly disagree to strongly agree.
An experimental design in which participants are paired on characteristics relevant to the study, such as age or ability, and one member of each pair is placed in each condition.
A statistical technique that combines the results of many studies on the same question to estimate the overall size and consistency of an effect.
A study in which the independent variable changes naturally, through an event the researcher did not cause or control, and the researcher measures its effect on behaviour.
An observation of behaviour in the setting where it normally occurs, such as a home, playground or street, with no interference from the researcher.
An observation in which the researcher watches the group from outside and does not take part in its activities.
A prediction that there will be no effect of the independent variable on the dependent variable, or no relationship between variables, and that any difference found is due to chance.
A research method in which the researcher watches and records behaviour as it happens, either in a natural setting or in a controlled one, without manipulating an independent variable.
A question that allows participants to answer freely in their own words, which produces qualitative data.
Changes in performance caused by the order in which conditions are completed rather than by the independent variable, such as improvement through practice or decline through fatigue or boredom.
An observation in which the participants know that they are being observed and usually why.
An observation in which the researcher joins the group being studied and takes part in its activities while recording behaviour.
Characteristics of individual participants, such as age, ability, personality or mood, that could affect the dependent variable if they are not equal across conditions.
Research that collects non-numerical data, such as words, images or observed behaviour, and interprets it to understand meanings and experiences in depth.
Research that collects numerical data and analyses it statistically, usually to test hypotheses about relationships between variables.
A study that compares conditions without random allocation of participants, often because the groups already exist (such as cultures, sexes or age groups), so cause and effect cannot be firmly established.
A self-report research method in which participants answer a fixed set of written questions, usually on paper or online; the terms survey and questionnaire are used interchangeably.
A procedure in which every participant has an equal chance of being placed in each condition of an experiment, so participant variables are spread evenly across conditions.
A true experiment that tests a treatment or intervention by randomly allocating participants to receive it or to a control condition, such as a placebo, usual care or a waiting list.
An experimental design in which the same participants take part in every condition, so each person is compared with themselves.
A systematic way of collecting data to answer a research question, such as an experiment, observation, survey or questionnaire, interview, correlational study or case study.
An interview based on a guide of planned questions in which the interviewer can change the order and ask follow-up questions to explore answers in depth.
An interview in which every participant is asked the same questions in the same order, with no follow-up questions.
An experiment in which the researcher manipulates the independent variable and allocates participants to conditions at random, which allows a cause-and-effect conclusion.
An interview with no fixed list of questions, which develops like a conversation around a general topic and follows the participant's answers.
The methods divide into two families. In experimental methods, an independent variable is manipulated by the researcher or compared across conditions, and its effect on a dependent variable is measured. In non-experimental methods, the researcher measures behaviour, thoughts or feelings as they occur, without changing anything. Only the experimental family can test cause and effect directly, and only a true experiment can do so with confidence.
Most published studies combine methods. A study of children’s behaviour may observe them in the playground, give teachers a rating scale and interview parents. Using several methods to study the same question is triangulation, and it increases confidence when different methods point to the same answer.
 YouTube
Every method produces data, and data come in two broad kinds. Quantitative data are numbers: reaction times, scores on a scale, counts of behaviour. Qualitative data are non-numerical: words from an interview, written answers, descriptions of behaviour. The kind of data a study collects shapes the whole research process, from the question asked to the way results are analysed.
Quantitative research usually follows a deductive logic: it starts from a theory, derives a prediction and tests it with numbers. Its strength is precision and comparison. Two groups can be compared on the same measure, results can be checked with statistics, and another researcher can repeat the study exactly. Its weakness is that a number can strip away meaning: a score of 4 out of 5 on a stress scale says nothing about what the stress feels like or where it comes from.
Qualitative research often follows an inductive logic: it starts from the data and builds an explanation from patterns that emerge, for example through thematic analysis. Its strength is depth and the participant’s own perspective. Its weaknesses are smaller samples, more room for the researcher’s interpretation, and findings that are harder to compare across studies. The terms deductive and inductive describe these two directions of reasoning.
Feature | Quantitative research | Qualitative research |
|---|---|---|
Data | Numbers (scores, counts, times) | Words, images, descriptions |
Typical aim | Test a hypothesis; measure the size of an effect | Explore experiences and meanings |
Usual logic | Deductive: theory → prediction → data | Inductive: data → patterns → explanation |
Typical methods | Experiments, structured observations, closed questionnaires, correlational studies | Semi-structured and unstructured interviews, focus groups, participant observation, case studies |
Sample | Usually larger, chosen to represent a population | Usually smaller, chosen for relevant experience |
Analysis | Descriptive and inferential statistics | Thematic or content analysis |
Judged by | Reliability, validity, generalisability | Credibility, transferability, reflexivity |
Quantitative and qualitative research are often used together. Many methods can produce either kind of data: a questionnaire with a Likert scale produces numbers, while the same questionnaire with an open question produces words. Many studies are mixed methods, using quantitative data to show how common something is and qualitative data to explain why.
Before choosing a method, a researcher decides exactly what the study is for. This planning stage turns a general interest (“Does social media affect sleep?”) into something that can be measured and tested.
An aim such as “to investigate whether the wording of a question affects eyewitness estimates of speed” tells the reader what the study is about. Qualitative studies more often state an open research question, such as “How do first-generation university students describe their sense of belonging?”, because they do not predict a particular result.
A variable is anything that can change or differ between people or situations: anxiety, age, hours of sleep, the number of words recalled. In an experiment, two variables matter most.
In a study of revision with and without music, the presence of music is the IV. Its effect shows up in a second variable, which the researcher measures.
Psychological variables are often constructs, such as memory, stress or aggression, that cannot be observed directly. Researchers therefore operationalise them, stating exactly how each one will be manipulated or measured. “Memory” might become “the number of words correctly recalled from a list of 20 after two minutes”; “aggression” might become “the number of times a child hits a doll in a ten-minute period”. An operationalised variable can be measured in the same way by anyone, which makes the study replicable.
A research question is answered by testing a precise prediction. A hypothesis states the expected relationship between operationalised variables. In quantitative research there are always two hypotheses, and the statistics decide between them.
The null hypothesis is the starting assumption that the statistical test tries to reject. Its partner states the effect the researcher expects.
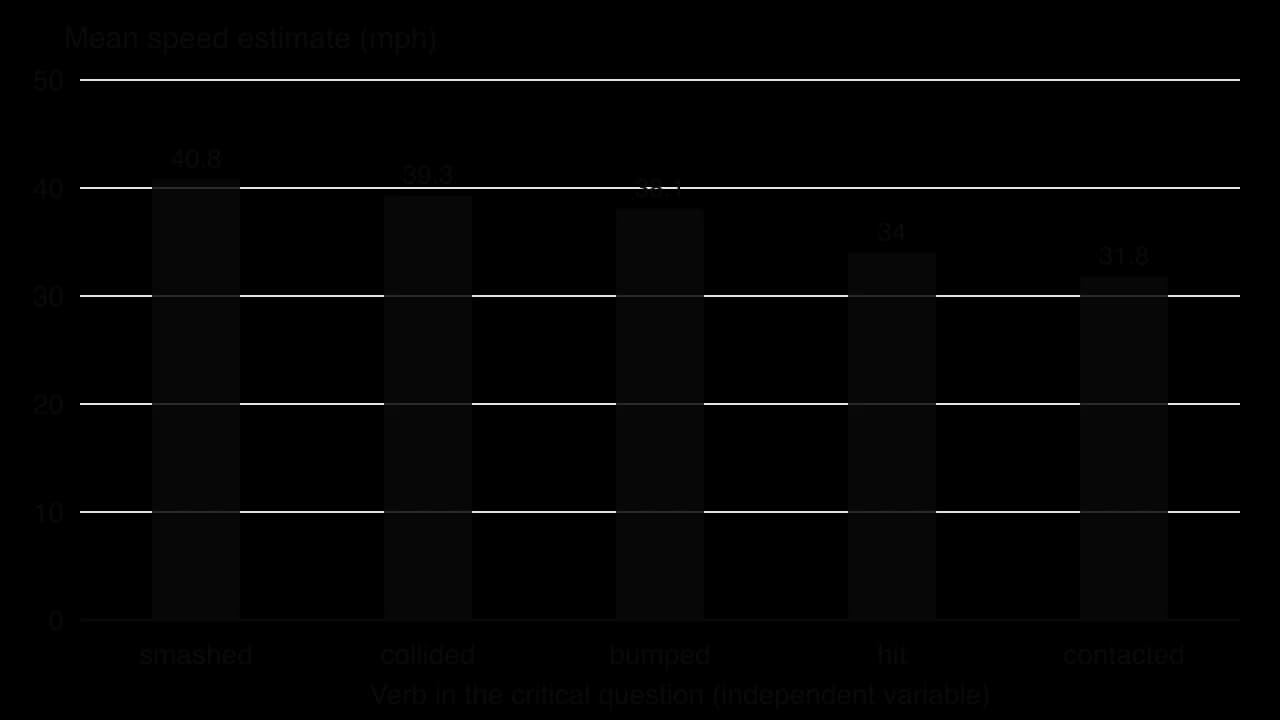
A directional (one-tailed) alternative hypothesis states which way the effect will go: “participants who hear the verb ‘smashed’ will give higher speed estimates than participants who hear ‘hit’.” A non-directional (two-tailed) hypothesis predicts a difference without saying which way: “there will be a difference in speed estimates between the two groups.” Researchers choose a directional hypothesis when theory or earlier research gives a clear reason to expect a direction.
Researchers do not “prove” a hypothesis. If a difference is large enough to be statistically significant (usually p < 0.05), they reject the null hypothesis and accept the alternative; otherwise they retain the null. Even a significant result can be a chance finding, which is why replication matters.
An experiment is the only method that can show directly that one variable causes a change in another. The logic is simple. If two groups are the same in every way except the IV, and they then differ on the DV, the difference must have been caused by the IV. Every feature of experimental design exists to make the “same in every way” part as true as possible.
Any variable other than the IV that could affect the DV is an extraneous variable. In a memory experiment, noise in the room, the time of day, participants’ tiredness and their prior knowledge of the topic are all extraneous variables. They do not ruin a study as long as they affect all conditions equally; they simply add random “noise” to the results.
An extraneous variable becomes a confounding variable when it changes along with the IV. Suppose one group is tested in the morning and the other in the late afternoon. If the groups differ, the difference could be caused by the IV or by the time of day, and there is no way to tell which. A confound destroys the causal logic of the experiment, because the IV is no longer the only systematic difference between the conditions.
Extraneous variables come from three main sources. Participant variables are characteristics of the people taking part, such as age, intelligence, mood or motivation. Situational variables are features of the setting and procedure, such as lighting, noise, instructions or the behaviour of the researcher. Participant and researcher expectations are a third source: demand characteristics lead participants to guess the aim and change their behaviour, and the researcher’s own expectations can shape how participants are treated or how results are recorded.
Experimental controls are the procedures that stop extraneous variables becoming confounds. Most experiments use several at once.
Standardisation: every participant gets the same instructions, materials, setting and timing, often from a written script. This controls situational variables.
A control group: a condition that does not receive the treatment, giving a baseline. Without one, a change in the DV could have happened anyway, for example through time passing or practice.
Random allocation: each participant has an equal chance of ending up in each condition, so participant variables are spread evenly by chance rather than by any choice of the researcher.
Counterbalancing: in designs where the same people do every condition, varying the order of conditions so that order effects cancel out.
Blinding: in a single-blind procedure participants do not know which condition they are in; in a double-blind procedure the researcher who deals with them does not know either. Blinding controls demand characteristics and researcher expectations. A placebo condition does the same for treatments.
Random allocation is the most powerful control because it deals with participant variables that the researcher has not even thought of. A researcher cannot match groups on every possible characteristic, but with enough participants, chance makes the groups similar on all of them. This is why the line between a true experiment and a quasi-experiment is drawn at random allocation.
The laboratory gives the researcher the most control: the same room, the same materials and the same script for everyone, which makes the experiment easy to repeat. Loftus and Palmer (1974) showed 45 American students film clips of car accidents and then asked, “About how fast were the cars going when they _ each other?”. Each group heard a different verb in the blank, so the verb was the IV and the speed estimate was the DV. Every other part of the procedure was identical.
A second classic laboratory experiment is Bandura, Ross and Ross (1961), in which 72 children from the Stanford University nursery school watched an adult behave aggressively or non-aggressively towards an inflatable Bobo doll, or saw no model, and were then observed playing in a room containing the doll. The children had first been rated for how aggressive they usually were, and the groups were matched on these ratings so that existing differences in aggression could not explain the results.
The weakness of the laboratory is its artificiality. Watching a short film of a crash is not the same as witnessing a real one, and hitting an inflatable doll is not the same as hurting a person. Findings may lack ecological validity, meaning they may not apply to real-life settings, and the unusual situation can produce demand characteristics.
In a field experiment the researcher takes the manipulation out of the laboratory. Piliavin, Rodin and Piliavin (1969) staged a collapse on New York subway trains. A confederate posing as a passenger fell to the floor, carrying either a cane (apparently ill) or a bottle (apparently drunk), and hidden observers recorded whether and how quickly passengers helped. The apparently ill victim received help on 62 of 65 trials, the apparently drunk victim on 19 of 38.
The strength of a field experiment is that participants behave naturally, usually without knowing they are being studied, so demand characteristics are low and ecological validity is higher. The costs are less control (the passengers in each carriage differed and could not be allocated to conditions) and ethical problems, because participants cannot give informed consent and are not usually debriefed.
Whether a study is a true experiment depends on how participants end up in each condition, not on where it takes place. A laboratory study and a field study can both be true experiments.
When random allocation is impossible, the study keeps the structure of an experiment (conditions compared on a measured DV) but loses some of its causal power.
Many of the variables psychologists care most about cannot be assigned at random: nobody can be allocated to be Japanese or American, male or female, depressed or not depressed. A study that compares such groups is a quasi-experiment. Masuda and Nisbett (2001) showed Japanese and American university students animated underwater scenes and asked them to describe what they had seen. Japanese participants made more statements about the background and the relationships between objects, while American participants were more likely to begin their descriptions with the large, central fish.
The difference between the groups is real, but culture is not the only way in which the two samples differed. Language, the university attended and the familiarity of the materials also varied with nationality. Without random allocation, any of these could be a confounding variable, which is why quasi-experiments show differences between groups rather than proving what caused them.
Some IVs cannot be manipulated for practical or ethical reasons: the arrival of a new technology, a natural disaster, a change in the law. When such a change happens anyway, researchers can measure behaviour before and after it, or compare people affected and not affected. Costello and colleagues (2003) used one such event, when casino payments lifted some Cherokee families in the United States out of poverty.
Television is a classic natural-experiment IV. Joy, Kimball and Zabrack (1986) measured children’s aggression in a Canadian town, known in the research as “Notel”, before it first received television reception and again two years later, and found that aggression had increased. When satellite television reached the island of St Helena in 1995, a before-and-after study by Charlton and colleagues found no such rise, which shows that the same natural experiment can give different answers in different communities.
Natural experiments allow ethical research on questions that could never be manipulated deliberately, and they study real behaviour in real settings. Their weakness is that the researcher controls neither the IV nor who is exposed to it. Other things change at the same time as the event, and the groups compared may differ in many ways, so causal conclusions are tentative.
The RCT is the standard test of whether a therapy, medication, school programme or health campaign works. Participants are randomly allocated, outcomes are measured before and after, and the control condition shows what would have happened without the treatment. Where withholding treatment would be unethical, wait-listing gives the control group the treatment after the study ends. RCTs combine the causal power of a true experiment with a real-world question, but they are expensive, and the people who agree to take part may differ from the patients who will later receive the treatment.
Once the conditions are decided, the researcher must decide who does which condition. This choice is the experimental design, and there are three options. Each one deals with participant variables in a different way and brings its own risk.
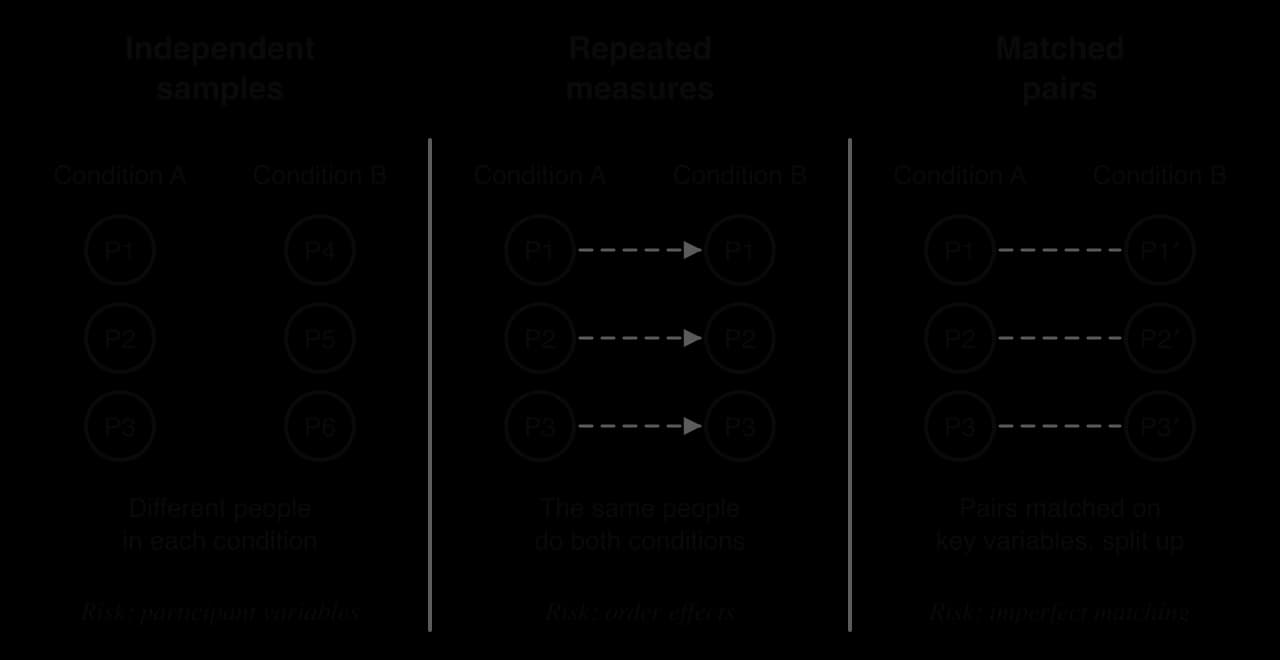
Loftus and Palmer used an independent samples design: each participant heard only one verb. Because nobody does the task twice, there are no practice or fatigue effects, and participants are less likely to guess the aim. The risk is that the groups differ in participant variables; one group might simply contain better drivers or more confident estimators. Random allocation reduces this risk, and larger groups reduce it further.
Because each participant acts as their own control, participant variables are held constant and fewer people are needed. The cost is order effects. A participant may do better in the second condition because they have practised (a practice effect) or worse because they are tired or bored (a fatigue effect), and doing both conditions makes it easier to guess the aim of the study.
The usual control for order effects is counterbalancing. Half the participants do condition A then B, and the other half do B then A. Practice and fatigue still happen, but they now affect both conditions equally, so they cannot become a confound. A gap between conditions, or using different but equivalent materials (two word lists of the same difficulty), also helps.
Matching tries to combine the strengths of the other two designs: no order effects, as in independent samples, and controlled participant variables, as in repeated measures. Bandura, Ross and Ross (1961) matched children on their pre-rated aggressiveness before placing them in groups. Matching takes time, needs a pre-test, and can only cover the variables the researcher thinks of; two people matched on age and IQ may still differ in motivation. Monozygotic twins are sometimes used as naturally matched pairs.
Design | Main strength | Main limitation | Usual control |
|---|---|---|---|
Independent samples | No order effects; aim harder to guess | Participant variables may differ between groups; more participants needed | Random allocation |
Repeated measures | Participant variables held constant; fewer participants needed | Order effects; demand characteristics | Counterbalancing |
Matched pairs | No order effects and fewer participant differences | Matching is slow and never perfect | Pre-testing on key variables |
Experiments are the strongest method for testing causality, because control and random allocation rule out alternative explanations. Their standardised procedures make them easy to repeat, which supports reliability, and their quantitative data allow precise comparison. Against this, control often comes at the cost of realism: the tighter the procedure, the less it resembles everyday life. This trade-off between internal validity (confidence that the IV caused the change) and external validity (confidence that the result applies elsewhere) runs through all experimental research.
Type | IV | Allocation | Setting | Causal conclusion | Ecological validity |
|---|---|---|---|---|---|
Laboratory (true) | Manipulated | Random | Artificial | Strong | Often low |
Field (true or not) | Manipulated | Random where possible | Real world | Moderate to strong | Higher |
Quasi-experiment | Existing difference (culture, sex, diagnosis) | Not possible | Any | Weak: groups differ in other ways | Varies |
Natural experiment | Changes naturally | Not controlled | Real world | Tentative | High |
Ethical considerations limit what experiments can do. Researchers cannot manipulate childhood abuse, brain damage or poverty to see their effects, so the most important questions about harm are often studied with quasi-experiments, natural experiments or correlational studies instead. Ethics also affect results directly. Fully informed consent can make the aim obvious and create demand characteristics, which is why some designs use partial deception followed by debriefing, and the right to withdraw means that those who drop out may differ from those who stay.
Observation records what people actually do rather than what they say they do. It is the obvious method for behaviour that people cannot report accurately, such as how infants react to strangers or how often children cooperate in play. An observation can be the whole study, or the way the DV is measured inside an experiment, as in Bandura’s Bobo doll research.
Every observation involves three separate decisions: where it takes place, whether participants know about it, and whether the observer joins in. The choices combine freely, so an observation can be, for example, naturalistic, covert and non-participant.
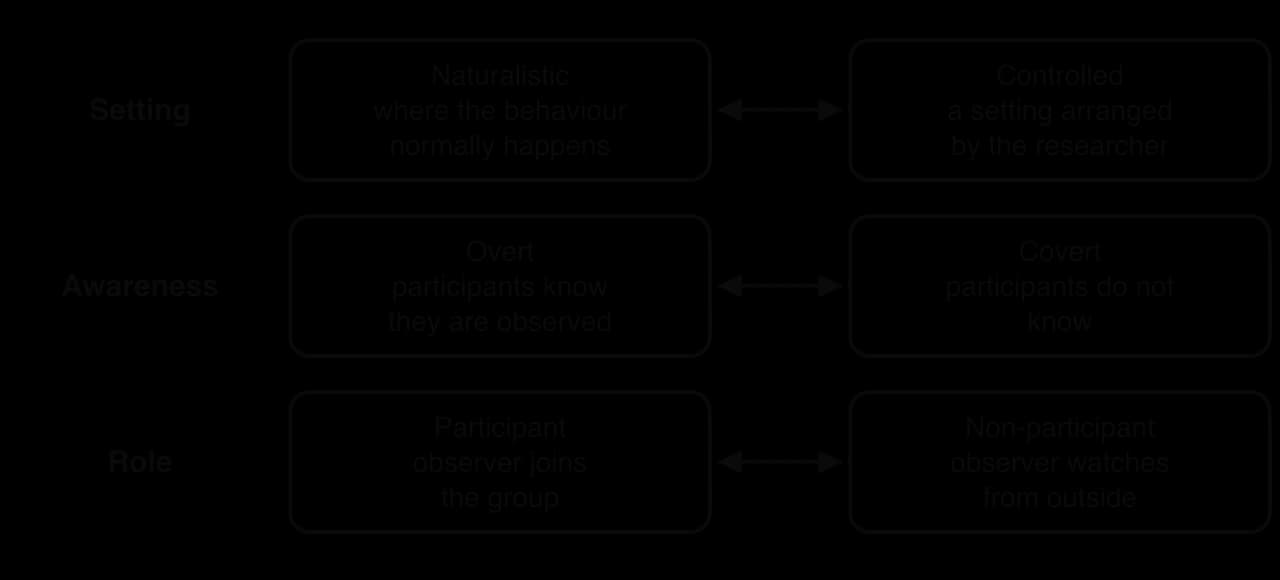
Mary Ainsworth’s early research in villages around Kampala, Uganda, published as Infancy in Uganda (1967), observed mothers and infants at home and interviewed the families about everyday care. Seeing attachment behaviour in its normal setting, in a culture very different from her own, helped her form the ideas she later tested in a more controlled way. High ecological validity is the main strength of naturalistic observation; the cost is that the observer cannot control what happens, so the behaviour of interest may not occur, and any pattern may have several causes.
Ainsworth’s later Strange Situation is the best-known controlled observation: every infant meets the same sequence of separations from and reunions with the mother in the same room, watched through a one-way mirror. Standardisation makes the observation replicable and allows infants to be compared, but the unfamiliar room and the short, staged episodes may not show how the child behaves at home.
Overt observation respects participants’ right to consent, but knowing they are watched can change behaviour, an effect called reactivity. Observers reduce it by spending time with the group before recording, so that participants get used to them, as the camera operators did in the St Helena playgrounds before recording began.
Covert observation removes reactivity, but it raises serious ethical problems of consent and deception. It is usually considered acceptable only in public places where people would expect to be seen by strangers, or where the research benefits are high and no other method is possible.
Taking part gives an insider’s view: the observer can experience what members experience and understand behaviour that would make no sense from outside. It is common in ethnography and the emic approach. The risks are losing objectivity by identifying with the group, and difficulty recording while taking part, so notes are often written later from memory.
Non-participant observers can concentrate on recording and stay more detached, but they understand less of the meaning behind what they see.
A structured observation turns behaviour into data with an observation schedule: a list of operationalised behavioural categories (for example “hits with hand”, “pushes”, “shares a toy”) that observers tally. Observers usually cannot record everything, so they sample: event sampling records every occurrence of the target behaviours, while time sampling records what happens at fixed intervals, such as every 60 seconds. Unstructured observations instead produce detailed field notes, which are analysed qualitatively.
Two or more observers watching the same behaviour and comparing their records gives a measure of inter-rater reliability. If their tallies correlate highly (often +0.80 or above is taken as acceptable), the categories are clear enough to be applied consistently. Video recording helps: footage can be replayed, coded by several people and coded by observers who do not know which condition or time point it comes from, which reduces observer bias.
Observations measure real behaviour directly rather than relying on what people report, which avoids the social desirability bias of self-report. Naturalistic observations have high ecological validity, and observation is often the only way to study people who cannot answer questions, such as infants. On the other hand, observations show what people do but not why; an observer sees a child push another but not the reason. Observer expectations can bias what is recorded, the presence of an observer can change behaviour, and because no variable is manipulated, observation alone cannot establish cause and effect.
A questionnaire asks people directly about their behaviour, thoughts, feelings and experiences. Because it is written and standardised, it can reach hundreds or thousands of people cheaply, often online, and the same questions can be given in several countries. Many questionnaires used in research are established scales: sets of items that together measure one construct, such as anxiety or self-esteem, and whose reliability and validity have been tested.
Closed questions are quick to answer and easy to score and compare. Their limitation is that they force answers into the researcher’s categories; a participant whose real answer is “it depends” has nowhere to put it.
A Likert item such as “I feel calm before tests” (1 = strongly disagree, 5 = strongly agree) turns an attitude into a number. Scores on several items are added to give a total for the construct. Some items are worded in the opposite direction (“I feel nervous before tests”) and reverse-scored, which helps detect participants who agree with everything, a pattern called acquiescence bias.
Open questions, such as asking participants to describe what helps them most when they feel stressed, give richer answers and may raise ideas the researcher had not thought of, but they take longer to answer and to analyse, and many respondents leave them blank or answer briefly.
Small wording choices change answers, so questionnaire items are written and tested with care. Good items are short and clear, ask about one thing at a time (avoiding double-barrelled questions, such as a single item asking whether a student both enjoys maths and does well in it), avoid leading wording (“Most people agree that…”) and avoid technical terms the respondents may not know. A pilot study with a few people from the target group shows which items are misunderstood. In cross-cultural research, items are translated and then back-translated by a second translator to check that the meaning has survived.
Buss (1989) gave the same questionnaire on mate preferences to 10,047 people in 37 samples from 33 countries, asking them to rate and rank characteristics such as kindness, good looks and good financial prospects. The questionnaire made such a large comparison possible. Translation is its main difficulty in such work, because the same English words (“chastity”, “ambition”) may not carry the same meaning in another language.
Questionnaires collect large amounts of data quickly and cheaply, can be anonymous (which encourages honest answers on sensitive topics), and produce standardised data that are easy to compare and analyse. They are also easy to replicate. Their main weakness is that they rely on self-report: people may not know the true answer (memory and self-insight are limited), may not want to give it (social desirability bias), or may answer carelessly. Response rates can be low, and those who reply may differ from those who do not, an issue of non-response bias.
An interview is a conversation with a purpose. Compared with a questionnaire, it allows the researcher to explain questions, notice when an answer is incomplete and ask for more detail. It is the main method for exploring experiences in depth, such as how people understand their own illness or cope with migration. Interviews vary in how much they are planned in advance.

A structured interview is essentially a questionnaire read aloud. It is used when answers must be compared across many people, as in large mental health surveys, in which trained interviewers read out diagnostic questions exactly as written. Standardisation makes it reliable, but it cannot follow up an interesting answer.
The semi-structured interview is the most widely used form in psychology. The researcher prepares an interview schedule of key questions and possible prompts but follows the participant’s answers. Brown and Harris (1978) used semi-structured interviews with women in Camberwell, south London, to record life events and ongoing difficulties in detail, which allowed the researchers to judge each event in the context of the woman’s life rather than from a checklist.
Unstructured interviews produce the richest data and suit topics that are new or poorly understood, but answers are hard to compare, and the outcome depends heavily on the interviewer’s skill and on the rapport built with the participant.
In a focus group the participants respond to one another as well as to the moderator, which can bring out shared views, disagreements and the language a community uses about a topic. Focus groups are common in health research, for example to understand how a community views a mental health service before it is designed. Their weaknesses are that dominant members can steer the discussion, quieter members may hold back, and participants may conform to the group view, so the data show what people are willing to say in front of others.
Interviews are usually audio-recorded with consent and then written out word for word as a transcript. Transcripts are analysed qualitatively, most often through thematic analysis, in which the researcher codes the text and groups codes into themes. Structured interviews with closed answers can instead be scored and analysed statistically.
Interviews give detailed, qualitative data in the participant’s own words and allow misunderstandings to be cleared up on the spot, which supports the credibility of the findings. Semi-structured and unstructured interviews can explore unexpected topics. Against this, they are slow and expensive, so samples are small; they rely on self-report, with the risk of social desirability bias; and the interviewer can influence answers through tone, appearance or the way questions are asked, which is an interviewer effect. The interpretation of transcripts also depends on the researcher, so reflexivity about their own influence is an essential part of interview research.
Questionnaire | Interview | |
|---|---|---|
Contact with participant | Usually none; completed alone | Direct, in person or remote |
Sample size | Large | Small |
Typical data | Mostly quantitative (closed items) | Mostly qualitative (transcripts) |
Flexibility | None: the same items for everyone | From none (structured) to high (unstructured) |
Main bias | Social desirability, acquiescence, non-response | Social desirability, interviewer effects |
Anonymity | Easy to guarantee | Harder: the interviewer knows who answered |
In a correlational study nothing is manipulated and there are no conditions. The researcher measures two co-variables in the same people (hours of sleep and test score; stress and number of colds) and asks whether they vary together. The data can come from any source: questionnaires, observations, physiological measures or records. For this reason correlation is better thought of as a way of analysing data than a way of collecting it, but it answers a distinct kind of question and has its own strengths and limits.
In a positive correlation, high scores on one variable go with high scores on the other (more revision, higher grades). In a negative correlation, high scores on one go with low scores on the other (more stress, fewer hours of sleep). If there is no correlation, a person’s score on one variable gives no information about their score on the other. Results are plotted on a scatterplot, with one co-variable on each axis and one point per participant.
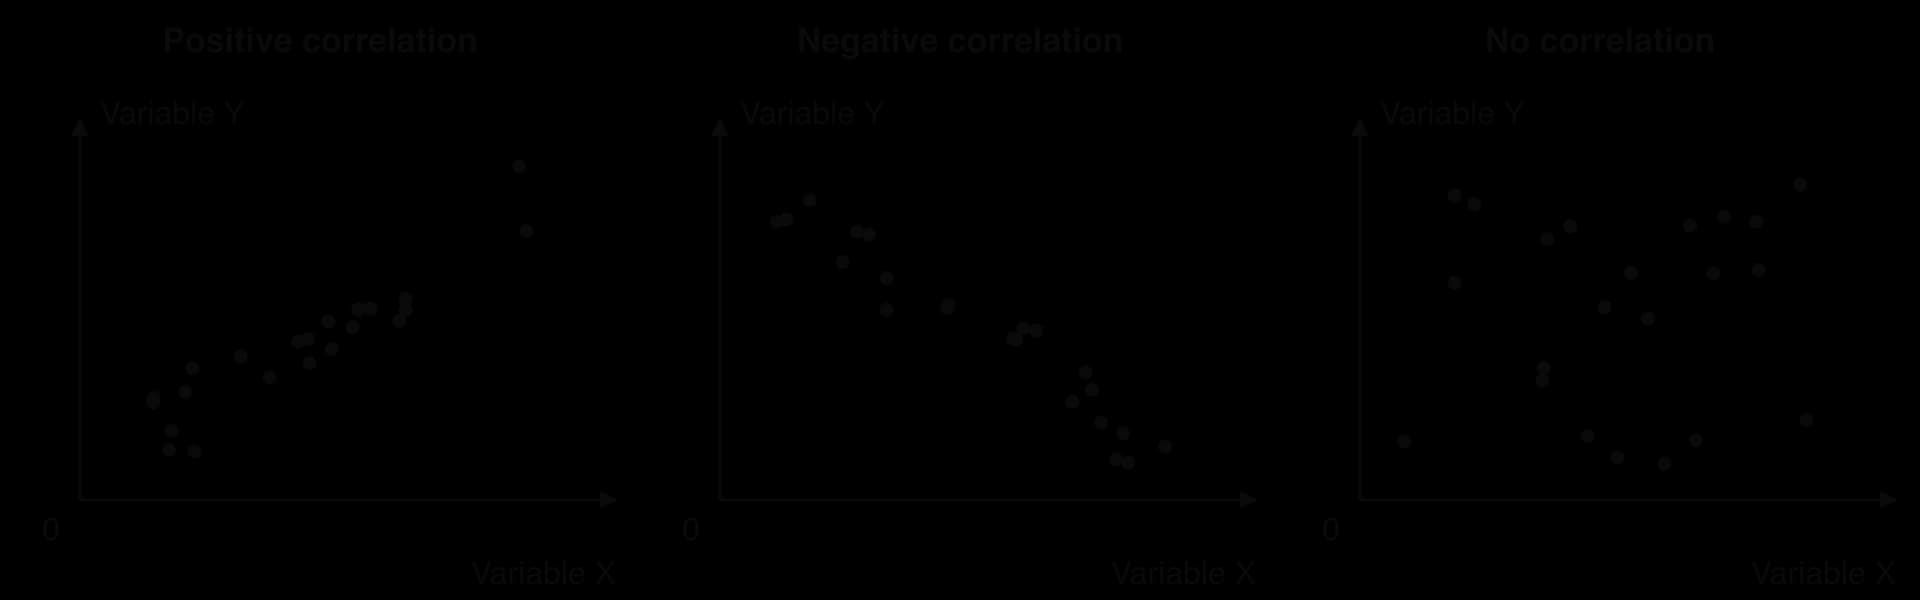
A coefficient of +1 is a perfect positive correlation and −1 a perfect negative one. The sign shows the direction and the size shows the strength, so r = −0.70 is a stronger relationship than r = +0.40. Psychology rarely finds correlations above 0.5, because behaviour has many causes. A coefficient can be statistically significant and still tiny: in a very large sample, r = 0.05 may be significant while explaining almost none of the variation in behaviour.
Dabbs and colleagues (1995) measured testosterone in saliva samples from 692 male prison inmates and compared it with their criminal records and behaviour in prison. Inmates with higher testosterone had more often been convicted of violent crimes. The finding is consistent with the idea that testosterone contributes to aggression, but a correlation alone cannot show this, for two reasons.
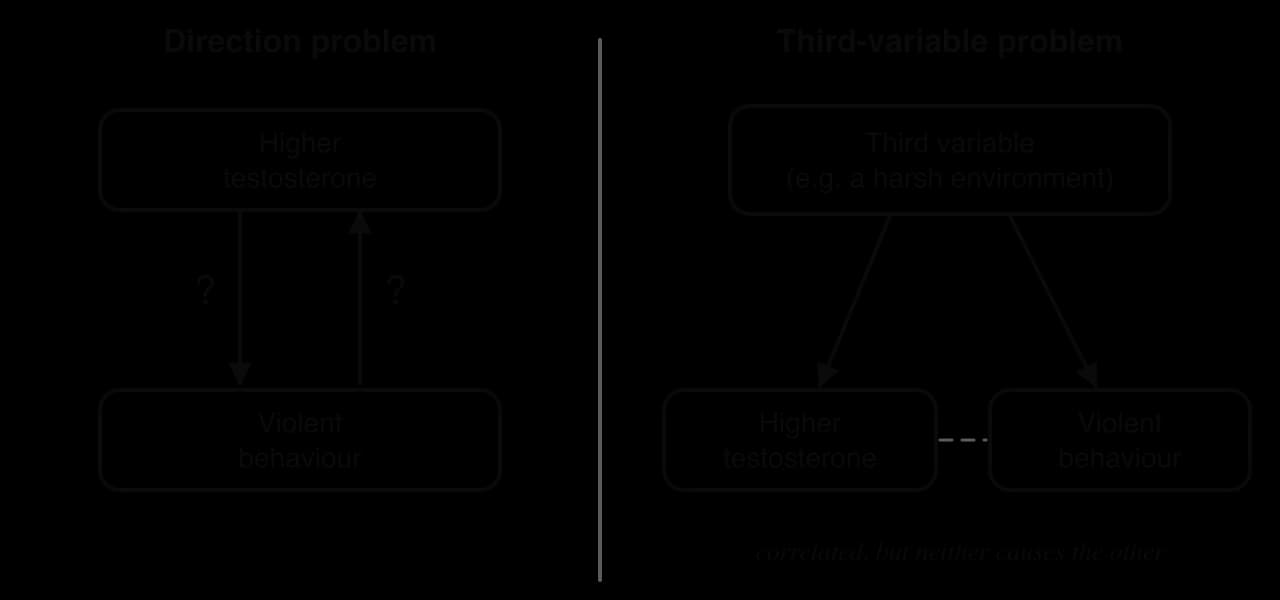
The first is bidirectional ambiguity: the direction of the effect is unknown. Testosterone could increase aggression, but winning fights and dominating others can also raise testosterone, so violent behaviour could be partly the cause rather than only the result. The second is the third variable problem: something else, such as a harsh, threatening environment or alcohol use, could raise both testosterone and violence, producing a correlation even if neither causes the other. A correlation is evidence that a causal link is worth testing, and it may support one, but establishing it needs other methods, such as experiments where they are ethical, or longitudinal data showing which variable changes first.
Correlational studies can examine variables that could never be manipulated, such as hormone levels, childhood poverty or years of education, and they can use very large samples and existing data. They are often the first step that shows whether a relationship exists and how strong it is. Their limitations are the problems of direction and third variables, and the fact that most coefficients describe only straight-line relationships; an inverted-U relationship, such as the one often proposed between arousal and performance, can produce a coefficient near zero even when the variables are strongly related.
A case study is defined by its focus on one case rather than by a technique of data collection. Researchers combine whatever methods fit: interviews with the person and their family, observation, psychometric tests, brain scans and medical or school records. The result is a detailed picture of something rare, unusual or complex that could not be studied in a group, either because there are too few cases or because creating them would be unethical.
The case of Henry Molaison, known as H.M. until his death in 2008, shows the method’s value. In 1953 parts of both his medial temporal lobes, including the front part of the hippocampus, were removed to treat severe epilepsy, and Scoville and Milner (1957) described the results. Afterwards he could not form new long-term memories of events and facts, yet his short-term memory was intact and he improved at a mirror-drawing task over several days while having no memory of practising it. Studied for about 50 years with tests, interviews and later brain scans, his case provided evidence that memory involves separate systems.
The case of Genie, studied by Curtiss (1977), shows the method’s limits. Genie was found in 1970 at the age of about 13 after more than ten years of extreme isolation and neglect. She learned many words but never fully mastered grammar, which was taken as support for a critical period for language. However, she had also suffered malnutrition and abuse, and it remains unclear whether she had a developmental disability from birth, so there is no way to separate the effects of missing language input from the effects of everything else that happened to her.
Because a case study relies on one case, researchers use several sources of evidence and compare them, which is triangulation. Method triangulation combines different methods (interviews and observation); data triangulation uses different sources or times (the person, their family, their teachers); researcher triangulation has more than one researcher collect and interpret the data. When the sources agree, the findings are more credible; when they disagree, the disagreement itself is informative.
Case studies produce rich, detailed, often qualitative data about cases that cannot be created deliberately, and they can challenge a theory with a single counter-example. They also generate hypotheses that can later be tested with groups.
Their limitations are that one case may be unusual in ways that are not known, so findings may not generalise; that they rarely allow cause and effect to be separated, because many things happen to one person at once; that much information is retrospective, relying on memory and old records; and that the researcher’s close, long relationship with the case can bias interpretation. Long-term case studies also raise ethical questions of consent, anonymity and the participant’s welfare, especially when the person cannot fully understand the research.
Any method can be used once or repeatedly, and this choice is the second big decision after the method itself. It matters most for questions about change: development, the course of an illness, or the effect of an event over time.
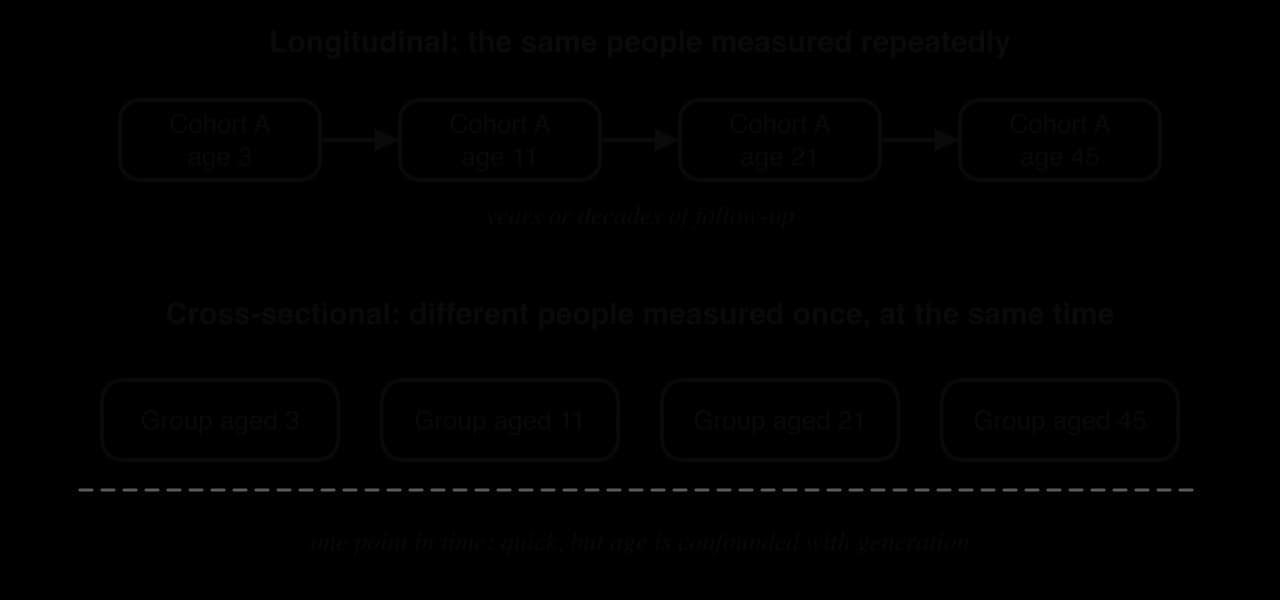
A longitudinal design measures the same participants several times over a long period. It shows how individuals change and which variables come first, which helps with direction of causality, and it avoids comparing different people. It is slow and expensive, and participants drop out over time (attrition), usually not at random. A cross-sectional design compares different groups, often of different ages, at one point in time. It is quick and cheap, but any difference between age groups could be a cohort effect: people born decades apart grew up with different schooling, diets and technology.
The Dunedin Multidisciplinary Health and Development Study in New Zealand has followed 1,037 people born in the city between April 1972 and March 1973, assessing them from age 3 to adulthood. At the age-45 assessment, 94% of the living members still took part. Such a low rate of attrition is rare, and it means that the people still studied in adulthood are almost the same group that was studied as children.
Studies also differ in the direction they look. A prospective study measures possible causes first and then waits to see outcomes, as Dunedin does. A retrospective study starts from an outcome and looks back, often by asking people to remember their past. Retrospective studies are faster, but memories of the past are often inaccurate and can be coloured by the outcome itself; a person who is depressed may remember their childhood more negatively than they would otherwise.
A single study can give a misleading result by chance, especially with a small sample. A meta-analysis gathers all available studies on a question, converts each result into a common measure of effect size, and averages them, giving more weight to larger studies. Smith and Glass (1977), one of the first meta-analyses in psychology, combined the results of several hundred controlled studies of psychotherapy and concluded that, on average, people who received therapy did better than untreated control groups.
Meta-analyses are only as good as the studies they include. If studies with non-significant results are less likely to be published, the average will overestimate the effect, which is publication bias. Combining studies that used different measures and samples can also hide important differences between them, an objection summarised as “mixing apples and oranges”.
No method is best in general. The right method is the one that fits the research question, the population, the resources available and the ethical limits. Three questions narrow the choice quickly.
Is the question about cause and effect? If so, an experiment is preferred. If the IV cannot be manipulated ethically or practically, a natural or quasi-experiment, or a longitudinal correlational study, is the next best option.
Is the question about what people do, or about what they think and feel? Behaviour that people may not report accurately calls for observation. Thoughts, attitudes and experiences call for self-report: questionnaires for breadth, interviews or focus groups for depth.
Is the aim to measure and compare, or to explore and understand? Measuring and comparing calls for quantitative data and larger samples; exploring a new topic or a particular group’s experience calls for qualitative data. Rare cases call for a case study.
Method | Best for | Main strength | Main limitation |
|---|---|---|---|
Experiment | Testing cause and effect | Control allows causal conclusions; replicable | Artificiality; demand characteristics; ethical limits on what can be manipulated |
Observation | What people actually do | Real behaviour, not self-report; high ecological validity if naturalistic | Shows what, not why; observer bias; reactivity; no causal conclusion |
Survey or questionnaire | Attitudes and self-reported behaviour in large samples | Fast, cheap, large samples, anonymous | Self-report biases; fixed answers; response rates |
Interview or focus group | Experiences and meanings in depth | Rich data in participants’ own words; can follow up | Small samples; interviewer effects; time-consuming analysis |
Correlational study | Relationships between variables that cannot be manipulated | Studies real variables; large existing data sets | Direction and third-variable problems |
Case study | Rare or unique cases | Depth; tests theories with unusual cases | Low generalisability; confounds; retrospective data |
Ethical considerations constrain every choice. Harmful variables cannot be manipulated, so research on trauma, poverty or brain injury relies on natural experiments, correlational studies and case studies. Covert observation and deception are acceptable only when there is no alternative and the risk is low. Research with children, patients and other vulnerable participants needs extra safeguards. These limits change the evidence available: much of what is known about the causes of mental health disorders comes from non-experimental methods, which is why conclusions about causes in that area remain cautious.
 YouTube
St Helena is a small island in the South Atlantic with a population of 5,644 at its 1994 census, no daily newspaper, no airport at the time and, until March 1995, no broadcast television; islanders had only watched videos. The arrival of satellite television offered a rare natural experiment on a question usually studied in laboratories: does television change children’s social behaviour? A research team led by Tony Charlton measured children’s behaviour before and after it arrived, using several methods over more than five years.
To find out whether young children’s prosocial and antisocial behaviour in free play changed after broadcast television became available in a community that had not had it before.
The study was a natural experiment: the IV (the availability of broadcast television) changed through an event the researchers did not control, and they compared behaviour before and after it. In the playground study reported by Charlton, Panting, Davie, Coles and Whitmarsh (2000), children aged 3 to 8 were video-recorded during free play in the playgrounds of two of the island’s larger first schools, which had about 160 pupils on roll.
Recording took place during morning, lunch and afternoon breaks over two weeks in 1994, four months before television arrived, and again in 2000, about five years after; 256 minutes were filmed in 1994 and 344 in 2000. The camera operator started recording only once the children had stopped paying attention to them.
The DV was operationalised with a coding scheme, the Playground Behaviour Observation Schedule. Trained coders in the UK watched the tapes in pairs, coded each 60-second segment independently, compared their codes and replayed the segment until they agreed. Eight prosocial and antisocial categories were used, such as hitting, kicking and pushing, seizing or damaging property, sharing and turn-taking, and consoling. Rates of each behaviour per 30 minutes were compared between 1994 and 2000 for eight groupings of children (by sex and group size), giving 64 comparisons.
Other parts of the project triangulated these observations: teachers rated nursery children’s behaviour in cohorts before and after television, a longitudinal study followed a group of young children from age 3–4 to age 8 with diaries of what they watched, and secondary-school students were recorded discussing television’s effects.
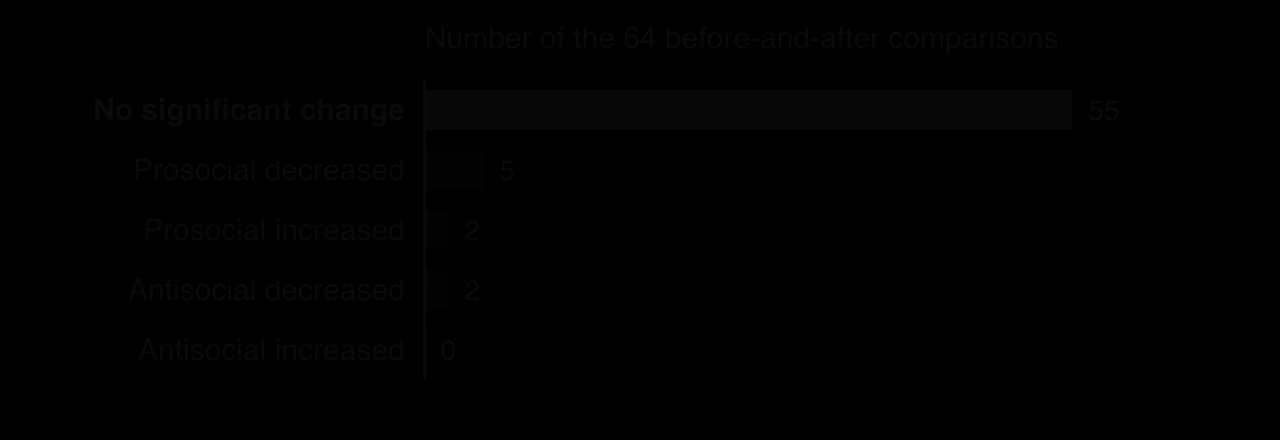
Of the 64 before-and-after comparisons, 55 showed no statistically significant change. Five showed a decrease and two an increase in prosocial behaviour; two showed a decrease in antisocial behaviour, and none an increase.
Across both years, boys performed nearly four times as many antisocial acts as girls, and prosocial acts were about twice as frequent as antisocial ones. Other studies in the project had already found that the island’s children behaved well before television arrived. In the longitudinal part of the project, children who watched television did not differ in behaviour from those who did not.
After five years of broadcast television there was no evidence of the increase in antisocial behaviour that television is often blamed for. The researchers explained the result through the island’s social environment: in a small community where adults know and watch over each other’s children, behaviour is strongly controlled by informal supervision. Secondary-school students recorded discussing the question gave the same explanation: on the island it was hard to behave badly, they said, because everyone watches and knows everyone else.
The study measured real children in their real playgrounds before and after a real change, which a laboratory could never do. Its main weakness is the lack of a control group: every child on the island gained access to television at the same time.
Anything else that changed between 1994 and 2000, such as new teachers, school rules or family incomes, could have affected behaviour, and the children filmed in 2000 were different children from those filmed in 1994. The researchers themselves noted that the playground data could not link any child’s behaviour to how much television that child watched, so no change, or lack of change, can be attributed to television with confidence.
Video allowed every segment to be coded by two people independently and replayed until they agreed, which supports inter-rater reliability, and coding in another country reduced the chance that coders’ knowledge of particular children affected them. The behavioural categories were operationalised clearly. However, the study ran 64 significance tests; at p < 0.05, about three significant results would be expected by chance alone, so a handful of “significant” changes in mixed directions is close to what chance would produce, a multiple comparisons problem. Video also misses facial expression and speech, which carry much of children’s aggression and kindness.
St Helena was chosen because it was unusual, and that limits generalisability. A close-knit island with very low levels of behaviour problems, strong informal supervision and a ceiling of already good behaviour is not typical of large cities, and the Canadian Notel study found the opposite result. The findings therefore suggest that the effects of television depend on the social context in which it is watched, an interaction between media and community, rather than showing that television has no effect anywhere.
Sources: Charlton, T., Panting, C., Davie, R., Coles, D. & Whitmarsh, L. (2000). Children’s playground behaviour across five years of broadcast television: a naturalistic study in a remote community. _Emotional and Behavioural Difficulties, 5(4), 4–12. Charlton, T. & O’Bey, S. (1997). Links between television and behaviour: students’ perceptions of TV’s impact in St Helena, South Atlantic. Support for Learning, 12(3), 130–136._
Every choice of method has consequences that can be described through the six concepts. Evaluating a study usually means asking what its method allows it to conclude and what it cannot.
Concept | How it applies to research methods |
|---|---|
Causality | Only true experiments, with manipulation and random allocation, can establish cause and effect. Quasi-, natural and correlational designs show differences or relationships whose causes remain uncertain. |
Measurement | Each method operationalises constructs differently: a speed estimate, a coded behaviour, a Likert score, an interview theme. The choice decides what kind of data is collected and how reliable and valid it is. |
Bias | Self-report methods are open to social desirability and acquiescence; observations to observer bias; experiments to demand characteristics and researcher expectations; samples to sampling bias. |
Perspective | Quantitative, deductive methods suit testing theories; qualitative, inductive methods suit understanding a group from within (an emic perspective). Using both gives a fuller picture. |
Responsibility | Ethics limit what can be manipulated and how participants can be studied (consent, deception, covert observation, vulnerable groups), and these limits shape what evidence exists. |
Change | Longitudinal designs, natural experiments and randomised controlled trials measure change over time and test whether interventions work. |
Research methods appear in every paper. In Paper 2 Section A the questions name the method of a class practical; in Paper 2 Section B an unseen study must be evaluated through the concepts; and in Paper 1 Section C a concept-based essay is much stronger when it explains how the methods behind the evidence affect what can be concluded. Research methods are not the topic of Paper 1 Section A questions.
Psychology uses six main research methods: experiments, observations, surveys or questionnaires, interviews (including focus groups), correlational studies and case studies; many studies combine several.
Quantitative research collects numbers and usually tests hypotheses; qualitative research collects words or descriptions and explores meanings. Many methods can produce either kind of data.
Experiments manipulate an IV and measure a DV; controls such as standardisation, control groups, random allocation, counterbalancing and blinding stop extraneous variables becoming confounds.
True experiments use random allocation and can establish cause and effect; quasi-experiments compare existing groups, and natural experiments use changes the researcher did not cause, so their causal conclusions are weaker.
Independent samples, repeated measures and matched pairs designs deal with participant variables in different ways; repeated measures needs counterbalancing to control order effects.
Observations vary in setting (naturalistic or controlled), awareness (overt or covert) and role (participant or non-participant); they record real behaviour but not its reasons.
Questionnaires reach large samples with standardised items; interviews and focus groups explore experiences in depth; both rely on self-report and its biases.
Correlational studies measure relationships (−1 to +1) but cannot show cause because of bidirectional ambiguity and third variables; case studies give depth on rare cases but are hard to generalise.
The choice of method depends on the research question, practical limits and ethics, and it decides what can be concluded about causality, measurement and bias.
I can describe each of the six research methods and their sub-types, with a real example of each.
I can explain the difference between quantitative and qualitative research.
I can explain independent, dependent, extraneous and confounding variables, and write operationalised null and alternative hypotheses.
I can compare and contrast laboratory, field, natural and quasi-experiments and the three experimental designs.
I can explain how controls, random allocation and counterbalancing deal with extraneous variables.
I can evaluate each method, including how ethical considerations limit research.
I can design a study for a research question and justify the method, variables and design.
I can discuss the St Helena study with reference to causality, measurement and bias.