Design, give and score a questionnaire on a relationships topic, apply the ethical rules for school research, evaluate self-report data and answer the four kinds of question asked about the method.
Each is in the Psychology glossary, with every other term in the subject.
A survey or interview question that asks about two things at once, so that a single answer cannot show which part the respondent is responding to.
A sampling bias that arises when the people who do not respond to a survey differ systematically from those who do, so the results misrepresent the target population.
The percentage of people invited to take part in a survey who actually complete it; a low response rate increases the risk of non-response bias.
A questionnaire technique in which some items are worded in the opposite direction and their scores are reversed before totalling, to detect and reduce acquiescence bias.
Describe questionnaires as a research method, including the main types of item.
Explain how to plan a questionnaire practical on a human relationships topic, including its aim, sample and mode of administration.
Apply the ethical rules for school practicals to a questionnaire.
Design questionnaire items that operationalise a construct, avoiding leading, double-barrelled and ambiguous wording, and use reverse scoring.
Explain how response rate, non-response bias, social desirability and acquiescence affect questionnaire data.
Describe how questionnaire data are scored and analysed, and explain why most questionnaire findings are correlational.
Evaluate questionnaires with reference to a published questionnaire study of relationships.
Compare and contrast questionnaires with other methods, and design another method on the same topic.
A questionnaire is a research method in which participants answer a fixed set of written questions about their behaviour, attitudes, beliefs or experiences. The terms “survey” and “questionnaire” are used interchangeably for this method. It is the method of the class practical in the human relationships context, because much of what matters in relationships, such as trust, attachment, attraction and belonging to a group, can be measured as people’s own ratings, in large samples and across cultures.
Questionnaires are quick to give and easy to score, but every finding depends on how well the items measure what they claim to measure. They raise questions of measurement (how a construct becomes a score), bias (who answers and how honestly) and causality (what a relationship between two scores can and cannot show).
With a free account, Augment remembers where you stopped and what you have practiced.
A questionnaire is a form of self-report: participants describe themselves rather than being observed or tested. Because every participant receives exactly the same questions in the same order, the answers are standardised and can be compared and added up. Most questionnaires produce quantitative data from closed questions, sometimes with a few open questions that produce qualitative data.
Questionnaires are used in two main ways. Some describe a population, for example how many students have friends they have only met online. Others measure two or more variables in the same people to see whether they are related, for example whether attachment style is related to how long relationships last. Questionnaires of the second kind are a form of correlational research: they measure variables as they occur, without manipulating anything.
Many constructs in human relationships, such as relationship satisfaction, trust, loneliness, attitudes to other groups or ideas about love, cannot be seen directly but can be reported. A questionnaire can measure them in a large sample quickly and anonymously, which suits personal topics. Because the same items can be translated and given in many countries, questionnaires are also the main tool of cross-cultural research on relationships.
Levine and colleagues (1995) asked college students in eleven countries a single question: whether they would marry someone who had all the qualities they desired if they were not in love with that person. Students in India, Pakistan and Thailand were much more likely to say yes than students in the United States, England or Australia. One standardised item made a comparison across eleven cultures possible, although a single item captures only a small part of what love and marriage mean in each culture.
Sources: Levine, R., Sato, S., Hashimoto, T. & Verma, J. (1995). Love and marriage in eleven cultures. _Journal of Cross-Cultural Psychology, 26(5), 554–571._
A questionnaire aim usually names one or more constructs and a population: “to investigate whether there is a relationship between the amount of time Grade 11 students spend messaging friends online and how close they feel to their friends.” Each construct then becomes a variable that will be measured by one or more items. The aim may lead to a hypothesis, such as a predicted positive correlation between the two scores.
Researchers can use a published, validated scale or write their own items. Published scales have usually been tested for reliability and validity and allow results to be compared with other studies. The Experiences in Close Relationships scale, developed by Brennan, Clark and Shaver (1998), for example, measures adult attachment with 36 items on two continuous dimensions, anxiety and avoidance. The Rosenberg Self-Esteem Scale has ten items, half worded positively and half negatively.
Writing new items allows a scale to fit the exact aim and the population, but its reliability and validity are unknown. In a class practical, students often combine the two: they adapt a few items from a published scale and add some of their own, then pilot the result.
The target population might be all students in one school or year group. Questionnaire practicals usually use opportunity sampling (a class that is available) or self-selected sampling (a link shared with anyone who wants to take part). The minimum sample for a student-led questionnaire practical is ten participants, but larger samples give more stable results and are easy to obtain because each questionnaire takes only a few minutes.
A questionnaire can be given on paper in a room or online. Paper in a supervised room gives a high response rate and lets the researcher answer questions about wording, but participants may feel watched. Online forms are fast and private, which may make answers more honest, but anyone can ignore the invitation, and the researcher cannot see whether participants understood the items.
Questionnaires can feel harmless because participants only tick boxes, but the same ethical principles apply to them as to any study. Schools add rules for class practicals, and some relationships topics, such as romantic or sexual relationships and conflict at home, are too sensitive to ask students about.
Rule for school practicals | What it means for a questionnaire |
|---|---|
Teacher supervision | The teacher approves the items and the way participants are recruited before the questionnaire is given. |
Informed consent | Questionnaires still need written consent. A consent page at the start explains the aim, how long it takes, that taking part is voluntary and that any question can be skipped; participants confirm before starting. Under-16s need parental consent. |
Right to withdraw | Participants can stop at any point. Because anonymous answers cannot be traced, the consent page explains that answers cannot be withdrawn after submission, or gives each participant a code to quote if they want their data removed. |
No harm and no sensitive items | No items about abuse, self-harm, mental health problems, sexual behaviour, bullying or family conflict. Suitable topics include friendship, group belonging, attitudes to online communication and qualities people value in friends. |
Anonymity and data protection | No names or details that could identify someone; data stored securely, used only for the agreed purpose and deleted afterwards, including online form results. |
Debriefing | A final page or message thanks participants, explains the aim fully and says how to see the results. |
These rules affect the data in both directions. Anonymity reduces social desirability bias, so answers about friendships or attitudes may be more honest. Allowing participants to skip items leaves gaps that make some totals impossible to calculate, and people who choose to take part in a study of friendship may be those with more friends to report.
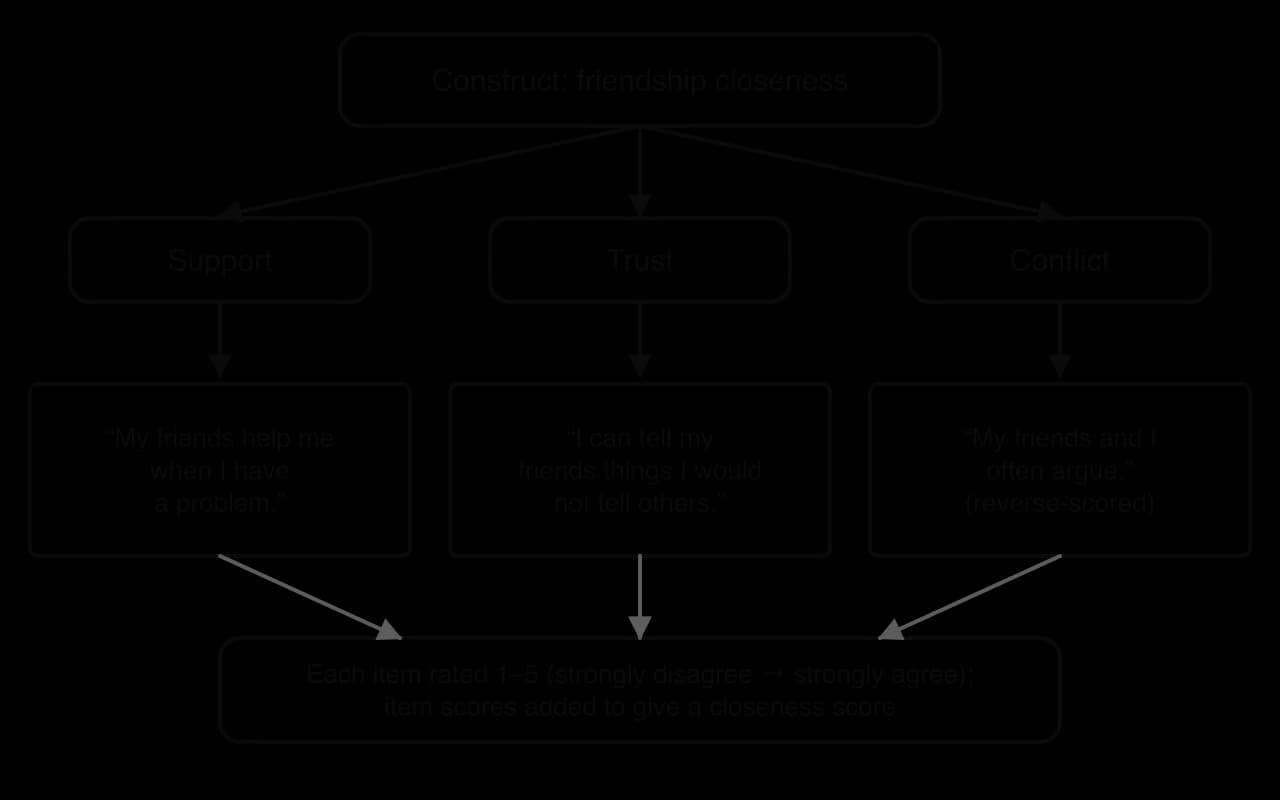
A construct such as friendship closeness has several aspects. The researcher first decides which aspects to measure and then writes items for each one. The participant’s score on the construct is usually the total, or mean, of their answers to those items. This process is operationalisation, and it decides the construct validity of the questionnaire: how far the score truly reflects the construct.
Item type | Example | Data and use |
|---|---|---|
Closed: yes/no or fixed choice | “I have a friend online whom I have never met in person.” Yes / No | Counts and percentages; quick but crude |
Multiple choice | “Number of close friends:” 0 / 1–2 / 3–5 / 6 or more | Categories; options must not overlap |
Likert scale | “My friends support me when I have a problem.” Strongly disagree 1 2 3 4 5 Strongly agree | Ordinal ratings, totalled across items; the most common format |
Rating scale | “How important is kindness in a friend?” 0 (not at all) to 10 (essential) | Ratings that can be compared across items |
Ranking | “Rank these five qualities of a friend from most to least important.” | Relative importance; forces choices |
Forced choice between descriptions | Three short paragraphs, each describing a way of feeling in close relationships; the participant chooses the one that fits best | A category per person; used by Hazan and Shaver (1987) |
Open | “What makes a friendship last?” | Qualitative answers, analysed with content analysis |
Different formats can be used to check each other. Buss (1989), in his study of what people in 37 cultures want in a long-term partner, asked participants both to rate a list of characteristics for their importance in a partner and to rank a second list in order of preference. Using two formats meant that a preference, such as men valuing physical attractiveness more than women, could be checked across both measures rather than resting on one response format.
Item wording has a large effect on answers. Small changes, such as a loaded word or a missing time frame, can shift the percentage of people who agree. Good items are short, clear, neutral and about one thing, and the response options cover all possible answers without overlapping.
Problem | Why it matters | How to avoid it |
|---|---|---|
Leading question | Suggests the expected answer, so participants agree to please the researcher | Use neutral wording; balance agree and disagree statements |
Double-barrelled question | Asks two things at once, so one answer cannot be interpreted | Split into two items |
Double negative | Hard to understand, so answers are random | Use positive or single negative wording |
Jargon or vague words | Participants interpret words differently (“often”, “close”) | Use everyday words and define terms; give time frames (“in the last week”) |
Overlapping or missing options | Some participants fit two categories or none | Make categories exclusive and complete; include “none” or “other” |
Assumption | Assumes a behaviour, for example an item on how often the participant argues with a partner they may not have | Ask whether it applies first, or rephrase |
 YouTube
Some people tend to agree with statements whatever they say, a response style called acquiescence bias. If every item in a closeness scale is worded positively (“I trust my friends”), a participant who agrees with everything will get a high closeness score that says nothing about their friendships. The standard solution is reverse scoring: some items are worded in the opposite direction and their scores are reversed before they are added up.
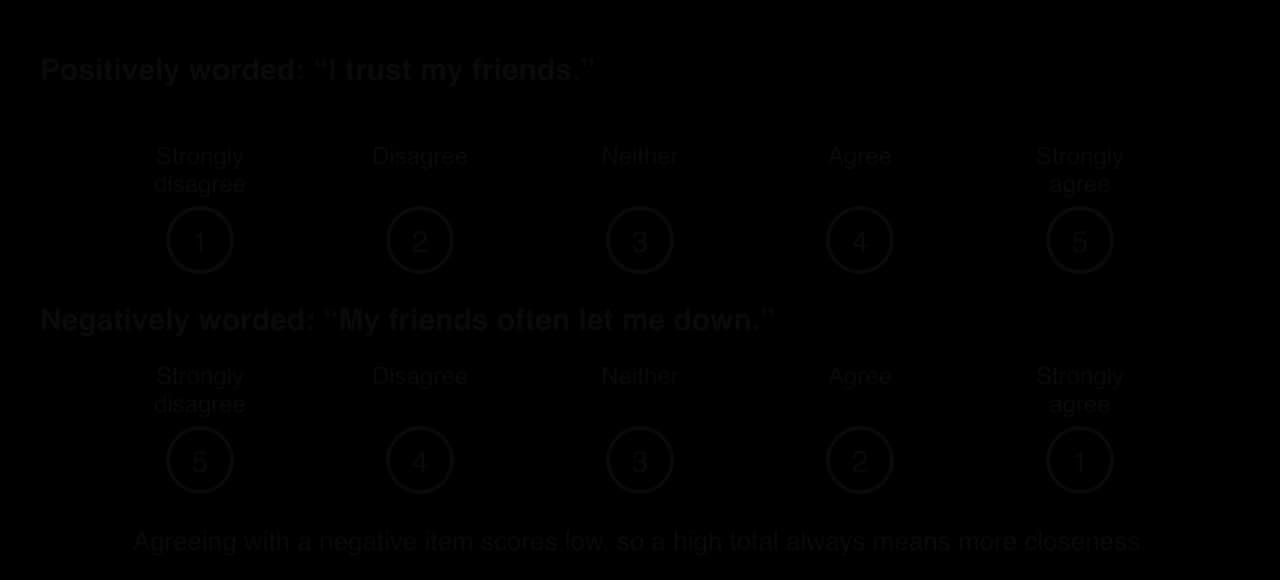
On a five-point scale, a reversed score is 6 minus the original score, so 5 becomes 1, 4 becomes 2 and 3 stays 3. A participant who agrees strongly with both “I trust my friends” and “My friends often let me down” has given contradictory answers, which suggests they were not reading carefully or were simply agreeing. Reverse-worded items therefore also help to spot unreliable responses.
A questionnaire opens with the consent page and easy, non-threatening items, groups items on the same topic together and puts demographic questions, such as age and gender, at the end. It is kept short, because tired or bored participants answer carelessly. A pilot study with a few people who are not in the sample shows how long it takes, which items are unclear, and whether some items get the same answer from everyone and so tell the researcher nothing.
 YouTube
Not everyone invited to complete a questionnaire does so. If those who respond differ from those who do not, the results misrepresent the population, which is non-response bias. A questionnaire about friendship sent to a whole year group might be completed mainly by students who are confident about their friendships, while students who feel isolated ignore it. Such a sample would overestimate how close students feel to their friends.
Non-response bias cannot be removed completely, but it can be reduced. Short questionnaires, a clear explanation of the aim, reminders, and giving the questionnaire in a lesson rather than by email all raise response rates. Reporting the response rate lets readers judge how much the sample may be biased.
Even participants who respond may not answer accurately. Social desirability bias leads people to present themselves well, for example by reporting more friends or fewer arguments. Tourangeau and Yan (2007) reviewed research on sensitive questions in surveys and concluded that misreporting is common, that it depends on whether the person has anything embarrassing to report, and that it is reduced when questionnaires are self-administered rather than asked by an interviewer, because people edit their answers less when no one is present.
Sources: Tourangeau, R. & Yan, T. (2007). Sensitive questions in surveys. _Psychological Bulletin, 133(5), 859–883._
Other self-report problems include the tendency to choose the middle option on every scale, limited insight into one’s own behaviour, and inaccurate memory for the past, especially when items ask about childhood. Anonymity, neutral wording, reverse-scored items and asking about recent, specific behaviour all reduce these problems.
Analysis starts with scoring: reverse-scoring negative items, then adding or averaging each participant’s items to give one score per construct. Descriptive statistics then summarise the sample, such as the mean closeness score or the percentage of participants choosing each option. Because Likert totals are ordinal data with limited ranges, the median is sometimes a better summary than the mean.
When two scores are measured in the same participants, the researcher can calculate a correlation coefficient to describe how strongly they are related, from −1 (perfect negative) through 0 (no relationship) to +1 (perfect positive). Plotting one score against the other on a scatterplot shows the pattern and any unusual participants. Open items are analysed with content analysis, for example by counting how often answers mention “trust” or “humour”.
Concept | How it applies to a questionnaire practical |
|---|---|
Bias | Social desirability and acquiescence in answers; leading items written by the researcher; self-selection and non-response in the sample; cultural bias if items assume one culture’s idea of a relationship. |
Causality | Questionnaires usually measure variables as they occur, so they show correlations, not causes. Bidirectional ambiguity and third variables limit every causal claim. |
Change | Repeating the same questionnaire over time (a longitudinal design) can track change, for example in attitudes to another group before and after a contact programme. |
Measurement | Constructs are operationalised as items; several items per construct and reverse scoring improve reliability; validity depends on whether items capture the construct and on honest answers. |
Perspective | Closed items impose the researcher’s categories, an etic view; open items let participants answer in their own terms. Translated questionnaires may not mean the same thing in every culture. |
Responsibility | Consent pages, the right to stop, anonymity, no sensitive items, secure storage and deletion of online data, and a debrief. |
Measurement is the concept most closely tied to the design of the tool itself. A questionnaire with vague, leading or double-barrelled items gives numbers that look precise but measure something other than the construct. This is why piloting and the use of tested scales matter so much in questionnaire research.
The following worked practical follows a questionnaire from aim to analysis. The results are hypothetical.
The closeness scale combined items adapted from published friendship measures with items written by the class. A pilot with three Grade 12 students showed that the item “My friends get me” was understood differently by each of them, so it was rewritten as “My friends understand how I feel.”
After scoring, each participant had two numbers: a messaging category and a closeness total. The class summarised and plotted them.
Hazan and Shaver used two questionnaire studies to test whether adult romantic love could be understood as an attachment process, like the bond between infants and their carers. The study is a classic example of a questionnaire on relationships, with a large self-selected sample and an unusual forced-choice item.
The researchers aimed to find out whether the three attachment styles identified in infants (secure, avoidant and anxious/ambivalent) also appear in adults’ romantic relationships, in roughly similar proportions, and whether adults’ attachment styles are related to how they experience love and to how they remember their relationships with their parents.
In Study 1, a “love quiz” was printed in a local newspaper, the Rocky Mountain News, in Denver, USA, and readers were invited to send in their answers. The first 620 replies were analysed: 205 men and 415 women aged 14 to 82, with a mean age of 36. In Study 2, 108 university students (38 men and 70 women, mean age 18) completed a similar questionnaire as a class exercise.
Attachment style was operationalised by a single forced-choice item. Participants read three short paragraphs, each describing one style (for example, the secure paragraph described finding it easy to get close to others and not worrying about being abandoned), and chose the one that best described their feelings in relationships. Other sections asked participants to focus on their most important love relationship and rate statements about it on a four-point agree–disagree scale, to answer questions about the relationship such as how long it had lasted, and to describe their childhood relationships with each parent.
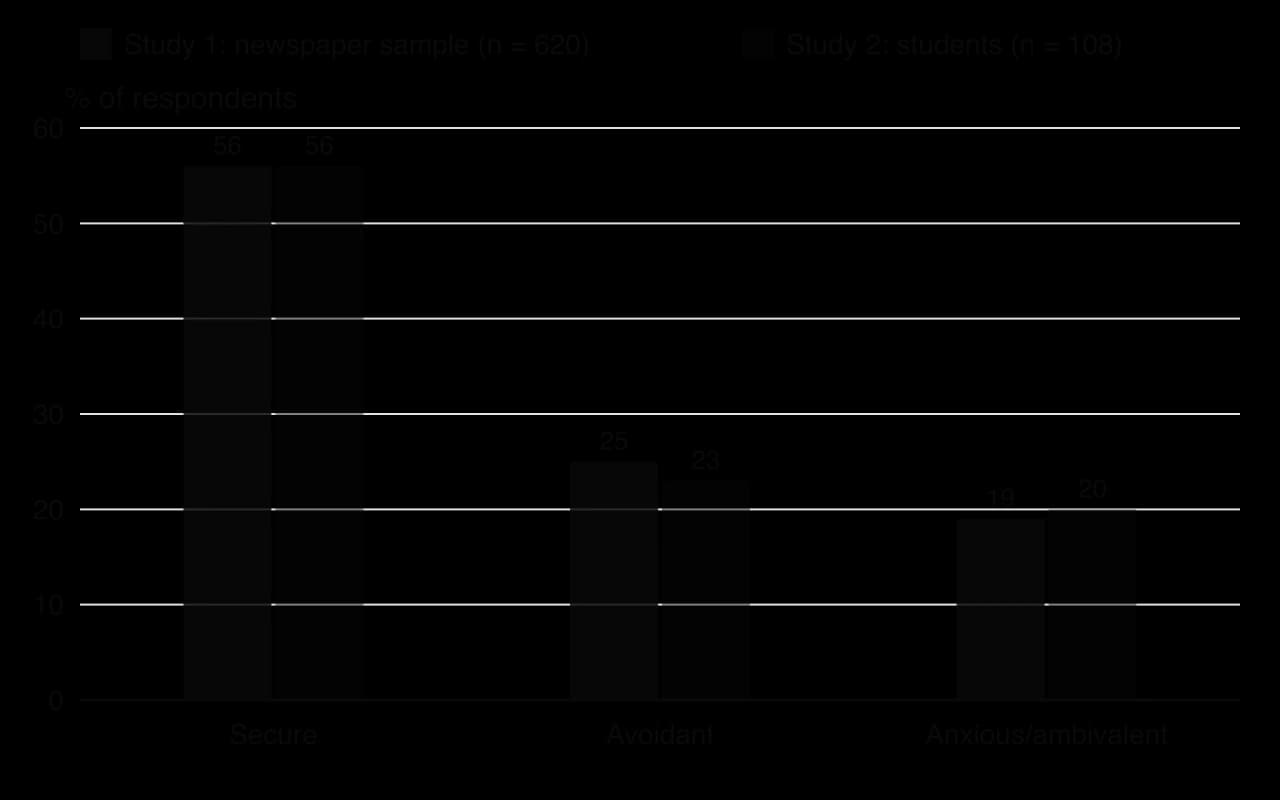
About 56% of respondents in both studies chose the secure description, about a quarter the avoidant one and about a fifth the anxious/ambivalent one. The styles were related to how people described their most important love relationship. Secure respondents described love as happy, friendly and trusting; avoidant respondents reported fear of closeness and emotional highs and lows; anxious/ambivalent respondents described obsession, a desire for union, jealousy and extreme attraction.

Attachment style was also related to participants’ memories of their parents. Secure respondents described their parents as available and responsive; avoidant respondents described them as rejecting; anxious/ambivalent respondents described them as inconsistent. The correlations were statistically significant but not strong, and they were stronger in the younger student sample than in the older newspaper sample.
Sources: Hazan, C. & Shaver, P. (1987). Romantic love conceptualized as an attachment process. _Journal of Personality and Social Psychology, 52(3), 511–524._
Adult romantic relationships show the same three styles as infant attachment, in similar proportions, and the styles predict how love is experienced. The researchers argued that internal working models formed in childhood may carry over into adult love, while warning that the weak correlations meant that adult attachment is far from fixed by childhood experience.
Operationalising attachment with one choice among three paragraphs was simple and could be printed in a newspaper, but it forced each person into one category and could not show degrees of security. Later researchers replaced it with multi-item scales measuring attachment anxiety and avoidance as continuous dimensions, such as the Experiences in Close Relationships scale, which are more reliable. Memories of parents were retrospective self-reports, which may be distorted by current relationships and mood.
The newspaper sample was self-selected: readers who chose to complete a quiz about love, two-thirds of them women, from one region of the USA. Such volunteers may be more interested in relationships, or more likely to have had memorable ones, than the population. Study 2’s replication with students reduced but did not remove this concern, since students are another non-representative group. Answers were anonymous, which reduces social desirability bias, but people may still prefer to see themselves as secure.
The data are correlational. Secure people had longer relationships, but long, happy relationships may make people feel secure, rather than the reverse. Both samples were American, and the three-style framework came from research on American infants, so the study cannot show that the same styles and proportions apply in other cultures.
Paper 2 Section A asks four questions on one class practical, named by its method: describe how the method was used [4], explain one concept in relation to it [4], compare and contrast it with another method [6], and design a study on the same topic with a different method [6]. The model answers use the worked practical on online contact and friendship closeness.
An explain question names one concept. The answer explains the concept and links it to specific features of the practical.
Compare and contrast answers need similarities and differences, each tied to both methods.
A questionnaire (or survey) is a self-report method with a fixed set of written items, mostly closed, producing mainly quantitative data.
It suits human relationships because constructs such as trust, attachment and belonging can be self-reported in large, anonymous and cross-cultural samples.
Constructs are operationalised as several items, often Likert items; published scales have known reliability and validity.
Good items are short, neutral and about one thing; leading, double-barrelled, double-negative and vague items distort answers.
Reverse scoring of negatively worded items reduces and detects acquiescence bias.
Response rate and non-response bias affect who answers; social desirability and acquiescence affect how they answer; anonymity helps.
Questionnaires still need written consent, the right to stop, no sensitive items, anonymity and deletion of data.
Scores are summarised with descriptive statistics; relationships between two scores are correlational and cannot show causality.
Hazan and Shaver (1987) found about 56% secure, 25% avoidant and 19% anxious/ambivalent adults in a self-selected newspaper sample, using one forced-choice item.
I can describe questionnaires and the main types of item.
I can explain how to plan a questionnaire practical on a relationships topic.
I can apply the ethical rules for school practicals to a questionnaire.
I can write items that operationalise a construct and calculate scores with reverse scoring.
I can explain response rate, non-response bias, social desirability and acquiescence.
I can describe how questionnaire data are analysed and explain why they are usually correlational.
I can evaluate questionnaires with reference to Hazan and Shaver (1987).
I can compare and contrast questionnaires with interviews, and design an experiment on the same topic.