Describe what MRI, fMRI, PET and EEG measure and how, compare their strengths and limitations, and evaluate the value of brain imaging for investigating behaviour.
Each is in the Psychology glossary, with every other term in the subject.
An error in brain imaging data that comes from something other than the brain process being studied, such as head movement, breathing or the scanner itself.
The blood-oxygen-level-dependent signal measured by fMRI: a change in the magnetic properties of blood as oxygen-rich blood flows to more active brain areas.
A set of techniques that produce pictures of the living brain's structure or activity without surgery, such as MRI, fMRI, PET and EEG.
A structural imaging technique that combines many X-ray images taken from different angles into cross-sectional pictures of the brain.
A technique that records the brain's electrical activity through electrodes on the scalp, showing changes in activity millisecond by millisecond.
A pattern of EEG activity linked in time to a specific stimulus or event, found by averaging the recordings from many repeated trials.
A functional brain imaging technique that tracks changes in blood oxygenation (the BOLD signal) to show which brain areas are more active during a task.
A structural brain imaging technique that uses a strong magnetic field and radio waves to produce detailed images of brain anatomy without radiation.
Describe the difference between structural and functional brain imaging, and between spatial and temporal resolution.
Explain how MRI, fMRI, PET and EEG work and what each one measures, with CT and MEG in outline.
Compare and contrast brain imaging techniques in terms of resolution, invasiveness, cost and the questions they can answer.
Explain the use of brain imaging to investigate behaviour, with examples from several contexts.
Evaluate brain imaging research with reference to measurement, causality, bias and responsibility.
Describe and evaluate the PET study of murderers by Raine, Buchsbaum and LaCasse (1997).
Apply knowledge of brain imaging to an unfamiliar research scenario.
Brain imaging techniques produce pictures of the structure or activity of the living brain without opening the skull. They allow psychologists to study which brain areas are involved in memory, emotion, decision-making and relationships, and how brains differ between groups of people, in ways that were impossible before the late twentieth century.
Brain imaging is central to the biological approach, but it is also used to test cognitive and sociocultural theories, for example by asking whether people from different cultures process information about the self in the same brain areas. Its main conceptual issue is measurement: every technique measures something other than thinking itself, such as blood flow, glucose use or electrical signals at the scalp, so a psychologist always has to infer the mental process from what was measured.
With a free account, Augment remembers where you stopped and what you have practiced.
A functional imaging technique that records the tiny magnetic fields produced by the brain's electrical activity, with millisecond timing and better localisation than EEG.
A functional brain imaging technique that detects a radioactive tracer injected into the blood, showing how much glucose or another substance different brain areas use.
Reasoning backwards from activity in a brain area to the presence of a particular mental process, which is unreliable because most areas take part in many processes.
How precisely a brain imaging technique can show where activity or a structure is located, measured as the smallest area it can tell apart.
How precisely a brain imaging technique can show when activity happens, measured as the shortest time between changes it can tell apart.
Scope: An approach term in the biological approach: the value of one or more brain imaging techniques in investigating behaviour. Questions can ask about any technique, with any example, and brain imaging is applied in all four contexts. MRI, fMRI, PET and EEG are taught in detail; CT and MEG in outline.
Before imaging, the only ways to link behaviour to the brain were to study people with brain damage, often only after their death, or to experiment on animals. Brain imaging allows researchers to study healthy, living people while they perform tasks, and to compare groups of people with each other.
Imaging techniques fall into two groups. Structural techniques, such as computerised tomography (CT) and magnetic resonance imaging (MRI), show the anatomy of the brain: the size and shape of its parts, damage from injury, or tumours. They answer the question “what does this brain look like?”.
Functional techniques, such as functional MRI (fMRI), positron emission tomography (PET) and electroencephalography (EEG), show brain activity: which areas are working harder during a task, or how activity changes over time. They answer the question “what is this brain doing?”. Most psychological research on behaviour uses functional imaging, often alongside a structural scan that shows where the activity is located.
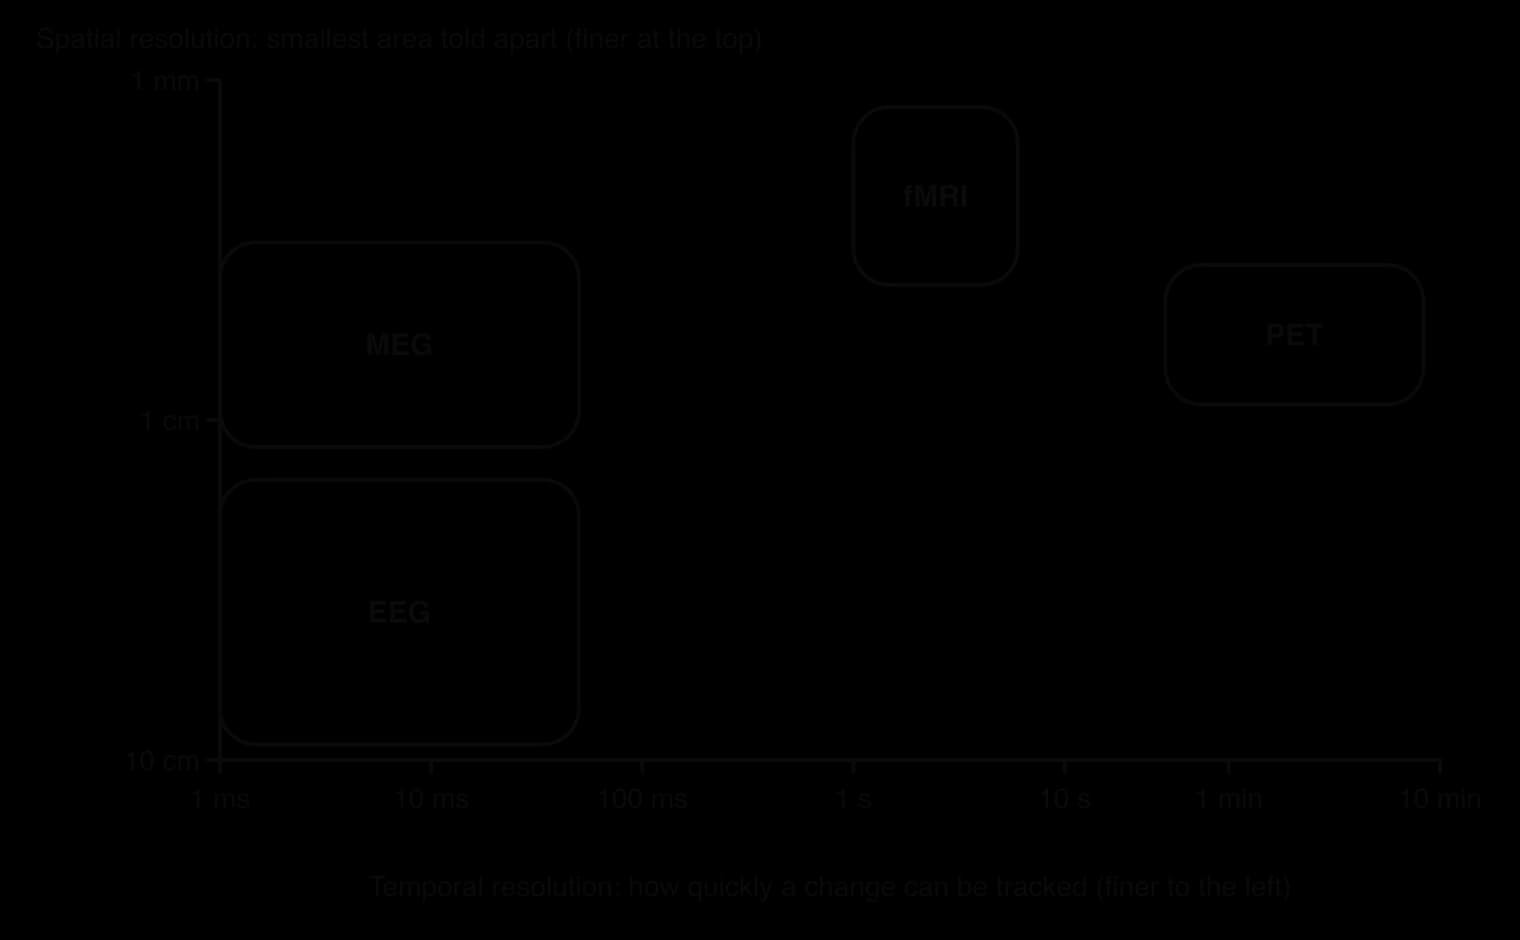
Techniques differ in two kinds of precision. Spatial resolution is how precisely a technique shows where something is: fMRI can separate areas a few millimetres apart, while EEG can only say roughly which part of the scalp a signal came from. Temporal resolution is how precisely a technique shows when something happens: EEG records changes within milliseconds, while fMRI blurs activity over several seconds.
The trade-off between the two kinds of resolution means that the right technique depends on the question. A researcher who wants to know which area of the brain responds to faces needs good spatial resolution; one who wants to know how quickly the brain notices that a word does not fit a sentence needs good temporal resolution.
Computerised tomography takes many X-ray images from different angles around the head, and a computer combines them into cross-sectional “slices” of the brain. CT is fast, widely available and relatively cheap, so hospitals use it to check for bleeding or injury after a stroke or head injury. Its images are less detailed than MRI, and because it uses X-rays it exposes the person to radiation, so it is rarely used in psychological research with healthy participants.
Magnetic resonance imaging uses a very strong magnetic field and pulses of radio waves. The magnetic field lines up hydrogen atoms in the water and fat of the body’s tissues; a radio pulse knocks them out of line, and as they return they give off a signal that differs between tissues. A computer turns these signals into detailed images in which grey matter, white matter and fluid can be told apart.
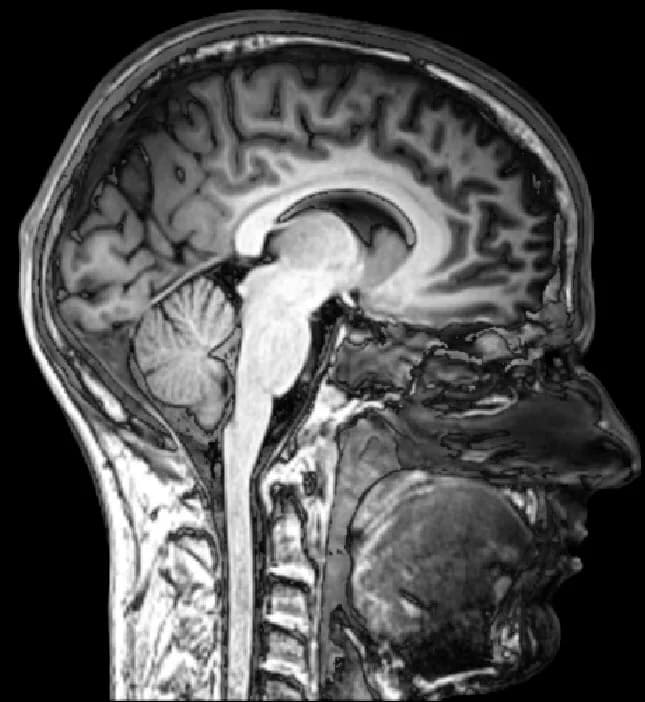
An MRI image is built from many tiny cubes called voxels, each about one cubic millimetre, which is the three-dimensional version of a pixel. Researchers can measure the volume of a structure, or use a computer method called voxel-based morphometry to compare the amount of grey matter in every voxel between two groups of people.
Maguire et al. (2000) used both methods to compare the brains of licensed London taxi drivers with those of men who did not drive taxis. The posterior (rear) part of the hippocampus was larger in the drivers, and its volume correlated with the time each man had spent driving a taxi. Structural MRI made it possible to measure a small difference in one structure precisely, although a single scan of each person could not show whether driving had enlarged the hippocampus or whether people with larger hippocampi became drivers.
Structural MRI has also been used to re-examine historical evidence. Dronkers et al. (2007) scanned the preserved brains of two of Paul Broca’s nineteenth-century patients and found that their damage reached much deeper than the surface area Broca had described, which changed what is understood by the localisation of speech production.
Strengths: very detailed images (about 1 mm); no radiation, so it is safe to repeat and suitable for children and longitudinal studies; allows precise measurement of the size of structures.
Limitations: shows structure only, not activity; expensive; the participant must lie still in a narrow, noisy tube, which some find distressing and which is impossible for people with some metal implants; group differences in size are correlational and do not show cause.
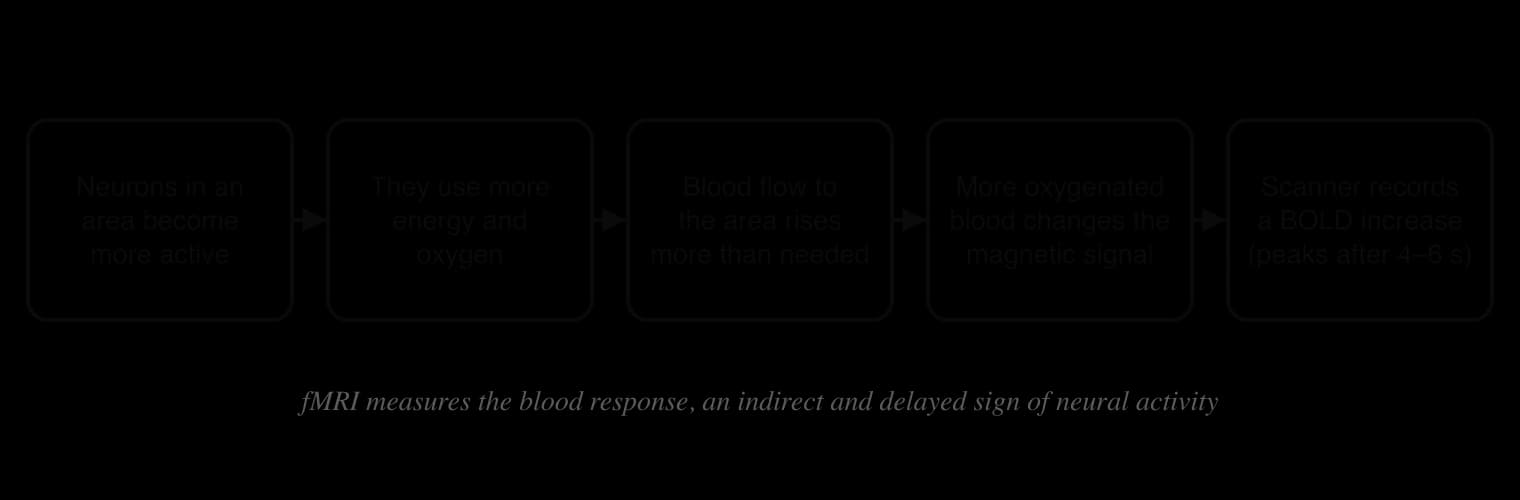
Functional magnetic resonance imaging uses the same scanner as MRI, but takes a rapid series of images, often one of the whole brain every one or two seconds, while the participant performs a task. It does not measure neurons directly. It measures the BOLD signal (blood-oxygen-level-dependent signal), which depends on how much oxygen the blood in each area is carrying.
When neurons in an area become more active, they use more energy and oxygen. The blood supply to the area then increases, and it delivers more oxygen than is used, so the proportion of oxygen-rich blood in the area rises. Oxygen-rich and oxygen-poor blood have different magnetic properties, so the MRI signal from the area changes. The increase in the signal peaks about four to six seconds after the neural activity, which is why fMRI has poor temporal resolution.
The brain is always active, so a scan during a task on its own shows activity almost everywhere. Researchers therefore compare a task condition with a control condition that is identical except for the process being studied, and subtract one from the other. The areas left over are those more active in the task condition, and statistical tests decide which differences are large enough to report.
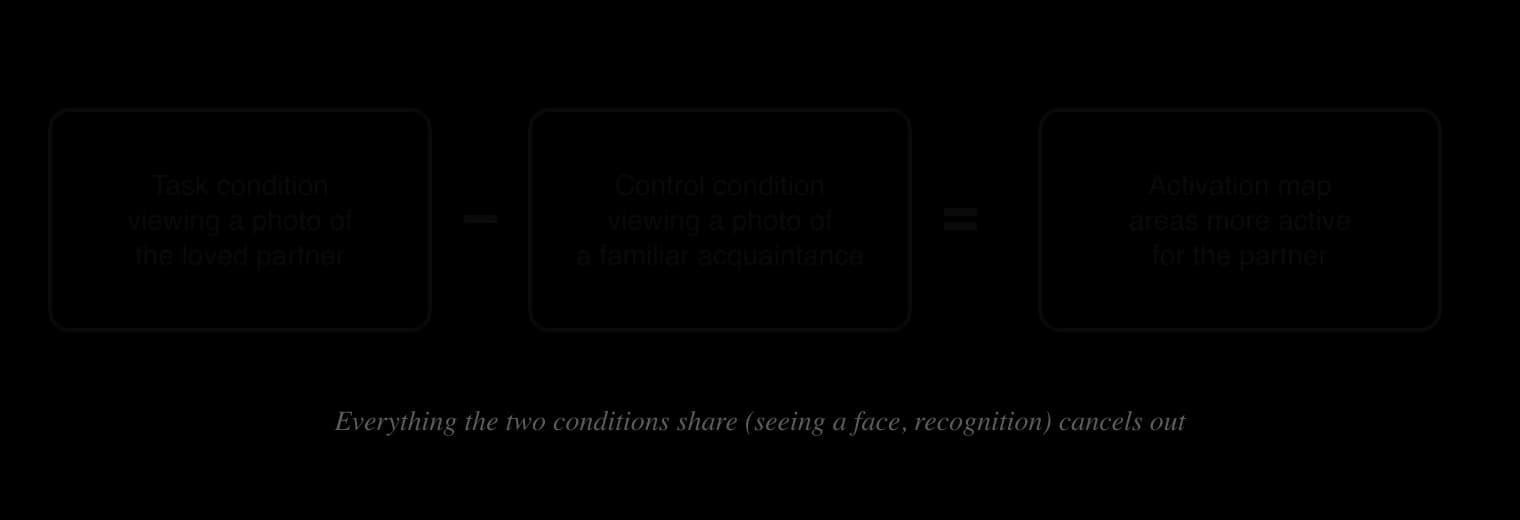
Aron et al. (2005) used this design in a study of romantic love, which shows how fMRI is applied in the human relationships context. Seventeen young adults in the United States (10 women and 7 men) who had been intensely in love for 1 to 17 months viewed photographs of their partner and of a familiar acquaintance. Viewing the partner was linked to greater activity in dopamine-rich areas associated with reward and motivation, the right ventral tegmental area and parts of the caudate nucleus. Activity in one part of the caudate correlated with how passionate participants rated their love on a questionnaire.
The result suggests that early romantic love uses the brain’s reward system. It also shows the limits of interpreting activity: the reward areas are active in many situations, from eating chocolate to winning money, so the data alone cannot show that participants were experiencing love rather than, for example, excitement or attention to a meaningful face.
This problem is common in fMRI research and is called reverse inference: reasoning backwards from activity in a brain area to the presence of a particular mental process. It is reliable only if the area is active in that process and rarely in others, which is seldom true. The amygdala, for example, is active during fear, but also during surprise, attention to faces and reward, so amygdala activity does not show that a person is afraid.
Harris and Fiske (2006) used fMRI with 10 participants who viewed photographs of social groups. The medial prefrontal cortex, an area usually active when people think about other people’s minds, was active for every group except “extreme out-groups” such as homeless people and drug users, which instead activated the insula and amygdala, a pattern linked to disgust. The authors interpreted this as neural evidence of dehumanisation. The study is an important application of imaging to prejudice, and also an example of reverse inference: the conclusion rests on the assumption that medial prefrontal activity means “thinking about a person”.
 YouTube
Brain imaging is also used to test sociocultural ideas. Zhu et al. (2007), at Peking University, scanned Chinese and Western participants while they judged whether trait adjectives described themselves, their mother or a well-known public figure. For both groups, the medial prefrontal cortex was more active for judgements about the self than about the public figure. In Chinese participants, however, it was also active for judgements about the mother, but not in Western participants.
The authors suggested that Chinese participants represent their mother as part of the self, consistent with the interdependent view of the self common in East Asian cultures. The study shows that imaging can provide evidence about culture as well as biology, and that brain activity is shaped by experience and culture rather than fixed.
Positron emission tomography uses a radioactive tracer. In the most common form, the participant is injected with a form of glucose (sugar) that carries a radioactive label, called FDG. Active brain cells take up more glucose for energy, so the tracer collects in the most active areas. As the radioactive label decays, it gives off positrons, which produce pairs of gamma rays that detectors around the head record, and a computer builds a map of where the tracer has collected.
Because glucose uptake is measured over tens of seconds to minutes, PET has poor temporal resolution, and its spatial resolution is lower than fMRI’s. Its special strength is that tracers can be designed to bind to particular molecules, such as dopamine or serotonin receptors, so PET can measure brain chemistry, which fMRI cannot. The radiation dose limits how often a person can be scanned, and the tracers are expensive to make, so PET studies usually have small samples and are rarely carried out on children.
Electroencephalography records the brain’s electrical activity through electrodes attached to the scalp, usually in a fabric cap. When large groups of neurons near the surface of the cortex fire together, they produce small voltage changes that pass through the skull and can be measured. EEG records these changes thousands of times per second.

EEG has excellent temporal resolution, but poor spatial resolution: the skull blurs the signals, and activity deep in the brain barely reaches the scalp. It is cheap, silent, portable and safe, so it is used with babies, in schools and in sleep laboratories, where it shows the different patterns of brain waves in the stages of sleep.
One powerful use of EEG is the event-related potential (ERP). A stimulus is presented many times, and the EEG recordings that follow it are averaged, so random activity cancels out and the brain’s typical response to that stimulus remains. Kutas and Hillyard (1980) recorded EEG while participants read sentences one word at a time. When a sentence ended with a word that made no sense, such as “He spread the warm bread with socks”, the brain produced a negative wave about 400 milliseconds after the word, now called the N400. A physically unusual word, printed larger than the others, produced a different, positive response.
The N400 showed that the brain detects a problem of meaning within less than half a second, before a person could press a button to report it. It is now used in learning and cognition research, for example to study how children and second-language learners process word meanings.
Magnetoencephalography records the tiny magnetic fields produced by the brain’s electrical activity, using very sensitive detectors in a helmet-shaped scanner. Like EEG, it has millisecond temporal resolution, but magnetic fields are less distorted by the skull, so it can locate activity more precisely. MEG scanners are rare and very expensive, which limits their use.
 YouTube
The table brings together the main features of each technique. Each has a different combination of strengths, and many studies now combine techniques, for example fMRI for location with EEG for timing.
Technique | What it measures | Spatial resolution | Temporal resolution | Invasiveness and cost | Typical use in psychology |
|---|---|---|---|---|---|
CT | Structure (X-ray density) | Good | None (structure only) | Radiation; cheap and fast | Clinical: injury, bleeding, tumours |
MRI | Structure (tissue type) | Very good (about 1 mm) | None (structure only) | No radiation; expensive; noisy, enclosed scanner | Size of structures, grey matter differences between groups |
fMRI | Blood oxygenation (BOLD) as a sign of activity | Good (a few mm) | Poor (seconds) | No radiation; expensive; must lie still | Which areas are active in a task: memory, emotion, social cognition |
PET | Uptake of a radioactive tracer (glucose use, receptors) | Moderate | Very poor (tens of seconds to minutes) | Injection and radiation; very expensive | Brain metabolism; neurotransmitter receptors and drug effects |
EEG | Electrical activity at the scalp | Poor (cm) | Excellent (ms) | Non-invasive; cheap; portable | Timing of processing (ERPs), sleep, attention, infants |
MEG | Magnetic fields from electrical activity | Moderate | Excellent (ms) | Non-invasive; very expensive and rare | Timing and location of processing |
Brain imaging is used in every context of psychology. The table gives one example from each context and the kind of question each technique can answer.
Context | Example | Technique | What it showed |
|---|---|---|---|
Human relationships | Aron et al. (2005): people intensely in love viewing their partner | fMRI | Activity in dopamine-rich reward areas (ventral tegmental area, caudate) |
Human relationships and group behaviour | Harris and Fiske (2006): viewing photos of social groups | fMRI | Reduced medial prefrontal activity for extreme out-groups, interpreted as dehumanisation |
Learning and cognition | Kutas and Hillyard (1980): reading sentences with odd endings | EEG (ERPs) | A negative wave about 400 ms after a word that does not fit the meaning |
Learning and cognition | Maguire et al. (2000): London taxi drivers | Structural MRI | Larger posterior hippocampi, correlated with years of driving |
Health and well-being | Raine et al. (1997): people charged with murder | PET | Lower glucose metabolism in the prefrontal cortex |
Human development and culture | Zhu et al. (2007): Chinese and Western adults judging self and mother | fMRI | Mother represented in the medial prefrontal cortex in Chinese but not Western participants |
Brain imaging has transformed the study of behaviour, but its findings are easy to over-interpret. Evaluating an imaging study means asking what was actually measured, what the design allows researchers to conclude, and how the data were analysed. The six concepts give a structure for these questions.
Every functional technique measures something other than thought. fMRI measures blood oxygenation, which follows neural activity by several seconds; PET measures glucose use averaged over a minute or more; EEG measures the summed electrical activity of millions of neurons near the surface of the cortex. Each is a construct validity question: how well does the measure represent the mental process the researcher is interested in?
Imaging data also contain artefacts: errors that come from something other than the brain process being studied. Head movement of a few millimetres in an MRI scanner can create false patterns of activity; breathing and heartbeat change blood flow; in EEG, blinking and muscle tension produce large electrical signals that can swamp the brain’s. Researchers reduce artefacts with head supports, instructions to keep still, extra electrodes to record eye movements and computer correction, but cannot remove them completely.
Children, older adults and people with some mental health disorders tend to move more in the scanner. If their data contain more movement artefacts, differences between groups may reflect movement rather than brain activity, which is a source of bias in comparing groups.
Most imaging studies show that activity in an area is associated with a task or that a structure differs between groups. They do not show that the area causes the behaviour. In the taxi driver study, the hippocampus could have grown because of driving, or people with larger hippocampi could have been more likely to become drivers; only a later study that followed trainees over time could separate the two. Group differences in brain activity may also be effects of the condition, its treatment or a third variable such as medication, poverty or head injury.
Other methods are needed to test cause. Studies of people with damage to an area, or methods that temporarily change activity in an area, such as transcranial magnetic stimulation, can show whether an area is necessary for a behaviour. Imaging is strongest when combined with these methods.
An fMRI image of the brain contains tens of thousands of voxels, and a statistical test is run on each one. With so many tests, some voxels will pass the usual threshold for statistical significance by chance, producing false positives (type I errors), unless the analysis corrects for the number of tests. This is called the multiple comparisons problem.
Bennett et al. (2010) demonstrated the problem with a dead Atlantic salmon. The fish was placed in an fMRI scanner and “shown” photographs of people in social situations. When the data were analysed without correction for multiple comparisons, a small cluster of voxels in the salmon’s brain appeared to be “active”. With standard corrections, no activity remained, which showed that correction is essential. Eklund, Nichols and Knutsson (2016) later tested common fMRI software packages on real resting-state data and found that one widely used type of analysis produced false positives far more often than the intended 5%.
Sample size is a further problem. Scanners are expensive, and Marek et al. (2022) noted that the median neuroimaging study has used about 25 participants. Small samples have low statistical power, which makes true effects easy to miss and makes the effects that are found look larger than they really are. Analysing brain scans from about 50,000 people, they concluded that reliable links between individual differences in brain structure or function and traits such as mental health require samples of thousands, far larger than most published studies.
Most imaging research has been carried out in North America, Europe and East Asia, with university students and other volunteers who can travel to a scanner. Findings may not generalise to other populations, and studies such as Zhu et al. (2007) show that culture can change patterns of brain activity. Small studies with striking results are also more likely to be published than small studies that find nothing, a form of publication bias that makes some findings look more reliable than they are.
Interpretation can be biased as well. Because the same area is active in many processes, researchers can often find an explanation for whatever activity they observe, a form of confirmation bias. Designing the analysis and stating the hypotheses before the data are collected, a practice known as pre-registration, reduces this risk.
In MRI and PET, participants lie still in a narrow tube, often for an hour, while the scanner makes loud knocking noises. Tasks must be simple, with button presses rather than speech or movement, and social situations are usually represented by photographs. Behaviour in the scanner may therefore differ from behaviour in real life, which limits the ecological validity of the findings. EEG is more flexible and can even be used with portable equipment in classrooms and outdoors.
MRI and EEG are safe for almost everyone, but MRI cannot be used with some metal implants, and the enclosed space causes distress for some people. PET exposes participants to radiation, so it must be justified by the value of the research and the dose kept as low as possible. Scans sometimes show unexpected abnormalities, such as a tumour, in healthy volunteers; researchers need a plan, agreed in advance, for informing participants and arranging medical follow-up.
Brain images can also be used in ways that go beyond the evidence. Images of a “criminal brain” or a “depressed brain” can make findings seem more certain than they are, and have been offered in courts as evidence about an offender’s responsibility. Researchers carry a responsibility to explain clearly what an imaging study can and cannot show, especially when findings concern stigmatised groups.
Adrian Raine and his colleagues used PET to investigate whether people who commit extreme violence differ in brain functioning from people who do not. The study is a classic example of what functional imaging can contribute to understanding behaviour, and of the limits of what it can show.
The researchers aimed to find out whether people who had committed murder and pleaded not guilty by reason of insanity (NGRI) showed differences in the functioning of cortical and subcortical brain areas compared with people who had not committed murder. Earlier research had suggested that damage to the prefrontal cortex, which is involved in controlling impulses, might be linked to violence.
The study was a quasi-experiment: the independent variable, being a murderer or not, could not be manipulated or randomly allocated. The sample was 41 people in California (39 men and 2 women) who had been charged with murder or manslaughter and were pleading NGRI, a group whose mental state was in question in their legal cases. They were compared with 41 control participants matched for age and sex. Six of the murderers had schizophrenia, so six of the controls were people with schizophrenia who had not committed murder; the other controls had no history of psychiatric illness.
Each participant was injected with the glucose tracer FDG and then performed a continuous performance task, in which they watched a screen and responded to a target. This task requires sustained attention and activates the prefrontal cortex. Afterwards, a PET scan measured how much glucose each brain area had used during the task, as an operationalisation of brain activity.
Compared with the controls, the murderers showed reduced glucose metabolism in several areas. They also showed unusual differences between the two hemispheres in some deeper structures.
Brain area | Murderers compared with controls |
|---|---|
Prefrontal cortex | Lower glucose metabolism |
Superior parietal gyrus and left angular gyrus | Lower glucose metabolism |
Corpus callosum (connecting the hemispheres) | Lower glucose metabolism |
Amygdala, thalamus and medial temporal lobe (including the hippocampus) | Abnormal asymmetry: lower activity in the left hemisphere than the right |
Sources: Raine, Buchsbaum and LaCasse (1997), as reported in the published abstract.
The authors concluded that the findings were preliminary indications of a network of abnormal brain processes that may predispose some people to violence. Reduced prefrontal functioning, for example, could weaken control over aggressive impulses. They stressed that the findings did not show that violence is caused by brain dysfunction alone, that they did not apply to all violent offenders, and that they should not be used to excuse murderers of responsibility for their actions.
A later study by Raine et al. (1998) divided murderers into “affective” murderers, whose violence was impulsive and emotional, and “predatory” murderers, whose violence was planned. Lower prefrontal functioning was found mainly in the affective group, which suggests that the original finding applies to impulsive violence rather than to murder in general.
Because the groups were not created by random allocation, the study cannot show that low prefrontal activity caused the violence. The murderers differed from the controls in many ways besides having killed someone: 23 of the 41 had a history of head injury or brain damage, others had histories of drug abuse, epilepsy or psychiatric disorders, and all were in custody facing trial, which is itself extremely stressful. The researchers compared murderers with and without head injuries and found few differences, but other variables like these could still have affected brain activity. Brain function could even be a consequence of a violent and disrupted life rather than its cause, an example of bidirectional ambiguity.
PET measured glucose use averaged over the whole task, so it shows which areas were less active overall, but not when or why. The continuous performance task was chosen to activate the prefrontal cortex, which is a strength, but it has little to do with violence, so the study measured attention-related brain activity rather than anything about aggression. Using lower activity in the prefrontal cortex to infer poor impulse control is a form of reverse inference.
The sample was not representative of murderers, let alone of violent people in general. Only people pleading not guilty by reason of insanity were included, a small group whose mental state was already in question. Almost all were men tried in California, so the findings cannot be generalised to women, to other cultures or to murderers who make no such plea. The sample of 41 was large for a PET study at the time but small for drawing conclusions about such a varied group.
The study is socially sensitive research. Findings about “murderers’ brains” can be misused, for example to argue that offenders cannot be held responsible, or that people with certain brain scans are dangerous and should be monitored. The authors addressed this by stating clearly what their data did not show. The study also raises questions about consent: the participants were facing a murder trial, and people in that position may not feel fully free to refuse to take part in research.
Sources: Raine, A., Buchsbaum, M. and LaCasse, L. (1997). Brain abnormalities in murderers indicated by positron emission tomography. _Biological Psychiatry, 42(6), 495–508. Raine, A. et al. (1998). Reduced prefrontal and increased subcortical brain functioning assessed using positron emission tomography in predatory and affective murderers. Behavioral Sciences and the Law, 16(3), 319–332._
Brain imaging techniques are an approach term, so questions can ask you to explain one technique with an example (Paper 1 Section A), or to explain the value of brain imaging in an unseen scenario in any context (Paper 1 Section B). Imaging is also a common method in unseen studies in Paper 2 Section B, where the concepts of measurement and causality are especially relevant.
In Section B the scenario usually describes a study, and the answer must apply knowledge of the technique to the details given, such as the sample, the task and the conclusion drawn.
Brain imaging produces pictures of the living brain: structural techniques (CT, MRI) show anatomy, functional techniques (fMRI, PET, EEG, MEG) show activity.
Spatial resolution is precision about where; temporal resolution is precision about when. No technique is precise in both.
MRI uses a magnetic field and radio waves to image structure in detail without radiation; fMRI uses the same scanner to measure the BOLD signal, which follows neural activity by several seconds.
PET measures where a radioactive tracer collects, such as glucose or a drug that binds to receptors; it involves radiation and has poor temporal resolution.
EEG records electrical activity at the scalp with millisecond timing but poor localisation; event-related potentials such as the N400 show how quickly the brain processes meaning.
Imaging findings are mostly correlational, measure activity indirectly, contain artefacts, need correction for multiple comparisons and often come from small samples.
Reverse inference, from activity in an area to a mental process, is unreliable because most areas take part in many processes.
Raine et al. (1997) found lower prefrontal glucose metabolism in 41 murderers pleading NGRI than in matched controls, but the design cannot show cause, and the authors warned against using it to excuse violence.
I can describe the difference between structural and functional imaging, and between spatial and temporal resolution.
I can explain how MRI, fMRI, PET and EEG work and what each one measures.
I can compare and contrast the techniques and choose a suitable one for a research question.
I can explain the use of brain imaging with examples from several contexts.
I can evaluate brain imaging research with reference to measurement, causality, bias and responsibility.
I can describe and evaluate the PET study of murderers by Raine et al. (1997).
I can apply knowledge of brain imaging to an unfamiliar research scenario.