Explain urban heat islands, air pollution, congestion, contested land use and deprivation, and evaluate how cities manage them, using Delhi, New York City, Dharavi and the Heygate Estate.
Each is in the Geography glossary, with every other term in the subject.
The presence in the atmosphere of gases or particles, from human or natural sources, at concentrations that harm human health, ecosystems or materials.
A scale that converts measured concentrations of several air pollutants into one number and category, used to tell the public how polluted the air is and what precautions to take.
Heat released into the atmosphere by human activities, such as vehicles, heating and air conditioning, industry and people’s own metabolism.
A theory, put forward by Wilson and Kelling in 1982, that visible signs of disorder and neglect in an area encourage further antisocial behaviour and more serious crime.
A situation in which different stakeholders compete for the same urban land or disagree over how it should be used or changed, usually because they gain or lose differently from the change.
A roof with a light-coloured or reflective surface of high albedo, so that it absorbs less solar radiation and stays cooler than a conventional dark roof.
A small area in which crime occurs much more frequently than in the surrounding area, identified by mapping recorded crimes.
Describe how urban areas modify temperature, humidity, precipitation, wind and visibility to create an urban microclimate.
Explain the causes of the urban heat island and draw and annotate the urban heat island profile.
Evaluate strategies for managing the urban heat island, including who benefits from them.
Explain the sources and the spatial and temporal patterns of urban air pollution, including the role of temperature inversions.
Evaluate the management of air pollution, and examine how its impacts vary between groups of people in Delhi.
Describe the patterns, trends and impacts of traffic congestion, and evaluate management responses, including congestion pricing in New York City.
Examine why land-use change is contested, using two contrasting neighbourhoods: Dharavi in Mumbai and the Heygate Estate in London.
Explain the cycle of deprivation and the geographic patterns of crime, and evaluate ways of managing urban social deprivation.
Cities concentrate people, buildings, vehicles and economic activity, and that concentration puts pressure on the urban environment and on urban society. Heat, polluted air, congested roads, competition for land and pockets of deep deprivation are urban stresses: problems that build up as cities grow and that affect some residents far more than others.
The topic is about power as much as about process. Wealthier residents can buy air purifiers, live near parks, drive through a congestion charge or resist the redevelopment of their neighbourhood; poorer residents are more often exposed to heat and pollution and have less say in what happens to the land they live on. Place
84 exam-style questions on this subtopic, written in the style of the IB papers. The first has its markscheme open. Counted on
Evaluate the success of flood mitigation strategies in one or more named urban areas.
10 marks
Marks should be allocated according to the markbands.
Flood mitigation strategies reduce the likelihood or consequences of flooding. In urban areas they include storage tunnels and reservoirs, channel modification and flood walls, sustainable urban drainage (permeable paving, green roofs, retention ponds), land-use zoning, warnings and preparation. Success may be judged by fewer or smaller floods, reduced losses, cost-effectiveness, wider benefits and sustainability. Named urban areas are required.
Possible applied themes (AO2) demonstrating knowledge and understanding (AO1):
Tokyo: the Metropolitan Area Outer Underground Discharge Channel (completed 2006), a 6.3 km tunnel about 50 m below ground with five large shafts, which diverts floodwater from small rivers and pumps it to the Edo River; it has been used many times and is credited with reducing flood damage in the area it serves, but cost about US$2 billion.
Kuala Lumpur's SMART tunnel (opened 2007), which combines a motorway with stormwater storage and diversion.
London: the Thames Barrier (operational since 1982) and the Thames Estuary 2100 plan; closures have become far more frequent (50 in winter 2013–14), showing both its value and the growing pressure on it.
Copenhagen's cloudburst plan after the 2011 cloudburst, which uses parks and streets to store and channel water.
China's sponge city programme (from 2015), designed to absorb and reuse rainwater; Zhengzhou, a pilot city, still flooded severely in July 2021 after more than 200 mm of rain fell in one hour, killing more than 300 people.
Indicators of limited success: residual risk when design standards are exceeded; flooding from surface water or drains rather than rivers; problems moved downstream.
With a free account, Augment remembers where you stopped and what you have practiced.
An approach that reduces opportunities for crime by designing buildings and public spaces with natural surveillance, clear boundaries, good lighting and maintenance.
A self-reinforcing sequence in which low income leads to poor housing, diet, health and education, which lead to low-paid work or unemployment, keeping income low and passing disadvantage to the next generation.
A theory of residential design, put forward by Oscar Newman in 1972, that crime falls where the layout of buildings and spaces gives residents a sense of ownership and the ability to watch over them.
The loss of parks, gardens, wetlands, farmland and other vegetated areas within a city to building and paving.
The removal of people from their homes or land against their will, without appropriate legal protection, consultation or compensation.
A planned network of natural and semi-natural features in a city, such as parks, street trees, green roofs, wetlands and rivers, managed to provide cooling, flood control, cleaner air and habitats.
A roof partly or wholly covered with vegetation and a growing medium, which insulates the building, absorbs rainfall and cools the surface through evapotranspiration.
A cross-section of air temperature across an urban area, showing a steep rise (cliff) at the urban edge, a suburban plateau, a peak over the CBD and cooler sinks over parks and water.
Improving an informal settlement where it stands by providing infrastructure, services and secure tenure, instead of demolishing it and moving its residents elsewhere.
The increase in traffic that follows an increase in road capacity, because faster journeys encourage more and longer trips, so that congestion often returns.
A defined urban area in which the most polluting vehicles are banned or must pay a daily charge, to reduce traffic emissions; London’s Ultra Low Emission Zone is an example.
The economic activity of a city in the evening and at night, such as bars, clubs, restaurants, theatres and late transport, often associated with concentrations of crime and disorder.
A scheme in which drivers leave their cars at car parks on the edge of a city and complete their journey to the centre by public transport.
Solid or liquid particles suspended in the air, classed by diameter as PM10 (up to 10 micrometres) and PM2.5 (up to 2.5 micrometres), which penetrate deep into the lungs and bloodstream.
A brownish haze formed when nitrogen oxides and volatile organic compounds, mainly from vehicle exhausts, react in strong sunlight to produce ground-level ozone and other secondary pollutants.
Charging vehicles directly for using roads, often varying by place and time of day, to reduce congestion and raise revenue, as in congestion charges and Singapore’s Electronic Road Pricing.
The demolition of informal or substandard housing in an urban area, with or without rehousing its residents, usually to redevelop the land or remove perceived health and safety risks.
A lack of access to the social conditions and opportunities most people in a society enjoy, such as good health, education, secure housing, safety and social networks, often concentrated in particular urban areas.
An approach to urban planning, associated with Medellín, that directs high-quality public investment in transport, education, culture and public space to the poorest and most violent neighbourhoods.
A layer of the atmosphere in which temperature increases with height instead of decreasing, so cooler, denser air near the ground is trapped beneath warmer air and pollutants cannot disperse upwards.
A condition in which the volume of traffic on a road network exceeds its capacity, causing slower speeds, longer and less predictable journeys and queues.
A street between rows of tall buildings, in which radiation is trapped by repeated reflection between walls and wind speed is reduced.
An urban area that is significantly warmer than the surrounding rural area, especially at night in calm, clear weather, because urban surfaces store heat, human activity releases heat and there is less evaporative cooling.
The small-scale climate of a city, in which temperature, humidity, precipitation, wind and visibility differ from the surrounding rural area because of urban surfaces, buildings and human activity.
The demolition and rebuilding of an urban area, often changing its land use, density and population, as part of a plan to regenerate it.
Climate is usually described at the scale of a region, but every surface creates its own small-scale conditions. A city replaces fields and woodland with concrete, glass and asphalt, adds heat and pollution, and builds tall structures that break up the wind. The result is an urban microclimate: a set of climatic conditions in and around a city that differ measurably from those of the surrounding countryside.
The differences were first measured in the 1810s, when Luke Howard recorded that London was about 2 °C warmer than the surrounding countryside at night. Modern measurements show that cities modify every element of the climate, not only temperature.
Element | Typical change in a large city | Main reason |
|---|---|---|
Temperature | Warmer than surrounding rural areas, especially at night and in calm, clear weather | Heat absorbed and stored by urban surfaces; heat released by vehicles, buildings and industry; less evaporative cooling |
Humidity | Lower relative humidity | Rain drains away quickly through gutters and sewers, there is less vegetation to transpire, and warmer air can hold more water vapour |
Precipitation | More convectional rainfall and thunderstorms, especially downwind of the city | Warm air rises over the city; buildings make air rise; particles act as condensation nuclei |
Wind | Lower average speeds, but strong gusts and channelled winds around tall buildings | Buildings increase surface roughness; air is funnelled and accelerated between them |
Visibility | Reduced by haze, smog and, in some cities, fog | Particles and gases from traffic, industry and domestic burning |
Downwind rainfall effects can be large. Studies of cities in the United States have measured monthly rainfall about 28% higher 30–60 km downwind of a city than upwind, because rising warm air and urban particles trigger convection that would not otherwise occur.
The best known feature of the urban microclimate is the urban heat island (UHI): the tendency of an urban area to be warmer than the rural land around it. The difference between the warmest part of the city and the surrounding countryside at the same moment is called the UHI intensity.
The UHI intensity of a large city is usually a few degrees Celsius, and on calm, clear nights it can reach about 10 °C. The UHI is usually strongest at night and in calm, clear weather, when an anticyclone (a high-pressure system) brings light winds and cloudless skies. In those conditions rural areas lose heat rapidly by radiation after sunset, while urban surfaces go on releasing the heat they stored during the day. Strong winds mix urban and rural air and weaken the effect; cloud cover slows rural cooling and reduces the contrast.
The UHI is a result of changes to the energy balance of the surface. Several processes work together:
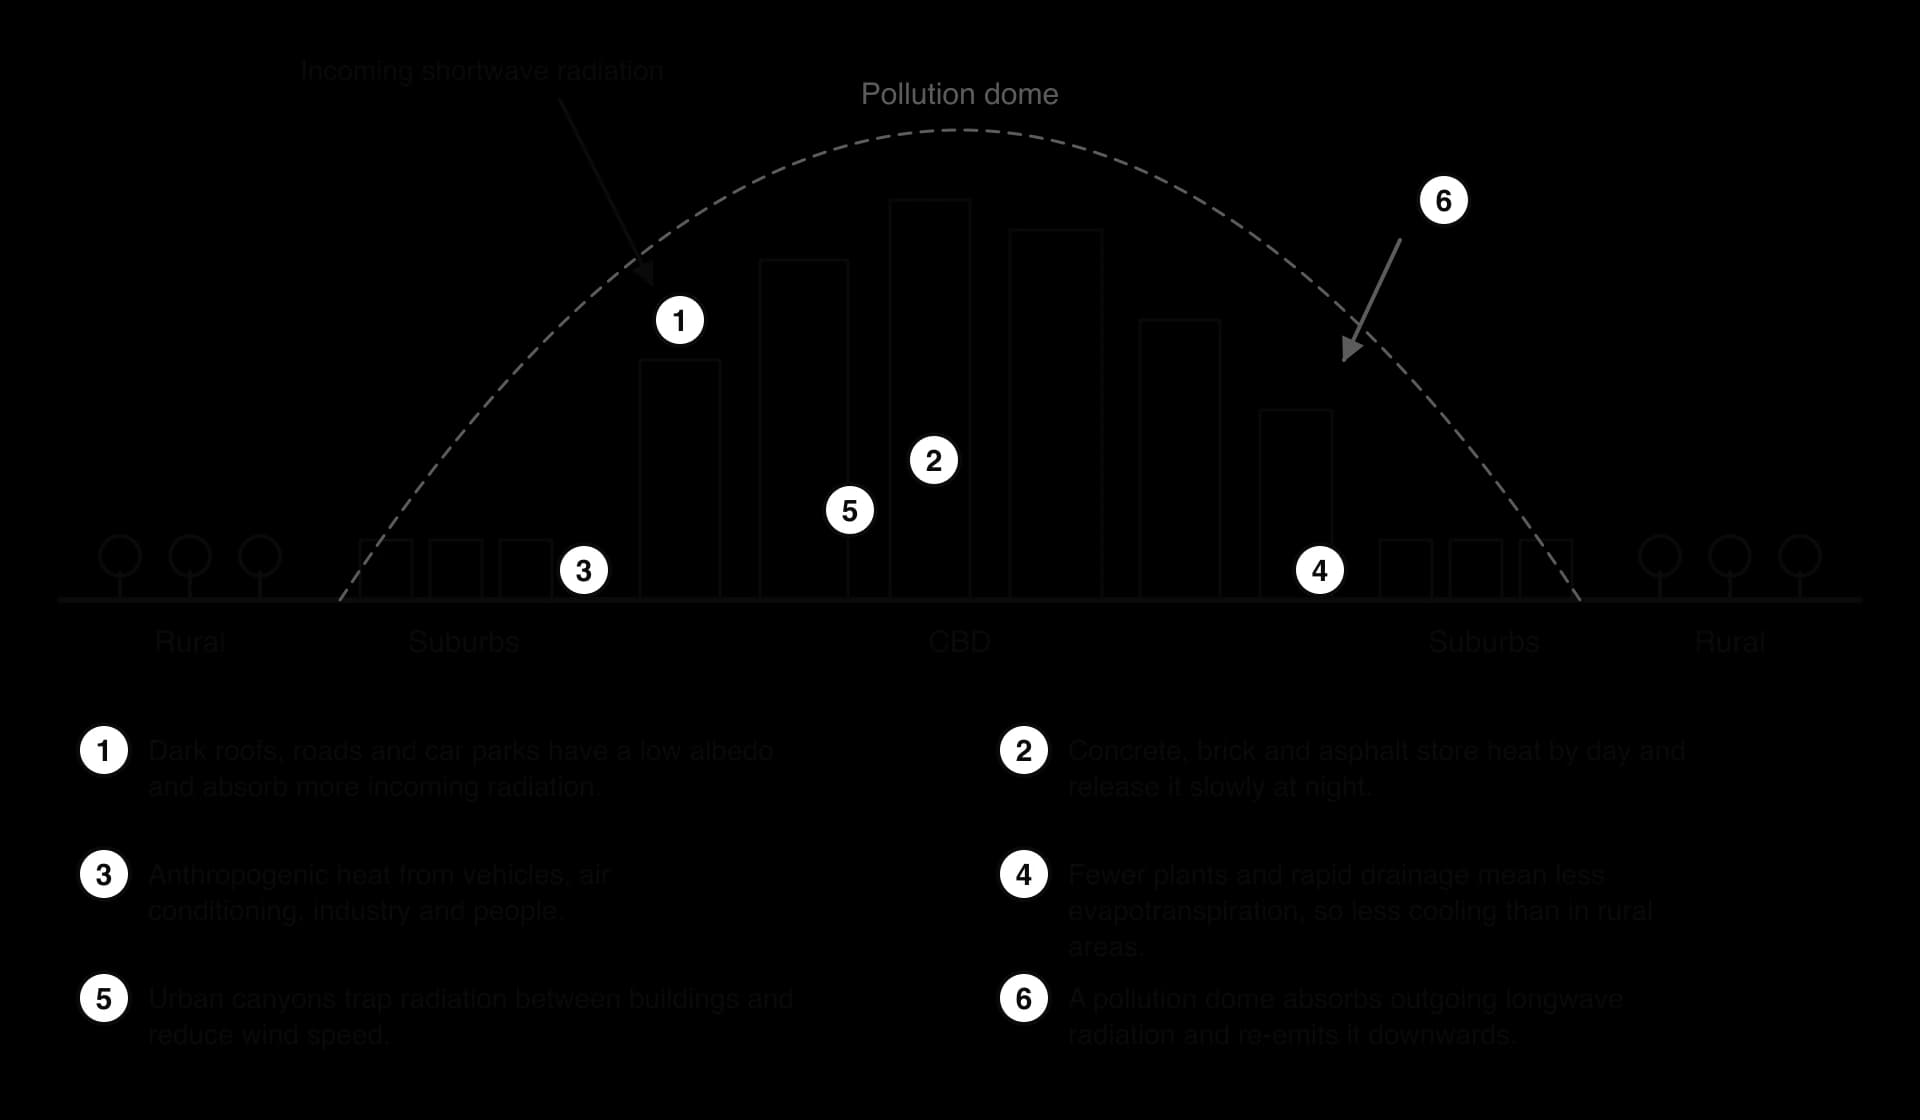
Low albedo. Dark roofs, roads and car parks reflect little sunlight. Their low albedo (reflectivity) means they absorb more incoming shortwave radiation than fields or forests and heat up more.
High heat capacity. Concrete, brick, stone and asphalt absorb heat during the day and release it slowly as longwave radiation through the night, keeping the air above them warm.
Anthropogenic heat. Vehicles, air-conditioning units, industry, power use in buildings and the people themselves add anthropogenic heat directly to the urban air. Waste heat from air conditioning alone can raise night-time temperatures by up to 1 °C.
Less evapotranspiration. Impermeable surfaces and drains remove rainwater quickly, and there are fewer plants. Less energy is used to evaporate water (evapotranspiration), so more of it heats the surface and the air.
Urban canyons. Streets lined by tall buildings form urban canyons. Radiation reflected from one wall is absorbed by another instead of escaping to the sky, and the buildings reduce wind speeds that would otherwise carry heat away.
A pollution dome. Particles and gases over the city absorb outgoing longwave radiation and re-emit part of it downwards, slowing night-time cooling.
A transect across a city, measuring air temperature at regular intervals, produces a characteristic heat island profile. Temperatures rise sharply at the edge of the built-up area (the cliff), stay fairly level across the suburbs (the plateau) and reach a maximum over the dense CBD (the peak). Parks, rivers and lakes form cooler sinks, because vegetation and water evaporate moisture and have a higher albedo or a greater capacity to absorb heat without warming.
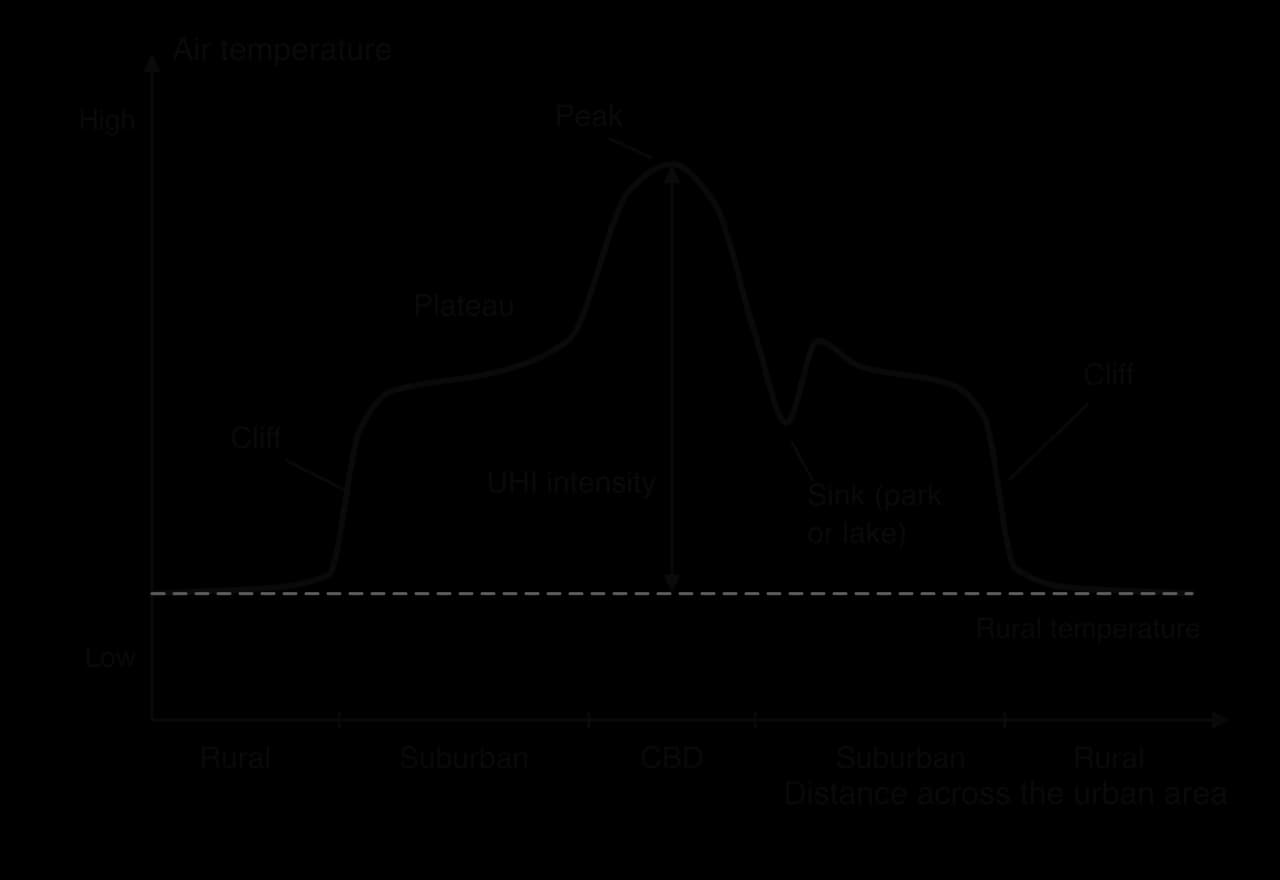
The profile is a model. Real transects are irregular, because a large factory, a railway yard or a hospital can produce a local peak, and in some cities, including Phoenix, irrigated suburbs can be cooler than the surrounding desert by day. Fieldwork transects measure the profile directly, using thermometers at a fixed height at points along a route, all read within as short a time as possible so that the general change in temperature through the evening does not distort the result.
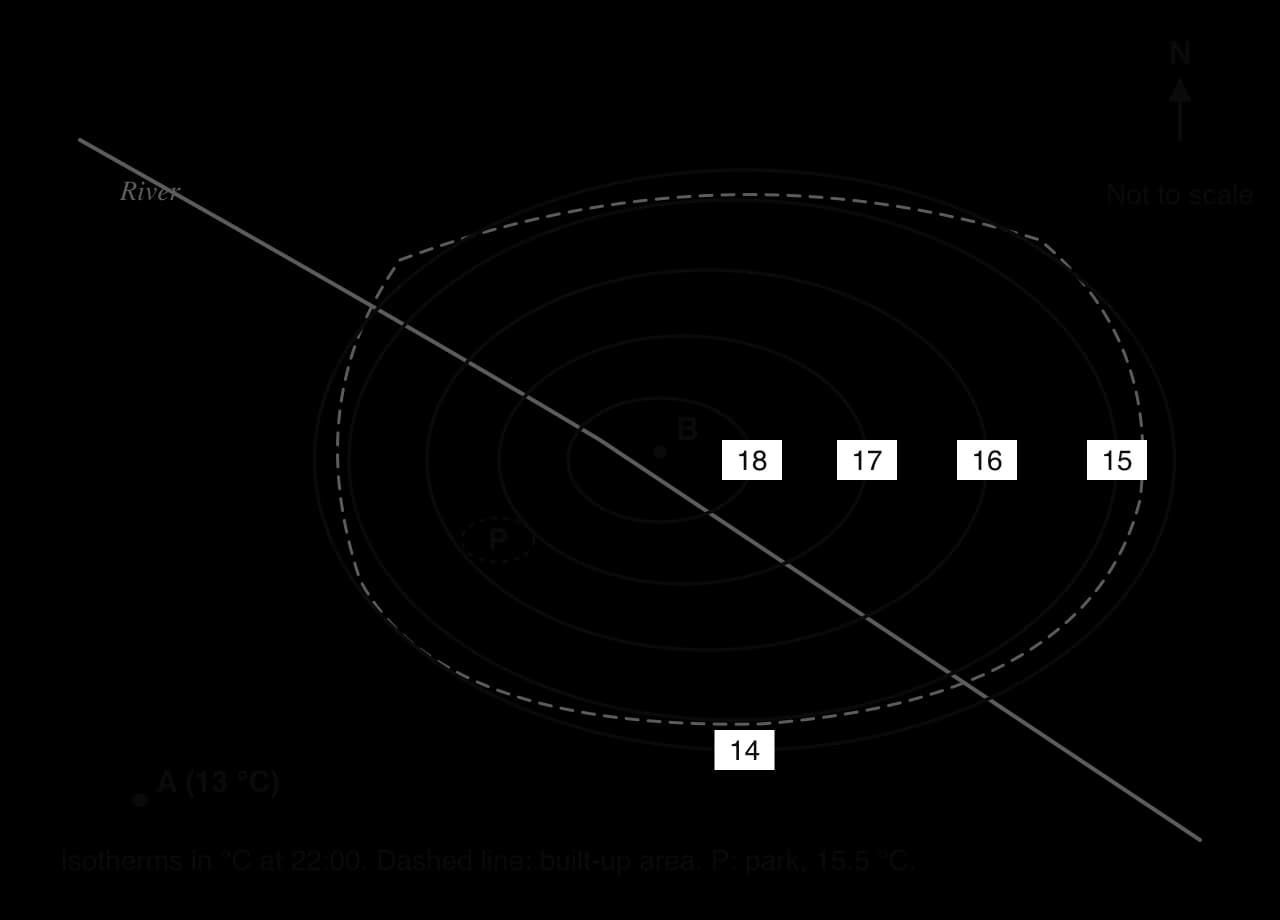
Isotherm maps are another way to show the UHI. An isotherm is a line joining places with the same temperature, so the heat island appears as a set of closed loops around the warmest district.
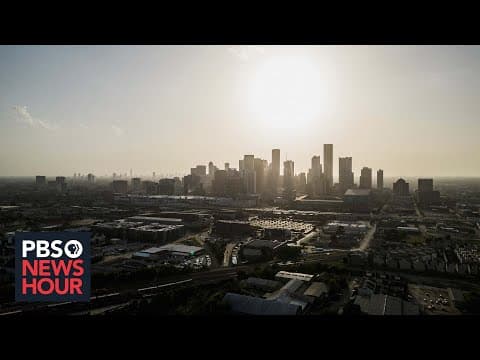
Urban heat is a health hazard. During heatwaves, high night-time temperatures stop the body recovering from the heat of the day, and death rates rise among older people, young children, people with heart and lung disease and outdoor workers. The 2003 European heatwave killed an estimated 70,000 people across Europe, including about 15,000 in France. Most of the French victims were elderly people living alone, often in flats in stone and brick buildings that held the heat through the night.
Exposure is unequal within cities. In 108 US cities, neighbourhoods that were "redlined" (marked as high-risk for mortgage lending in the 1930s, usually because of their Black or immigrant residents) are on average 2.6 °C hotter today than other neighbourhoods, because they have fewer trees and more asphalt and industry. In Phoenix, Arizona, which had 31 consecutive days at or above 43 °C (110 °F) from 30 June to 30 July 2023, almost all homes have air conditioning, but poorer residents may not be able to afford to repair or run it, and people without homes have no protection at all.
 YouTube
Sources: Wikipedia, “Urban heat island” (US Environmental Protection Agency, Hoffman et al., 2020, on redlining), “2003 European heatwave” (French National Institute of Health and Medical Research) and “Phoenix, Arizona” (US National Weather Service), accessed 2026.
Strategies to reduce the UHI work on its causes: raising the albedo of surfaces, restoring evapotranspiration, shading surfaces, letting air move through the city and cutting waste heat. Most are forms of green infrastructure, a planned network of vegetation and water that delivers environmental services such as cooling, drainage and habitat.
Strategy | How it reduces urban heat | Example |
|---|---|---|
Street trees and parks | Shade surfaces; evapotranspiration cools the air | A 2024 study of 110 cities found trees typically cool the daytime air by 1–2 °C |
Green roofs and walls | Plants and soil on roofs and facades absorb less heat and evaporate water | Singapore requires developers to replace greenery lost on a site with planting on roofs, terraces and walls |
Cool roofs and pavements | Light-coloured or reflective coatings raise albedo, so less radiation is absorbed | A simulation of the 2018 London heatwave found cool roofs could lower outdoor temperatures by about 1.2 °C on average |
Water features and rivers | Evaporation cools the air; open water absorbs heat without warming quickly | Seoul’s Cheonggyecheon stream, uncovered from beneath a motorway in 2005 |
Ventilation corridors | Keeping open strips between buildings lets cooler air from the countryside flow into the city | Stuttgart’s planning rules protect valley slopes that channel cool night air into the centre |
Green corridors | Connected strips of trees and planting along roads and streams shade surfaces, cool the air and link parks | Medellín’s network of green corridors, planted along main roads and streams from 2016 |
Schoolyards and public space | Replacing asphalt with soil, trees, shade and water points | Paris’s “oasis” schoolyards: over 200 transformed since 2018, open to the public as cool refuges in heatwaves |
A cool roof works differently: it reflects sunlight instead of absorbing it. A dark asphalt roof reflects about 6–26% of incoming sunlight; a cool roof coated with white or reflective material reflects at least 75%. In New York City, the NYC CoolRoofs programme has trained local job seekers to coat roofs with reflective paint, combining heat reduction with employment.
Each strategy has costs and trade-offs. Trees take decades to grow, need water (scarce in cities such as Phoenix or Delhi in summer) and space that is expensive in a dense centre. Green roofs need structural strength, irrigation and maintenance. Cool roofs are cheap, but reflective surfaces at street level can increase the heat felt by pedestrians, and they do nothing to cool the air at night in narrow canyons.
There are questions of equity too. New parks and tree planting raise the attractiveness of a neighbourhood, and therefore its property values and rents, which can push out the poorer residents the greening was meant to help. This is called green gentrification, a form of gentrification driven by environmental improvement. Cooling programmes are most effective, and fairest, when they are targeted at the hottest and poorest districts and combined with protection for existing tenants.
Air pollution is the presence in the air of gases and particles at concentrations high enough to harm people, other living things or buildings. In cities the main pollutants come from burning fuel: in vehicle engines, power stations, factories and homes.
The pollutant that does most harm to health is particulate matter: tiny solid or liquid particles suspended in the air. They are classified by diameter. PM10 are particles up to 10 micrometres (µm) across, which can enter the lungs; PM2.5 are fine particles up to 2.5 µm across, about one-thirtieth of the width of a human hair, which pass deep into the lungs and into the bloodstream. Concentrations are measured in micrograms per cubic metre of air (µg m⁻³).
Pollutant | Main urban sources | Main effects |
|---|---|---|
Particulate matter (PM2.5, PM10) | Diesel and petrol vehicles, road and construction dust, coal and biomass burning, industry; some forms from reactions between gases | Heart and lung disease, stroke, lung cancer; reduced visibility |
Nitrogen dioxide (NO₂) | Vehicle exhausts (especially diesel), power stations | Inflames airways, worsens asthma; reacts to form ozone and particles |
Sulphur dioxide (SO₂) | Burning coal and heavy oil in power stations, industry and homes | Breathing problems; forms acid rain and sulphate particles |
Ground-level ozone (O₃) | Not emitted directly: forms when NO₂ and volatile organic compounds react in sunlight | Irritates lungs and eyes; damages crops; main part of photochemical smog |
Carbon monoxide (CO) | Incomplete combustion in vehicles and stoves | Reduces the blood’s ability to carry oxygen |
Two kinds of smog are distinguished. The traditional "pea-souper" of 19th- and 20th-century industrial cities was a mixture of smoke and sulphur dioxide from burning coal, often combined with fog. Photochemical smog forms instead on sunny days when nitrogen oxides and volatile organic compounds from traffic react in sunlight to produce ozone and other irritants. Los Angeles, with its car-dependent growth, strong sunshine and a basin enclosed by mountains, became the classic example from the 1940s.
The World Health Organization (WHO) estimates that outdoor air pollution caused about 4.2 million premature deaths worldwide in 2019, 89% of them in low- and middle-income countries. Most were from heart disease and stroke (68%), followed by chronic lung disease and lower respiratory infections (14% each) and lung cancer (4%). In 2019, 99% of the world’s population lived in places where air quality did not meet WHO guidelines.
In 2021 the WHO halved its guideline for the annual mean concentration of PM2.5 from 10 µg m⁻³ to 5 µg m⁻³, because new research showed harm at lower concentrations than previously thought. Governments set their own legal limits, which are usually much higher: India’s national annual standard for PM2.5 is 40 µg m⁻³.
Day-to-day pollution is reported to the public through an air quality index (AQI), which converts measured concentrations into a single number with colour-coded bands such as "good", "moderate", "poor" and "severe", each linked to health advice. Indices differ between countries, so an AQI of 300 in India does not mean the same concentrations as an AQI of 300 in the United States.
Sources: WHO, Ambient (outdoor) air quality and health fact sheet, 2024; WHO Global Air Quality Guidelines, 2021; Central Pollution Control Board of India, National Ambient Air Quality Standards.
Pollution varies over short distances. Concentrations of NO₂ and particles are highest along main roads, at junctions and in narrow urban canyons where exhaust is trapped, and they fall within a few hundred metres of a busy road. Industrial zones and power stations raise pollution downwind of them, which is one reason why, in many European cities, the prevailing westerly winds made eastern districts the polluted "East End" where poorer people lived. Ozone shows the opposite pattern: it is often higher in suburbs and rural areas downwind of the city, because it takes hours to form in sunlight and is destroyed by fresh NO emissions near roads.
Relief is a strong influence. Cities in valleys and basins, such as Mexico City (a basin at about 2,240 m surrounded by mountains), Santiago in Chile and Los Angeles, trap pollution because the surrounding land blocks winds that would disperse it and because cold air drains into the basin at night.
Normally, air temperature falls with height in the lower atmosphere. Warm, polluted air from the ground rises, mixes with cleaner air above and disperses. A temperature inversion reverses this: a layer of warm air sits above cooler air near the ground. Air rising from the city meets warmer air above, stops rising and spreads out beneath the inversion like a lid, so pollutants build up near the ground, sometimes for days.
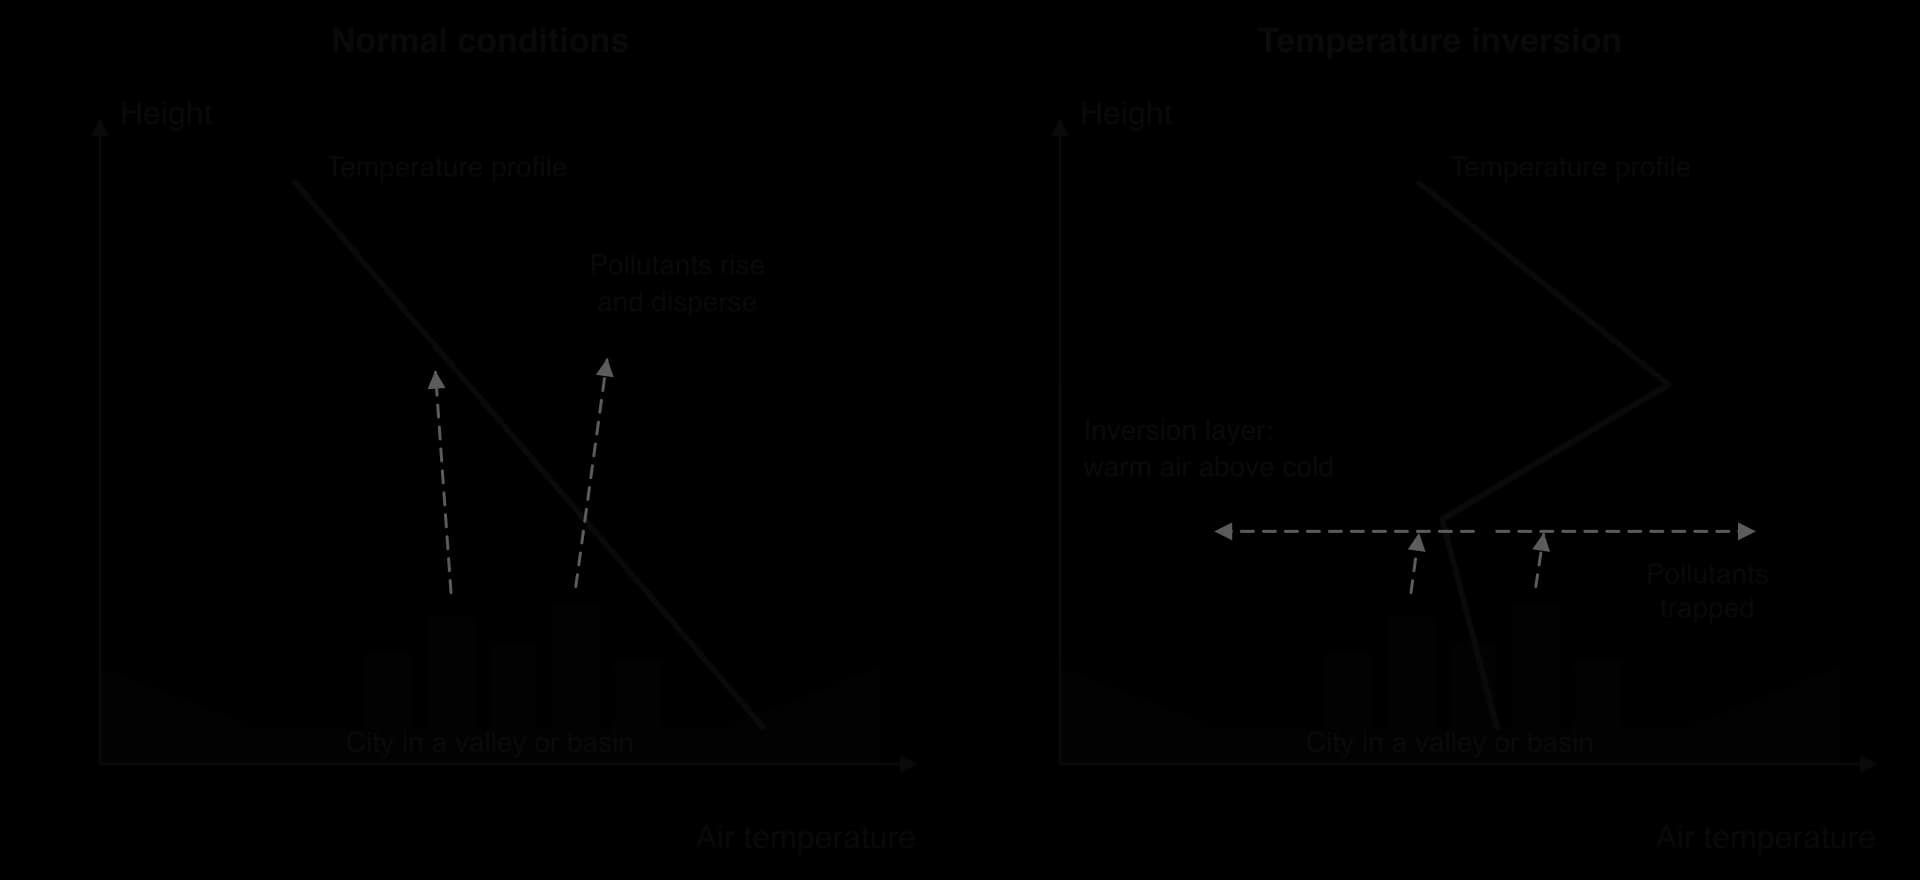
Inversions form most often:
on calm, clear nights, when the ground loses heat rapidly by radiation and chills the air in contact with it, especially in winter when nights are long;
in valleys and basins, where cold, dense air drains downslope at night and collects on the valley floor;
under anticyclones, where air sinking from high altitude is compressed and warmed, forming a warm layer above the surface.
The Great Smog of London in December 1952 shows all three conditions at work. An anticyclone settled over the city on 4 December, bringing no wind and an inversion, while people burnt large amounts of low-grade, sulphurous coal against the cold. The smog lasted five days and modern estimates suggest it caused 10,000–12,000 deaths. It led directly to the Clean Air Act of 1956.
Pollution also follows regular cycles in time:
Daily: NO₂ and particles peak in the morning and evening rush hours; ozone peaks in the mid-afternoon, after hours of sunshine. Night-time inversions trap emissions until the morning sun heats the ground and breaks them up.
Weekly: weekday traffic and industry make concentrations higher from Monday to Friday than at weekends, although in some cities weekend ozone is higher because there is less NO to destroy it.
Seasonal: in cold climates winter is worse, with heating, long nights and frequent inversions; in sunny climates photochemical smog is worst in summer. Seasonal burning of crops or forests, and festivals with fireworks, add sharp peaks.
At the global scale, the most polluted cities are in South Asia, followed by parts of China, the Middle East and sub-Saharan Africa, where rapid urban growth, coal power, older vehicles, unpaved roads, open burning of waste and desert dust combine. Most high-income countries have far cleaner air than they did in the 1970s, and China has improved rapidly since 2013.
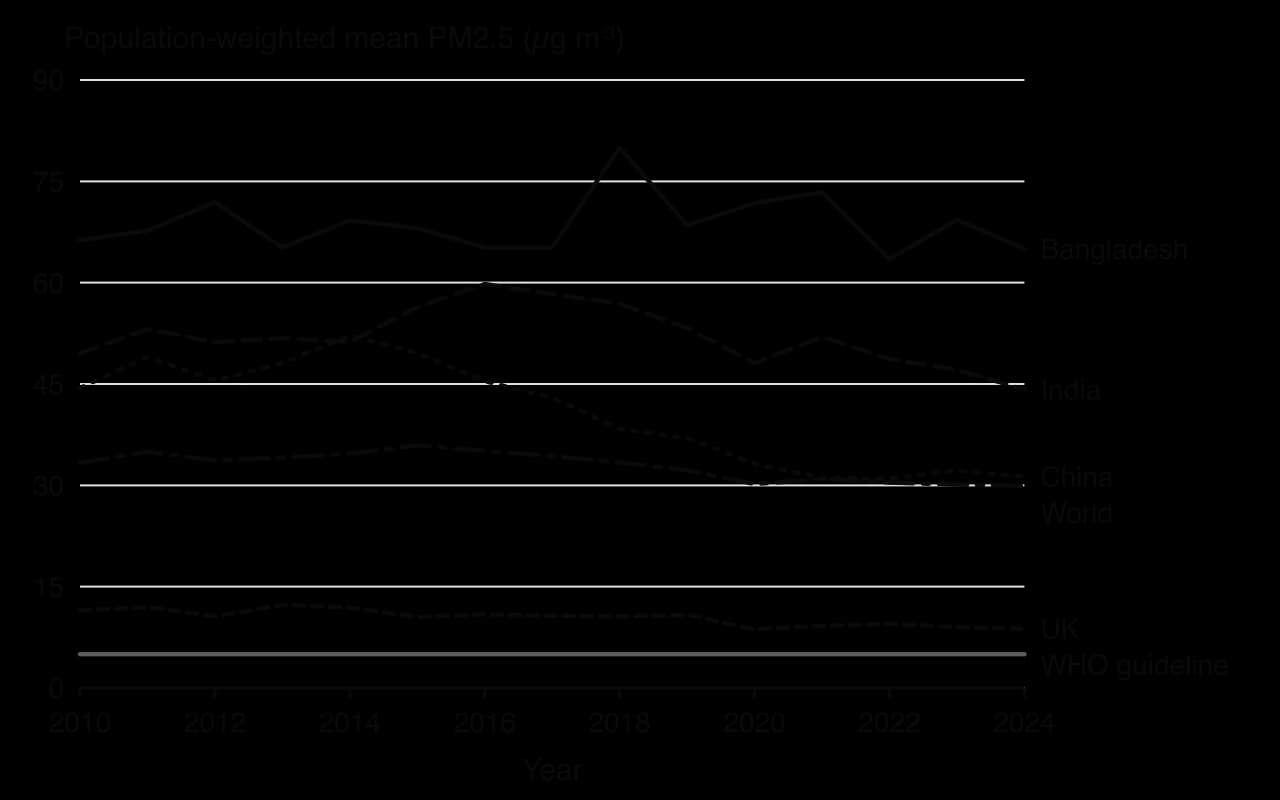
The chart shows population-weighted mean exposure: the concentration the average person in each country breathes, estimated from satellites and ground monitors. Exposure in China fell from 52.2 µg m⁻³ in 2014 to 31.3 µg m⁻³ in 2024, while India fell from 59.8 µg m⁻³ in 2016 to 44.2 µg m⁻³ in 2024, and Bangladesh stayed at about 65 µg m⁻³. Even the United Kingdom, at 8.8 µg m⁻³, is above the WHO guideline.
Cities manage air pollution by cutting emissions at source, keeping polluting vehicles out of the most exposed areas, and warning people when pollution is high so that they can reduce their exposure.
London’s Clean Air Act of 1956 created smoke control areas and paid householders to replace open coal fires with gas, electric or smokeless fuels, and it moved power stations away from city centres. Similar laws followed in most high-income countries, with standards for fuel quality, vehicle emissions and industrial chimneys. These measures largely ended the coal smogs of the 20th century, although traffic pollution replaced them as the main problem.
A low emission zone (LEZ) is an area that the most polluting vehicles may enter only if they pay a charge or not at all. London’s Ultra Low Emission Zone (ULEZ) started in central London on 8 April 2019, charging £12.50 a day for cars and vans that fail emissions standards. It was expanded to the North and South Circular roads in 2021 and to all of Greater London on 29 August 2023. Daily entries by non-compliant vehicles to the central zone fell from 35,578 to 23,054 soon after its launch.
Some cities restrict driving by licence-plate number. Mexico City’s Hoy No Circula ("No driving today") programme, introduced in 1989, bans each car from the roads on one weekday according to the last digit of its plate. Economic studies found little lasting improvement in air quality, partly because some households bought a second, often older and more polluting, car to use on banned days. Delhi trialled similar odd–even rationing in 2016 and 2019.
Beijing shows what a determined national government can achieve. After the "airpocalypse" of January 2013, when the US Embassy’s monitor recorded AQI readings above 750, the State Council issued an Air Pollution Prevention and Control Action Plan in September 2013, aiming to cut Beijing’s PM2.5 by 25% by 2017. Polluting mills, factories and smelters were closed, and millions of homes and businesses switched from coal to gas for heating. Average PM2.5 across 74 major Chinese cities fell by about 42% between 2013 and 2018.
Electrifying public transport removes exhaust at street level, where exposure is highest. Shenzhen became the first large city to run an all-electric bus fleet, more than 16,000 buses, in 2017, and its taxis followed. The gain is greatest where the electricity comes from low-carbon sources rather than coal.
Strategy | Strengths | Limitations |
|---|---|---|
Laws and emission standards | Tackle sources directly; apply to everyone; long-term effect (London after 1956) | Need monitoring and enforcement; slow to take effect as old vehicles and plants are replaced |
Low emission zones and charges | Target the most polluting vehicles where exposure is highest; raise revenue | Cost falls hardest on low-income drivers and small businesses with older vehicles; politically contested |
Driving bans by plate number | Cheap and quick to introduce in an emergency | People adapt (second cars, travel at other times); little long-term effect |
Closing or moving industry and power stations | Large, rapid cuts (Beijing after 2013) | Costs jobs locally; may move pollution to another region rather than remove it |
Cleaner fuels and electric vehicles and buses | Remove exhaust emissions at street level | Expensive; brake, tyre and road dust remain; electricity may still come from coal |
Monitoring and public alerts | Help vulnerable people avoid exposure; build public pressure for action | Do not reduce emissions; depend on trusted data |
The most effective programmes combine several measures and work at more than one scale. Pollution crosses administrative boundaries, so a city can do little alone when much of its pollution comes from outside: from industry in neighbouring provinces in Beijing’s case, or from crop burning in neighbouring states in Delhi’s. Measures that charge or ban older vehicles also raise questions of equity, because they cost poorer drivers most, while the health benefits go mostly to residents along busy roads, who are also often poorer.
Traffic congestion occurs when the number of vehicles trying to use a road exceeds its capacity, so that speeds fall, queues form and journeys take longer and become less predictable. It is a problem of both high-income cities, where car ownership has been high for decades, and fast-growing cities in middle-income countries, where car ownership is rising faster than roads and public transport can be built.
Congestion has clear spatial patterns. It is worst on the radial routes that lead into the central business district (CBD), where the most jobs are concentrated, on ring roads where radial traffic joins, and at bottlenecks such as bridges, tunnels, junctions and points where lanes merge. Cities on rivers, harbours or narrow sites (Istanbul across the Bosporus, Lagos across its lagoon, Manhattan reached by bridges and tunnels) have some of the worst bottlenecks.
It also has temporal patterns. On weekdays most cities have a morning and an evening peak, as commuters travel in and out. On a radial road the flow is tidal: heavy towards the centre in the morning and away from it in the evening. Congestion also rises at weekends near shopping centres, during school terms, around major events and in bad weather.

Several trends have raised congestion over time:
Rising car ownership as incomes grow. Car ownership rises steeply when households reach middle incomes, which is why motorisation has been fastest in China, India, Indonesia and Brazil in the 21st century.
Urban sprawl and suburbanisation, which lengthen journeys and create low-density areas that public transport cannot serve economically.
Induced demand: building new roads or widening existing ones often attracts so much extra traffic that congestion returns within a few years.
Delivery and ride-hailing vehicles, which have grown with online shopping and app-based taxis.
The opposite trend appears in some high-income city centres, where car use per person has fallen because of better public transport, parking restrictions, road pricing and changing preferences among younger adults. The trend in a city depends on its stage of development as much as on its policies.
Induced demand is a good example of a feedback loop in an urban system. When a congested road is widened, journeys become faster; drivers who had used public transport, travelled at other times or not travelled at all start driving on it; and new housing and retail are built along it, generating more trips. Houston’s Katy Freeway, widened to as many as 26 lanes in 2008, is often cited because peak-hour journey times on it rose again within a few years.
Congestion is measured in several ways. Traffic counts record the number of vehicles passing a point per hour, a common fieldwork method. Journey-time surveys compare actual travel times with free-flow times at night. Commercial indices, such as TomTom’s Traffic Index and the INRIX Global Traffic Scorecard, use GPS data from phones and vehicles to estimate the extra time a journey takes in congestion or the hours a typical driver loses in a year. The indices measure different things and rank cities differently, so a city’s position in a league table depends on the method.
Type | Impacts | Who is most affected |
|---|---|---|
Economic | Time lost by workers and businesses; higher fuel and delivery costs; unreliable journeys reduce productivity and deter investment | Businesses that depend on deliveries; commuters with long journeys; buses stuck in traffic |
Environmental | More fuel burnt per kilometre in stop–start traffic; higher emissions of NO₂, particles and CO₂; noise | Residents along main roads, often in cheaper housing |
Social and health | Stress, less time with family; road accidents; poorer access to jobs and services for people without cars; respiratory illness | Pedestrians, cyclists and bus users; low-income households in peripheral areas |
Congestion also has an equity dimension. In many cities in low- and middle-income countries, most people walk or use buses and minibuses, yet road space is dominated by the private cars of a wealthier minority. Bus passengers sit in the same queues as car drivers but have had no say in the decisions that filled the roads.
Strategies to manage congestion either increase the capacity of the transport system, reduce demand for road space, or spread demand more evenly over time and space.
Road pricing charges drivers for using roads, usually in the most congested area or at the busiest times. It applies a simple economic principle: if road space is free, it is overused, so a price shifts some trips to other times, routes or modes and leaves the remaining traffic flowing more freely. A congestion charge is a form of road pricing for entering a zone.
Singapore introduced the world’s first urban congestion charge in the 1970s and replaced it with Electronic Road Pricing (ERP) on 1 April 1998, which charges vehicles automatically as they pass gantries, with prices that vary by location and time of day.
Traffic in Singapore’s restricted zone fell by about 13% during charging hours, from about 270,000 to 235,000 vehicles. Singapore combines road pricing with strict limits on car ownership: anyone buying a car must first bid for a Certificate of Entitlement, which often costs more than the car itself.
London’s congestion charge began on 17 February 2003 at £5 a day; it had risen to £18 by January 2026. Traffic in the zone fell by about 15–20% in its first months and journey times by 14%, but by 2006 congestion in central London had returned close to its earlier level as road space was reallocated to buses, cyclists and pedestrians.
Strategy | How it works | Example | Evaluation |
|---|---|---|---|
Mass transit: metro and light rail | High-capacity rail moves many people in little space | Delhi Metro; the London Underground | Very effective but very expensive and slow to build; serves only the corridors it runs along |
Bus rapid transit (BRT) | Buses on dedicated lanes with stations and pre-paid boarding | Curitiba from 1974; Bogotá’s TransMilenio from 2000; Lagos from 2008 | Much cheaper than a metro; can become overcrowded; needs lanes taken from cars |
Park and ride | Car parks at the edge of the city linked to the centre by frequent buses or trains | Oxford, Cambridge, many Dutch cities | Cuts traffic in the centre; can encourage driving to the edge rather than using public transport for the whole trip |
Cycling and walking infrastructure, bike-share | Protected lanes, wider pavements, shared bicycles | Amsterdam, Utrecht, Paris since 2020 | Cheap and healthy; limited by climate, distance and safety fears |
Car-ownership quotas and lotteries | Limit the number of new cars registered | Singapore’s Certificate of Entitlement (1990); Beijing’s licence-plate lottery (2011) | Effective at limiting growth in car numbers; favours the wealthy where permits are auctioned |
Parking policy | Fewer and more expensive parking spaces in the centre | Zurich, central London | Effective and cheap to run; unpopular with retailers |
Flexible working and staggered hours | Spread trips over the day or remove them | Remote working since 2020 | Reduces peaks; only possible for some jobs |
Bus rapid transit and other forms of mass transit are the main long-term answers in most large cities, because they move many more people per metre of road than cars do. Their success depends on land use as well as on the service: Curitiba planned high-density development along its BRT corridors so that the buses had riders, while many cities have built transit lines into areas that were then developed at low density around car parks.
Manhattan is one of the most congested places in the United States. Its CBD, the zone south of 61st Street, is reached by bridges and tunnels that act as bottlenecks, and its streets carry buses, taxis, ride-hailing cars, delivery vans and private cars. A congestion charge was first proposed by Mayor Michael Bloomberg in 2007, authorised by New York State in 2019, paused by the state governor days before its planned start in June 2024, and finally introduced on 5 January 2025, the first in the United States.
Cars entering the zone pay $9 once a day between 05:00 and 21:00 on weekdays (from 09:00 at weekends), 75% less at night, with the charge set to rise to $12 in 2028 and $15 in 2031. Trucks pay more, and taxis and ride-hailing trips pay a fee per trip. Low-income residents receive a discount after their first ten trips each month. The revenue is used to borrow about $15 billion for improvements to the subway, buses and commuter railways run by the Metropolitan Transportation Authority (MTA).
Indicator | Before or projected | First year (2025) |
|---|---|---|
Vehicles entering the zone per day | About 583,000 (baseline) | About 475,000–560,000; vehicle counts in the zone down 11% over 11 months |
Vehicle entries over the year | — | About 27 million fewer |
Journey times on Manhattan–New Jersey crossings | — | 30–40% faster |
Traffic deaths in the zone, January–June | 128 (2024) | 87 (2025) |
Subway ridership | — | Up 7.7% from 2024, over 90 million more rides |
Toll revenue | $500 million projected | About $548 million |
The scheme shows how stakeholders’ power shapes a policy. The state of New Jersey sued, arguing its residents would pay twice and that pollution would be displaced into its communities; commuters from the outer boroughs and suburbs without good rail links objected to the cost; and the US Secretary of Transportation revoked federal approval on 19 February 2025, a decision a federal judge ruled unlawful on 3 March 2026. The tolls stayed in force throughout.
Supporters, including transit users and many businesses in the zone, pointed to faster buses and more pedestrians: footfall in the zone rose 3.4% in the first 11 months against 1.4% across Manhattan. Air-quality gains were smaller and harder to prove: one study estimated a 22% fall in peak-hour PM2.5 in the zone in the first six months, while daily averages changed little a preliminary 2026 study suggested a rise of about 2% in the South Bronx, a low-income area near major highways, and a later city health department study in August 2026 found pollution steady or slightly lower everywhere, including the South Bronx.
Sources: Wikipedia, “Congestion pricing in New York City” (MTA, US District Court ruling of 3 March 2026, New York City Department of Health and Mental Hygiene data), “London congestion charge” (Transport for London) and “Electronic Road Pricing” (Land Transport Authority, Singapore), accessed 2026.
Urban land is scarce and valuable, and almost every change in its use creates winners and losers. Contested land use describes a situation in which different groups want the same land for different purposes, or disagree about whether and how it should change. Stakeholders include residents (owners and tenants), informal occupants, landowners, developers and investors, businesses, local and national governments, planners, NGOs and community campaigns, and future residents who have no voice yet.
These stakeholders do not have equal power. Owners with legal title can sell or negotiate; tenants can be evicted when leases end; residents of an informal settlement without secure tenure may have no legal claim at all. Developers and governments control finance and planning permission, while residents’ power depends on whether they can vote, organise, go to court or attract media attention.
Slum clearance is the demolition of informal or low-quality housing, sometimes with rehousing and sometimes without. Governments justify it by poor sanitation and fire risk, the need for roads or drainage, the high value of central land, preparations for mega-events, or the wish to present a "world-class city" to investors and visitors.
Clearance without consent or adequate compensation is a forced eviction. In Zimbabwe’s Operation Murambatsvina ("Drive out the rubbish") in 2005, the government demolished informal homes and market stalls in Harare and other cities, describing it as urban renewal; a UN report estimated that at least 700,000 people lost their homes, their livelihoods or both. Before the 2016 Olympic Games, most of the families in Vila Autódromo, a community beside the Olympic Park in Rio de Janeiro, were moved out; a small group who refused to leave won the right to stay and were rehoused on the site.
Clearance often moves residents to the edge of the city, far from their jobs, schools and social networks, and breaks up the informal economies that provided their incomes. The alternative is in situ upgrading: improving an informal settlement where it stands by adding water, sanitation, paving, drainage, lighting and community buildings, and by giving residents secure tenure. Rio de Janeiro’s Favela-Bairro programme of the 1990s upgraded the infrastructure of dozens of favelas without moving their residents.
Urban redevelopment replaces the buildings and often the uses and the population of an area, usually one that is derelict, declining or seen as underused. It is a form of regeneration, the wider process of reversing the decline of an area. In London Docklands, closed as a port by 1981, the London Docklands Development Corporation used planning powers and public investment from 1981 to 1998 to attract offices, luxury housing and transport links, creating Canary Wharf; local residents gained some jobs and transport but many said the new economy was not built for them.
Debates over redevelopment ask the same questions each time: who decided, who was consulted, who was moved out, who moved in, and who captured the increase in land value. Where existing residents are replaced by wealthier ones, redevelopment produces displacement and a state-led form of gentrification.
The third form of contested change is the depletion of green space: the loss of parks, playing fields, wetlands, urban farms and gardens to building. In 2013 a plan to rebuild a demolished Ottoman barracks, with a shopping centre, on Gezi Park, one of the last green spaces in central Istanbul, triggered a sit-in that grew into nationwide protests involving an estimated 3.5 million people; the redevelopment was suspended and the park remains open. Smaller losses add up as well: paving over front gardens for parking, building on school playing fields, and infilling wetlands at the edge of fast-growing cities.
The loss of green space strengthens the urban heat island, increases surface runoff and flood risk, reduces biodiversity and removes places for exercise and recreation, especially for people without gardens. Responses include legal protection of parks, green belt policies at the edge of the city, green infrastructure plans and community campaigns to save local spaces.
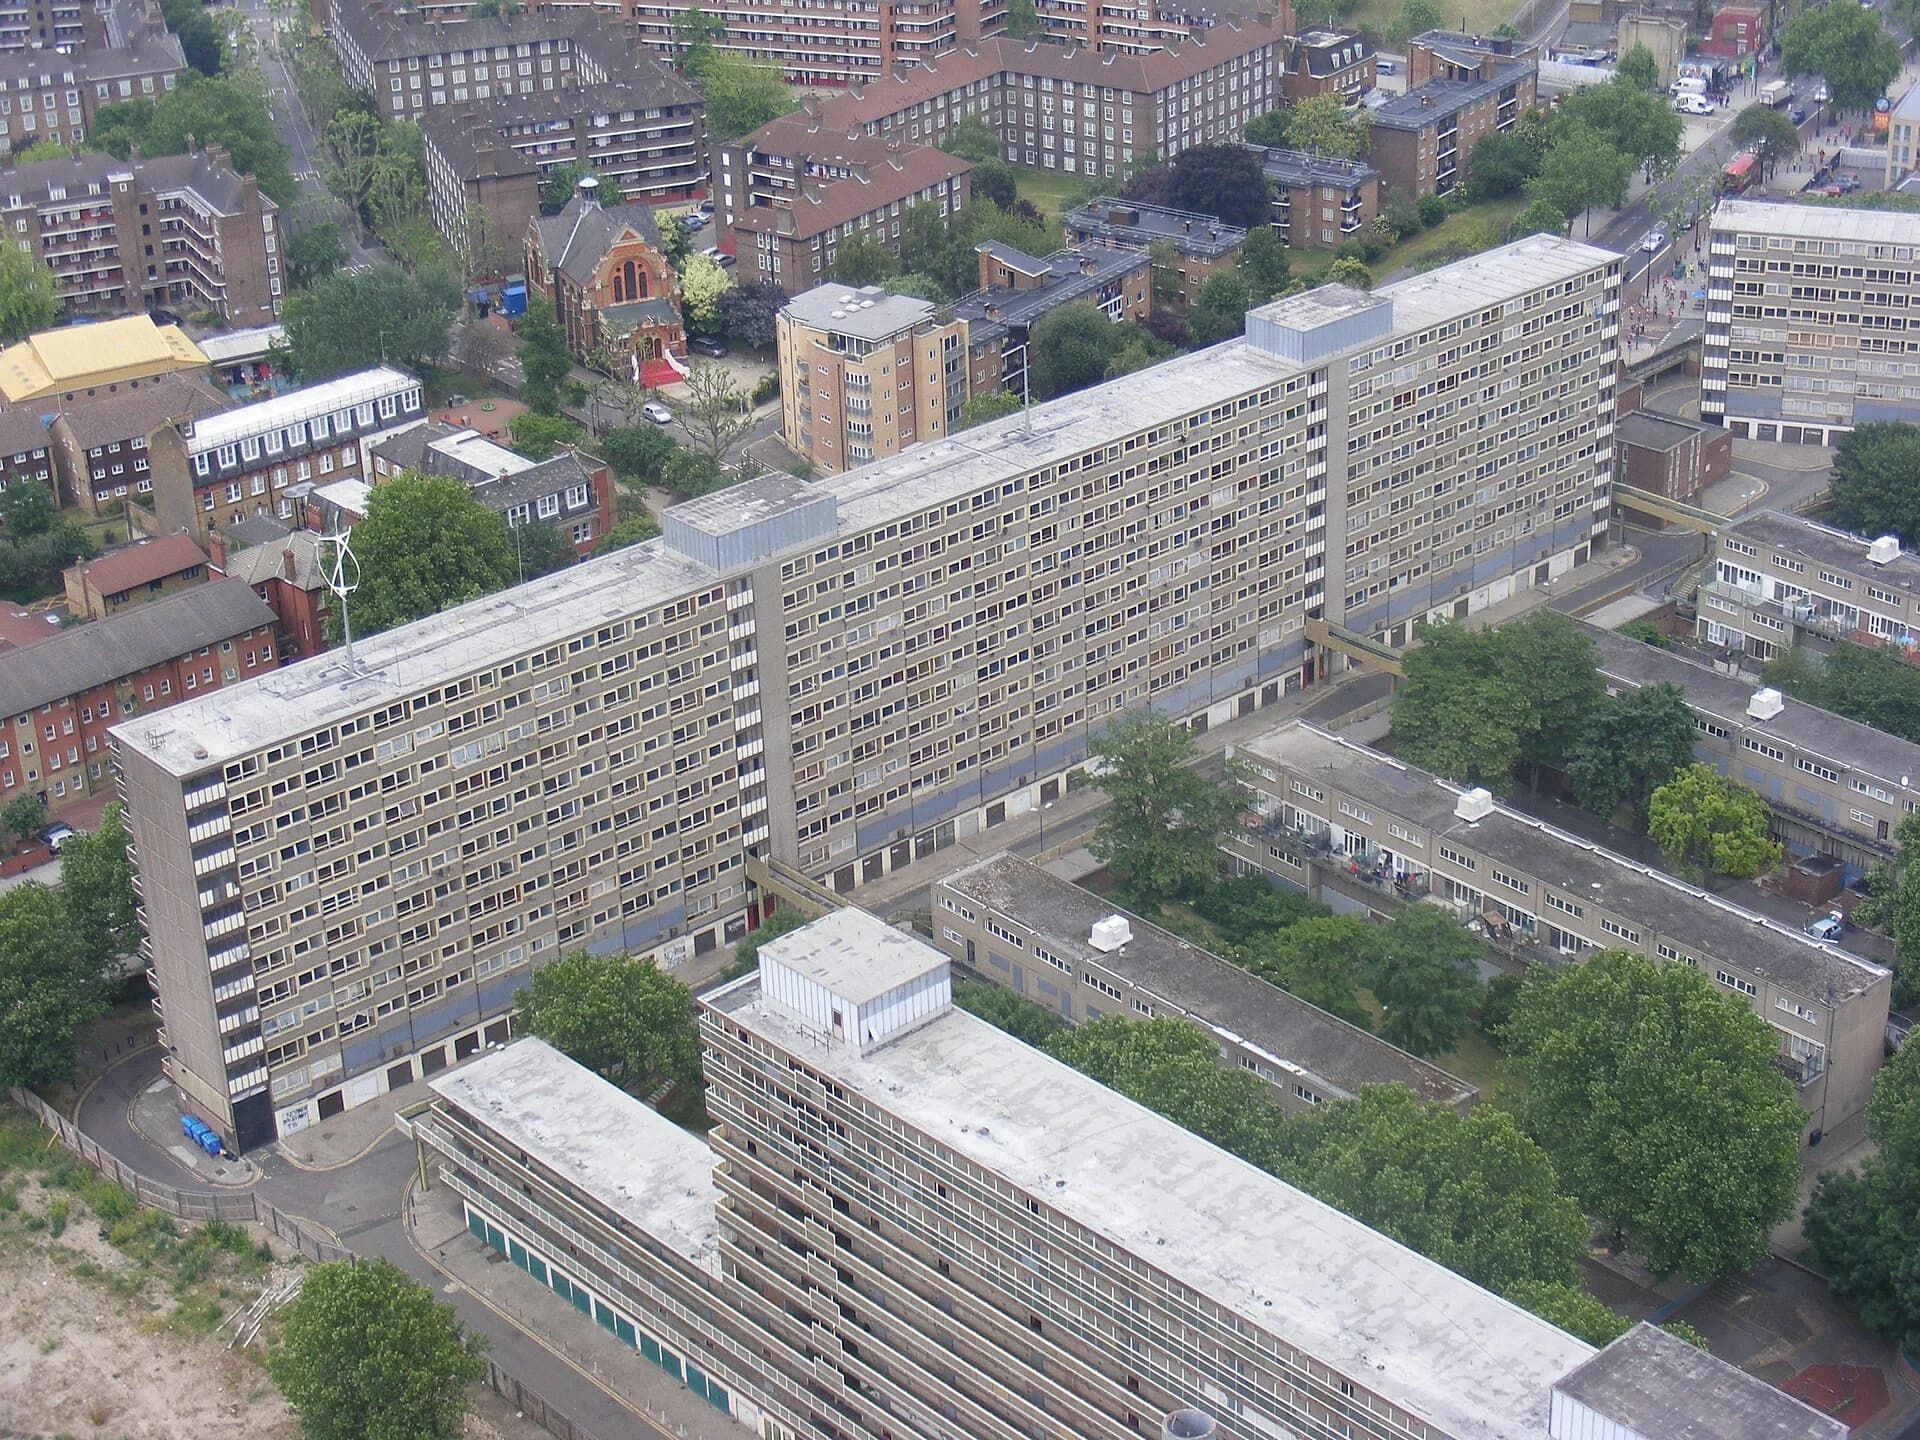
Two neighbourhoods show how land-use change is contested in very different places. Dharavi in Mumbai is one of Asia’s largest informal settlements, in a fast-growing city in a lower-middle-income country; the Heygate Estate was a council (public) housing estate in Southwark, south London, in a high-income country.
Dharavi covers about 2.4 km² of former marshland between Mumbai’s two main railway lines, close to the Bandra–Kurla business district, and holds an estimated 700,000 to 1 million people. It is dense, short of sanitation (a 2006 UN estimate found one toilet per 1,440 people) and highly productive: leather, textile, pottery and recycling workshops, the last employing about 250,000 people in 2024, make up an informal economy with an estimated turnover of US$500 million to over US$1 billion a year.
Plans to redevelop it have been made since the late 1990s. In November 2022 a company of the Adani Group won the tender, and the project is being carried out by a joint venture with the Maharashtra state government. Residents whose homes existed before 1 January 2000 are to receive a free flat of at least 350 sq ft (about 33 m²) inside Dharavi; later arrivals are offered homes elsewhere in the Mumbai region at a subsidised price or rental housing. Critics estimate that hundreds of thousands of people could be moved out of Dharavi, and many workshop owners fear that a high-rise estate leaves no room for their businesses.
The Heygate Estate was completed in 1974 with 1,214 homes and more than 3,000 residents, most of them council tenants. Southwark Council decided to demolish it as part of a plan to regenerate Elephant and Castle, describing it as run-down and associated with crime.
Residents were moved out from 2007, demolition ran from 2011 to 2014, and the council sold the 9-hectare site to the developer Lendlease for £50 million, having spent about £44 million emptying it. A 2013 London Assembly report found that surveyors had judged the buildings structurally sound in 1998, that four in five residents had not wanted to move and that crime on the estate was half the Southwark average. The replacement, Elephant Park, has about 2,700 homes, of which only 82 were planned for social rent.
Dharavi, Mumbai (India) | Heygate Estate, London (UK) | |
|---|---|---|
Type of change | Redevelopment of an informal settlement into high-rise housing and commercial space | Demolition of a public housing estate and private redevelopment (regeneration) |
Who lived there before | About 700,000–1 million people, many working in local informal industries; many without legal title | About 3,000 people, mostly council tenants and some leaseholders |
Who decided | Maharashtra state government and the Adani Group joint venture | Southwark Council and the developer Lendlease |
Why | High land value near a business district; poor sanitation and housing; “world-class city” ambitions | High land value near central London; claimed poor condition and crime; council finances |
Who gains | Eligible residents with new flats and services; the developer; the state | New, wealthier residents; the developer; the council through new housing and taxes |
Who loses | Ineligible residents moved out of Dharavi; informal businesses that need ground-floor space | Displaced tenants and leaseholders, many moved to outer London; the stock of social housing |
Residents’ power | Limited: weak tenure for later arrivals; protests and court cases | Limited: campaigns and a public inquiry, but compulsory purchase confirmed in 2013 |
The comparison shows that the same process, the replacement of low-income housing on valuable central land, happens in both a high-income and a middle-income city, but under different conditions of tenure. Heygate’s tenants had legal rights to be rehoused, yet most could not stay in the area; many of Dharavi’s residents have no legal title, so eligibility rules based on the date of arrival decide who stays. In both, the main decisions were made by government and a large developer, and the people most affected had the least power over the outcome.
Sources: Wikipedia, “Dharavi” (UN Human Development Report 2006) and “Heygate Estate” (London Assembly, 2013), accessed 2026; Free Press Journal and Outlook Business reports on the Dharavi eligibility rules, 2024.
Deprivation is a lack of access to the goods, services, opportunities and conditions that most people in a society take for granted; it is measured in the UK by the index of multiple deprivation across income, employment, health, education, crime, housing and the living environment. Social deprivation refers to its social dimensions: poor health, low educational attainment, weak social networks and exclusion from opportunities.
Deprivation tends to persist because its parts reinforce each other. The cycle of deprivation (also called the cycle of poverty), a term made widely known in the UK by the politician Keith Joseph in 1972, describes how low income leads to poor housing and diet, which harm health and children’s learning, which lead to low-paid or no work, which keeps income low and passes the disadvantage to the next generation.
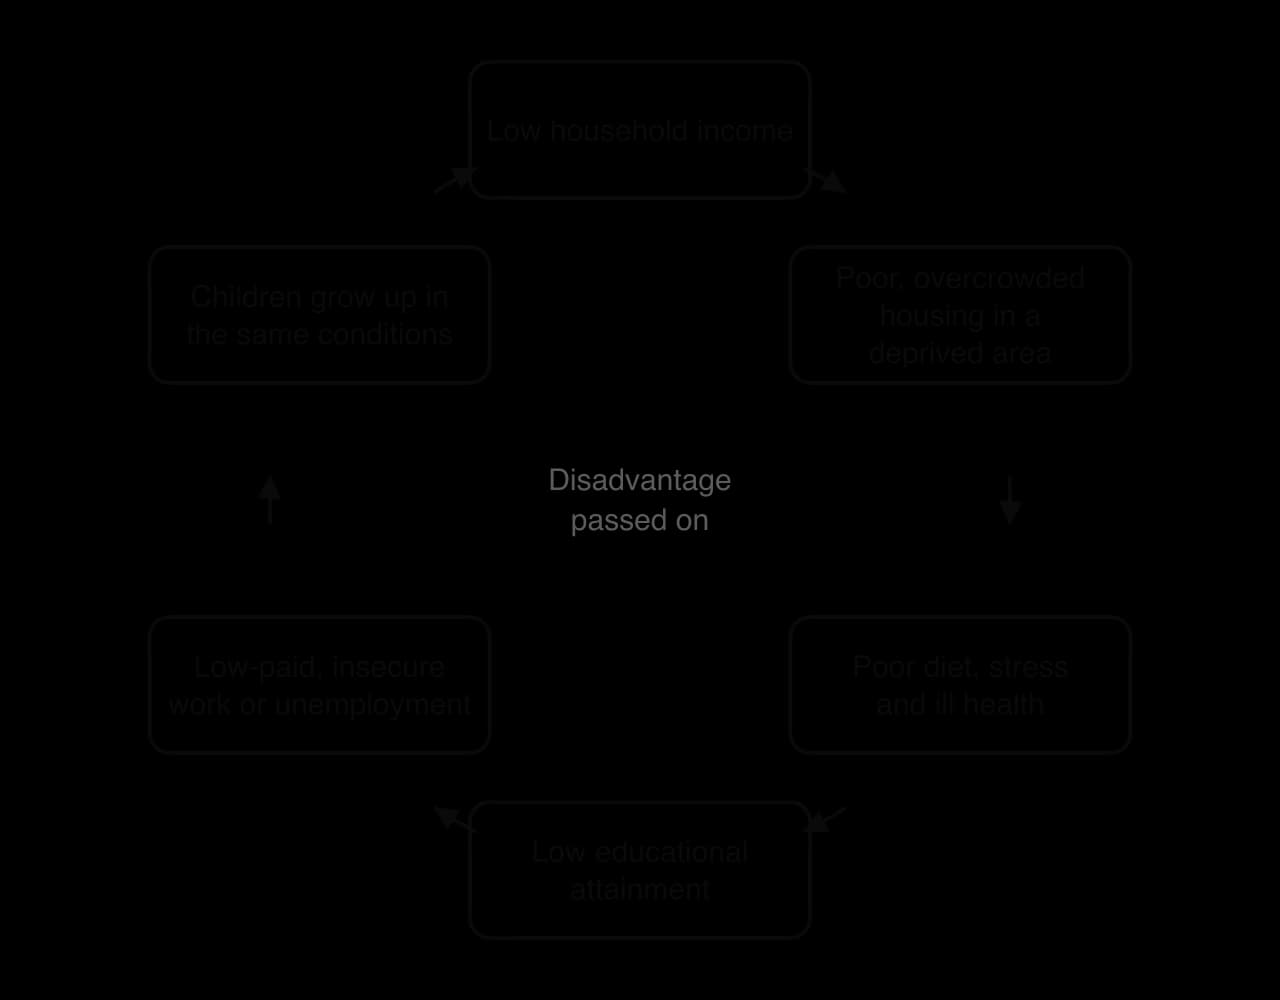
The cycle also works at the scale of a whole area. A neighbourhood with high unemployment and a poor reputation deters investment; shops and services close; residents who can afford to leave do so and are replaced by people with fewer choices; the local tax base and the quality of local schools fall; and the area’s reputation worsens.
The model has critics. It can be read as blaming deprived families for their own situation, while structural causes, such as the loss of industrial jobs through deindustrialisation, low wages, discrimination and housing policy, lie outside their control. It also implies inevitability, when many people do escape deprivation, and research on families over several generations has found less continuity than the model suggests.
Crime is unevenly distributed across a city. Recorded crime is usually highest in the CBD and nightlife districts, which have large numbers of people, cash, alcohol and the night-time economy (bars, clubs and restaurants open late), around transport hubs, and in deprived inner-city areas and some peripheral estates. Different crimes have different patterns: theft and violence cluster in the CBD at night, burglary and car crime in suburbs with valuable property, and violent crime in some of the most deprived residential areas.
A small area with an unusually high rate of crime is a crime hotspot. Police forces map recorded crimes, for example on the UK’s police.uk website, as point maps, choropleth maps of rates per 1,000 residents and density (hotspot) maps. Such maps help to direct patrols and resources, but they map recorded crime, which depends on what people report and what police record. Fear of crime also has its own geography, and it does not always match the places where crime is highest.
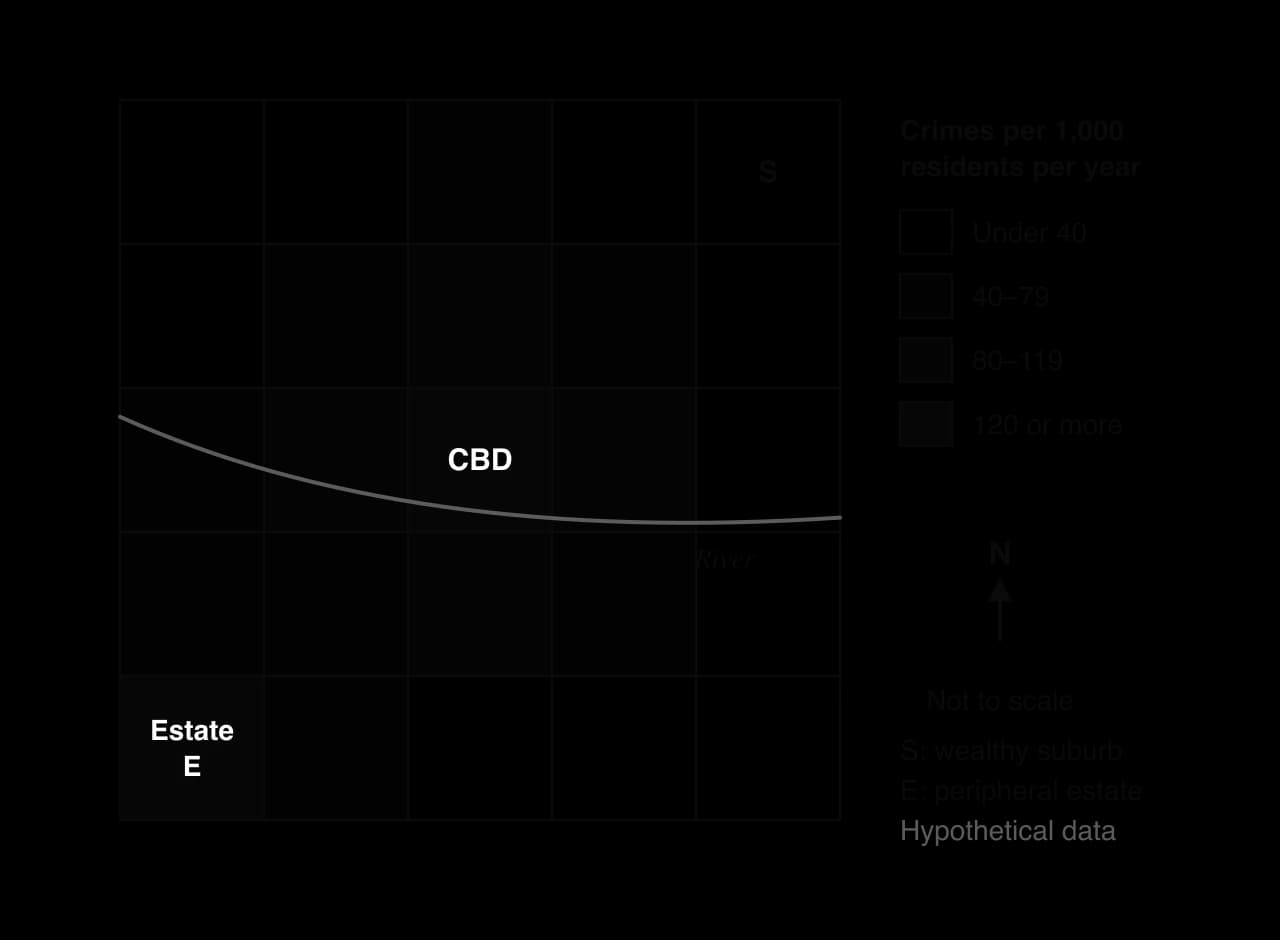
Several explanations are used, and each fits some places better than others:
Opportunity: crime happens where potential offenders meet suitable targets without capable guardians, so busy places with valuable goods and few people watching have more crime.
Deprivation and inequality: unemployment, low income, poor schooling and inequality are linked to higher crime rates, and illegal economies such as drug dealing can become a source of income and status where legal work is scarce.
Design: Oscar Newman’s idea of defensible space (1972) argued that housing designs with no clear ownership of space, such as anonymous walkways and stairwells in tower blocks, make residents less able to watch over and control their surroundings.
Disorder: the broken windows theory (James Q. Wilson and George Kelling, 1982) argued that visible signs of disorder, such as broken windows, graffiti and litter, signal that no one is in control and encourage more serious crime.
Both ideas focus on the physical environment rather than on the people who live in it, which made them attractive to planners and police forces looking for practical measures.
The design and disorder theories have been influential and contested. Defensible space was used to justify demolishing many post-war estates, although the Heygate case showed that an estate described as crime-ridden could have less crime than the borough average. Broken windows was used to justify "zero tolerance" policing in New York City in the 1990s, when crime fell sharply, but crime also fell in many US cities that did not use the approach, and critics linked aggressive policing of minor offences to the targeting of Black and Latino residents.
Responses to deprivation and crime range from changing the physical environment to changing people’s opportunities. The most successful combine the two and involve residents in the decisions.
Area-based regeneration: housing renewal, new community facilities, jobs and training programmes targeted at the most deprived neighbourhoods.
Breaking the cycle early: early-years education, school meals, health visitors and support for families, aimed at the links in the cycle of deprivation.
Crime prevention through environmental design (CPTED): designing streets, buildings and public spaces so that they are overlooked, well lit, clearly owned and easy to move through.
Policing and surveillance: community policing, CCTV and better street lighting.
A public-health approach to violence: treating violence like an infectious disease, by identifying those most at risk and intervening before it spreads.
Medellín in Colombia is the best-known example of social urbanism. In 1991 the city had 266 homicides per 100,000 people, one of the highest rates in the world, concentrated in the hillside comunas where poor rural migrants had settled. From the early 2000s, under mayors including Sergio Fajardo, the city invested its best architecture and public services in the poorest districts: Metrocable gondola lines from 2004 linking the comunas to the metro, library parks from the late 2000s, schools, and outdoor escalators in Comuna 13 opened in December 2011.
By 2017 the homicide rate had fallen to 23 per 100,000. A 2012 study found that homicide fell faster in neighbourhoods near the new Metrocable stations than in similar neighbourhoods elsewhere, although the fall also reflected the demobilisation of armed groups and national security policy.
Glasgow used a public-health approach. Strathclyde Police set up a Violence Reduction Unit in 2005, which worked with hospitals, schools and community groups: "navigators" in emergency departments approach patients injured by violence to help them leave it, and a gang programme offered young men services and training alongside the threat of enforcement. The unit was made national in 2006, and in 2019 the UK government funded similar units in 18 areas of England and Wales, including London.
Approach | Strengths | Limitations |
|---|---|---|
Physical regeneration and CPTED | Visible results; improves housing and public space | Can displace crime to nearby areas; may raise rents and push out residents (gentrification) |
CCTV, lighting and policing | Quick to introduce; reassures residents | Displacement of crime; concerns over surveillance and the targeting of minority groups |
Social urbanism and area investment | Tackles inequality and access, not only symptoms; builds civic pride (Medellín) | Expensive; depends on political continuity; violence may move rather than end |
Public-health approach | Addresses causes and repeat victims; works across agencies (Glasgow) | Slow; hard to attribute results; needs long-term funding |
Early-years and family support | Breaks the cycle of deprivation at its start | Benefits appear after many years, beyond electoral cycles |
Evaluating these approaches means asking who decides and who benefits. Physical schemes designed without residents can remove the people they were intended to help, while programmes that give residents a say and target the causes of deprivation take longer but tend to last. The scale also matters: national policies on wages, welfare and housing shape urban deprivation more than any single neighbourhood scheme can.
Fieldwork can measure how deprivation and environmental quality vary between neighbourhoods. An environmental quality survey scores each site on several criteria using a bipolar scale, for example from −2 (very poor) to +2 (very good), and the scores are added to give a total that can be mapped or compared along a transect.
Sources: Wikipedia, “Medellín” (homicide data from the Medellín municipal government), “Violence Reduction Unit”, “Operation Murambatsvina” (UN Special Envoy report, 2005) and “Gezi Park protests”, accessed 2026; Cerdá et al., American Journal of Epidemiology, 2012.
Delhi, India’s capital, is one of the world’s largest urban agglomerations, with an estimated 30.2 million people in 2025. It lies on the River Yamuna in the north-west of the Indo-Gangetic Plain, a flat, densely populated and intensively farmed lowland enclosed by the Himalaya to the north. Delhi is also one of the most polluted major cities on Earth: its annual mean PM2.5 has been about 20 times the WHO guideline in recent years, and in IQAir’s ranking of 2025 it was the fourth most polluted of 9,446 cities measured.
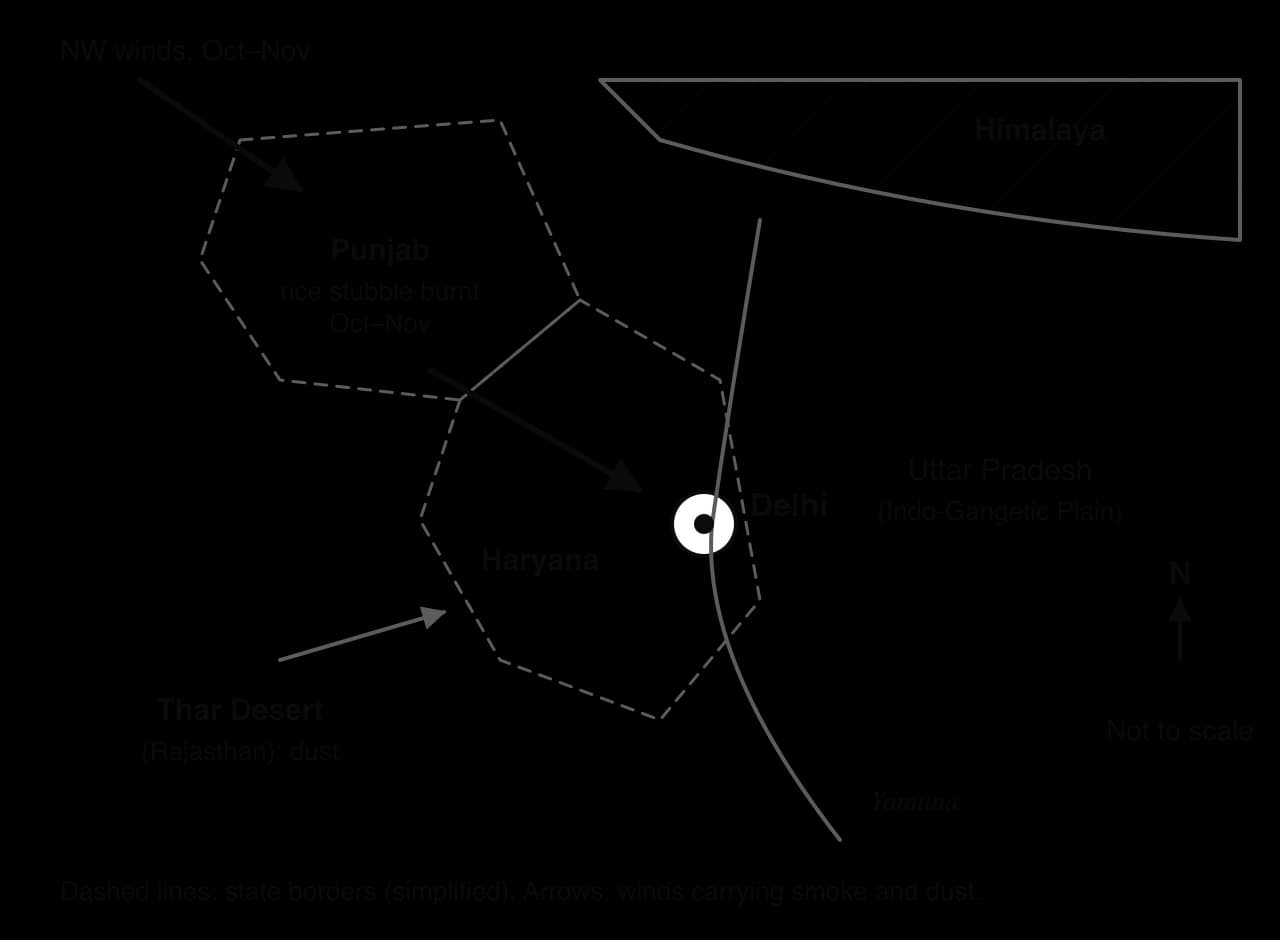
Delhi’s pollution has many local and regional sources, and their relative importance is disputed. Studies using different methods and years produce different shares:
Source of PM2.5 | IIT Kanpur study (2016) | Ministry of Earth Sciences (2018) |
|---|---|---|
Vehicles | 20% | 41% |
Road, soil and construction dust | 38% | 21.5% |
Industry and power stations | 11% | 18% |
Domestic burning (wood, dung, kerosene, waste) | 12% | Not separated |
Season and weather explain why the worst pollution comes between October and February. After the monsoon, farmers in Punjab and Haryana burn the stubble left after the rice harvest so that they can sow wheat quickly; government meteorologists estimate this can cause up to 45% of Delhi’s pollution on peak burning days.
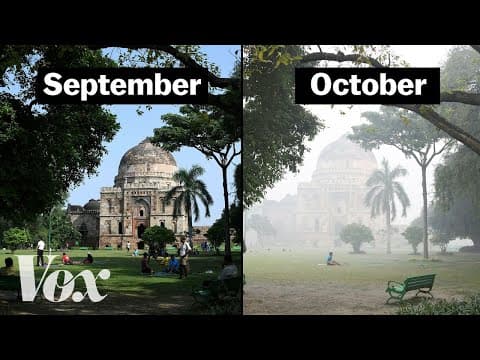
Festivals add to it, as effigies are burnt at Dussehra and fireworks are let off at Diwali. In winter, long clear nights and light winds produce frequent temperature inversions over the plain, which trap smoke and dust near the ground, while cold weather increases the burning of wood and waste for warmth. In the monsoon months, rain washes particles out of the air and air quality is often "satisfactory".
The worst episode in recent years, the "Great Smog" of November 2016, followed Diwali and the peak of stubble burning under stagnant air. On 7 November 2016 monitors recorded PM2.5 of 999 µg m⁻³, the maximum they could measure.
 YouTube
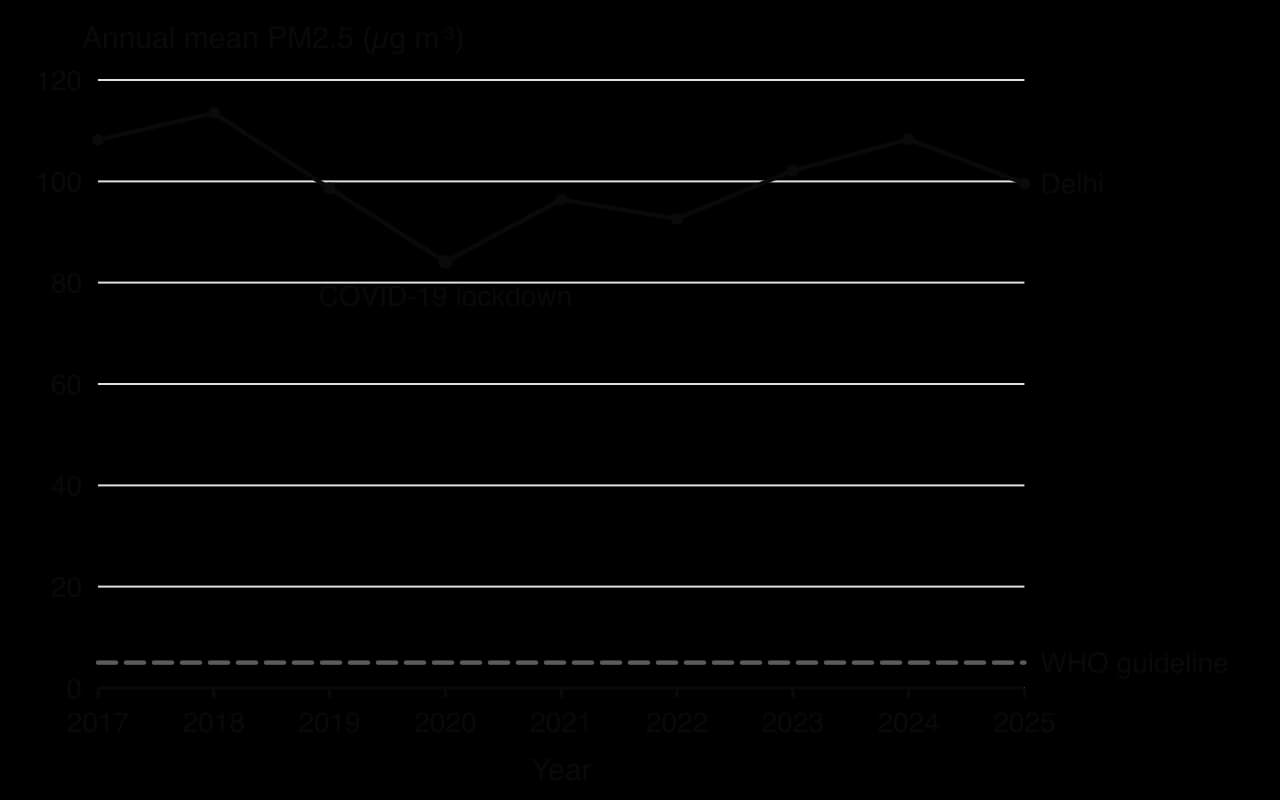
The chart shows how persistent the problem is. Annual PM2.5 fell from 113.5 µg m⁻³ in 2018 to 84.1 µg m⁻³ in 2020, when the COVID-19 lockdown stopped most traffic, construction and industry for weeks, then rose again to 108.3 µg m⁻³ in 2024. The 2025 value, 99.6 µg m⁻³, was about 20 times the WHO guideline and 2.5 times India’s own national standard of 40 µg m⁻³.
Everyone in Delhi breathes polluted air, but exposure and harm vary with age, health, occupation, income, housing and location:
Group | Why exposure or harm is greater | Ability to protect themselves |
|---|---|---|
Children | Breathe more air per kilogram of body weight, spend more time outdoors and have developing lungs; schools close during the worst episodes, losing learning time | Depend on their families and schools |
Older people and people with heart or lung disease | Most likely to die or be hospitalised during smog episodes | Varies with income and access to health care |
Outdoor workers: street vendors, cycle-rickshaw and auto-rickshaw drivers, construction workers, traffic police, waste pickers | Spend 8–12 hours a day beside traffic and dust; cannot stop work when the AQI is severe | Very limited: cannot afford to lose a day’s pay; masks are the only protection |
Residents of informal settlements | Live beside roads, industry and landfill sites; many cook or keep warm with wood, dung or waste, adding indoor smoke (about 10% of Delhi households used solid fuels for cooking in 2011) | Homes are not sealed; air purifiers are unaffordable |
Wealthier households | Still exposed outdoors | Air purifiers at home and in offices, cars with filtered air, private health care, the option to leave the city in the worst weeks |
The impacts are economic and social as well as medical. The Supreme Court and the city government have repeatedly closed schools and halted construction, which protects children but costs daily-wage construction workers their incomes. Flights and trains are delayed in thick smog, and a 24-vehicle pile-up on the Yamuna Expressway during the November 2016 smog showed the danger of low visibility on roads.
Response | Date | Effect and evaluation |
|---|---|---|
Odd–even car rationing by number plate | January and April 2016; November 2019 | Emptier roads for the trial periods; little measurable effect on PM2.5, as vehicles are only one source and two-wheelers and taxis were exempt |
Supreme Court ban on firecracker sales in Delhi | November 2017 | Widely broken; fireworks still bought outside Delhi and used at Diwali |
Closure of Badarpur coal-fired power station | October 2018 | Removed a plant that produced under 8% of Delhi’s electricity but 80–90% of the power sector’s particulate pollution |
National Clean Air Programme, with targets for over 100 cities | 2019 | Targets for reductions in PM10 and PM2.5; progress uneven |
Commission for Air Quality Management for Delhi and the surrounding region, replacing an earlier authority | October 2020 | A regional body, because sources lie in several states; can order emergency measures across the region |
Emergency measures in severe episodes: school closures, construction bans, entry bans for trucks, temporary closure of coal plants | Most winters, e.g. November 2021 | Reduce peaks briefly; costly for workers and businesses |
Cleaner fuel standards, compressed natural gas buses and limits on old vehicles; a ban on selling fuel to old vehicles began on 1 July 2025 but was put on hold within days after public objections | 2020s | Cut emissions per vehicle; growing vehicle numbers offset part of the gain; enforcement is politically difficult |
Cloud seeding trial to make rain | October 2025 | No significant result |
Responses have struggled for three reasons. First, the problem crosses scales and boundaries: stubble burning happens in Punjab and Haryana, which have their own governments and electorates of farmers who need to clear fields cheaply between harvests, so Delhi cannot control it. Second, many sources are diffuse: millions of vehicles, construction sites, roads and household fires. Third, most measures are emergency reactions in November rather than sustained year-round programmes. The closure of Badarpur and the creation of a regional commission show that structural measures are possible, but annual PM2.5 has not fallen consistently.
Power: those who suffer most (outdoor workers, children, informal settlement residents) have the least influence on policy, while the farmers whose burning contributes in winter have political influence in their own states; the courts have often acted where governments have not.
Process: pollution levels depend on physical processes (winter inversions, wind direction, monsoon rain) as much as on emissions.
Scale and spatial interaction: a city-scale problem with regional causes, managed by city, state and national governments with different interests.
Equity: exposure is unequal, and protection can be bought, so pollution deepens existing inequalities.
How far does the Delhi case support the view that air pollution is a regional problem, not only an urban one?
Which of the groups in the impacts table would gain most from a permanent end to stubble burning, and which from cleaner vehicles?
Why might a measure such as the Badarpur closure be more effective than odd–even rationing?
Sources: IQAir, World Air Quality Report, 2017–2025; UN DESA, World Urbanization Prospects 2025; Wikipedia, “Air pollution in Delhi” (IIT Kanpur 2016; Ministry of Earth Sciences 2018; Census of India 2011; Supreme Court and CAQM orders), accessed 2026; WHO Global Air Quality Guidelines, 2021.
Cities create their own microclimate: warmer, less humid, wetter downwind, less windy on average but gusty around tall buildings, and often hazy.
The urban heat island is strongest at night in calm, clear weather; it results from low albedo, heat storage in building materials, anthropogenic heat, less evapotranspiration, urban canyons and a pollution dome.
The heat island profile has a cliff at the urban edge, a suburban plateau, a CBD peak and sinks over parks and water; green infrastructure and cool roofs reduce it, but can raise rents.
Air pollution, especially PM2.5, caused about 4.2 million premature deaths in 2019; it is worst along main roads, in basins and valleys, at rush hours and in winter inversions.
Delhi’s annual PM2.5 has stayed near 20 times the WHO guideline; its sources are regional as well as local, and exposure is greatest for outdoor workers, children and the poor.
Congestion follows radial routes and peak hours, grows with car ownership and induced demand, and is managed by road pricing, mass transit, BRT and limits on car ownership; New York’s 2025 toll cut vehicle entries by about 11%.
Land-use change is contested because stakeholders gain and lose unequally; Dharavi and the Heygate Estate show residents with weak tenure losing out to government and developers.
The cycle of deprivation and the geography of crime are managed by regeneration, design, policing, public-health and social urbanism approaches, each with strengths and limits.
I can describe five ways in which a city modifies its microclimate.
I can explain at least five causes of the urban heat island and draw an annotated heat island profile.
I can evaluate green roofs, cool roofs, trees and other strategies for managing the urban heat island.
I can explain the sources and spatial and temporal patterns of air pollution and draw a temperature inversion.
I can use Delhi to explain how the impacts of air pollution vary between groups of people and evaluate its management.
I can describe the patterns, trends and impacts of congestion and evaluate New York City’s congestion pricing.
I can compare Dharavi and the Heygate Estate to examine who gains and loses from contested land-use change.
I can draw the cycle of deprivation, explain geographic patterns of crime and evaluate ways of managing them.
Wider benefits and costs: amenity and biodiversity from green infrastructure; high capital and maintenance costs of engineering.
Good answers may be well structured (AO4) and may additionally offer a critical evaluation (AO3) which questions how success is measured and for whom (stakeholders, equity: some districts may be better protected than others), and whether present success will last as cities grow and rainfall intensifies (possibilities). Another approach might be to compare strategies within one city or between cities at different levels of development.
For 5–6 marks, expect some weakly-evidenced outlining of flood mitigation in an urban area.
For 7–8 marks, expect a structured account which includes:
either well-evidenced explanation of the success of strategies in one or more named urban areas
or a discursive conclusion (or ongoing evaluation) grounded in geographical concepts and/or perspectives.
For 9–10 marks, expect both of these traits.
NB. Maximum [4] if no urban area is named.
Marks | Level descriptor |
|---|---|
0 | The response does not reach a standard described by the descriptors below. |
1–2 | Too brief, lists unconnected information, not focused on the question and lacks structure. Knowledge is very general, with large gaps or errors; examples or case studies are missing or only listed. No analysis; terminology is missing or used incorrectly. |
3–4 | Too general, lacks detail, not focused on the question and largely unstructured. Outlines examples, statistics and facts, both relevant and irrelevant, with links to the question only listed. Basic terminology is used, with errors or inconsistently. No critical evaluation of evidence; any conclusion is irrelevant. |
5–6 | Partially addresses the question, with a narrow argument, an unsubstantiated conclusion and limited evaluation. Describes relevant supporting evidence (examples, case studies) and outlines links to the question. The argument repeats one point or covers only part of the question. Other perspectives, or strengths and weaknesses of evidence, are listed. |
7–8 | Addresses the whole question; the analysis is evaluated and the conclusion is relevant but lacks balance. Relevant evidence is described correctly and covers all the main points. The argument is clear but one-sided or unbalanced. Complex terminology is used correctly but not consistently. Other perspectives, or strengths and weaknesses of evidence, are described. |
9–10 | In-depth and specific to the question (topic and command term). Correct, relevant examples, statistics and detail are integrated and their link to the question explained. The argument is balanced, explaining complexity, exceptions and comparisons. Evaluation of evidence and perspectives is well developed, and the conclusion is balanced and aligned with the evidence. Logically structured and easy to follow. |
To what extent is river flood risk becoming harder to manage in rapidly growing cities?
10 marks
Examine the extent to which rapid urbanization increases the incidence of vector-borne and water-borne diseases.
10 marks