Explain centripetal and centrifugal movements, from rural–urban migration and gentrification to suburbanisation and counter-urbanisation, examine infrastructure growth in Shenzhen, and analyse deindustrialisation and its consequences.
Each is in the Geography glossary, with every other term in the subject.
Land that has previously been developed, such as a former factory, dock or railway yard, which may be derelict or contaminated and can be reused.
A high-capacity bus system with dedicated lanes, stations with fare payment before boarding and frequent services, giving metro-like speed and reliability at lower cost.
The movement of people or economic activity away from the centre of an urban area, such as suburbanisation and counter-urbanisation.
The movement of people or economic activity towards the centre of an urban area, such as rural–urban migration, gentrification and reurbanisation.
Migration in which people follow relatives, friends or neighbours who have already moved, relying on them for information, housing and work at the destination.
A model of sector shift in which, as an economy develops, employment moves from the primary sector to the secondary sector and then to the tertiary and quaternary sectors.
A town or village, usually beyond the edge of a city, whose residents mostly travel to work in the city each day.
The transport of goods in standard-sized steel containers that can be moved between ships, trains and lorries without unpacking, which cut shipping costs and required large new port terminals.
Distinguish between urbanisation and urban growth, and explain the contributions of natural increase, net in-migration and reclassification.
Distinguish between centripetal and centrifugal population movements.
Explain the causes of rural–urban migration to industrialising cities, including step and chain migration.
Explain the causes, stages and consequences of gentrification in post-industrial cities, and evaluate who gains and who loses.
Explain the causes and consequences of suburbanisation and counter-urbanisation.
Describe the urban–rural continuum and evaluate the stages of urbanisation model.
Examine how infrastructure for transport, sanitation, water, waste and telecommunications develops as an urban system grows, using Shenzhen as a case study.
Explain the causes of deindustrialisation and examine its economic, social and demographic consequences, using the Clark–Fisher model and Detroit.
Urban areas change continuously. People move into them and out of them, neighbourhoods rise and decline, new railways and pipes extend their reach, and the industries that built them close or move away. Urban geography studies these changes as processes acting on an urban system over time.
The changes are driven by spatial interactions with other places. Migrants arrive from the countryside and from abroad, factories move between continents in the global shift of manufacturing, and capital flows into some neighbourhoods and out of others. The same city can therefore grow at its edge while its inner districts empty, or regain people in its centre while its suburbs age.
78 exam-style questions on this subtopic, written in the style of the IB papers. The first has its markscheme open. Counted on
Examine the relative importance of site and situation in explaining the growth of one or more named cities.
10 marks
Marks should be allocated according to the markbands.
Site is the physical characteristics of the land on which a settlement was originally built (relief, water supply, drainage, defensibility, building materials, a sheltered harbour). Situation is the location of the settlement in relation to its surroundings: other settlements, routeways, resources and the wider region. Growth may refer to growth in population, area or economic importance, and may be considered over a long timescale. The question asks candidates to weigh one against the other, so answers should do more than describe the site and situation of a city.
Possible applied themes (AO2) demonstrating knowledge and understanding (AO1):
Site factors that favoured early settlement: defensive sites (eg Edinburgh's castle rock; Durham within a tight river meander), wet-point and dry-point sites, bridging points (eg London at the lowest bridging point of the Thames in Roman times), and deep, sheltered natural harbours (eg Sydney, Hong Kong's Victoria Harbour, Rio de Janeiro's Guanabara Bay).
Site factors that later constrain growth: steep slopes, marshland or limited flat land, so that cities expand through land reclamation (eg Hong Kong, Singapore, Mumbai built on the reclaimed land joining seven islands) or high-rise building.
Situation factors that explain sustained growth: position on major trade routes (eg Singapore on the Strait of Malacca; Istanbul on the Bosphorus between Europe and Asia), at the centre of a fertile region, or at the meeting point of river valleys and transport routes (eg Chicago between the Great Lakes and the Mississippi basin, later a rail hub).
Situation can change in value over time as technology changes: canals, railways, air hubs and container ports (eg Dubai's growth as an air and shipping hub on an arid coastal site).
With a free account, Augment remembers where you stopped and what you have practiced.
The net movement of people from large urban areas to smaller towns, villages and rural areas beyond the edge of the city.
The long-term decline of manufacturing industry, measured by its share of employment or output, in a city, region or country.
The gap between people, places or countries that have access to modern digital technology and the internet and those that have limited or no access.
The involuntary movement of residents or businesses out of an area because of rising rents and prices, redevelopment or eviction.
The movement of higher-income households into a low-income, often inner-city area, renovating housing and changing its social character, which usually raises property values and displaces existing residents.
Land that has not previously been built on, such as farmland or open countryside, often at the edge of an urban area.
The basic physical structures and networks a settlement needs to function, such as transport routes, water and sewerage pipes, power supply, waste facilities and telecommunications.
Public transport that carries large numbers of passengers along fixed routes, such as metros, commuter railways, trams and bus rapid transit.
The number of people moving into an area minus the number moving out, when arrivals exceed departures.
The relocation of some of a company’s production or services to another country, either to its own facilities or to foreign contractors, usually where costs are lower.
The growth of urban populations, housing and economic activities in the zone just beyond a city's formal boundary, often unplanned and mixing urban and rural characteristics.
Economic activities that extract raw materials directly from the natural environment, such as farming, fishing, forestry, mining and quarrying.
Knowledge-based economic activities, such as research and development, information technology, consultancy and financial services.
The long-term improvement of a declining urban area through investment in its economy, buildings, infrastructure, environment and community.
The difference between the rent a property earns in its current, run-down state and the much higher rent it could earn if renovated, which makes gentrification profitable.
The growth of population and investment in the central and inner areas of a city after a period of decline, often through redevelopment, conversion of older buildings and gentrification.
The zone at the edge of a built-up area where urban and rural land uses meet and mix, such as farmland, retail parks, housing estates, airports and waste sites.
The region of the north-eastern and Great Lakes United States, including Detroit, Cleveland and Pittsburgh, that has suffered deindustrialisation and population decline since the mid-20th century.
Economic activities that process raw materials into manufactured products, including construction and energy production.
An urban area that has experienced a substantial and sustained loss of population, usually because of economic decline and out-migration.
A model (van den Berg and others, 1982) of the sequence of urbanisation, suburbanisation, counter-urbanisation and reurbanisation that a city region may pass through.
Migration in a series of stages, for example from a village to a nearby town, then to a regional city and finally to a major city.
The concentration of student households in a residential area near a university, usually in converted shared rental housing, changing the area's population, services and character.
The outward growth of an urban area and the movement of people and activities from the inner city to residential and commercial suburbs at its edge.
Economic activities that provide services to people and businesses, such as retail, transport, health care, education, entertainment and tourism.
An increase in the number of people living in an urban area, or in the area it covers, regardless of any change in the share of the population that is urban.
The uncontrolled spread of low-density urban development, especially housing and roads, into the countryside at the edge of a city.
A city viewed as a system of inputs such as people, water, energy and materials, stores, flows and outputs such as goods, waste and emissions, linked by infrastructure.
The idea that settlements form a continuous gradient from highly urban to highly rural, rather than two distinct categories, with density and urban functions decreasing outwards.
Scope: The syllabus covers urbanisation, natural increase and centripetal movements (rural–urban migration in industrialising cities and inner-city gentrification in post-industrial cities); centrifugal movements (suburbanisation and counter-urbanisation); the growth of urban systems through infrastructure for transport, sanitation, water, waste disposal and telecommunications, with a case study of infrastructure growth over time in one city (here Shenzhen); and the causes and consequences of deindustrialisation. Urban environments is one of seven options, of which SL students study two and HL students three.
Urbanisation is an increase in the proportion of a country’s population living in urban areas. Urban growth is an increase in the number of people living in urban areas, or in the area a city covers. The two usually happen together, but not always. If a country’s rural and urban populations grow at the same rate, its cities grow without any urbanisation; in Japan, where the total population is falling, the urban share can rise while the number of urban residents falls.
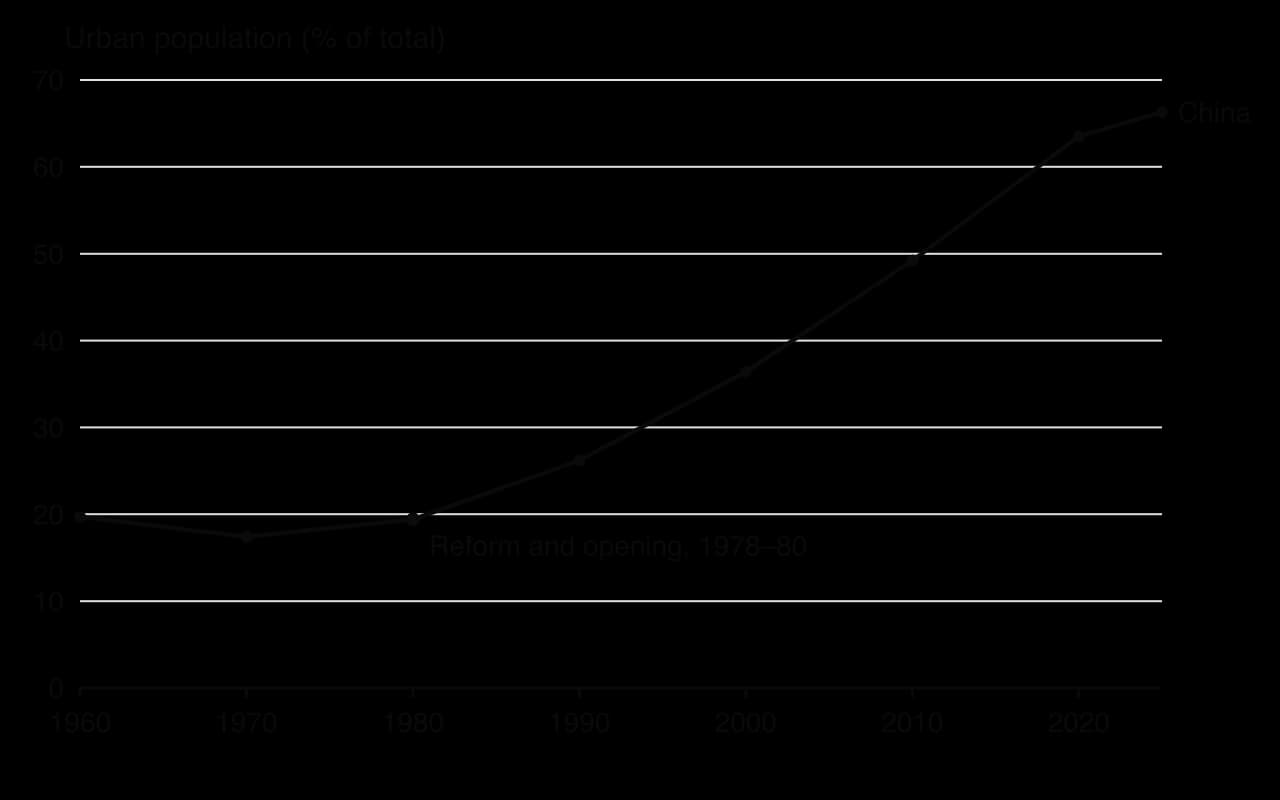
China shows the most rapid urbanisation in history. Its urban share stayed at about 20% until the economic reforms that began in 1978, then rose to 49% in 2010 and 66% in 2025. Over the same period its urban population grew by more than 700 million people.
Cities grow in three ways:
Natural increase: more births than deaths among the city’s residents. Because most migrants are young adults, cities with high in-migration also have many births, and death rates are often lower in cities than in the countryside because health care is closer. In many cities of low- and middle-income countries natural increase now adds more people each year than migration.
Net in-migration: more people moving into the city than leave it, from rural areas, other cities or other countries.
Reclassification: rural settlements next to a growing city become counted as urban, either because the city boundary is extended or because they pass the national threshold for an urban area. This adds people to the urban total without anyone moving.
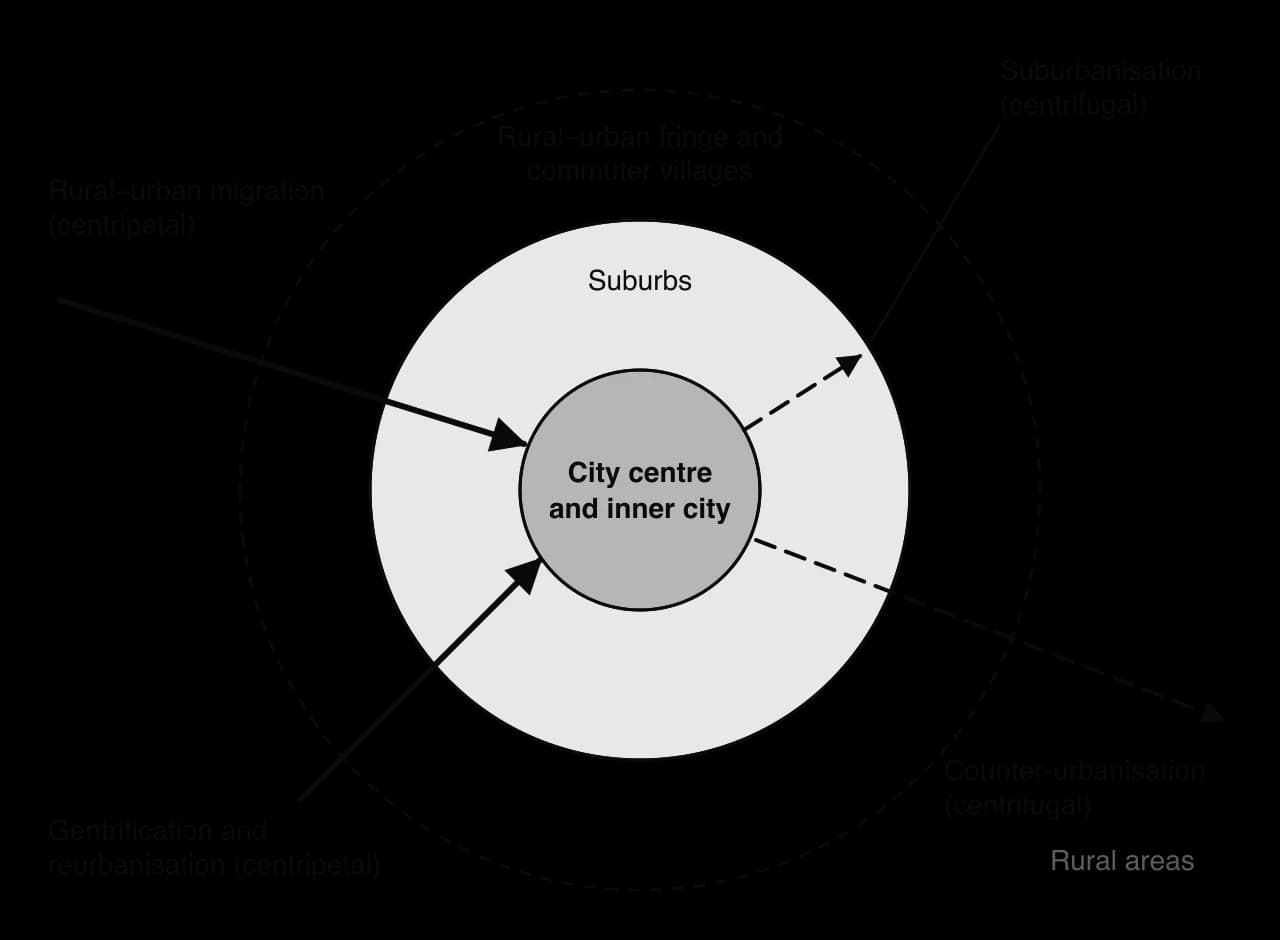
Movements of people within and between urban and rural areas fall into two groups. A centripetal movement is towards the centre of a city: rural–urban migration into the city, and the return of people to inner districts through gentrification and reurbanisation. A centrifugal movement is away from the centre: suburbanisation to the edge of the city, and counter-urbanisation to rural areas beyond it.
Rural–urban migration is the movement of people from the countryside to towns and cities. It is the main centripetal movement in industrialising countries, where factories, construction and services in the cities offer far higher wages than farming. Migrants are pushed by poverty, landlessness, drought or conflict and pulled by jobs, schools, health care and the hope of a better life; these push factors and pull factors act together.
Many migrants do not move directly from village to megacity. Step migration is a move in stages, from a village to a small town, then to a regional city and finally to the largest city, gaining money, skills and contacts at each step. The idea goes back to E. G. Ravenstein’s laws of migration of 1885.
Chain migration is the movement of people who follow relatives or neighbours from their home area to the same city, and often the same district and occupation. Earlier migrants send information and money, find housing and jobs for newcomers and help them settle, so that particular villages become linked to particular city neighbourhoods. Chain migration explains why migrant communities cluster and why ethnic enclaves form.
The economist Michael Todaro argued in 1969 that migrants respond to expected income rather than to actual wages. A migrant may move even when urban unemployment is high, because the expected urban income (the wage multiplied by the chance of finding a job) is still greater than rural income. Todaro’s idea explains why cities keep attracting migrants faster than they create formal jobs, and why many migrants first work in the informal sector.
China’s growth since 1980 rests on the largest rural–urban migration in history, mainly to the factories and building sites of coastal cities. It has been shaped by the hukou (household registration) system, which records each person as rural or urban and ties access to public schools, health care and pensions to the place of registration. Most migrants keep a rural hukou, so they can work in cities but cannot easily settle there with full rights. In Shenzhen in 2020 only 33.4% of the 17.56 million residents held a local hukou. Many migrants’ children stay in the village with grandparents, and older migrants often return home.
In post-industrial cities, whose economies now depend on services rather than manufacturing, a different centripetal movement has changed many inner-city districts since the 1960s. Gentrification is the movement of higher-income households into a low-income inner-city area, where they buy and renovate housing and change the area’s social character, shops and services. The sociologist Ruth Glass coined the term in 1964 to describe middle-class newcomers taking over working-class housing in London districts such as Islington.
Once this process of ‘gentrification’ starts in a district it goes on rapidly, until all or most of the original working-class occupiers are displaced and the whole social character of the district is changed.
— Ruth Glass, London: Aspects of Change, 1964
The rent gap. The geographer Neil Smith argued in 1979 that gentrification happens where there is a large rent gap: the difference between the low rent a run-down property earns now and the much higher rent it could earn if renovated. Years of disinvestment in inner-city housing create the gap; developers and buyers profit by closing it.
Changing jobs. Deindustrialisation replaced factory work with well-paid service jobs in the CBD (finance, law, media, technology), creating many young professionals who want to live close to work.
Changing households. Smaller households, later marriage, couples without children and single people value central location, nightlife and culture more than garden space.
Dislike of commuting. Long, congested journeys from the suburbs make inner-city housing near the CBD attractive.
Amenities and character. Period terraced houses, warehouses suitable for lofts, independent shops and cultural life attract newcomers.
Government policy. Regeneration schemes, new transport links and tax incentives raise the attractiveness of run-down areas, sometimes deliberately.
Two related forms of change are common. Studentification is the growth of student households in an area near a university, as family houses are converted into shared rental homes, which changes its population, shops and seasonal life. Super-gentrification is a later wave in which very wealthy financiers and professionals buy into districts that have already gentrified, as in parts of Islington and Brooklyn Heights.
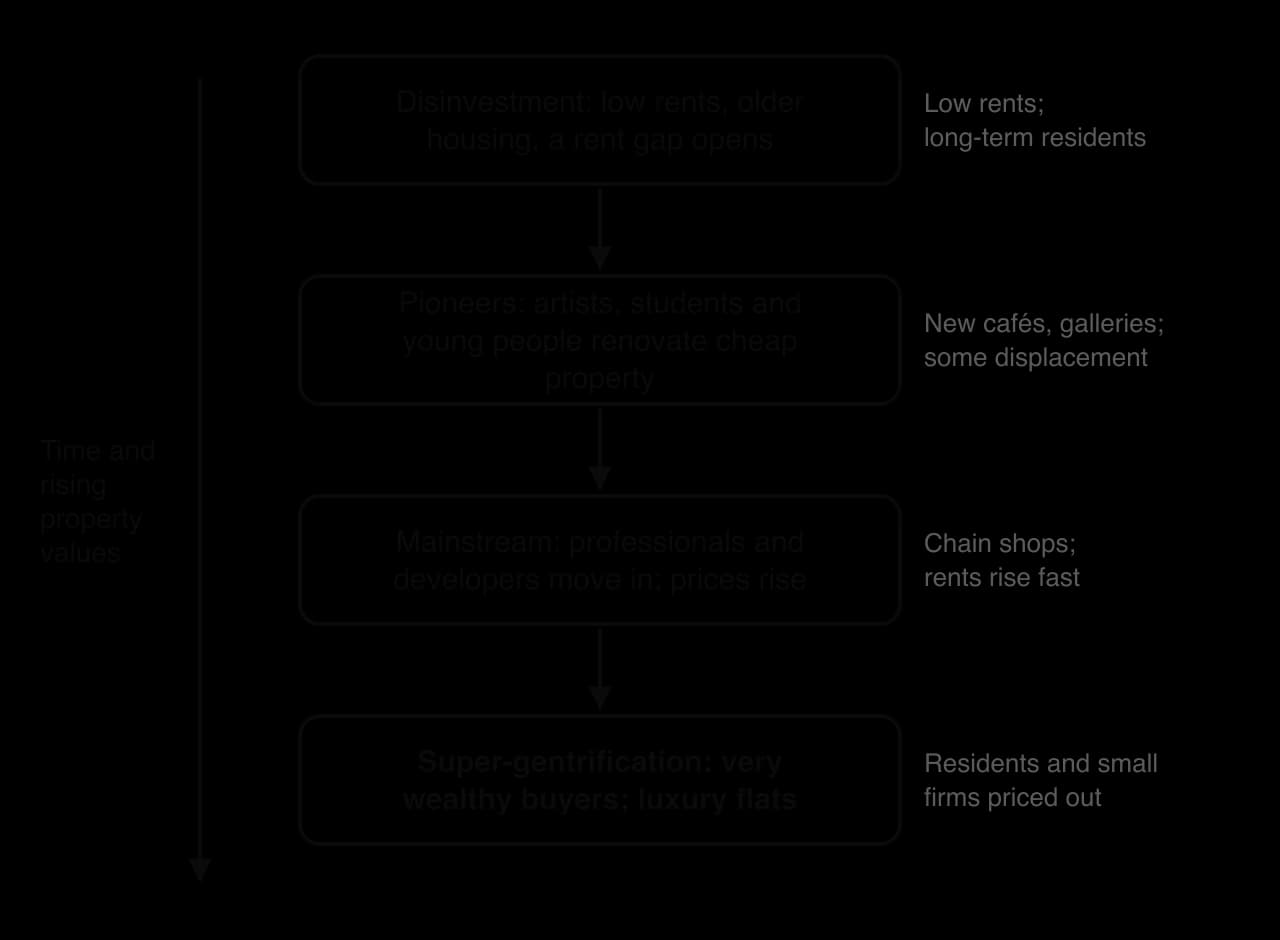
Gentrification usually proceeds in stages. It begins in a district where years of disinvestment have left housing cheap and run-down, so a rent gap has opened. Pioneers, often artists, students and young people with little money, move in for the low rents and renovate property themselves, and new cafés and galleries follow. Their arrival makes the area seem safer and more fashionable, so in the mainstream stage professionals, developers and estate agents move in, prices rise quickly and chain shops replace local ones. In some cities a final stage of super-gentrification brings very wealthy buyers and luxury flats, and by then even the pioneers may be priced out.
The most debated consequence is displacement: the forced movement of existing residents and businesses out of an area because rents rise, landlords sell or redevelop, or tenancies end. Displacement can be direct (an eviction) or indirect (rising rents and changing shops that make long-term residents feel the area is no longer theirs).
Consequence | Positive | Negative |
|---|---|---|
Housing | Old buildings renovated; vacant properties reused | Rents and prices rise beyond the reach of existing residents; less social and affordable housing |
Economy | New businesses, jobs in cafés and services; higher tax revenue | Local shops and workshops replaced by expensive cafés, bars and chains |
Population | More mixed population at first; falling crime in some areas | Displacement of low-income, older and minority residents; fewer children |
Environment | Improved streets, parks and buildings | Loss of affordable studios and industrial space; tension over noise and parking |
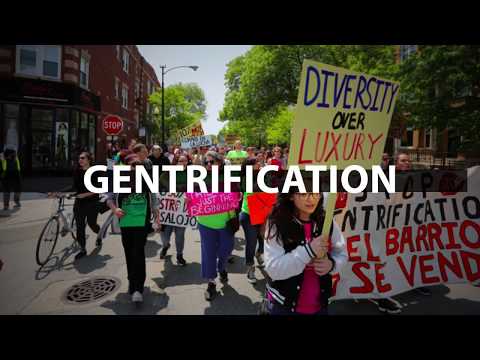
Well-known examples include Shoreditch and Hackney in east London, where former furniture workshops and warehouses became studios, offices and flats; Williamsburg in Brooklyn, New York; the Mission District of San Francisco, where technology workers moved into a mainly Latino neighbourhood; and Kreuzberg in Berlin, once next to the Wall and now one of the city’s most fashionable districts.
 YouTube
Gentrification forms part of a wider return to the centre called reurbanisation: the growth of population in a city’s central and inner areas after a period of decline, through new flats on former industrial land, the conversion of offices and warehouses to housing, and the arrival of young professionals, students and international migrants. Manchester’s city centre, which had very few residents in the 1980s, now houses a large population in converted mills and new apartment towers.
Whether gentrification is good for a city depends on whose perspective is taken and over what timescale. City governments and property owners gain higher tax revenue and property values; newcomers gain central homes. Long-term tenants, small businesses and minority communities often lose homes, livelihoods and social networks, and their displacement may simply move poverty to outer suburbs with fewer services and longer journeys to work. Policies such as rent control, a required share of affordable housing in new developments and community land trusts can limit displacement, but they rarely stop the process where demand is strong.
Suburbanisation is the outward growth of a city and the movement of people, and later shops, offices and industry, from the inner city to the suburbs at its edge. It is the main centrifugal movement in HIC cities of the 20th century.
Transport. Trams and suburban railways from the late 19th century, and then mass car ownership and motorways, allowed people to live far from work. London’s Metropolitan Railway promoted “Metro-land” in the north-west of the city from 1915.
Housing finance and building. Cheap mortgages, government-backed loans and large-scale house-building made suburban homes affordable. Levittown on Long Island, New York, built 17,447 almost identical homes between 1947 and 1951, mainly for returning war veterans.
Preferences. Families wanted more space, gardens, quieter streets and better schools than the crowded inner city could offer.
Push from the inner city. Pollution, congestion, crime, poor housing and, in many cities, slum clearance programmes that rehoused residents in new estates and overspill towns.
Suburbanisation produced urban sprawl, the spread of low-density development over large areas of countryside at the edge of a city. Sprawl consumes farmland, lengthens journeys, increases car dependence and congestion, and makes public transport expensive to provide. It also drained the inner city: as wealthier residents, shops and jobs moved out, inner areas lost tax revenue and services, which accelerated decline. In many US cities suburbanisation was racially selective (“white flight”), because discrimination in lending and housing kept many Black families in the inner city.
Suburbanisation is also widespread in MIC cities, in a different form. Wealthy households move to gated communities and planned new towns at the urban edge, linked to the city by motorways. Alphaville, founded in 1973 in Barueri, west of São Paulo, is a large set of gated residential estates with its own offices and shops; similar developments surround Cairo, Johannesburg and Lagos. Low-income suburban growth takes the form of informal settlements and large state housing estates on the periphery.
Counter-urbanisation is the net movement of people from urban areas to rural areas, beyond the city’s commuting edge. It became significant in the United States, the United Kingdom and other HICs from the 1970s, when some rural regions grew faster than the large cities for the first time.
Dislike of urban problems: congestion, pollution, crime, noise and high living costs.
Cheaper or more attractive housing in rural areas and small towns, and the image of a better rural quality of life.
Retirement migration to coasts and countryside, often to areas visited on holiday.
Better roads, rail and telecommunications, and the growth of remote working, which allow people to work for urban employers from rural homes.
Decentralisation of employment, as offices, factories and warehouses move to small towns and business parks.
Newcomers raise demand for rural housing, which pushes up house prices and can make it hard for young local people to stay. Many villages become a commuter settlement (or dormitory village), whose residents work in the city and are away during the day. Newcomers often shop and use services in town, so village shops, post offices, bus services and schools may close even as the population grows.
Second homes, empty for much of the year, raise prices further in attractive areas such as Cornwall and the English Lake District. The social structure changes as older, wealthier and more educated residents replace farming families, which can cause tension but also brings new skills and money.
The COVID-19 pandemic renewed counter-urbanisation in some HICs. During lockdowns many office workers worked from home, and some moved to small towns and rural areas, such as the “Zoom towns” of the US Mountain West or towns within reach of London. The trend is real but partial and possibly temporary: it involves mainly well-paid workers whose jobs can be done remotely, many employers have since required staff to return to offices for part of the week, and large cities such as London and New York regained population after 2021.
Settlements are not divided neatly into urban and rural. The urban–rural continuum is the idea that they form a gradient, from the dense CBD through inner city and suburbs to the urban fringe, commuter villages and remote countryside, with urban characteristics fading gradually outwards.
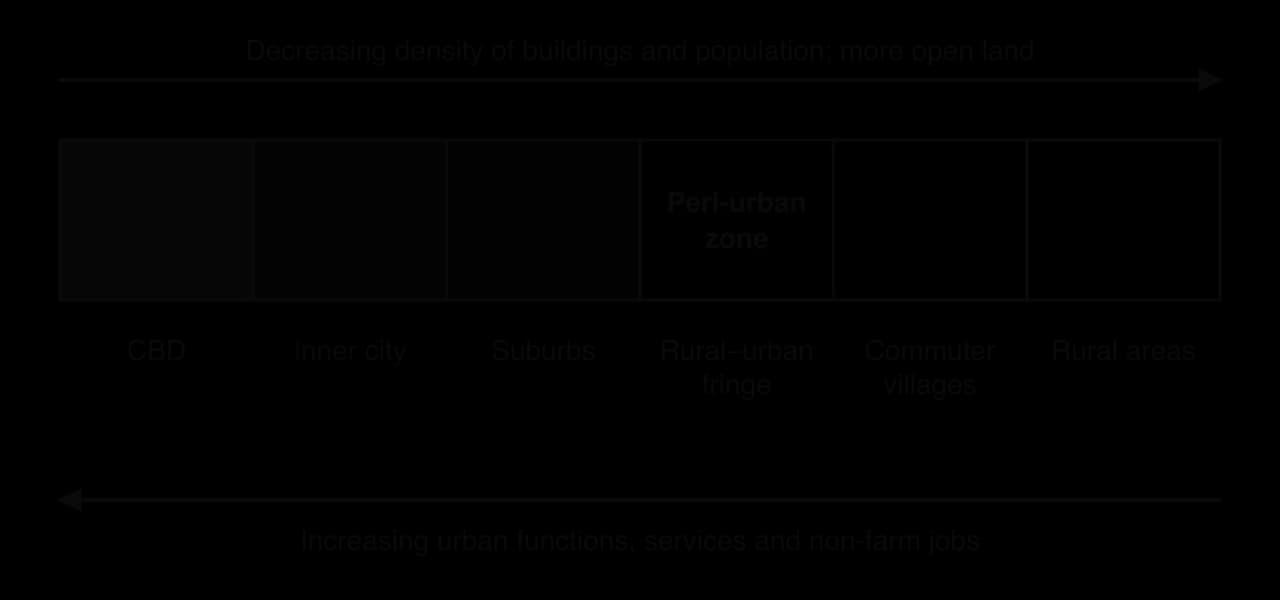
The rural–urban fringe is the zone at the edge of a built-up area where urban and rural land uses mix: farmland next to retail parks, golf courses, sewage works, airports, landfill sites and new housing estates. In many LIC and MIC cities this zone grows very fast through peri-urbanisation, the growth of urban populations and activities in a belt beyond the city’s formal boundary, where land is cheap and planning control weak.
Peri-urban areas are often where the fastest population growth in a city region now takes place.
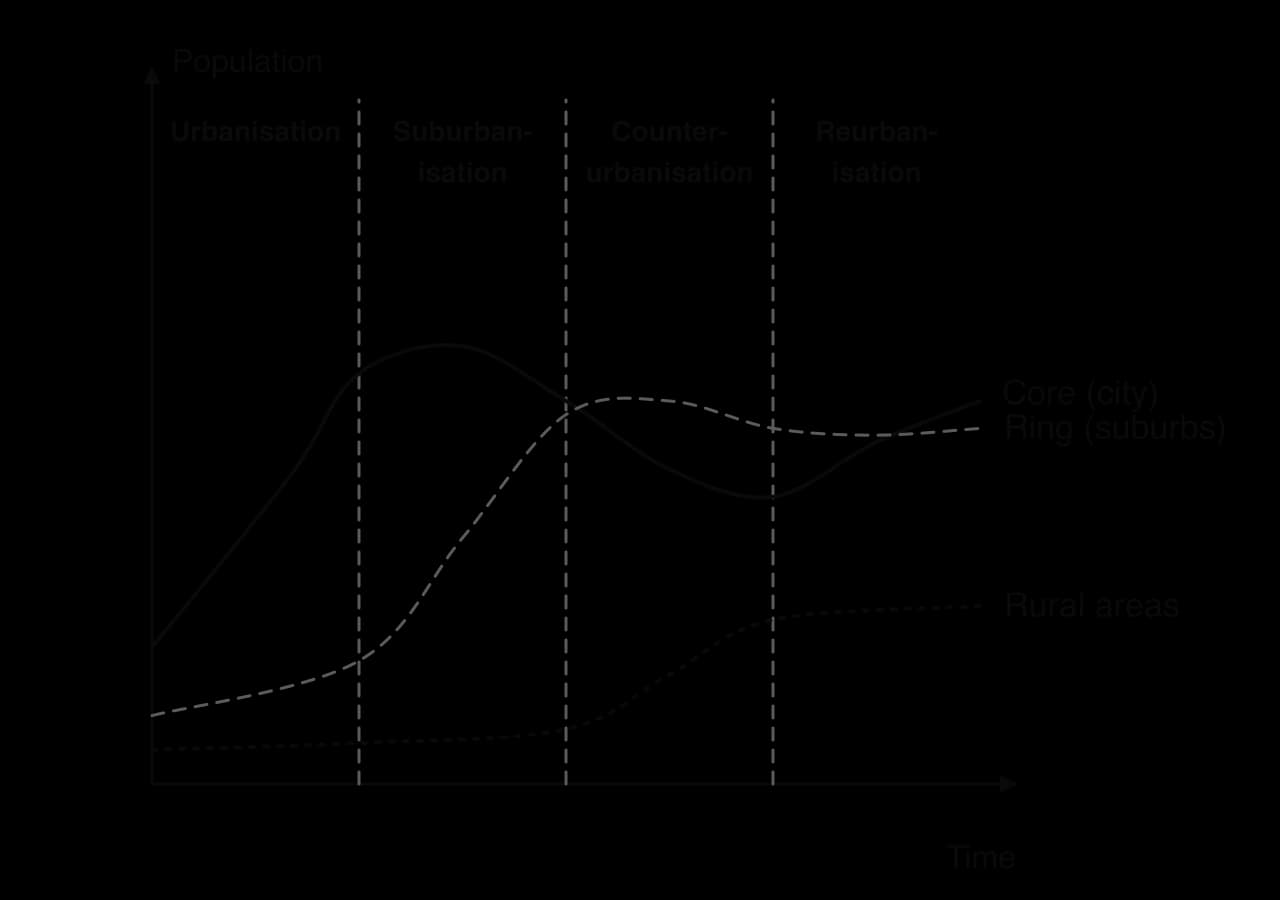
The stages of urbanisation model, set out by Leo van den Berg and colleagues in 1982 from studies of European cities, describes a sequence of change in a city region with a core (the city) and a ring (its suburbs and commuter belt):
Urbanisation: the core grows fast through rural–urban migration and industrialisation.
Suburbanisation: the ring grows faster than the core; the core’s population may start to fall.
Counter-urbanisation (also called desurbanisation): the core declines and the whole city region loses people to smaller towns and rural areas.
Reurbanisation: the core regains population through regeneration and gentrification.
Strengths | Limitations |
|---|---|
Describes the sequence in many HIC city regions, such as London, Manchester and Detroit, over the 20th century | Based on European cities; LIC and MIC cities may experience several stages at once (rapid urbanisation, elite suburbanisation and peri-urbanisation together) |
Links population change to transport, employment and housing | Not every city reaches counter-urbanisation or reurbanisation; shrinking cities such as Detroit may decline for decades |
Shows that urban change is cyclical, not one-way | The stages depend on government policy (green belts, regeneration), not only on a natural sequence |
The model is a useful description of the past experience of many HIC city regions but a poor predictor for others. Lagos or Dhaka are urbanising, suburbanising and peri-urbanising at the same time, and in cities such as London reurbanisation has coexisted with continued suburban growth.
A city can be studied as an urban system: a set of stores (buildings, people, reservoirs) linked by flows of people, goods, water, energy, waste and information, with inputs from outside and outputs to it. Like any system it has a boundary and feedback: congestion, pollution and shortages of water or housing slow growth, while new transport lines and pipes allow it to continue.
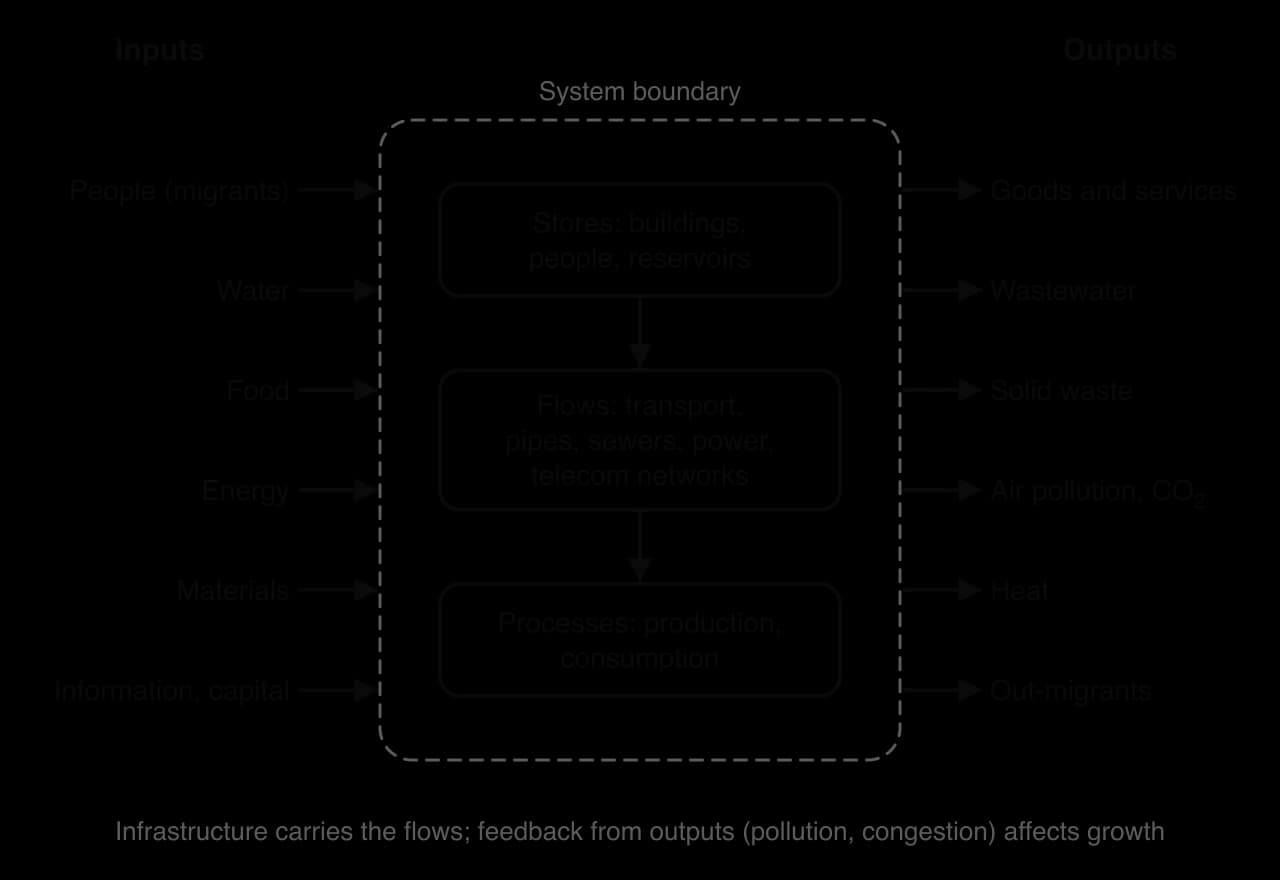
Infrastructure is the set of physical structures and networks a city needs to function: roads, railways, pipes, sewers, power lines, waste facilities and telecommunications. Infrastructure both serves and shapes growth. Suburban railways and motorways determine where new suburbs grow, and water supply and sewers control how densely people can live without disease.
Most infrastructure develops in similar stages as cities grow: informal or private provision (wells, carts, cesspits, private water sellers), then public utility networks built by city governments or companies, and later upgrading and smart management of the networks. At every stage there is a gap between rich and poor districts, and in many LIC and MIC cities informal settlements remain at the first stage while the CBD has the third.
Infrastructure | Early stage | Network stage | Later stage |
|---|---|---|---|
Transport | Walking city; horse-drawn carts and boats | Trams, suburban railways, metros; then roads, ring roads and motorways | Bus rapid transit, light rail, cycle networks, road pricing |
Sanitation | Cesspits, open drains, rivers used as sewers | Piped sewers and treatment works | Storage tunnels, separate storm drains, water reuse |
Water | Wells, rivers, water carriers and vendors | Reservoirs, treatment and piped supply to homes | Desalination, recycled wastewater, smart metering |
Waste disposal | Open dumping, burning; informal waste pickers | Collection services and engineered landfill | Recycling, composting, energy-from-waste incineration |
Telecommunications | Messengers, post | Telegraph, fixed telephone lines | Fibre broadband, mobile networks and mobile money |
The structure of a city reflects the transport available as it grew. Before the railway, cities were compact “walking cities” a few kilometres across. Trams and suburban railways from the mid-19th century let them spread along radial lines; London opened the world’s first underground railway in 1863. Mass car ownership after 1950 filled in the land between the lines and produced sprawl, ring roads and edge cities. Recent investment favours mass transit, high-capacity public transport such as metros, commuter rail and trams, because it moves far more people per unit of road space than cars. London’s Elizabeth line, opened in 2022, added a new east–west rail route across the city.
Bus rapid transit (BRT) is a cheaper alternative to a metro: high-frequency buses running on dedicated lanes, with stations where passengers pay before boarding. It was developed in Curitiba, Brazil, from 1974, and Bogotá’s TransMilenio, opened in 2000, made it famous; many cities in Asia and Africa have since built BRT lines. In Medellín, Colombia, transport was extended to hillside informal districts by cable car: Metrocable Line K, opened in 2004, linked comunas 1 and 2 to the metro, where residents had commuted more than 2.5 hours each way, and carries about 30,000 people a day.
Sanitation, the safe collection, removal and treatment of sewage, made the dense industrial city possible. In 19th-century London, sewage flowed into the Thames, the source of much of the city’s drinking water, and cholera epidemics killed tens of thousands. After the “Great Stink” of the hot summer of 1858, the engineer Joseph Bazalgette built a system of intercepting sewers between 1859 and 1875, designed for about four million people, which carried sewage downstream away from the city.
As London grew far beyond that size, its 57 overflows discharged sewage into the river after heavy rain. The 25 km Thames Tideway Tunnel, which intercepts 34 of the most polluting overflows, became fully operational in February 2025 at a cost of about £5 billion, more than 150 years after the system it upgrades.
Sources: Wikipedia, “Thames Tideway Tunnel”, citing Tideway and Thames Water, 2026.
Early cities drew water from wells, rivers and springs, and many poor households still buy it from vendors at prices far higher than piped water. Growing cities built reservoirs and treatment works and piped water to homes; very large cities now bring water from far away by canal and pipeline, recycle treated wastewater and, in dry coastal cities, desalinate seawater.
Mexico City, for example, pumps water about 1,100 m uphill from the reservoirs of the Cutzamala system, which supplies around 30% of its water, while over-pumping of the aquifer beneath the city has made the ground subside. Leaking pipes, illegal connections and unequal pricing mean that the poorest districts often have the least reliable supply.
Solid waste was first dumped in the open or burned. City authorities later organised collection and landfill, and more recently recycling, composting and energy-from-waste incineration, which burns waste to generate electricity. In many LIC and MIC cities informal waste pickers recover and sell recyclable materials from streets and dumps, providing a large share of the city’s recycling while working in dangerous conditions without protection. Some cities now work with them: in Pune, India, the waste pickers’ cooperative SWaCH collects household waste door to door under an agreement with the city government.
The telegraph and fixed telephone lines connected cities in the 19th and 20th centuries; fibre-optic broadband and mobile networks now carry most communication. Mobile networks allowed many LIC and MIC cities to skip the stage of fixed lines. In Kenya, M-Pesa, a mobile-phone money transfer service launched in 2007 by Safaricom and Vodafone, gave millions of people without bank accounts a way to pay bills, receive wages and send money to relatives. The gap between those with and without access to fast internet and digital devices, the digital divide, separates rich and poor districts within cities as well as between countries.
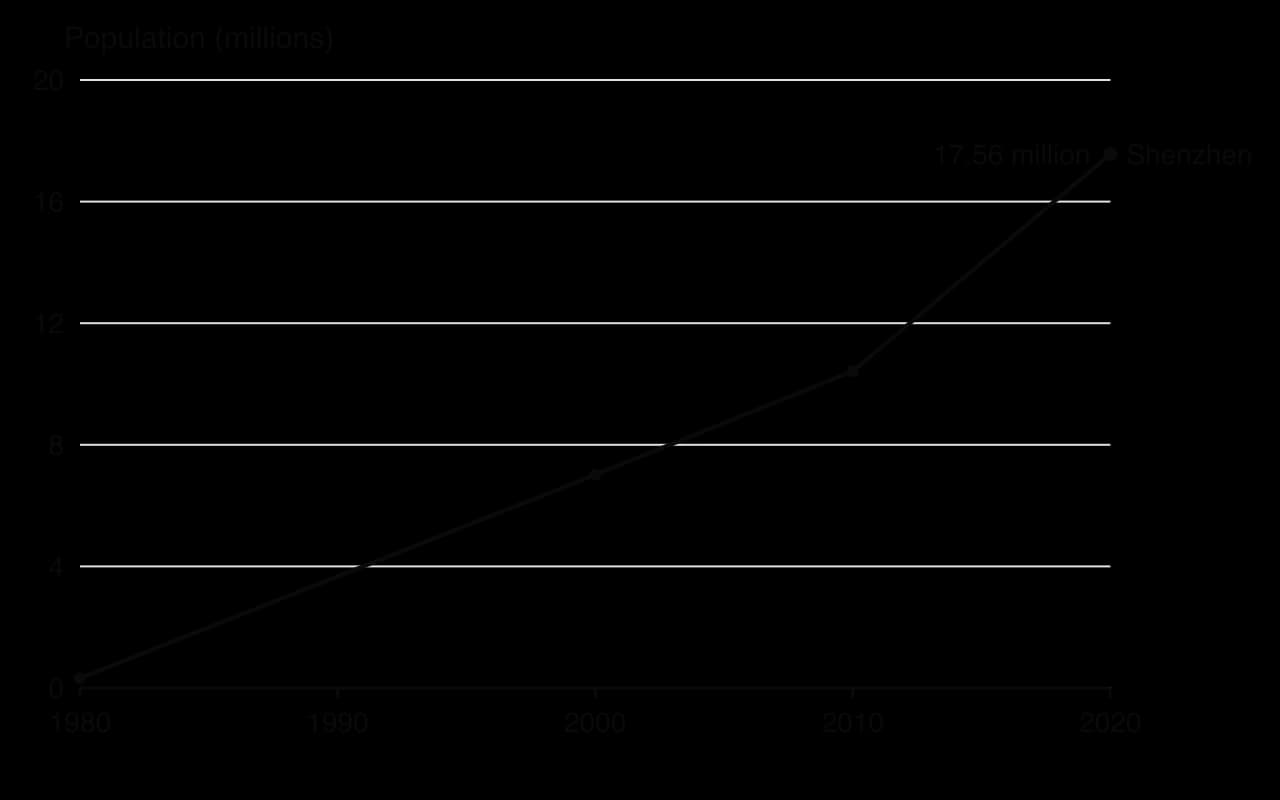
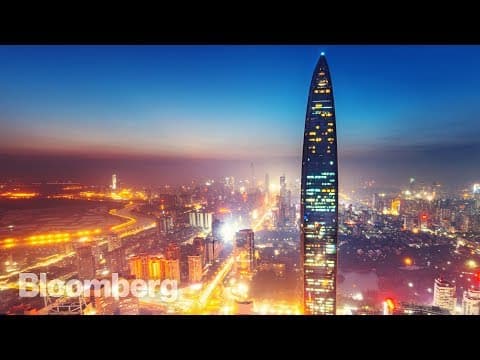
Shenzhen is a city on the east bank of the Pearl River estuary in Guangdong province, southern China, directly north of Hong Kong. In 1980, when the market town of Shenzhen had about 30,000 people and the whole area that now forms the city roughly 320,000, the Chinese government made it the country’s first special economic zone (SEZ), to test market reforms and attract foreign investment from Hong Kong. Factories making electronics, clothing and toys drew millions of migrants from across China.
At the 2020 census the city had 17.56 million residents, making it one of the fastest-growing cities in history and one of China’s leading technology centres, home to the headquarters of Huawei and Tencent.
 YouTube
Shenzhen began as a stop on the Kowloon–Canton railway at the border with Hong Kong. Bao’an International Airport opened in 1991 and has since added a second runway (2011), a new terminal (2013) and a third runway (2025). The Port of Shenzhen handled 25.77 million twenty-foot equivalent units (TEU, the standard container measure) in 2019, fourth in the world, with Yantian its busiest terminal. High-speed rail reached Futian in the city centre in 2015 and linked it to Hong Kong’s West Kowloon in 2018, a journey of 14 minutes. The Shenzhen–Zhongshan Link, a 49.7 km bridge–tunnel across the Pearl River estuary, opened on 30 June 2024.
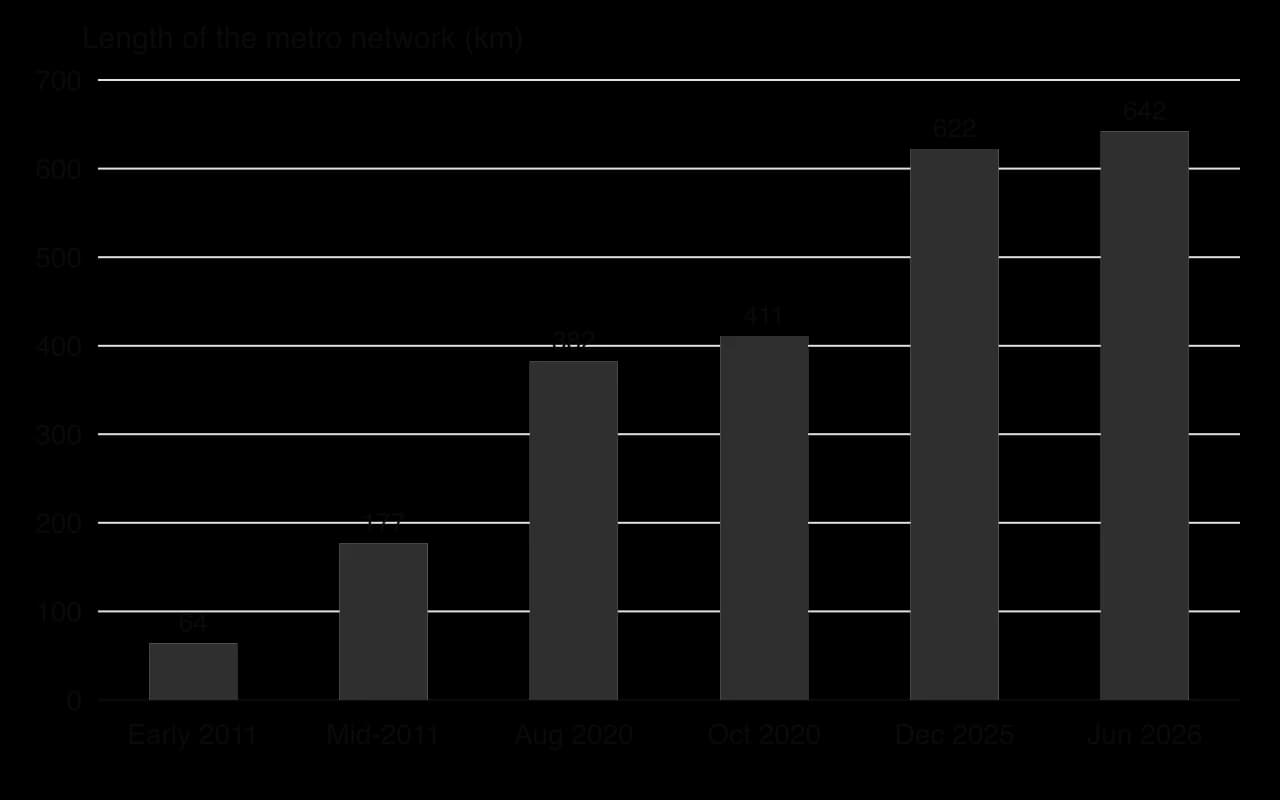
The metro is the clearest example of infrastructure catching up with growth. The first two lines opened on 28 December 2004, when the city already had more than 7 million people. Expansion was slow until the city prepared to host the 2011 Universiade, when the network grew from 64 km to 177 km in two weeks. By June 2026 it reached 642 km on 17 lines.
Surface transport has changed as well. In 2018 Shenzhen became the first major city with an all-electric public bus fleet, more than 16,000 vehicles by August 2019, and by January 2019, 99% of its taxis were electric.
Rapid industrial and population growth outran sanitation. By 2014, 173 of the city’s 310 rivers and channels were considered to be in “critical” condition from ammonia, phosphorus and nitrogen pollution. Between 2000 and 2014 the city spent 30 billion yuan restoring its rivers, building 33 sewage treatment plants and almost 4,300 km of sewers, and by 2020 it had laid a further 3,274 km of water pipes and completed 13,793 pipeline renovation projects in urban villages and housing estates. Its water is stored in 24 reservoirs within the city with a total capacity of 525 million tonnes.
In late 2019 Shenzhen introduced compulsory sorting of household waste into four categories (recyclables, kitchen waste, hazardous waste and other waste), with cash rewards for residents who comply and fines for those who do not. Its telecommunications grew with its technology industry: Huawei, one of the world’s largest makers of telecommunications equipment, and Tencent, owner of the messaging and payment app WeChat, are both based in the city, and most of its public transport can be paid for with phone-based QR codes.

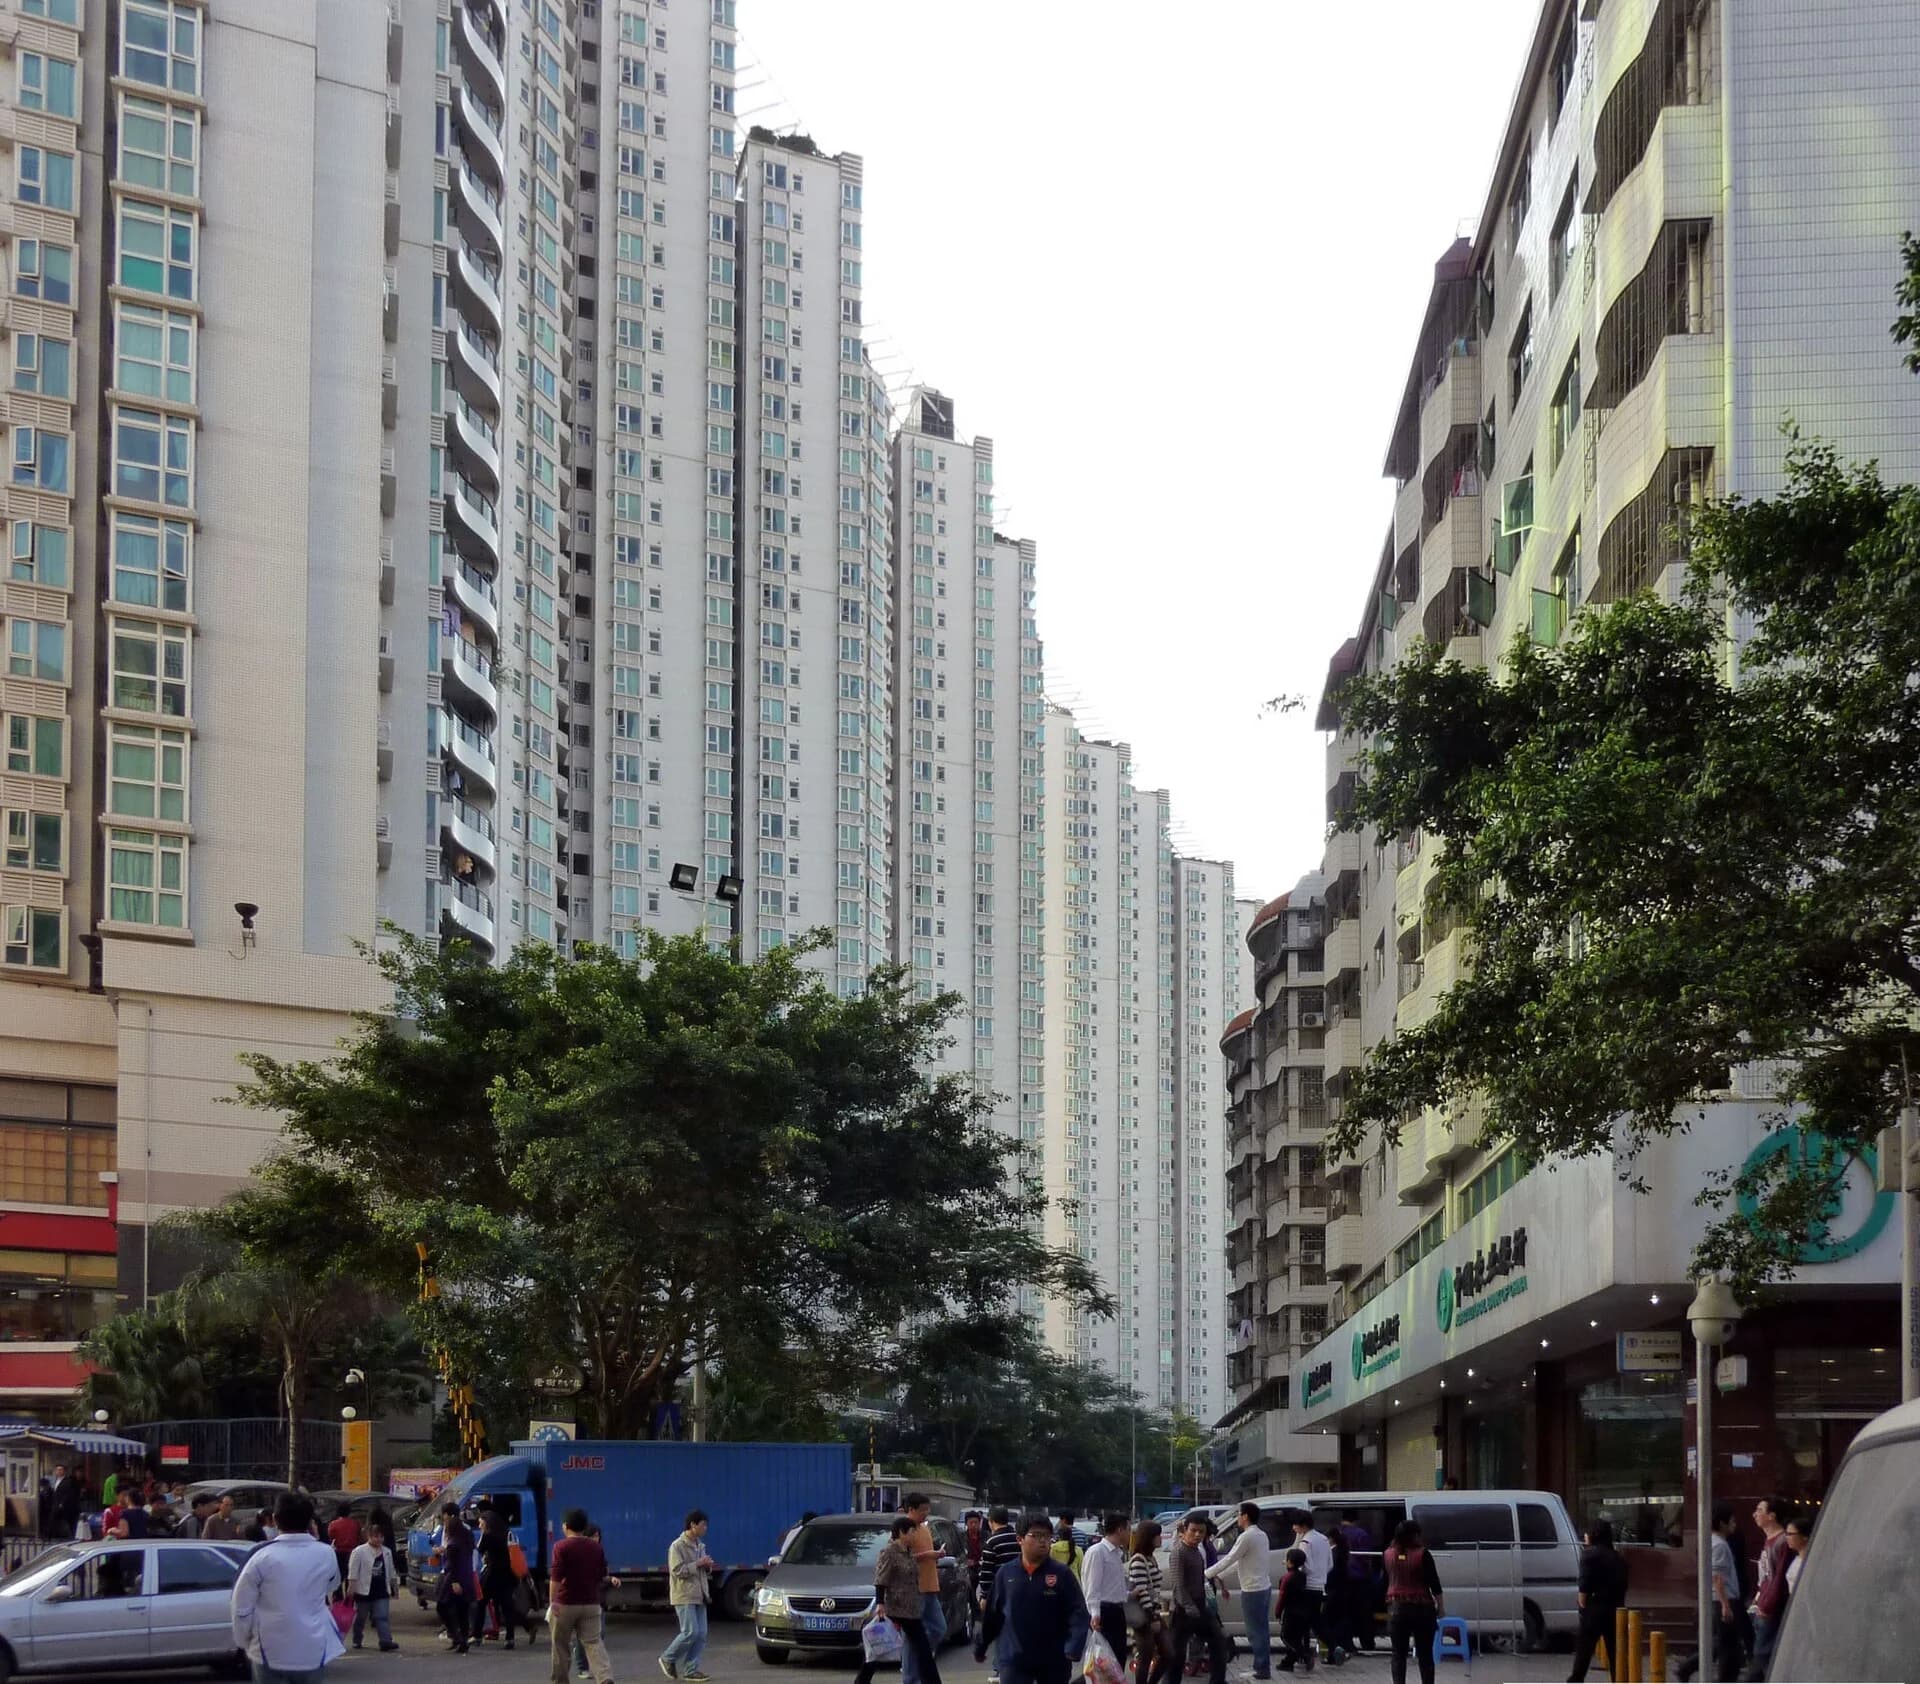
Infrastructure has not reached all residents equally. Most migrants live in urban villages (chengzhongcun): former farming villages that the city surrounded but did not redevelop, where villagers built dense rental blocks on their plots. Baishizhou, in Nanshan district, had about 150,000 residents on 0.6 km² in 2016, with 2,527 buildings containing about 50,000 rental rooms, close to metro stations and the city’s technology parks.
Urban villages provide the cheapest housing in Shenzhen, but their narrow lanes, “handshake” buildings and overloaded pipes were long poorly served, which is why many of the pipeline renovations after 2014 were in them. Redevelopment of Baishizhou was announced in 2014 and again in 2019, threatening the low-cost housing on which migrants depend.
Access to services also depends on registration. Only 33.4% of Shenzhen’s residents held a local hukou in 2020, and children without one have found it harder to gain places in public schools; in 2021 the city made it harder to obtain a hukou after its population passed its planning target.
Concept | Evidence from Shenzhen |
|---|---|
Process | Infrastructure followed growth with a lag: the metro opened 24 years after the SEZ, sewage treatment after rivers were badly polluted |
Power | National and city governments planned and financed the networks; hukou rules decide who gains full access to services |
Place | The location next to Hong Kong attracted investment, and the cross-border rail and road links reinforced it |
Possibility | Electric buses, waste sorting and an expanding metro show the city investing in lower-carbon systems; urban village redevelopment may displace migrants |
Sources: Wikipedia, “Shenzhen”, “Shenzhen Metro”, “Shenzhen Bao’an International Airport”, “Shenzhen–Zhongshan Link”, “Guangzhou–Shenzhen–Hong Kong Express Rail Link”, “Baishizhou” and “Urban village (China)”, 2026, citing the Shenzhen municipal government and the National Bureau of Statistics of China.
Describe the relationship between Shenzhen’s population growth and the timing of its metro construction.
Explain why sewage and river pollution became serious problems before infrastructure was improved.
To what extent have Shenzhen’s migrants benefited from the growth of its infrastructure?
Deindustrialisation is the long-term decline of manufacturing employment and output in a city, region or country. It transformed the industrial cities of Europe and North America from the 1960s and is now affecting some cities in middle-income countries too.
Economic activities are grouped into four sectors. The primary sector extracts raw materials from the natural environment (farming, fishing, forestry, mining). The secondary sector processes them into manufactured goods and includes construction. The tertiary sector provides services such as retail, transport, health care, education and tourism. The quaternary sector is the knowledge economy: research and development, information technology, finance and consultancy.
The four sectors differ in where they locate. Primary activities follow resources, secondary activities cluster near transport and labour, and tertiary and quaternary activities concentrate in cities, especially in CBDs and science parks.
Most urban employment in HICs is now in the last two.
The fourth sector is sometimes counted within the third, but its dependence on highly skilled labour and research gives it a distinct location pattern.
The Clark–Fisher model, developed by Allan Fisher (1935) and Colin Clark (1940), describes how the share of employment in each sector changes as an economy develops. In a pre-industrial economy most people work in the primary sector. Industrialisation moves workers into factories, so the secondary sector grows. In a post-industrial economy services dominate, and the secondary sector declines as a share of jobs, which is deindustrialisation.
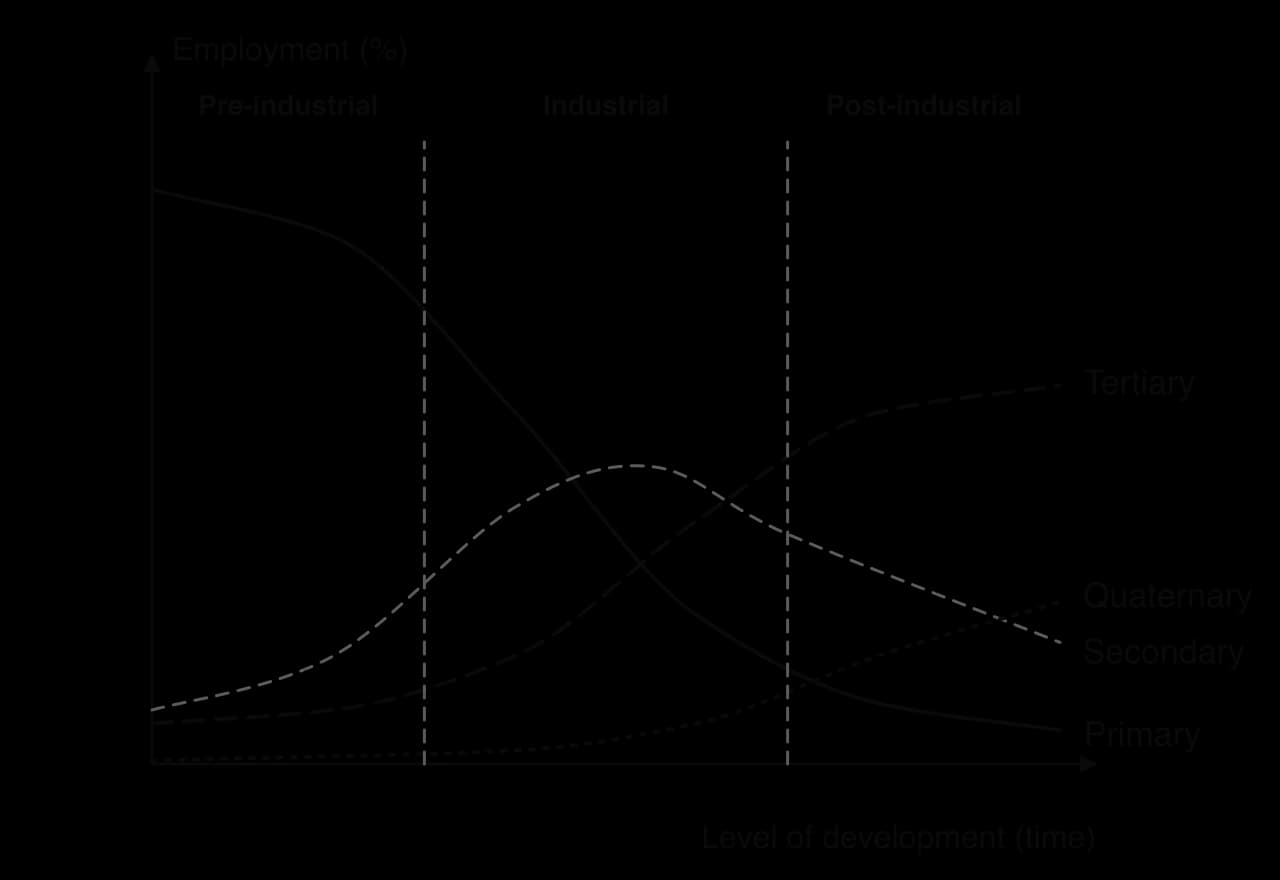
Real data from two countries at different stages fit the model closely. The UK, a post-industrial economy, has deindustrialised steadily, while China is still industrialising.
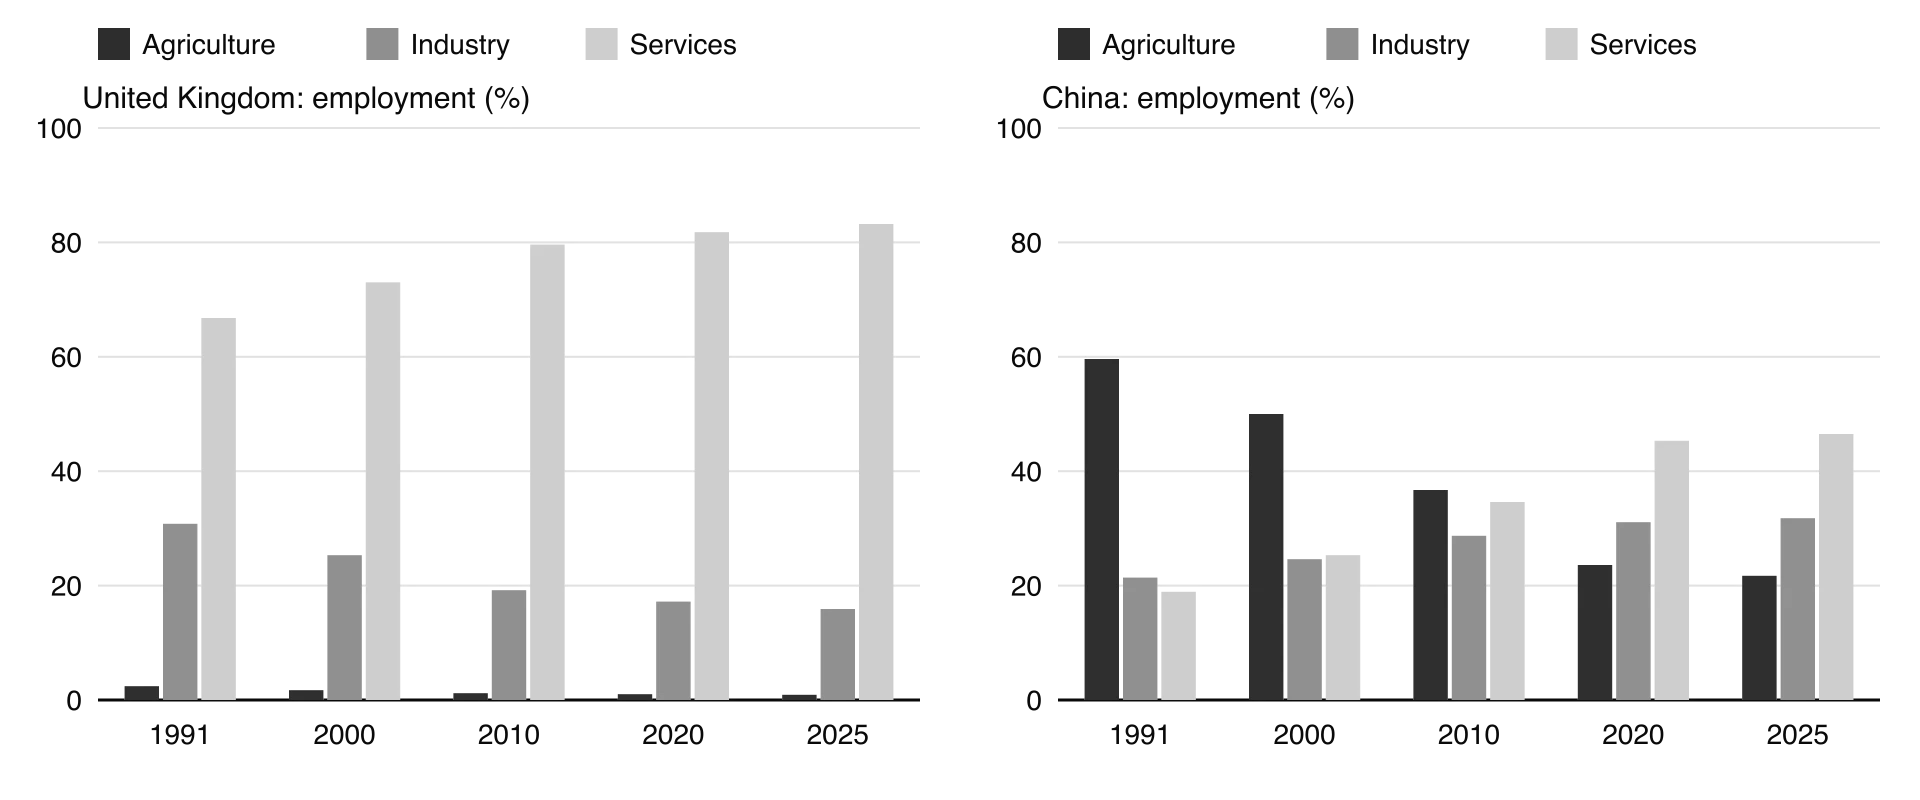
The model describes the sequence followed by Britain, the United States and Japan, and explains why cities in post-industrial economies have lost factory jobs while gaining service jobs. It is a description of past change, however, and not every country follows it: some move from farming directly into services (India’s growth has relied heavily on services), and the model does not explain where in the world the factory jobs went, which is the role of the global shift.
The global shift. From the 1960s manufacturing moved from HICs to newly industrialising countries with lower wages, first in East Asia and later China, South-east Asia and Mexico. This global shift created a new international division of labour, in which design, finance and management stay in HICs while assembly is done in lower-cost countries. Transnational corporations drove it through offshoring, moving their own production overseas.
Automation and productivity. Machines and robots raised output per worker, so factories needed far fewer workers even where production continued.
Decline of old industries. Competition, new materials and changing demand reduced coal mining, steelmaking, shipbuilding and textiles, the industries that had built cities such as Glasgow, Sheffield, Pittsburgh and Detroit.
Containerisation. From the 1950s goods were shipped in standard steel containers that needed large deep-water terminals with cranes and space for storage. Old city-centre docks could not handle them, and port activity moved downstream: London’s docks closed between the 1960s and 1980 and trade moved to Tilbury and other deep-water ports.
High urban costs. Inner-city sites were cramped, congested and expensive, with high wages and old buildings.
Decentralisation. Firms that remained moved to greenfield sites at the urban edge or in small towns, with cheap land, motorway access and room to expand.
Government policy. In 1980s Britain, privatisation and the withdrawal of subsidies led to rapid closures of coal mines, steelworks and shipyards.
Containerisation shows how a change in technology can remove a city’s economic base.
Firms that stay often choose new sites outside the city rather than old inner-city premises.
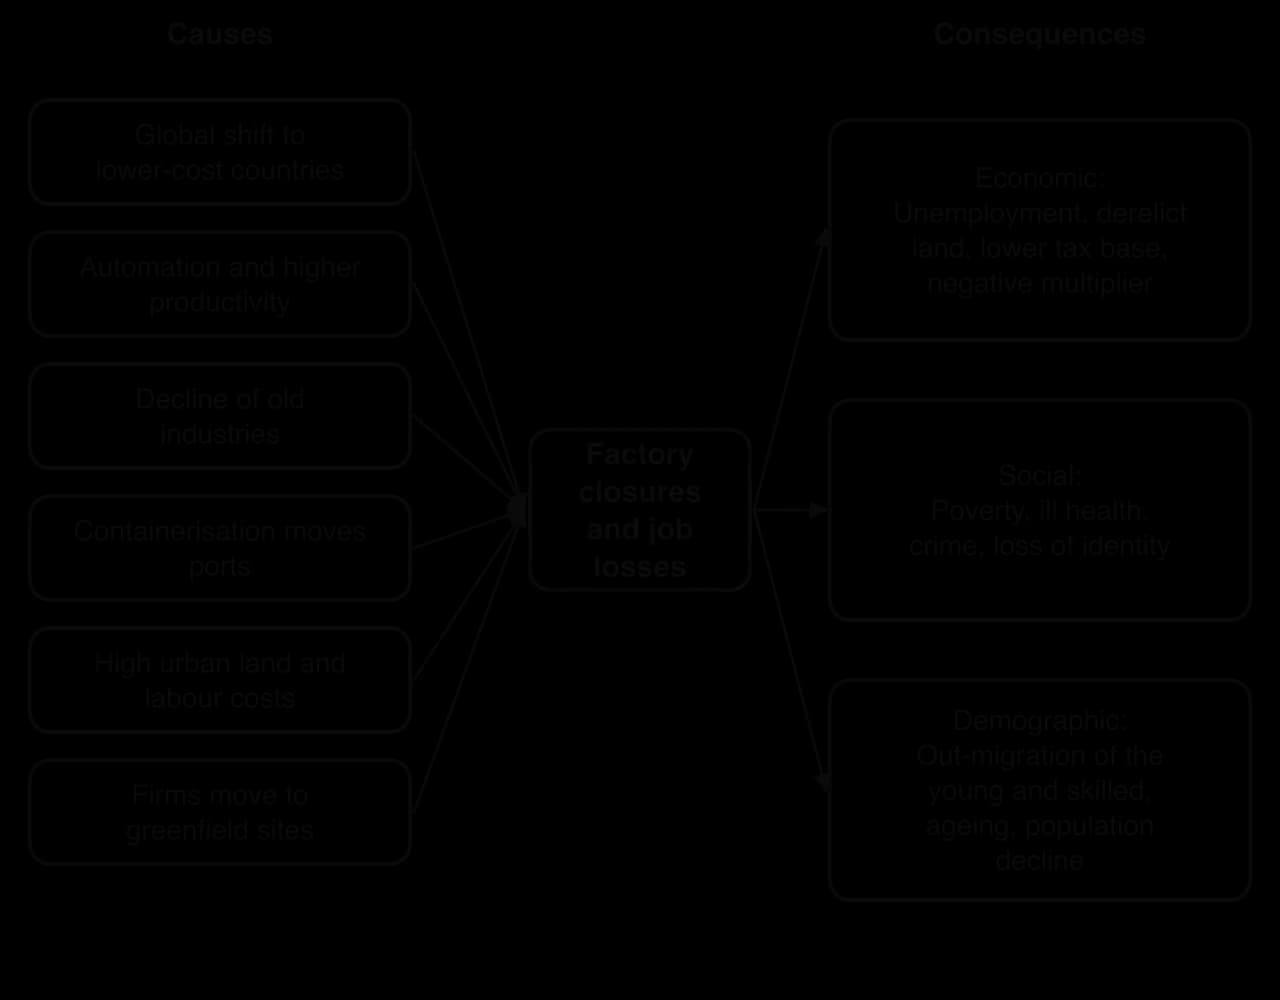
Type | Consequences |
|---|---|
Economic | Unemployment, especially of male manual workers; derelict factories and brownfield sites; a falling tax base and city budget crises; a negative multiplier effect as suppliers, shops and services close; growth of lower-paid service work |
Social | Poverty and deprivation concentrated in former industrial districts; poor health and lower life expectancy; crime and drug use; family stress; loss of community identity built around a works or a pit; a sense of being “left behind”, which has influenced voting |
Demographic | Out-migration of young and skilled people to growing cities; an ageing population left behind; falling birth rates; population decline and vacant housing |
A shrinking city is one that has lost a large share of its population over a long period, usually through deindustrialisation and out-migration. Shrinking cities are found in the US Rust Belt, the old manufacturing region around the Great Lakes and the north-east (Detroit, Cleveland, Pittsburgh, Buffalo); in northern England; in eastern Germany after reunification in 1990, where Leipzig lost a large part of its population before growing again in the 2000s; and in former heavy-industry cities of north-east China.
The best-known group of shrinking cities is in the United States.
Detroit, on the Detroit River in Michigan, became the world centre of the car industry in the early 20th century: Henry Ford introduced the moving assembly line there in 1913, and by 1920 the city’s carmakers produced about half of the world’s cars. Its population peaked at 1.85 million in 1950. From the 1950s carmakers moved production to suburban and southern plants and later abroad, automation cut jobs, and competition from Japanese and European cars grew. Wealthier residents and businesses followed the jobs to the suburbs, a process deepened by racial discrimination in housing.
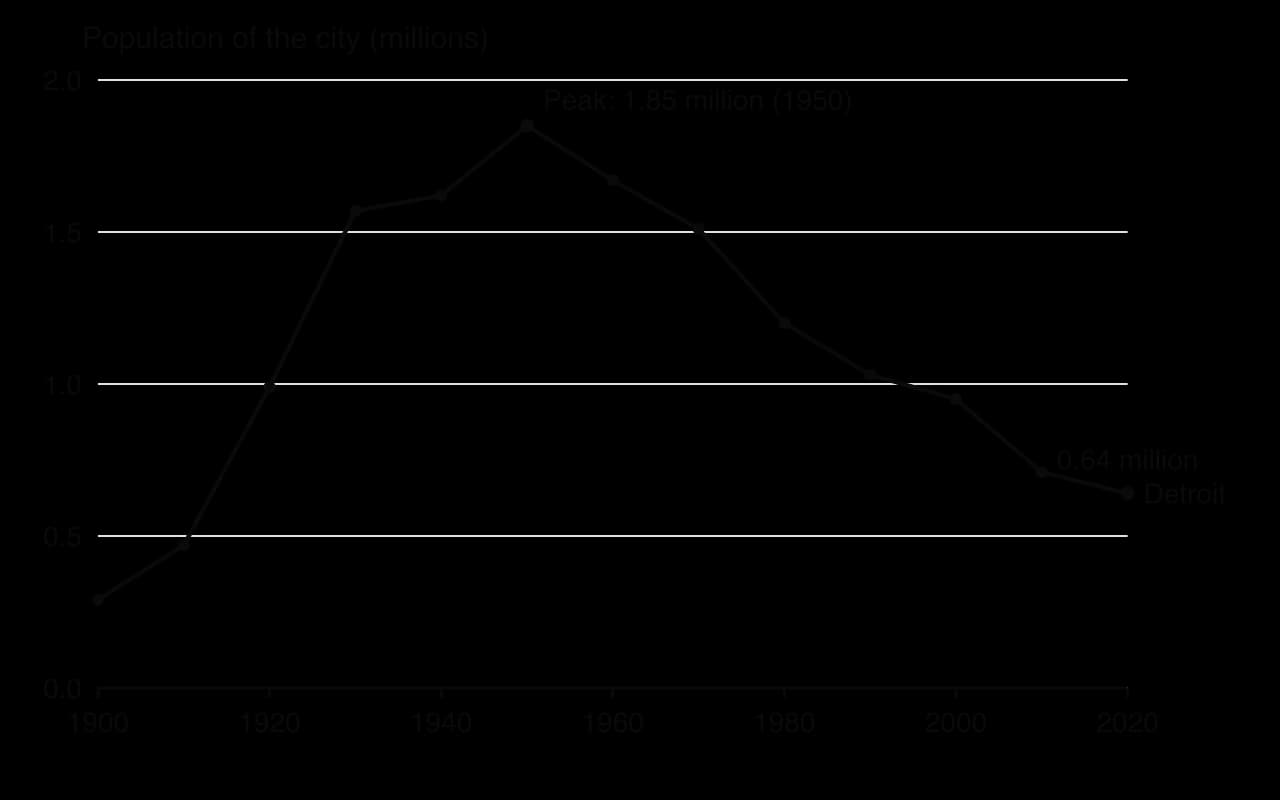
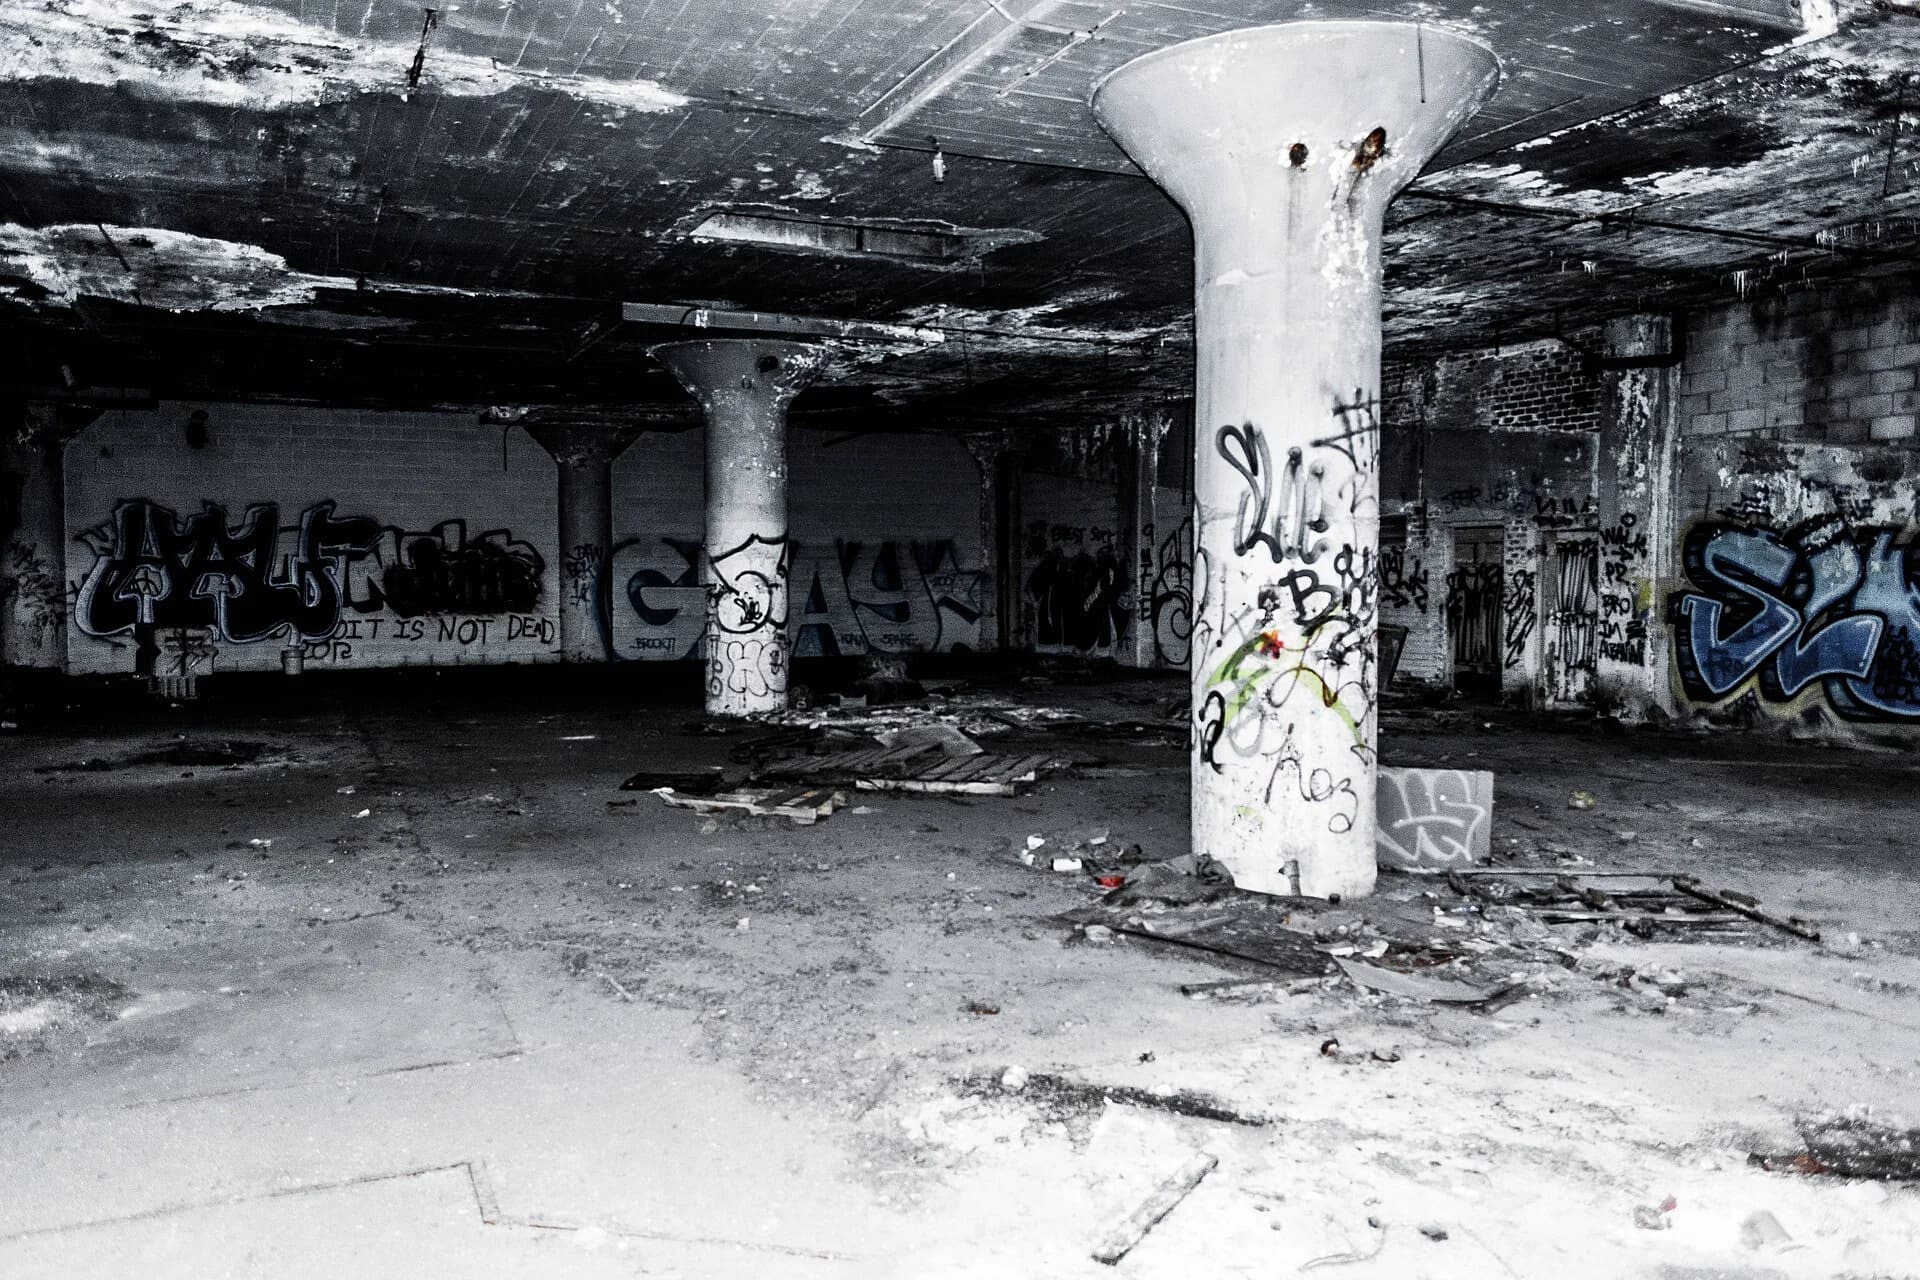
Detroit shows economic, social and demographic consequences together. By 2013 the city faced more than US$18 billion of long-term debt and liabilities, and on 18 July 2013 it became the largest US city to file for bankruptcy, exiting in 2014. Tens of thousands of vacant houses and derelict factories such as the Packard plant, which closed in the 1950s, became brownfield land. Detroit remains one of the poorest large cities in the United States. After decades of decline, Census Bureau estimates show its population growing in 2024 and again in 2025, the first increases since the 1950s, helped by investment downtown.
Sources: Wikipedia, “Detroit”, citing the US Census Bureau and the Detroit News, 2026.
Regeneration is the improvement of a declining area through investment in its economy, buildings, environment and community. London Docklands was redeveloped by the London Docklands Development Corporation from 1981, which turned the former docks into Canary Wharf’s offices and new housing but was criticised for favouring luxury developments over local residents. Bilbao in Spain used the Guggenheim Museum, opened in 1997, as a flagship to rebrand a former steel and shipbuilding city. Who benefits from such schemes, and whether existing residents are displaced, is the central question in debates about urban redevelopment.
Paper 1 questions on changing urban systems often show a population graph, a flow map of migration, a table of employment by sector or a photograph of an inner-city or suburban area, followed by an extended response on one of the four movements, infrastructure or deindustrialisation.
Population and employment data are common stimuli.
The stimulus is the line graph of Detroit’s population at each census, 1900–2020.
Urbanisation is a rise in the urban share of the population; urban growth is a rise in the number of urban residents, from natural increase, net in-migration and reclassification.
Centripetal movements (rural–urban migration, gentrification, reurbanisation) are towards the centre; centrifugal movements (suburbanisation, counter-urbanisation) are away from it.
Rural–urban migration to industrialising cities often happens in steps and chains, and responds to expected income (Todaro); in China it is shaped by the hukou system.
Gentrification, driven by the rent gap, new service jobs and changing households, renovates inner-city areas but often displaces existing residents.
Suburbanisation, driven by transport and housing finance, causes sprawl and inner-city decline; counter-urbanisation changes rural housing markets and services.
Settlements form an urban–rural continuum; the stages of urbanisation model fits many HIC city regions but not fast-growing LIC and MIC cities.
Cities are systems whose growth depends on infrastructure for transport, sanitation, water, waste and telecommunications, with gaps between rich and poor districts.
Shenzhen grew from roughly 320,000 people in 1980 (about 30,000 in the original town) to 17.56 million in 2020; its metro, sewers and waste systems followed growth with a lag, and migrants in urban villages benefit least.
Deindustrialisation, caused by the global shift, automation, containerisation and high urban costs, follows the Clark–Fisher sector shift.
Its consequences are economic, social and demographic, as in Detroit, whose population fell 65% from 1950 to 2020.
I can distinguish urbanisation from urban growth and determine the contributions of natural increase and migration.
I can distinguish centripetal from centrifugal movements, with an example of each.
I can explain rural–urban migration in industrialising cities, including step and chain migration and the hukou system.
I can explain the causes, stages and consequences of gentrification and evaluate who gains and who loses.
I can explain the causes and consequences of suburbanisation and counter-urbanisation.
I can describe the urban–rural continuum and evaluate the stages of urbanisation model.
I can explain how infrastructure develops as an urban system grows, using Shenzhen.
I can explain the causes of deindustrialisation and its consequences, using the Clark–Fisher model and Detroit.
Political and economic decisions can override both: capital cities and planned cities such as Brasília or Abuja grew because of government decisions rather than an advantageous site or situation.
Site can become a hazard as cities grow, for example building on floodplains or deltas (eg Dhaka, Jakarta) where subsidence and flooding now threaten growth.
Good answers may be well structured (AO4) and may additionally offer a critical evaluation (AO3) which recognizes that site usually explains why a settlement began in a particular place, while situation usually explains why it grew into a large city. Another approach might be to argue that the importance of each changes over time (the defensive value of a hilltop site is now irrelevant, while a coastal situation has become more important with globalization), or that neither is as important as human factors such as government investment, industrialization or connectivity. Annotated sketch maps of a city's site may be credited.
For 5–6 marks, expect some weakly-evidenced outlining of site and/or situation factors for at least one city.
For 7–8 marks, expect a structured account which includes:
either well-evidenced explanation of the role of both site and situation in the growth of one or more named cities
or a discursive conclusion (or ongoing evaluation) grounded in geographical concepts and/or perspectives, such as how the importance of site and situation changes over time.
For 9–10 marks, expect both of these traits.
NB. Maximum [5] if no named city is used. Maximum [6] if only site or only situation is addressed.
Marks | Level descriptor |
|---|---|
0 | The response does not reach a standard described by the descriptors below. |
1–2 | Too brief, lists unconnected information, not focused on the question and lacks structure. Knowledge is very general, with large gaps or errors; examples or case studies are missing or only listed. No analysis; terminology is missing or used incorrectly. |
3–4 | Too general, lacks detail, not focused on the question and largely unstructured. Outlines examples, statistics and facts, both relevant and irrelevant, with links to the question only listed. Basic terminology is used, with errors or inconsistently. No critical evaluation of evidence; any conclusion is irrelevant. |
5–6 | Partially addresses the question, with a narrow argument, an unsubstantiated conclusion and limited evaluation. Describes relevant supporting evidence (examples, case studies) and outlines links to the question. The argument repeats one point or covers only part of the question. Other perspectives, or strengths and weaknesses of evidence, are listed. |
7–8 | Addresses the whole question; the analysis is evaluated and the conclusion is relevant but lacks balance. Relevant evidence is described correctly and covers all the main points. The argument is clear but one-sided or unbalanced. Complex terminology is used correctly but not consistently. Other perspectives, or strengths and weaknesses of evidence, are described. |
9–10 | In-depth and specific to the question (topic and command term). Correct, relevant examples, statistics and detail are integrated and their link to the question explained. The argument is balanced, explaining complexity, exceptions and comparisons. Evaluation of evidence and perspectives is well developed, and the conclusion is balanced and aligned with the evidence. Logically structured and easy to follow. |
Examine how the functions of urban places influence their land use.
10 marks
Examine the relative importance of land values and planning in determining the location of retail activities within urban areas.
10 marks