Notes on 4.1 Global interactions and global power
Learning objectives
Describe what globalisation indices measure, and compare how countries participate in global interactions using the KOF Globalisation Index and the DHL Global Connectedness Report.
Evaluate the strengths and limitations of globalisation indices as measures of participation in global interactions.
Explain what makes a country a superpower, distinguishing economic, geopolitical and cultural influence and hard, soft and smart power.
Examine how the distribution of global power has changed from a bipolar to a unipolar and a more multipolar world.
Compare the influence of actual and potential superpowers, using the USA and China as detailed examples.
Analyse the influence of the G7/8, the G20 and the OECD, and evaluate how far they represent the world.
Explain how OPEC and OPEC+ influence oil prices and the energy policies of importing countries.
Evaluate the role of global lending institutions, including the IMF, the World Bank and the New Development Bank.
Introduction
Countries take part in the global economy and in world politics to very different degrees, and a few of them, together with some powerful groups and institutions, shape the rules that everyone else follows. Geographers therefore ask how participation in global interactions can be measured, which places hold power and influence, and how that power is changing.
Power is the central concept: the ability of a state, group or institution to influence what others do. Power is also a matter of place and scale, because it is held by superpowers at the global scale, by regional powers and global cities at smaller scales, and by groups of states acting together. The topic builds on globalisation, transnational corporations, the income classification of countries and geopolitics from the core, and leads into the study of global flows and networks.
Global interactions and interdependence
Global interactions are the flows and connections between places around the world: trade in goods and services, investment, migration, tourism, the exchange of information and ideas, and political co-operation through treaties and organisations. They have grown rapidly since the 1980s, helped by cheaper transport, the internet and the opening of economies such as China and India to trade and investment.
Global interactions are a two-way process. Places do not simply receive goods, investment and culture from richer countries: they also adopt some of them, adapt others to local conditions and resist others. Flows run in many directions: Chinese and Indian companies invest in Europe and Africa, Korean pop music and Indian films reach world audiences, and migrants send money home to lower-income countries. Participation is also uneven, so that some places are deeply connected while others take part very little.
The more places interact, the more they depend on one another. Interdependence is the mutual dependence of places and countries, in which events or decisions in one place affect the economy, security or society of others. The 2008 financial crisis, which began in the US housing market and spread to banks and economies worldwide, and the shortages of computer chips during the COVID-19 pandemic both showed how interdependence transmits shocks between places.
Measuring participation: globalisation indices
Because global interactions take so many forms, no single statistic shows how far a country takes part in them. A globalisation index combines many indicators, such as trade, investment, migration, internet use and membership of international organisations, into one score so that countries can be ranked and compared over time.
The KOF Globalisation Index
The KOF Globalisation Index, published by the KOF Swiss Economic Institute at ETH Zürich, scores almost every country from 0 to 100 every year since 1970. It has three dimensions, each built from several variables:
Dimension | What it covers | Examples of variables |
|---|---|---|
Economic globalisation | Trade and financial flows and the rules that govern them | Trade as % of GDP; foreign direct investment; tariff rates; capital account openness |
Social globalisation | Personal, information and cultural flows | International phone traffic and tourism; migrants; internet access; trade in cultural goods; number of McDonald’s restaurants and IKEA stores |
Political globalisation | Participation in international politics | Embassies; membership of international organisations; UN peacekeeping missions; international treaties signed |
The index also separates de facto globalisation (actual flows, such as the value of trade) from de jure globalisation (the policies and conditions that allow flows, such as low tariffs or treaties signed). A country can be open by law but receive little trade because it is remote or poor, or trade heavily despite restrictions.
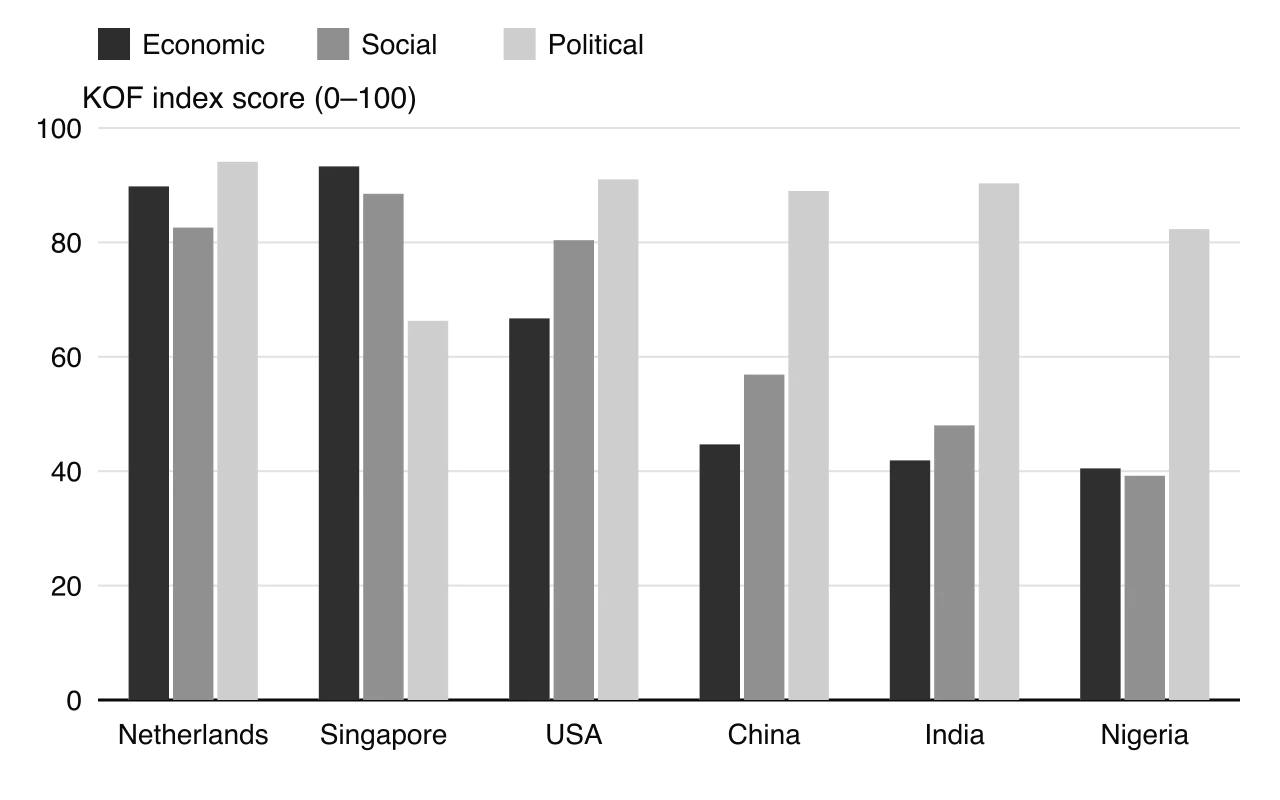
Rank (of 207) | Country | Overall KOF index | Economic | Social | Political |
|---|---|---|---|---|---|
1 | Netherlands | 88.9 | 89.8 | 82.6 | 94.1 |
2 | Switzerland | 88.7 | 87.0 | 85.2 | 93.9 |
3 | Belgium | 88.5 | 88.3 | 82.2 | 94.9 |
4 | United Kingdom | 87.5 | 81.2 | 84.4 | 96.7 |
17 | Singapore | 82.7 | 93.3 | 88.5 | 66.3 |
28 | United States | 79.4 | 66.7 | 80.4 | 91.0 |
74 | Russia | 65.7 | 43.0 | 63.1 | 91.0 |
85 | China | 63.5 | 44.7 | 56.9 | 89.0 |
Sources: KOF Swiss Economic Institute, KOF Globalisation Index 2025 (data for 2023), published December 2025; ranks calculated from the dataset.
Patterns shown by the index
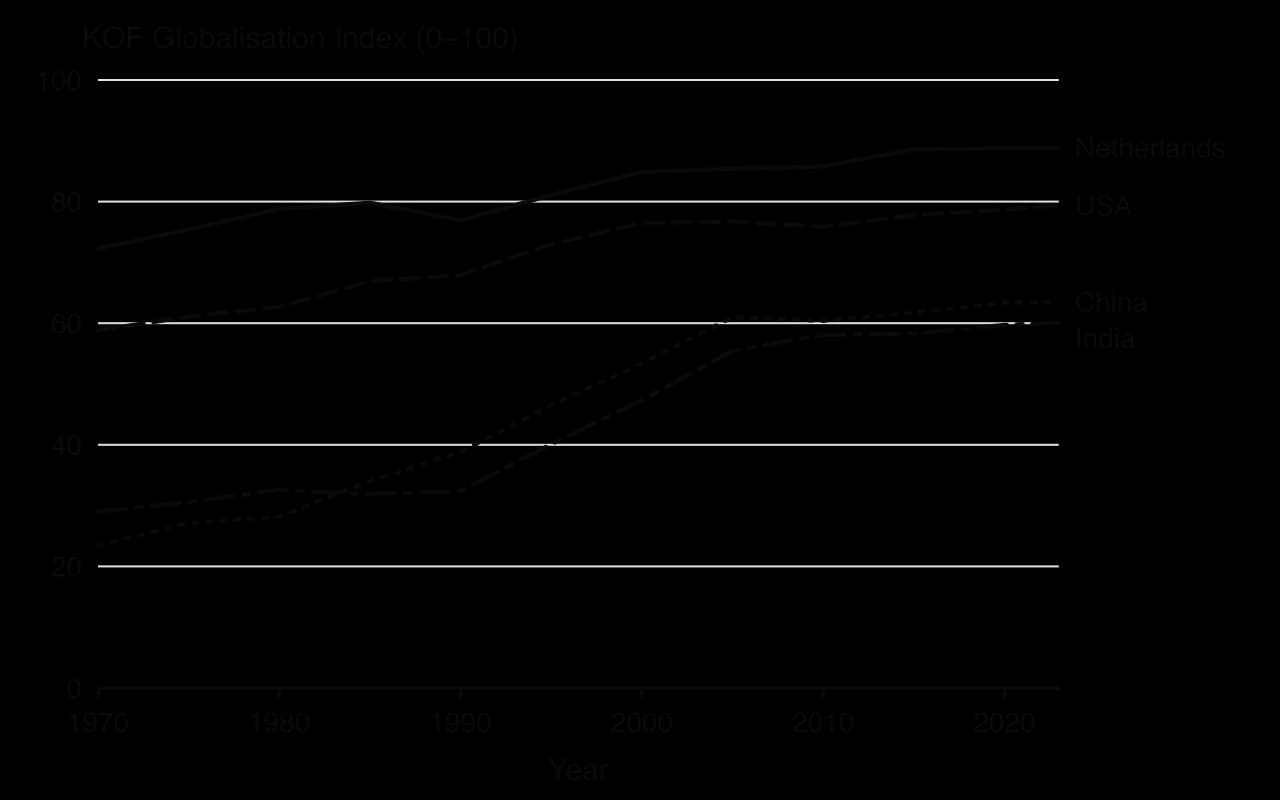
Three patterns stand out. First, the most globalised countries are small, wealthy, open European economies, such as the Netherlands, Switzerland and Belgium, which trade a large share of what they produce and host many international organisations and firms. Second, large economies score lower on economic globalisation, because a big domestic market means that trade is a smaller share of their gross domestic product (GDP): the USA ranks only 28th overall and China 85th, even though both are among the largest traders in the world in absolute terms.
Third, the least globalised countries are mostly low-income, landlocked or affected by conflict, such as Somalia, Eritrea, Afghanistan and the Central African Republic, which have little trade and investment, poor communications and weak links with international organisations. Almost all countries score highly on political globalisation, because nearly every state belongs to the UN and many other bodies, so this dimension separates countries less than the economic and social ones.
The DHL Global Connectedness Report
The DHL Global Connectedness Report, produced with New York University’s Stern School of Business, measures four kinds of flows: trade, capital, information and people. It scores each country on two aspects. Depth is the size of a country’s international flows compared with its domestic activity (for example, exports as a share of GDP). Breadth is how widely those flows are spread across the world, rather than concentrated on a few neighbours.
Singapore ranked first in the 2024 report, followed by the Netherlands and Ireland, and remained first in the 2026 edition. The 2026 edition estimated the world’s overall depth of globalisation in 2025 at 25%, equal to the record first reached in 2022, meaning that about a quarter of all economic activity crosses borders. Europe was the most connected region. An older measure, the A.T. Kearney/Foreign Policy Globalization Index, was published in the 2000s and helped to popularise the idea of ranking countries.
Sources: DHL and NYU Stern, Global Connectedness Report 2024 and 2026.
Evaluating globalisation indices
Strengths | Limitations |
|---|---|
Combine many kinds of flows into one comparable number | The choice and weighting of variables are value judgments: a different mix gives a different ranking |
Allow change over time to be tracked (KOF from 1970) | Data for low-income and conflict-affected countries are incomplete or estimated |
Separate dimensions, so that economic, social and political links can be compared | Relative measures (trade as % of GDP) favour small countries and understate large ones |
De facto and de jure measures show whether openness is real or only on paper | Illegal and informal flows (smuggling, informal remittances) are not captured |
Breadth measures (DHL) show whether a country is connected globally or only regionally | A national score hides huge differences within countries, between global cities and remote rural areas |
A single score hides the direction of flows and who controls them, so it shows participation, not power |
Indices are useful for comparing broad patterns and for showing that globalisation has grown and then levelled off since about 2010. They measure participation, not power, however: the USA and China rank below Belgium and Singapore, yet they shape the global economy far more. Their results also depend on choices about what to count. Indices are therefore best used alongside other evidence, such as absolute values of trade and investment and the membership of powerful groups.
Superpowers and the bases of power
A superpower is a state, or a union of states such as the European Union, that can project power and influence across the whole world, not only in its own region. The term was first used in 1944 by the American political scientist William Fox for the United States, the Soviet Union and the British Empire. After the decline of the British Empire, it described the two rivals of the Cold War: the USA and the Soviet Union.
Power rests on several bases. A superpower is strong in all or most of them at once, while a great power or regional power is strong in some, or only within its own region. Brazil in South America, Saudi Arabia in the Middle East and Nigeria in West Africa are examples of regional powers.
Basis of power | What it includes | Examples of indicators |
|---|---|---|
Economic | Size and wealth of the economy; trade; investment; control of finance and currency; technology | GDP; share of world exports; outward FDI; share of the currency in world reserves; leading firms |
Geopolitical and military | Armed forces able to act far from home; alliances; nuclear weapons; diplomatic weight | Military spending; overseas bases; aircraft carriers; permanent seat on the UN Security Council; membership of alliances such as NATO |
Cultural | The attraction of a country’s culture, values, language, media, universities and brands | Film, music and media audiences; international students; use of the language; global brands |
Demographic and physical | Population, land area and natural resources that support the other bases | Population; working-age share; energy and mineral reserves; food production |
Power is also held at scales other than the nation state. Global cities such as London, New York and Shanghai concentrate finance, company headquarters and media, and so influence the world economy far more than their size suggests. The largest transnational corporations have revenues larger than the GDP of many countries and shape where investment and jobs go. Groups of states acting together, such as the G7 or OPEC, can hold more power than any one of their members.
Hard, soft and smart power
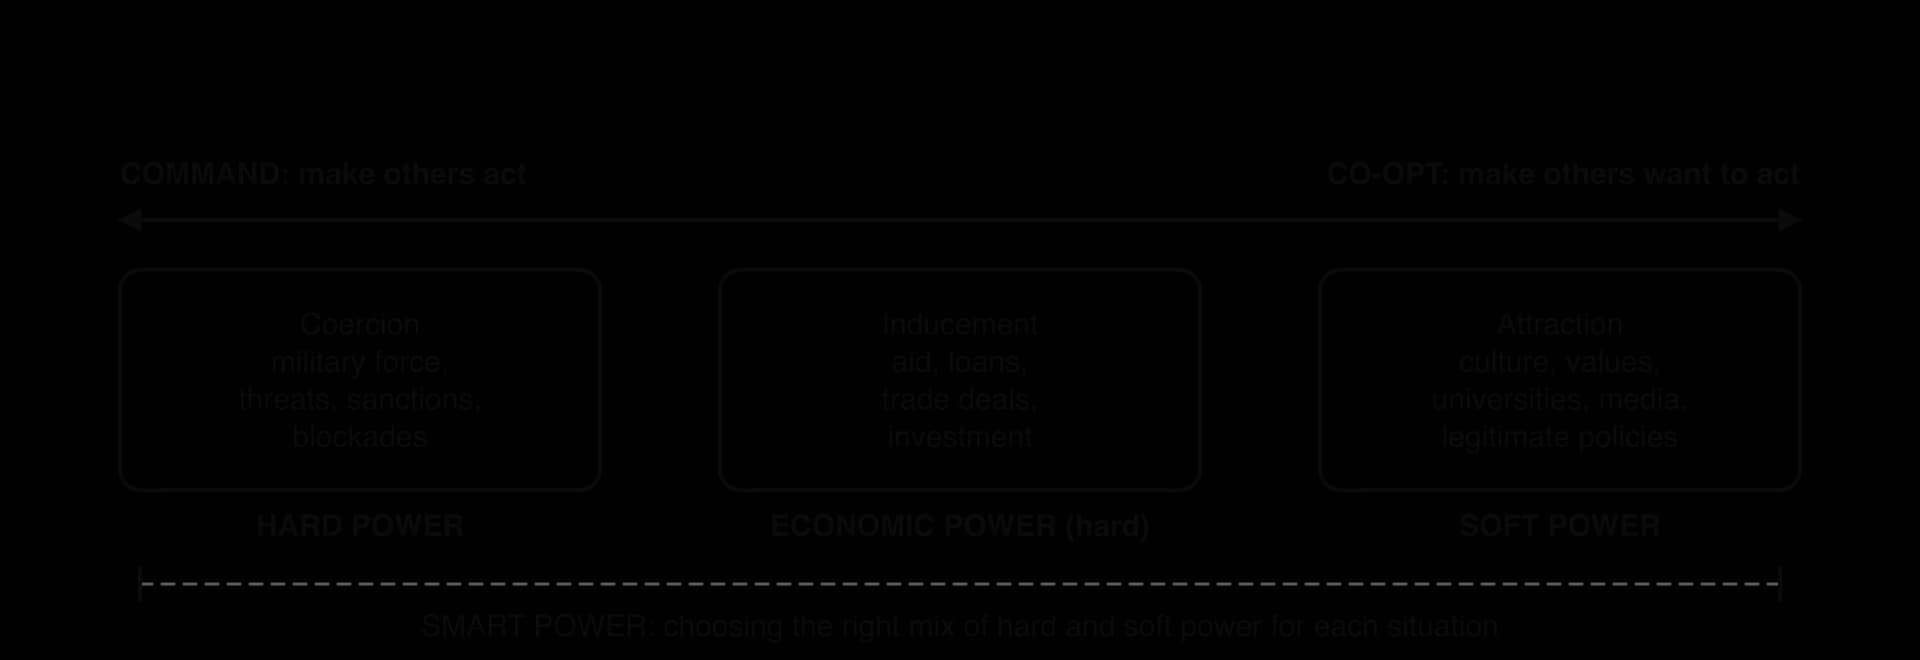
The American political scientist Joseph Nye distinguished between ways of using power. Hard power is the ability to get others to act by command: by coercion, such as military force, threats and sanctions, or by inducement, such as payments, aid and trade deals. It works by changing what others are able or willing to do through rewards and punishments.
Soft power, a term that Nye popularised in 1990, is the ability to get others to want what one wants, through attraction rather than coercion. Nye wrote that it rests on three resources: a country’s culture, where others find it attractive; its political values, when it lives up to them; and its foreign policies, when others see them as legitimate. Universities, films, music, sport, aid programmes and the image of a country’s way of life are all sources of soft power. Much of it is outside the control of governments and works slowly.
Smart power is the combination of hard and soft power in a deliberate strategy, choosing the right mix for each situation. The term was used by Suzanne Nossel in 2004 and developed by Nye. A state that provides disaster relief with its navy, for example, uses military capability (hard power) to win goodwill (soft power).
How the distribution of power has changed
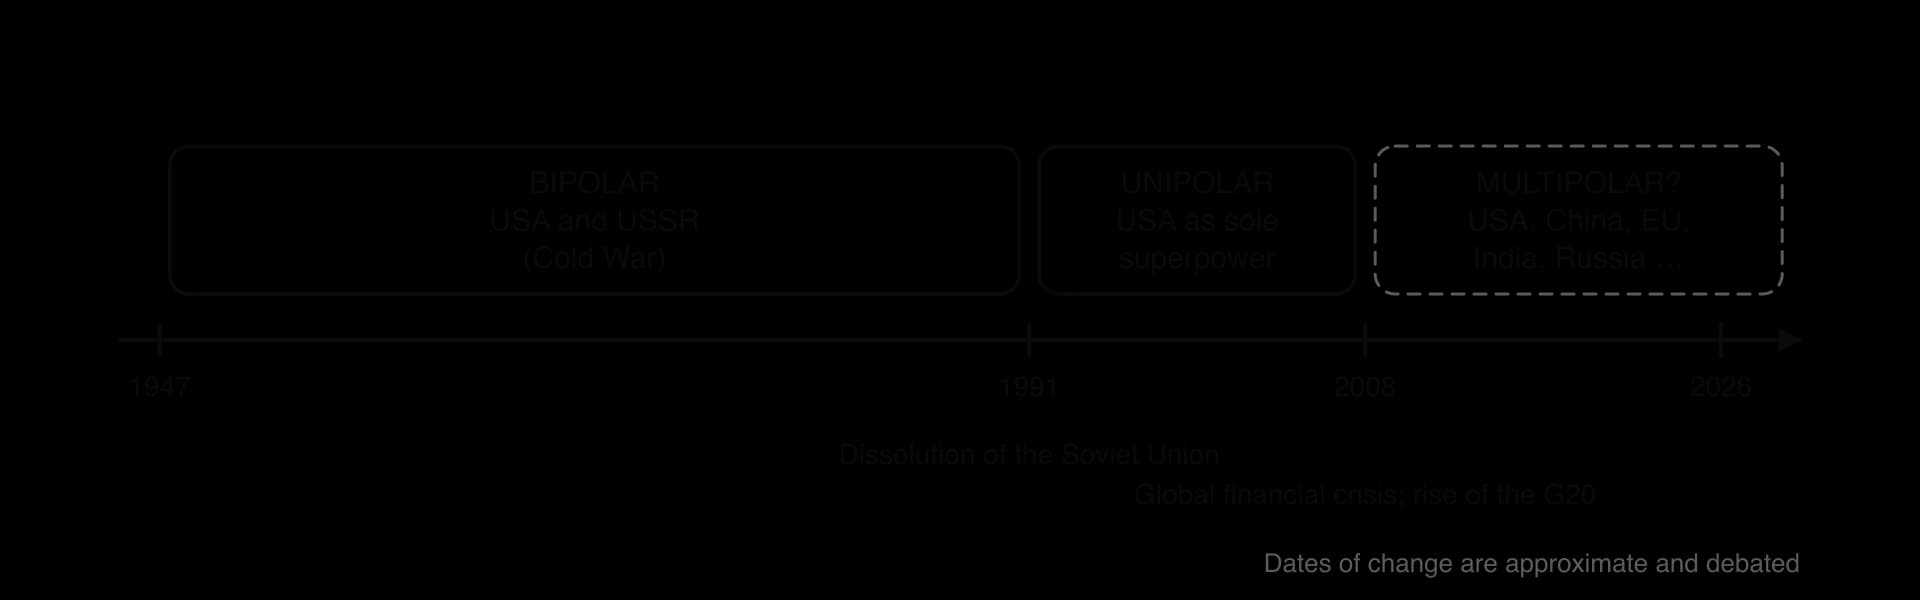
The structure of world power is described by its polarity: the number of centres of power. From the late 1940s to 1991 the world was bipolar, divided between the USA and its allies and the Soviet Union and its allies during the Cold War. When the Soviet Union dissolved in 1991, the USA became the sole superpower, a unipolar world in which no other state could balance its power.
A state with such dominance is said to exercise hegemony: leadership or dominance by one state over others, based not only on force but also on its ability to set the rules and institutions that others accept. After 1945 the USA led the creation of the UN, the IMF, the World Bank and the system of free trade, and its currency became the main reserve currency of the world. These rules and institutions are an important part of its power.
Since the 2000s, many analysts describe a shift towards a multipolar world, in which several centres of power, such as the USA, China, the European Union, India and Russia, compete and co-operate. The 2008 financial crisis, which began in the USA, and the rise of the G20 in response are often seen as markers of this change. Others argue that the world is becoming bipolar again, with the USA and China as the two dominant powers, while some argue that the USA still has no real equal.
Emerging and potential superpowers
An emerging superpower is a state, or union of states, that is gaining economic, military and political influence so quickly that it may become a superpower. China is the clearest example, and is studied in detail in the case study. India and the European Union are often named as potential superpowers, and Russia as a former superpower with continuing military reach.
Potential superpower | Sources of power | Limits |
|---|---|---|
India | Largest population in the world (1.45 billion in 2024); GDP US$3.76 trillion (2024), among the fastest-growing large economies; nuclear weapons; a large diaspora; Bollywood and IT services | GDP per capita only US$2,592 (2024); widespread poverty and inequality; KOF economic score 41.9; disputed borders with China and Pakistan |
European Union | Combined economy among the world’s largest; the single market; the euro as the second reserve currency (about 20% of reserves); regulatory power (the “Brussels effect”) | No single foreign policy or army; decisions need agreement between 27 member states; dependence on the USA for defence through NATO |
Russia | Nuclear weapons; permanent UN Security Council seat; military spending of US$149 billion, 6.9% of GDP (2024); energy exports | Economy far smaller than those of the USA, China or the EU; sanctions since 2014 and 2022; ageing population; KOF economic score 43.0 |
The “Brussels effect”, a term used by the legal scholar Anu Bradford in 2012, describes how EU rules spread worldwide because firms that want to sell in the EU adopt them everywhere. The EU’s General Data Protection Regulation (GDPR), adopted in 2016 and applied from 2018, led companies such as Facebook and Microsoft to apply parts of it to customers around the world. This is a form of power based on market size and rule-making rather than military force.
Sources: World Bank, World Development Indicators (UN WPP, SIPRI), 2024 data; KOF Globalisation Index 2025.
Comparing actual and potential superpowers
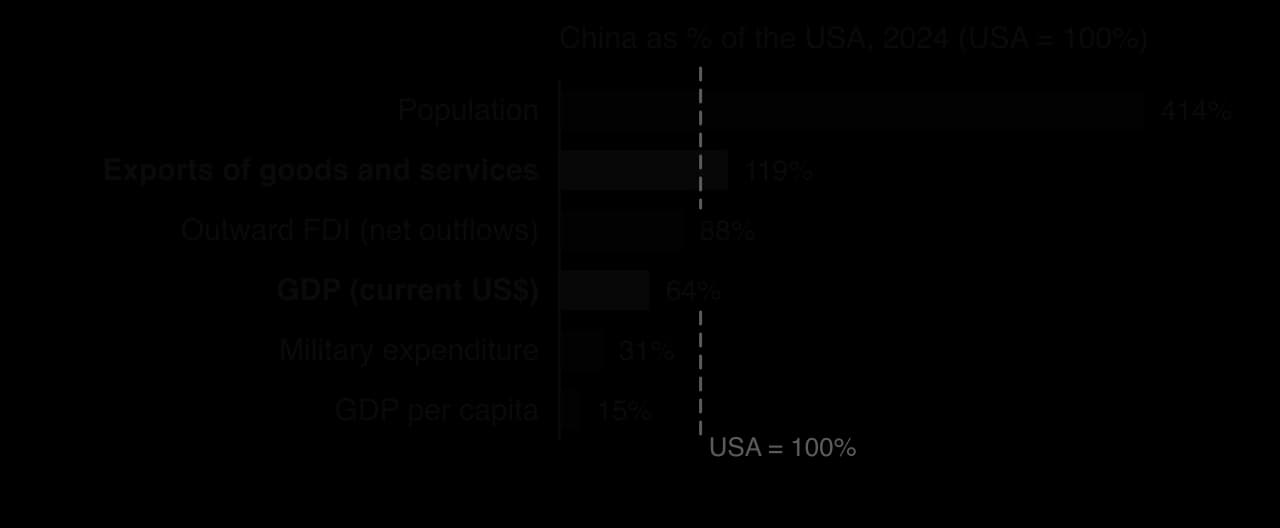
Comparing superpowers means comparing several bases of power at once. The chart sets China’s values against those of the USA on six indicators, with the USA equal to 100%.
The USA: the established superpower
The USA has been the world’s leading power since 1945 and its sole superpower after 1991. Its GDP was US$29.30 trillion in 2024, 26.2% of the world total, and it attracted US$248.6 billion of foreign direct investment (FDI), investment by foreign firms in businesses and assets in the country, far more than China or India. Its military expenditure of about US$1.0 trillion (3.4% of GDP) in 2024 was more than three times China’s, and it maintains alliances such as NATO and military bases around the world. It holds a permanent seat with a veto on the UN Security Council.
Much of the USA’s influence comes from its place at the centre of global institutions and finance. The US dollar made up about 58% of the world’s official foreign exchange reserves in 2022, which allows the USA to borrow cheaply and to use access to dollar payments as a tool of sanctions. The USA holds more than 16% of the votes in the IMF, where major decisions need an 85% majority, and the president of the World Bank has traditionally been American. Its universities, film and music industries and technology platforms give it great cultural reach and soft power.
Recent changes complicate this picture. The USA withdrew from the Paris Agreement on climate change in 2020 and rejoined in 2021; a second withdrawal, ordered in January 2025, took effect on 27 January 2026, and in February 2026 the USA gave notice that it would leave the UN Framework Convention on Climate Change. In 2025 it also imposed new tariffs on imports from many countries, and its president did not attend the 2025 G20 summit in Johannesburg. Supporters of these policies argue that they defend American jobs and sovereignty; critics argue that they weaken the alliances and rules that underpin American influence.
Basis of power | USA (2024) | China (2024) |
|---|---|---|
GDP (current US$) | 29.30 trillion (26.2% of world) | 18.73 trillion (16.8% of world) |
GDP per capita (current US$) | 86,170 | 13,293 |
Exports of goods and services | US$3.22 trillion | US$3.83 trillion |
Military expenditure | US$1,005 billion (3.4% of GDP) | US$312 billion (1.7% of GDP) |
FDI net inflows | US$248.6 billion | US$42.6 billion |
Population | 340 million | 1,409 million (falling since 2021) |
KOF Globalisation Index (2023) | 79.4 (28th) | 63.5 (85th) |
UN Security Council | Permanent member with veto | Permanent member with veto |
Sources: World Bank, World Development Indicators (national accounts, SIPRI, UN WPP), 2024 data; KOF Swiss Economic Institute, 2025.
Powerful global groups: the G7/8, the G20 and the OECD
Much global power is exercised through groups of states that meet to agree on economic policy. Unlike the UN, these groups have no binding legal powers over their members, but because their members are the largest economies, what they agree shapes trade, finance, aid and tax rules for everyone else.
The G7 and the G8
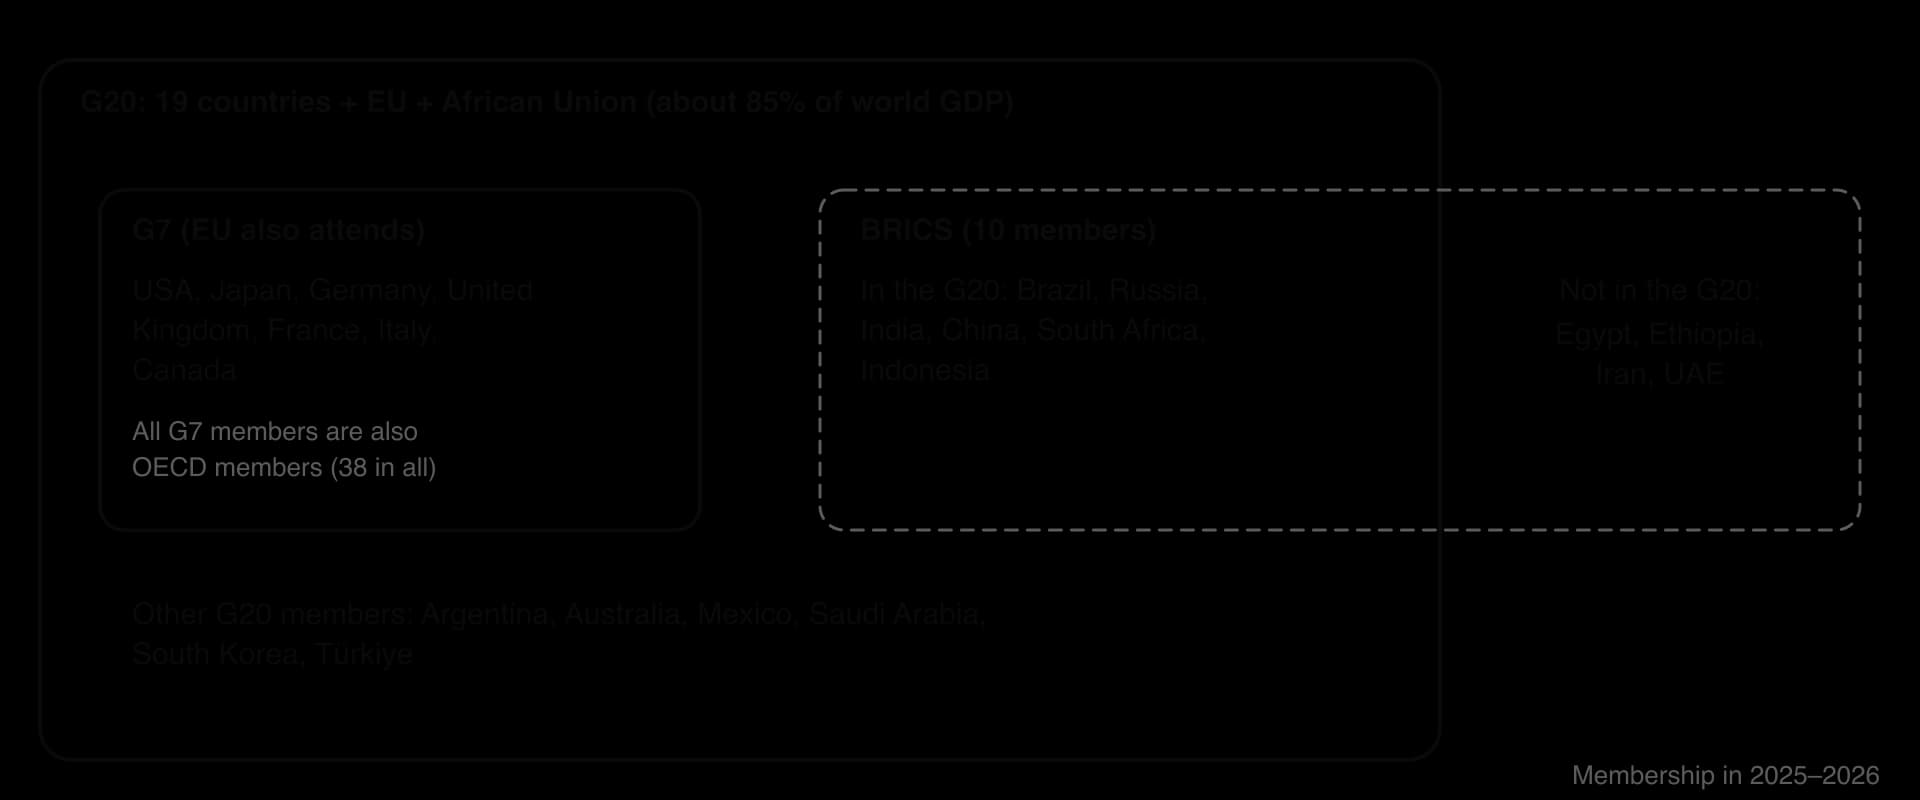
The G7 (Group of Seven) began when France hosted a summit at Rambouillet in November 1975 for six leading industrial democracies, to discuss the oil crisis, the end of the Bretton Woods system of fixed exchange rates and the recession; Canada joined in 1976. Its members are the USA, Japan, Germany, the United Kingdom, France, Italy and Canada, and the European Union also takes part. Russia joined in 1998 to form the G8, but its membership was suspended in March 2014 after it annexed Crimea from Ukraine.
The G7 countries have about 10% of the world’s population but produced about 44% of world GDP at market exchange rates in 2024. Their decisions have included the cancellation of debts owed by heavily indebted poor countries in the 2000s and co-ordinated sanctions on Russia after 2022. Critics argue that a group of wealthy, mostly Western countries cannot speak for a world in which China, India and other emerging economies produce a growing share of output.
The G20
The G20 (Group of Twenty) was formed in 1999, after the Asian financial crisis, as a meeting of finance ministers and central bank governors. During the 2008 global financial crisis it was raised to a summit of leaders, recognising that emerging economies had to be part of any solution. It has 19 member countries, the European Union and, since 2023, the African Union.
The 19 member states produce about 85% of gross world product and 75% of international trade, and hold 56% of the world’s population. The G20 therefore includes the emerging economies that the G7 leaves out, such as China, India, Brazil, Indonesia, Saudi Arabia and South Africa.
Its summit in Johannesburg on 22–23 November 2025 was the first held in Africa. The United States did not attend, after a dispute with the South African government, and as host of the 2026 summit, planned for 14–15 December 2026 at Doral near Miami, it said it would not invite South Africa. The G20 is criticised for having no power to enforce its declarations and for leaving out most of the world’s 190-plus countries, especially in Africa, although the African Union’s membership has reduced that gap.
The OECD
The Organisation for Economic Co-operation and Development (OECD) was founded in 1961, growing out of the organisation that had managed US Marshall Plan aid to Western Europe. It has 38 member countries, mostly high-income democracies, and its headquarters are in Paris. Its power lies less in money than in knowledge and standards: it collects and publishes comparable data on its members’ economies, education, health and aid, and writes model rules that governments adopt.
The OECD sets many of the rules for taxing transnational corporations, including guidelines on transfer pricing and a model tax convention used in thousands of tax treaties. In 2021 more than 130 countries agreed, through talks hosted by the OECD, on a global minimum tax of 15% on the profits of large multinational companies, to reduce the incentive to shift profits to low-tax places. Membership is expanding slowly: Colombia joined in 2020 and Costa Rica in 2021, and accession talks are under way with countries including Brazil, Argentina, Indonesia and Thailand.
Evaluating global groups
Group | Influence | How representative? | Main criticism |
|---|---|---|---|
G7 | Co-ordinates the policies of the largest high-income economies; sanctions, debt relief, aid | About 10% of world population; no emerging economies | An exclusive club of rich countries whose share of world GDP is falling |
G20 | Main forum for global economic crises since 2008 | About 85% of world GDP and 56% of population; includes major emerging economies and the African Union | No enforcement; most countries excluded; divisions between members weaken agreement |
OECD | Data, standards and tax rules adopted far beyond its members | 38 mostly high-income members | Rules written by high-income countries and applied to others who had little say |
The groups have real influence, because their members dominate the world economy and their agreements become the rules that others follow. Their legitimacy is weaker: none of them includes most low-income countries, and decisions are made by negotiation between powerful states rather than by all countries equally. The G20 is the most representative of the three, but it is also the most divided, as the boycott of its 2025 summit showed.
OPEC and energy power
The Organization of the Petroleum Exporting Countries (OPEC) was founded in Baghdad on 14 September 1960 by Iran, Iraq, Kuwait, Saudi Arabia and Venezuela, in response to price cuts imposed by the large Western oil companies that then controlled most production. Its aim is to co-ordinate the oil policies of its members to secure stable and profitable prices. Its headquarters are in Vienna.
Membership has changed over time. Qatar left in 2019, Angola in 2023 after disagreeing with its production quota, and the United Arab Emirates, OPEC’s third-largest producer, announced on 28 April 2026 that it would leave both OPEC and OPEC+ from 1 May; officials said it had often felt constrained by production quotas, and analysts linked the decision to the war with Iran. From May 2026 OPEC had 11 members: Algeria, Equatorial Guinea, Gabon, Iran, Iraq, Kuwait, Libya, Nigeria, the Republic of the Congo, Saudi Arabia and Venezuela. In 2022 its members produced about 38% of the world’s crude oil and held about 80% of proven oil reserves.
How OPEC influences prices
OPEC influences prices by setting production quotas: each member agrees to produce no more than a set amount, so that less oil reaches the market and prices rise. Economists often describe it as a cartel. In October 1973, during the Arab–Israeli war, Arab oil exporters cut production and placed an embargo on the USA and other countries that supported Israel, and oil prices rose about fourfold. The shock caused a world recession and showed how much power exporters could hold over importers.
OPEC’s power is limited in several ways. Members often produce more than their quotas, because each gains by selling more while others hold back: one study found that members broke 96% of their commitments. Production outside OPEC, especially from US shale oil, has grown: US output nearly doubled between 2008 and 2015, reducing OPEC’s share of the market. In the long term, the shift to renewable energy and electric vehicles may reduce demand for oil.
OPEC+
To regain control of prices, OPEC agreed in late 2016 to co-ordinate production with other exporters, most importantly Russia, in a looser grouping known as OPEC+. Its non-OPEC members include Russia, Kazakhstan, Mexico, Oman, Azerbaijan, Malaysia and Brazil. In April 2020, when the COVID-19 pandemic collapsed demand, OPEC+ agreed to cut output by 9.7 million barrels a day, about 10% of world output. In 2025 eight of its members began to reverse voluntary cuts made since 2023, and by September 2025 they had restored about 2.5 million barrels a day of output.
OPEC’s influence on importing countries’ energy policies
OPEC’s greatest influence may have been on the energy policies of oil-importing countries, which have tried ever since 1973 to reduce their exposure to its decisions. After the 1973 embargo, high-income importers created the International Energy Agency (IEA) in 1974, and its members agreed to hold emergency oil stocks equal to at least 90 days of their net imports. Many also lowered speed limits, set fuel-efficiency standards for cars, and developed alternatives: France built a large nuclear power programme, Brazil developed sugar-cane ethanol, and the USA and others searched for oil outside the Middle East.
The same motives drive policy today. Importers diversify their suppliers, build strategic reserves, and invest in renewable energy and electric vehicles partly to improve energy security. When the war that began in the Gulf on 28 February 2026 disrupted shipments through the Strait of Hormuz, the 32 IEA member countries agreed on 11 March 2026 to release 400 million barrels from their emergency stocks, about four days of world oil consumption, while OPEC+ pledged a much smaller rise in output of about 206,000 barrels a day. OPEC’s decisions still move world oil prices, but its power is shared with other producers and checked by importers’ policies.
Global lending institutions
Countries that cannot pay for their imports or service their debts may turn to international lenders. The institutions that lend, and the conditions they attach, are a major source of power over the policies of borrowing countries.
The IMF and the World Bank
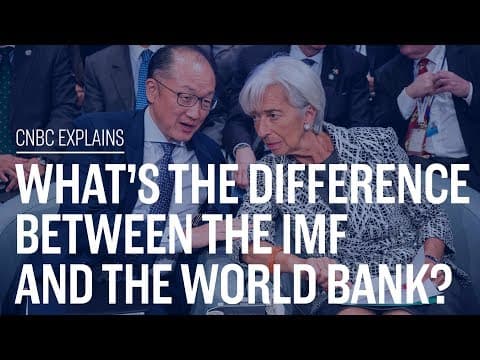
The International Monetary Fund (IMF) and the World Bank were created at the Bretton Woods conference in New Hampshire, USA, in July 1944, to rebuild the world economy after the Second World War. The IMF formally came into existence on 27 December 1945 with 29 members; it now has 191. Its role is to support stable exchange rates and international payments, to monitor members’ economies, and to act as a lender of last resort to countries in a balance-of-payments crisis.
The World Bank Group lends and gives grants for development projects, such as roads, power, schools and health systems, with the twin goals of ending extreme poverty and building shared prosperity. Its International Bank for Reconstruction and Development (IBRD) lends to middle-income countries, and its International Development Association (IDA) gives low-interest loans and grants to the poorest countries.
Who holds the power?
Votes in the IMF depend on each member’s quota, its financial contribution, which reflects the size of its economy. The USA holds more than 16% of the votes, and the most important decisions need an 85% majority, so the USA alone can block them. Until reforms agreed in 2010 and ratified by the US Congress only in 2015, China had only the sixth-largest vote share, and Brazil’s was smaller than Belgium’s. By tradition the head of the IMF is European and the president of the World Bank is American.
 YouTube
Conditionality and structural adjustment
IMF loans usually come with conditionality: the borrowing government must agree to change its policies, for example by cutting its budget deficit, raising taxes, removing subsidies or selling state companies. The aim is to restore the country’s ability to repay. In the 1980s and 1990s the IMF and the World Bank lent to most countries of Latin America and sub-Saharan Africa under structural adjustment programmes (SAPs), which required privatisation, the removal of barriers to trade and foreign investment, and cuts in government spending.
Conditions were applied most widely in the debt crises of the 1980s, when many borrowing countries had to accept a whole package of reforms at once.
Supporters argue that SAPs cut inflation and debts and opened economies to investment. Critics, including many NGOs and economists, argue that cuts in spending on health and education and the introduction of fees hurt the poorest people, and that the conditions limited the sovereignty of borrowing countries. Since 2002 the IMF and World Bank have asked borrowers to draw up their own Poverty Reduction Strategy Papers, giving them more say over the conditions.
Loan | Context | Conditions and outcomes |
|---|---|---|
Greece, 2010–2018 | A eurozone member unable to borrow after its debts and deficits were revealed to be larger than reported | Three bailouts from the IMF, the European Commission and the European Central Bank; 12 rounds of tax rises and spending cuts; GDP fell so much that debt rose from 127% to 179% of GDP (2009–2017); in June 2015 Greece became the first developed country to miss a payment to the IMF |
Argentina, 2018 and 2025 | A currency crisis in 2018; a further crisis of high inflation, low reserves and debts that included the unpaid 2018 loan, refinanced in 2022 | In 2018 a stand-by arrangement of about US$50 billion, the largest in IMF history, required cuts to the budget deficit; the peso still collapsed and Argentina refinanced the debt with a US$44 billion programme in 2022. In April 2025 a new US$20 billion programme required a fiscal surplus and an easing of currency controls |
Sri Lanka, 2023– | Sri Lanka declared a default on US$51 billion of foreign debt in April 2022 after its foreign currency reserves ran out | An IMF Extended Fund Facility required VAT to rise from 8% to 18% and higher income taxes to raise tax revenue from 8.1% of GDP (2021) towards 15%; inflation fell, but unemployment and hardship rose |
New lenders: the New Development Bank and the AIIB
Emerging economies have long argued that the IMF and World Bank give them too little voice. One response has been to create new institutions. The New Development Bank (NDB), set up by the BRICS countries (a group of large emerging economies that began as Brazil, Russia, India and China in 2009 and has since grown to ten members), was agreed at the BRICS summit in Fortaleza, Brazil, on 15 July 2014 and has its headquarters in Shanghai.
Its initial subscribed capital of US$50 billion was divided equally among the five founders, Brazil, Russia, India, China and South Africa, so that no single member dominates, unlike the quota system of the IMF. Its presidency rotates between the founders; Dilma Rousseff, a former president of Brazil, has led it since March 2023.
The NDB has admitted new members: Bangladesh and the United Arab Emirates joined in 2021, Egypt was approved in December 2021 and became a member in 2023, Uruguay was approved in 2021, and Algeria was admitted in 2024, while its founders must keep at least 55% of the voting power. It lends partly in members’ own currencies rather than only in US dollars. Its limits became clear in March 2022, when it put new lending to Russia, one of its founders, on hold because of sanctions risks: even a BRICS bank depends on access to dollar-based financial markets.
The Asian Infrastructure Investment Bank (AIIB) was proposed by China in 2013, launched in Beijing in October 2014 and began operating in December 2015, with starting capital of US$100 billion. China had argued that the existing Asian Development Bank was dominated by Japan and the USA, which held about 13% of its votes each compared with China’s 5.5%. The AIIB has grown to more than 100 members, including the United Kingdom, Germany and France, although the USA and Japan did not join.
IMF and World Bank | NDB and AIIB | |
|---|---|---|
Founded | 1944 (Bretton Woods) | 2014–2015 |
Main funders and voters | USA, Europe and Japan hold the largest vote shares | BRICS (equal shares in the NDB); China is the largest shareholder in the AIIB |
Purpose | Financial stability (IMF); development lending (World Bank) | Infrastructure and development lending |
Conditions | Policy conditionality, often strict | Fewer policy conditions; project-based |
Currency | Mostly US dollars | Dollars and members’ local currencies |
The new banks challenge the Western-led institutions as a symbol of the rising power of emerging economies, and they give borrowers more choice. In practice they are much smaller, they often co-finance projects with the World Bank, and they cannot replace the IMF as a lender of last resort in a crisis. They are better seen as adding to the existing system than as replacing it, although they shift some influence over global finance towards Asia.
Sources: Wikipedia articles on the G7, G20, OECD, OPEC, the IMF, the World Bank, the New Development Bank, the AIIB, the Greek government-debt crisis and the Sri Lankan economic crisis, each read in October 2026, and their cited sources.
Case study: China, a rising superpower
China has changed from a poor, inward-looking country into the world’s second-largest economy within one lifetime. After economic reforms began in 1978, it opened special economic zones to foreign investment, joined the World Trade Organization in 2001 and became the world’s largest manufacturer and exporter. Its rise is the main reason why many geographers describe the world as becoming multipolar, and it shows each base of power at work, together with its limits.
Economic power
China’s GDP rose from US$1.22 trillion in 2000 to US$6.19 trillion in 2010 and US$18.73 trillion in 2024, when it produced 16.8% of world GDP. Its exports of goods and services, US$3.83 trillion in 2024, were larger than those of the USA, and its firms invested abroad on a large scale, with outward FDI of US$192 billion in 2024. China is a leading trading partner for many countries in Asia, Africa and South America, so access to its market and its loans matters to governments around the world.
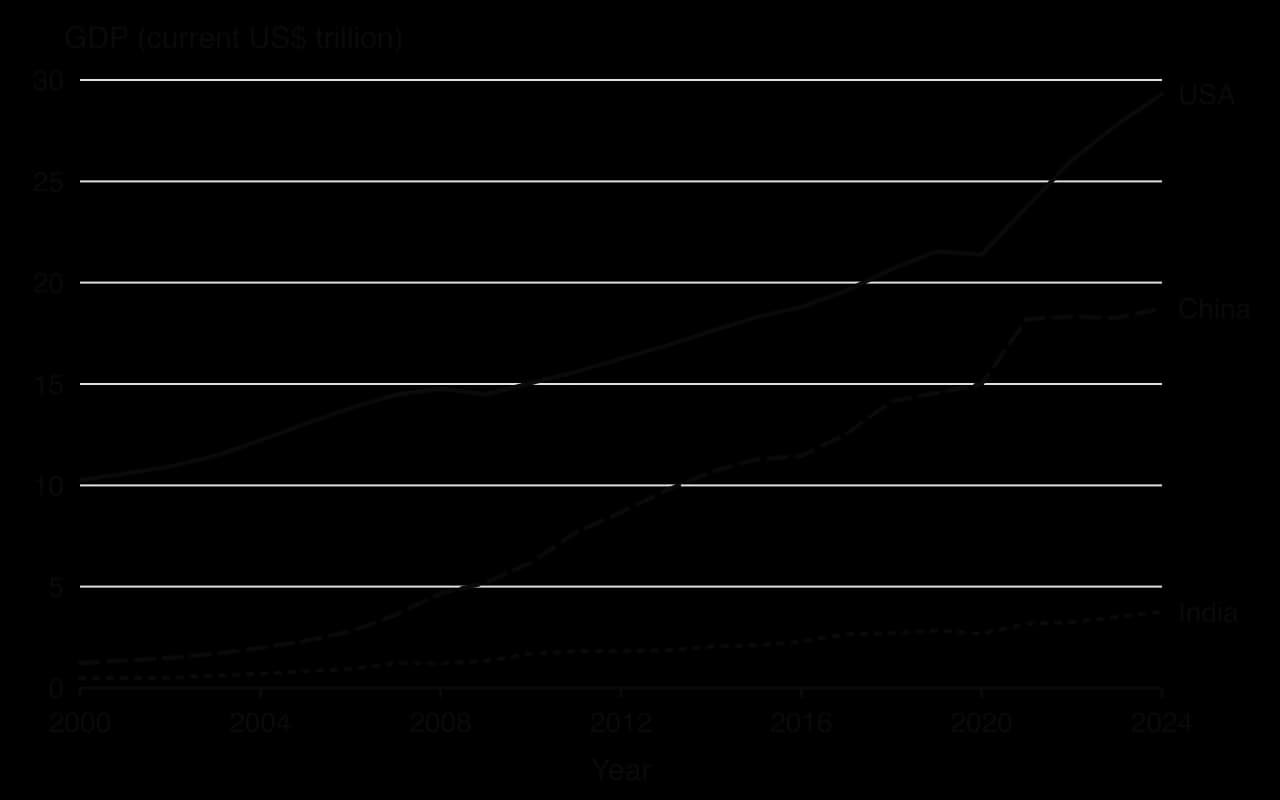
Yet China remains an upper-middle-income country. Its GDP per capita of US$13,293 in 2024 was about 15% of the USA’s, its KOF economic globalisation score (44.7) is low because it still limits capital flows and foreign ownership, and its currency makes up only a small share of world reserves compared with the US dollar. Since 2021 its population has been falling, from 1,412.4 million to 1,409.0 million in 2024, and its total fertility rate was only 1.01 births per woman in 2024. A shrinking, ageing workforce may slow future growth.
Geopolitical power: the Belt and Road Initiative
The Belt and Road Initiative (BRI) is China’s programme of infrastructure investment and lending abroad. President Xi Jinping announced the overland “Silk Road Economic Belt” at Nazarbayev University in Astana, Kazakhstan, on 7 September 2013, and the “21st Century Maritime Silk Road” in Indonesia the following month. Projects in about 150 countries include ports, railways, roads, power stations and telecommunications networks. By 2025 participating countries held nearly 75% of the world’s population and more than half of world GDP.
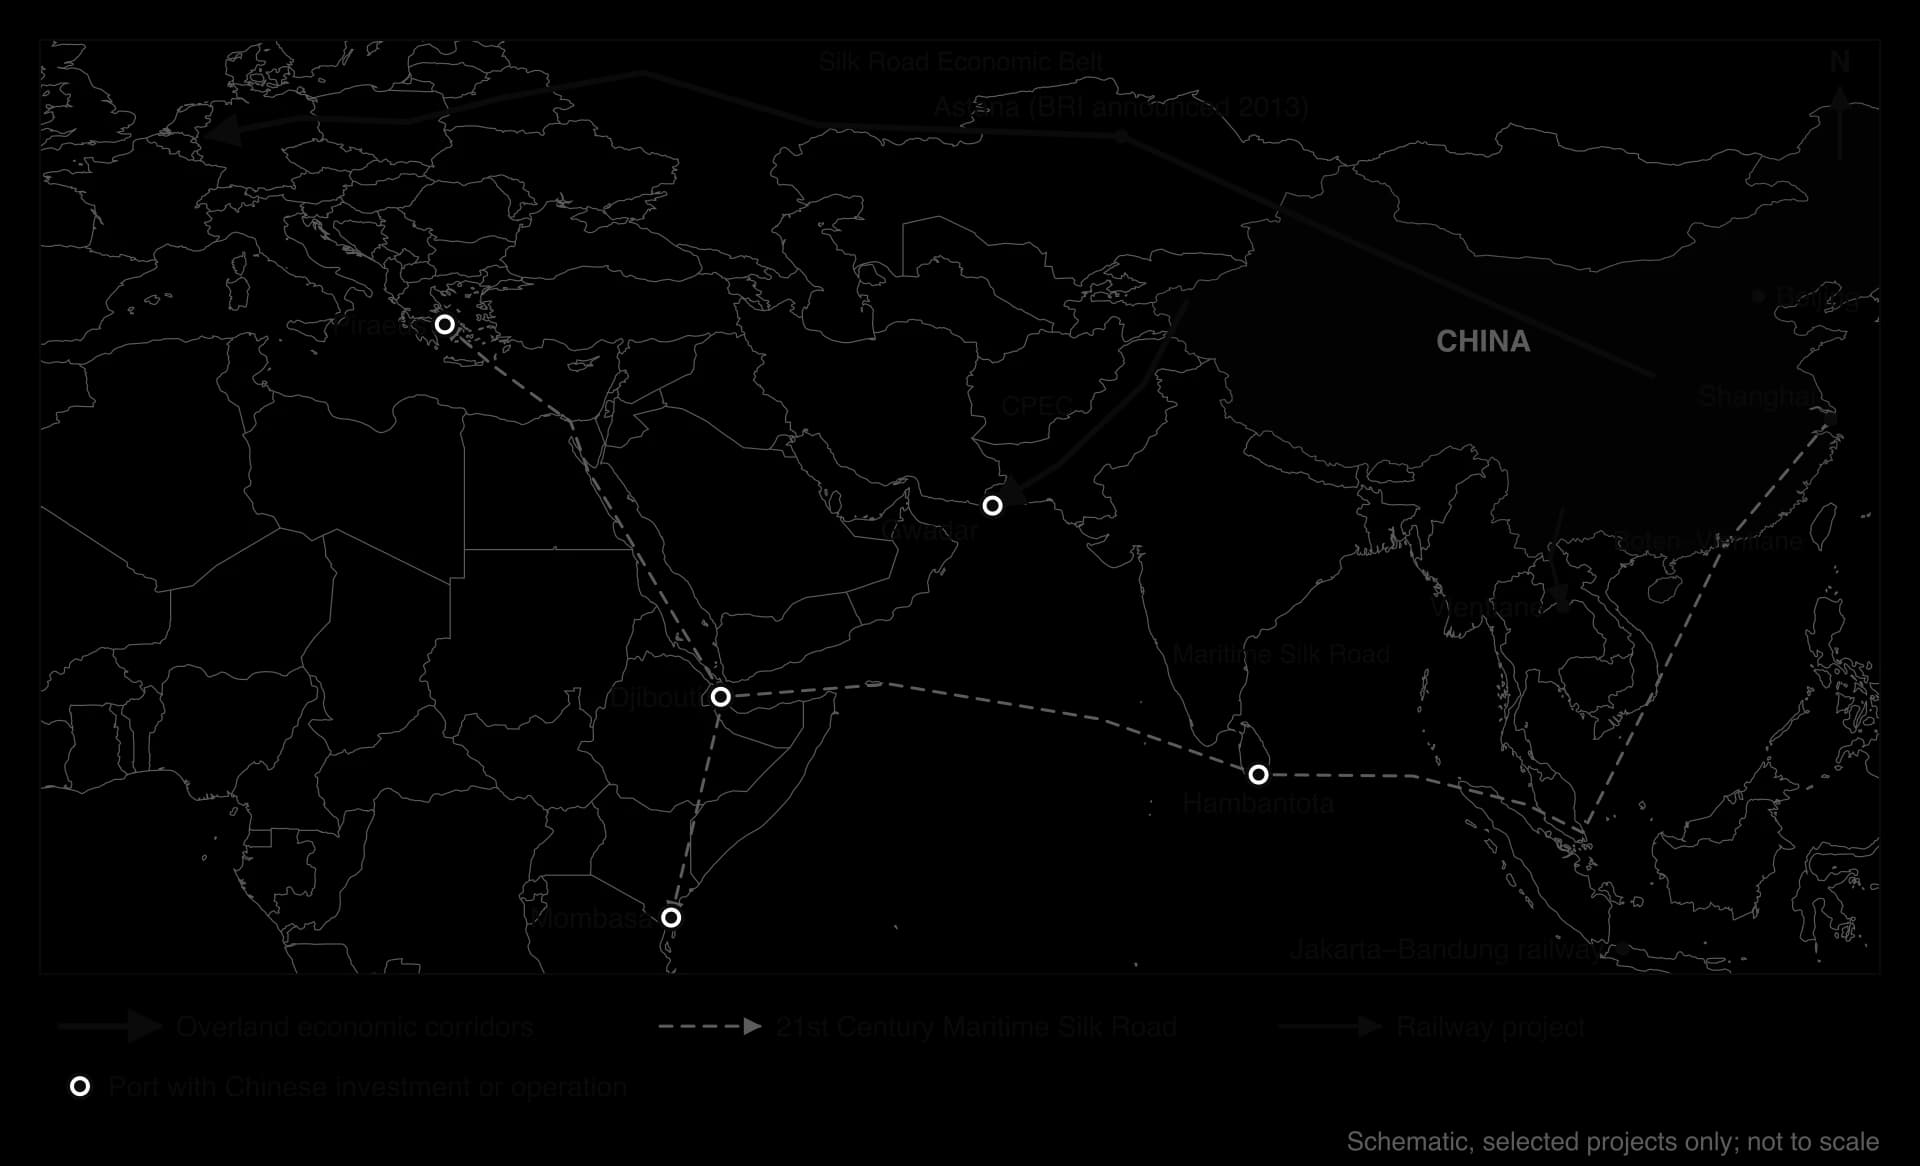
Flagship projects show the range of the initiative. The China–Pakistan Economic Corridor links Kashgar in western China with the port of Gwadar; it became partly operational in November 2016, when Chinese cargo was carried overland to Gwadar for shipment onward. Piraeus in Greece has become a Chinese-run gateway for the Maritime Silk Road into Europe, and Chinese-built high-speed railways now run from Boten to Vientiane in Laos and from Jakarta to Bandung in Indonesia. In Kenya, China financed and built a railway from the port of Mombasa towards Nairobi.
 YouTube
Hambantota and the debt debate
The port of Hambantota in southern Sri Lanka was built with Chinese loans and earned little in its first years, while the government owed large repayments. In July 2017 Sri Lanka leased a 70% stake in the port to the Chinese state-owned firm China Merchants Port for 99 years in return for US$1.12 billion. The deal became the best-known example in claims that China uses “debt-trap diplomacy”: lending more than a country can repay in order to gain control of strategic assets.
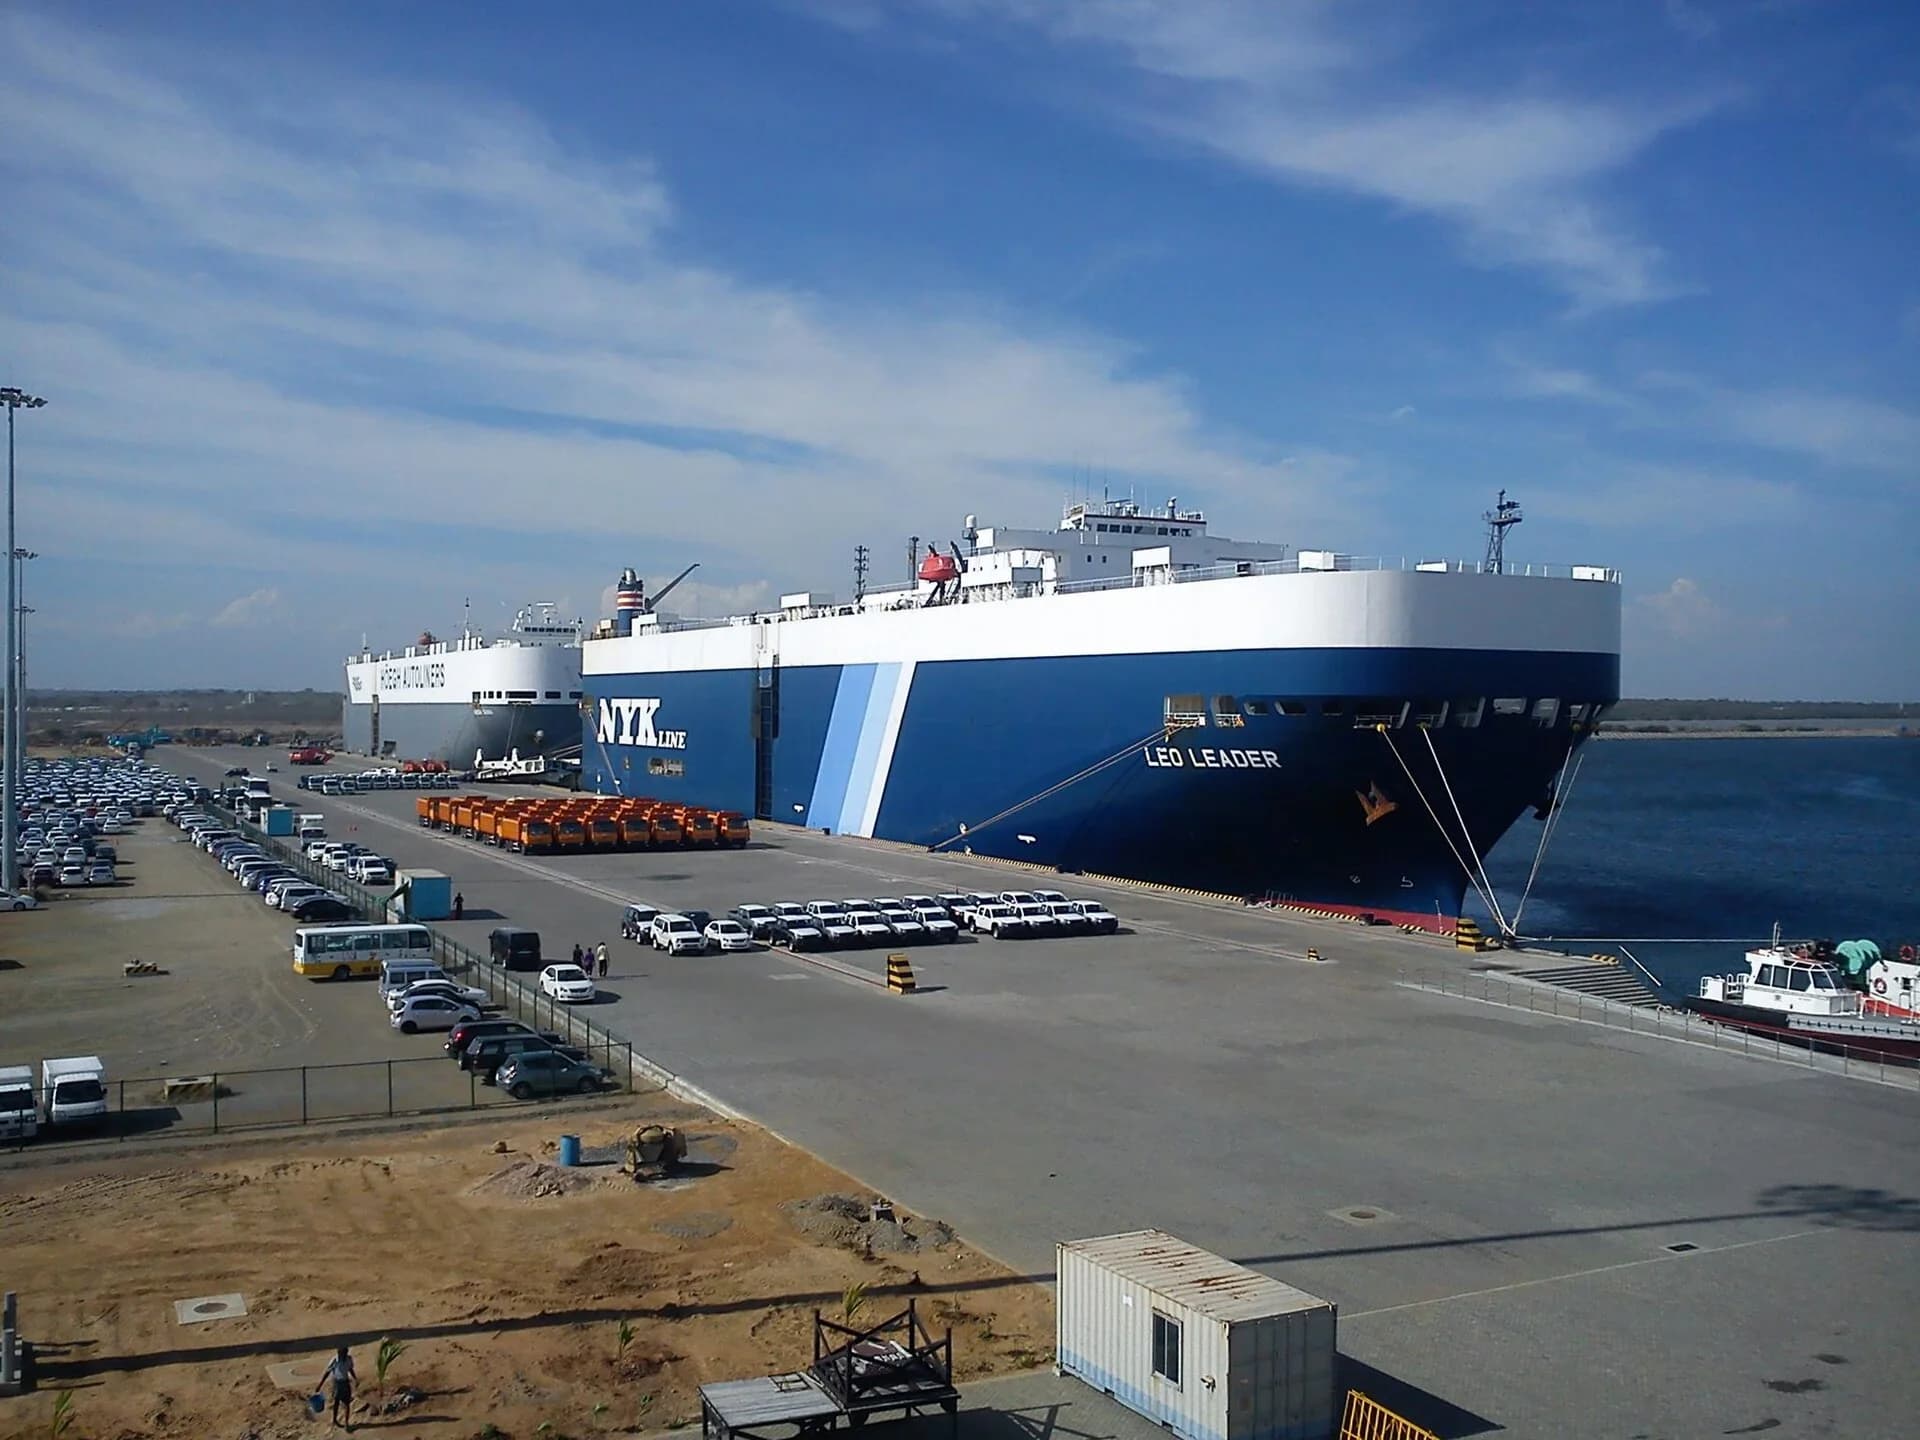
The evidence is contested. Researchers such as Deborah Brautigam of Johns Hopkins University found no case in which Chinese banks seized an asset, and Sri Lankan central bank governors told her that Hambantota and Chinese finance were not the main sources of the country’s financial distress. On the other hand, a 2025 study by the Lowy Institute found that for 54 developing countries, debt repayments to China now exceed those owed to the Paris Club of mostly Western creditor countries, which shows how large a creditor China has become for lower-income borrowers.
Military and diplomatic power
China’s military expenditure was US$312 billion in 2024, the second highest in the world but less than a third of the USA’s, and only 1.7% of its GDP. It is a permanent member of the UN Security Council with a veto, and holds nuclear weapons. Ports such as Gwadar and Hambantota are commercial, but analysts in India and the USA point out that they could also serve the Chinese navy, which is one of the “dual-use” concerns about the BRI.
China has also built new institutions where it holds a central place. It proposed the Asian Infrastructure Investment Bank in 2013, which many Western countries joined despite US objections, and it is a founder of the New Development Bank, whose headquarters are in Shanghai. These institutions extend China’s influence over development finance without challenging the IMF directly.
Cultural power and soft power
China has invested heavily in soft power, the ability to attract others rather than coerce them. It has opened several hundred Confucius Institutes around the world to teach Chinese language and culture, and the number of foreign students in China rose from about 36,000 to at least 240,000 in the decade to 2010, making it the most popular destination for international students in Asia. Chinese apps, games and technology firms reach global markets. China also presents itself as a defender of national sovereignty and of the interests of the Global South.
Its soft power is more contested than its economic power. Its restrictions on the internet and the press reduce the attraction of its political model; and disputes with its neighbours in the South China Sea and on the Himalayan border with India make some governments wary. Nye and other analysts argue that soft power is harder to build when it is directed mainly by the state, because attraction depends heavily on civil society, culture and independent media.
Perspectives on China’s rise
Stakeholder | Perspective |
|---|---|
The Chinese government | The BRI is a partnership for shared development that builds the infrastructure other lenders would not finance; China seeks a fairer, multipolar world order, not hegemony |
Partner governments (Pakistan, Laos, Kenya) | Chinese finance pays for ports, railways and power stations quickly, with fewer policy conditions than the IMF; but debts and operating costs can be high |
The USA and some allies | China is a strategic competitor; the BRI extends Chinese influence, creates debt dependence and may give its navy access to foreign ports |
India | CPEC passes through territory India claims in Kashmir; Chinese-run ports around the Indian Ocean raise security concerns |
Independent researchers | Evidence on “debt traps” is mixed: lending terms vary, assets have rarely been seized, but some countries owe China more than they can easily repay |
How the case shows the key concepts
Power: China shows that economic size can be turned into geopolitical influence through lending, infrastructure and new institutions, but that military reach, the role of the currency and soft power develop much more slowly. Place and scale: its influence is greatest in neighbouring Asia and in lower-income countries that need infrastructure finance, and weakest in high-income democracies. Possibility: whether China becomes a full superpower depends on uncertain futures: the pace of its economic growth as its population ages, its relations with the USA, and whether borrowing countries continue to welcome its loans.
To what extent does the Belt and Road Initiative show China using hard power rather than soft power?
Suggest why China’s KOF score (63.5) is much lower than its share of world trade would suggest.
Examine whether the evidence from Hambantota supports the idea of “debt-trap diplomacy”.
Sources: World Bank, World Development Indicators (national accounts, SIPRI, UN WPP), 2026; KOF Swiss Economic Institute, 2025; Wikipedia articles “Belt and Road Initiative”, “Hambantota International Port”, “China–Pakistan Economic Corridor” and “Soft power”, read October 2026; Lowy Institute, 2025.
Exam practice
Paper 3 offers one question on each HL unit, and each question has two parts on the same unit: part (a), worth 12 marks, asks for analysis or explanation, and part (b), worth 16 marks, asks for a discussion of a quoted statement. Part (a) is marked for knowledge, analysis and structure; part (b) also rewards synthesis with other parts of the course and evaluation.
Part (a): analysis
A second part (a) question can test the measurement of participation rather than power. Its plan draws on the KOF index and the DHL report.
Part (b): discussion
Summary
Global interactions are two-way flows of goods, capital, people, information and ideas that create interdependence between places; participation is very uneven.
Globalisation indices measure participation: the KOF index (economic, social and political; de facto and de jure) ranked the Netherlands first in 2023, the USA 28th and China 85th; the DHL report measures depth and breadth and ranked Singapore first.
Indices depend on the choice of variables, favour small open economies and measure participation, not power.
A superpower projects economic, geopolitical and cultural influence globally; power can be hard (coercion or payment), soft (attraction) or smart (a combination).
The world moved from bipolar (to 1991) to unipolar (USA) and, many argue, towards a multipolar world with China, the EU and India as emerging or potential superpowers.
The USA leads in GDP (26.2% of the world in 2024), military spending, the dollar and global institutions; China leads in exports and population and extends its influence through the Belt and Road Initiative, the AIIB and the NDB.
The G7 (about 10% of world population) and the OECD set many global rules; the G20, with emerging economies and the African Union, produces about 85% of world GDP but cannot enforce its decisions.
OPEC and OPEC+ influence oil prices through quotas, but cheating, US shale oil and the energy transition limit their power; importers have responded since 1973 with stocks, efficiency and diversification.
The IMF and World Bank hold power through votes weighted to the USA and Europe and through conditionality; the NDB and AIIB give emerging economies alternatives.
Self-check
- To do:
I can describe what the KOF index and the DHL report measure and compare countries’ scores.
- To do:
I can evaluate the strengths and limitations of globalisation indices.
- To do:
I can explain what makes a superpower, and distinguish hard, soft and smart power with examples.
- To do:
I can examine how world power has changed from bipolar to unipolar and towards multipolar.
- To do:
I can compare the USA and China as superpowers using figures for several bases of power.
- To do:
I can analyse the influence of the G7/8, G20 and OECD and evaluate how representative they are.
- To do:
I can explain how OPEC and OPEC+ influence oil prices and importers’ energy policies.
- To do:
I can evaluate the power of the IMF, the World Bank, the NDB and the AIIB over borrowing countries.