Evaluate pessimistic, optimistic and balanced views of population and resources, and assess the circular economy and the Sustainable Development Goals as resource stewardship strategies, using Kalundborg.
Each is in the Geography glossary, with every other term in the subject.
An increase in agricultural output per unit of land, achieved by using more labour, capital, technology or inputs such as fertiliser, irrigation and improved seeds on the same area.
The theory, set out by Ester Boserup in 1965, that population growth and pressure on food supplies stimulate agricultural innovation and intensification, so food production rises to meet the needs of more people.
The maximum population that an area can support indefinitely with its available resources without degrading the environment; for people it depends on technology, trade and levels of consumption.
An economic system that designs out waste and pollution, keeps products and materials in use at their highest value through reuse, repair, remanufacture and recycling, and regenerates natural systems.
Describing the optimistic view that human ingenuity, technology and markets will always find ways to overcome resource shortages, so population and economic growth can continue.
The spread, from the 1960s, of high-yielding varieties of cereals together with irrigation, chemical fertilisers and pesticides, which greatly increased crop yields in many parts of Asia and Latin America.
A collaboration in which separate firms, usually located close together, exchange materials, energy, water and by-products, so that the waste or surplus of one becomes a resource for another.
Outline the concepts of carrying capacity, overpopulation and optimum population, and explain how population, affluence and technology combine to affect resource use.
Explain Malthusian and neo-Malthusian views of population and resources, and evaluate the evidence for and against them.
Explain Boserup’s theory and cornucopian views, using the Green Revolution and Machakos in Kenya as evidence, and evaluate them.
Distinguish between sustainability, sustainable development and resource stewardship as balanced views.
Discuss different perspectives on global resource use, including whether consumption or population growth is the greater pressure.
Explain the circular economy as a systems approach, and evaluate its value at different scales, using Kalundborg Symbiosis as a case study.
Examine the role of the Sustainable Development Goals and evaluate the progress made towards them.
Evaluate the likely effectiveness of resource management at local, national and global scales.
Resource stewardship is about how people can meet their needs for food, water, energy and materials without exhausting the resources and natural systems that future generations will depend on. Geographers have argued about this question for more than two centuries, from Thomas Malthus’s warnings in 1798 to today’s debates about planetary boundaries and the circular economy.
The topic centres on possibility and power. The theories offer competing views of what is possible: collapse, endless growth, or a managed balance. Management strategies, from a single industrial park to the United Nations’ global goals, depend on who has the power to make decisions, who bears the costs and whose consumption is treated as the problem. The topic draws together population change, the pressures of growing consumption on water, food and energy security, and the emissions that drive climate change.
131 exam-style questions on this subtopic, written in the style of the IB papers. The first has its markscheme open. Counted on
Examine the view that the environmental costs of deep-sea mining are likely to outweigh its economic benefits.
10 marks
Marks should be allocated according to the markbands.
Deep-sea mining is the extraction of mineral deposits from the deep seabed, usually below 200 m and often at 4,000–6,000 m. The main targets are polymetallic (manganese) nodules on abyssal plains, seafloor massive sulphides at hydrothermal vents and cobalt-rich crusts on seamounts. Commercial mining has not yet begun at scale, so answers will necessarily weigh likely or projected costs and benefits; credit reasoned speculation grounded in evidence. Economic benefits may be for states, companies or the wider world economy (eg the energy transition).
Possible applied themes (AO2) demonstrating knowledge and understanding (AO1):
Demand: nodules contain manganese, nickel, cobalt and copper, metals used in batteries for electric vehicles and in renewable energy technology; supporters argue seabed supply could reduce dependence on land mines with poor human rights records (eg cobalt from the Democratic Republic of the Congo).
The Clarion-Clipperton Zone (CCZ) in the Pacific between Hawaii and Mexico covers about 4.5 million km² and holds the largest known nodule deposits; exploration contracts are issued by the International Seabed Authority (ISA), based in Kingston, Jamaica.
Benefits for small states that sponsor contractors (eg Nauru, Tonga) through royalties; the UNCLOS principle that seabed minerals beyond national jurisdiction are the “common heritage of mankind”, with benefits to be shared.
Environmental costs: removal of the nodules destroys the habitat of species that live on them and that grew over millions of years, so recovery is extremely slow; sediment plumes may smother filter feeders over wide areas; noise and light pollution; disruption of carbon stored in seabed sediments.
With a free account, Augment remembers where you stopped and what you have practiced.
An economic system based on “take, make, dispose”, in which raw materials are extracted, made into products, used and then discarded as waste.
The theory, set out by Thomas Malthus in 1798, that population grows geometrically while food supply grows only arithmetically, so population will outstrip food and be held back by famine, disease and war.
Eight international development goals adopted by the United Nations for 2000–2015, focused mainly on reducing poverty, hunger, disease and illiteracy in low- and middle-income countries.
Describing the modern view, developed from Malthus’s ideas, that continued growth in population and consumption will exceed the Earth’s resources and environmental limits unless growth is controlled.
The theoretical population size at which, with the available resources and technology, the standard of living or output per person is at its highest.
A situation in which the population of an area is too large for its resources and technology to support at an adequate standard of living, shown by poverty, unemployment, food shortages or environmental degradation.
A framework that sets limits for nine Earth-system processes, such as climate change, biosphere integrity and freshwater change, within which humanity can operate without risking abrupt or irreversible environmental change.
The careful and responsible management of resources by individuals, businesses, communities and governments so that they are used efficiently, conserved and passed on in good condition to future generations.
The use of resources and environments in ways that meet present needs without reducing their availability or quality for future generations, so that natural systems can continue to function indefinitely.
Development that meets the needs of the present without compromising the ability of future generations to meet their own needs (Brundtland Report, 1987), balancing economic, social and environmental goals.
Seventeen global goals with 169 targets, adopted by all UN member states in 2015 for achievement by 2030, which aim to end poverty and hunger, reduce inequality and protect the planet in all countries.
A resource is anything that people use to meet their needs: soil, water, forests, fish, minerals, energy and the ability of the environment to absorb waste. Some resources are renewable if they are managed carefully (forests, fish, groundwater that is recharged), while others are non-renewable on human timescales (oil, coal, metal ores). The central question is whether a growing and wealthier population can be supported by these resources indefinitely.
The idea of a limit is expressed by carrying capacity.
For animals, carrying capacity is set mainly by food and space. For people it is much harder to define, because technology raises yields, trade brings in resources from elsewhere and consumption per person varies enormously. Singapore supports about 6 million people on less than 800 km² because it imports almost all of its food and much of its water and energy; its carrying capacity is borrowed from other places.
Two related terms describe the balance between people and resources. Overpopulation occurs when there are too many people for the resources and technology available to maintain an adequate standard of living. Optimum population is the theoretical size at which resources are used most efficiently and living standards are highest; below it is underpopulation, where there are too few people to develop the resources fully.
The population at which resources are used best is harder to pin down.
Optimum population is a useful idea but almost impossible to measure, because it changes whenever technology, trade or values change. Australia has been described both as underpopulated (a vast area with resources and room for more people) and as overpopulated (dry soils, scarce water and fragile ecosystems that already struggle to support 27 million people at high levels of consumption). The answer depends on which resources are considered and what standard of living is assumed.
The pressure that people put on resources depends not only on how many people there are but on how much each person consumes and how that consumption is produced. The ecologists Paul Ehrlich and John Holdren expressed this in 1971 as the IPAT identity.
I is the environmental impact (resource use or pollution), P is population, A is affluence (consumption per person) and T is technology (impact per unit of consumption). Impact can rise because there are more people, because each person consumes more, or because production is more damaging; it can fall if cleaner technology lowers T faster than P and A rise.
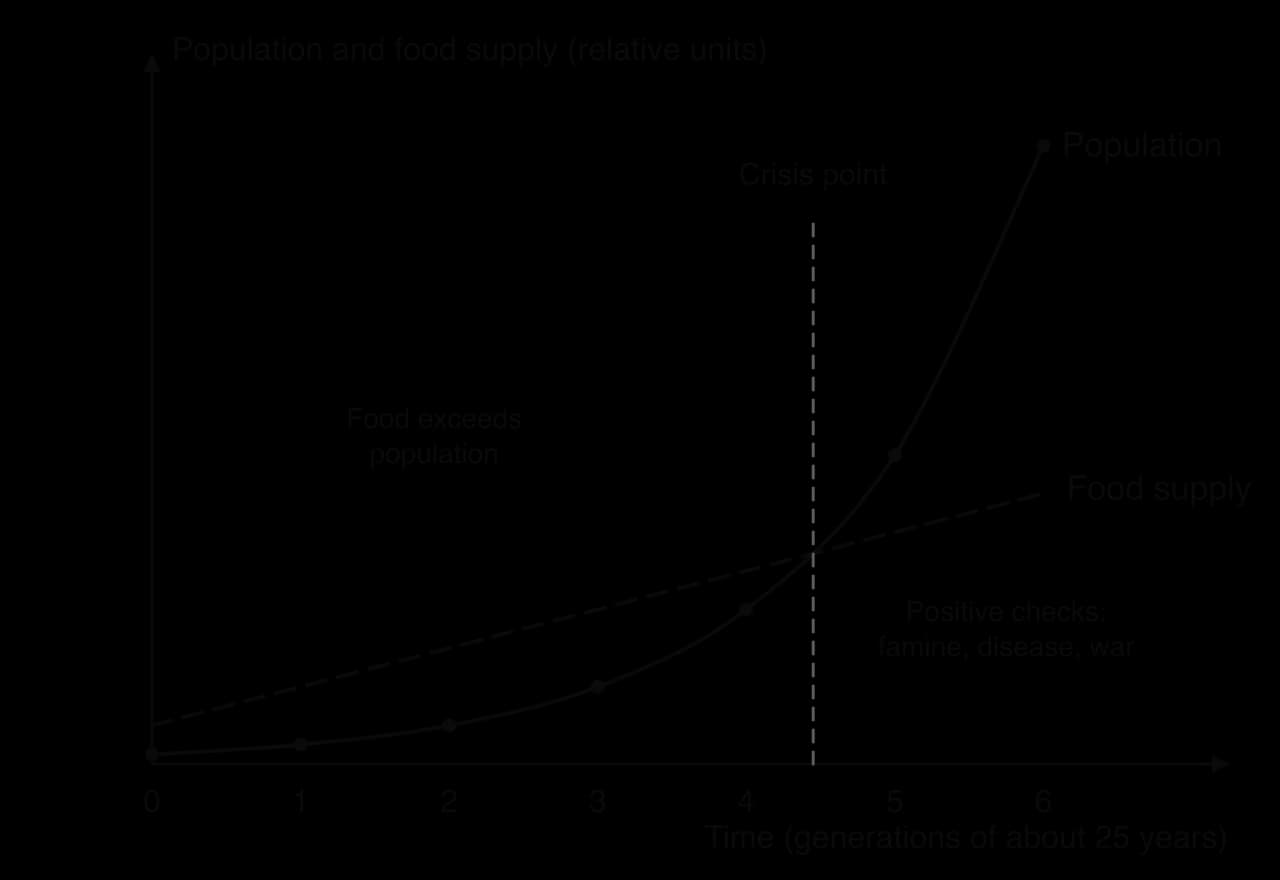
Malthusian theory comes from the English clergyman and economist Thomas Malthus, whose Essay on the Principle of Population was published in 1798. Malthus argued that population, if unchecked, grows geometrically (1, 2, 4, 8, 16…), doubling about every 25 years, while food production can grow only arithmetically (1, 2, 3, 4, 5…), because the amount of good farmland is limited and each new field adds less than the one before.
When population exceeded the food supply, Malthus argued, it would be held back by two kinds of check:
Positive checks raise the death rate: famine, disease, war and poverty.
Preventive checks lower the birth rate: “moral restraint”, meaning later marriage and celibacy. Malthus, a clergyman, rejected contraception.
Strengths | Limitations |
|---|---|
Recognises that resources are finite and that exponential growth cannot continue for ever on a finite planet | Food production grew faster than population after 1800, through new land, fertiliser, machinery and plant breeding: world cereal output rose about 4.2 times between 1961 and 2024 |
Explains some historical famines and crises in pre-industrial societies | Ignores trade: places can import food, as Singapore and the Gulf states do |
Influential: it shaped Darwin’s theory of natural selection and later environmental thinking | Did not foresee contraception or the demographic transition: fertility falls as societies develop |
Its logic applies to non-renewable resources and to waste sinks such as the atmosphere | Treats famine as a result of population, whereas modern famines are mostly caused by conflict, poverty and failures of access, not absolute shortage |
Neo-Malthusian thinkers revived Malthus’s argument in the second half of the 20th century, when world population was growing faster than ever, at about 2% a year in the 1960s. They extended it from food to all resources, to pollution and to the environment’s capacity to absorb waste.
The Population Bomb (1968): the biologist Paul Ehrlich warned that rapid population growth would cause mass famines in the 1970s and 1980s and called for strong population control.
The Limits to Growth (1972): a team at the Massachusetts Institute of Technology, commissioned by the Club of Rome, used a computer model (World3) of five variables: population, food production, industrial output, pollution and non-renewable resources. In its “business as usual” scenario, growth led to overshoot and collapse of population and industrial output during the 21st century. About 30 million copies were sold.
Planetary boundaries (2009): Johan Rockström and colleagues identified nine Earth-system processes, such as climate change, biosphere integrity and freshwater change, each with a boundary beyond which there is a risk of large and irreversible change. Four were judged to have been crossed in 2015, six in 2023, and the 2025 Planetary Health Check added ocean acidification as the seventh.
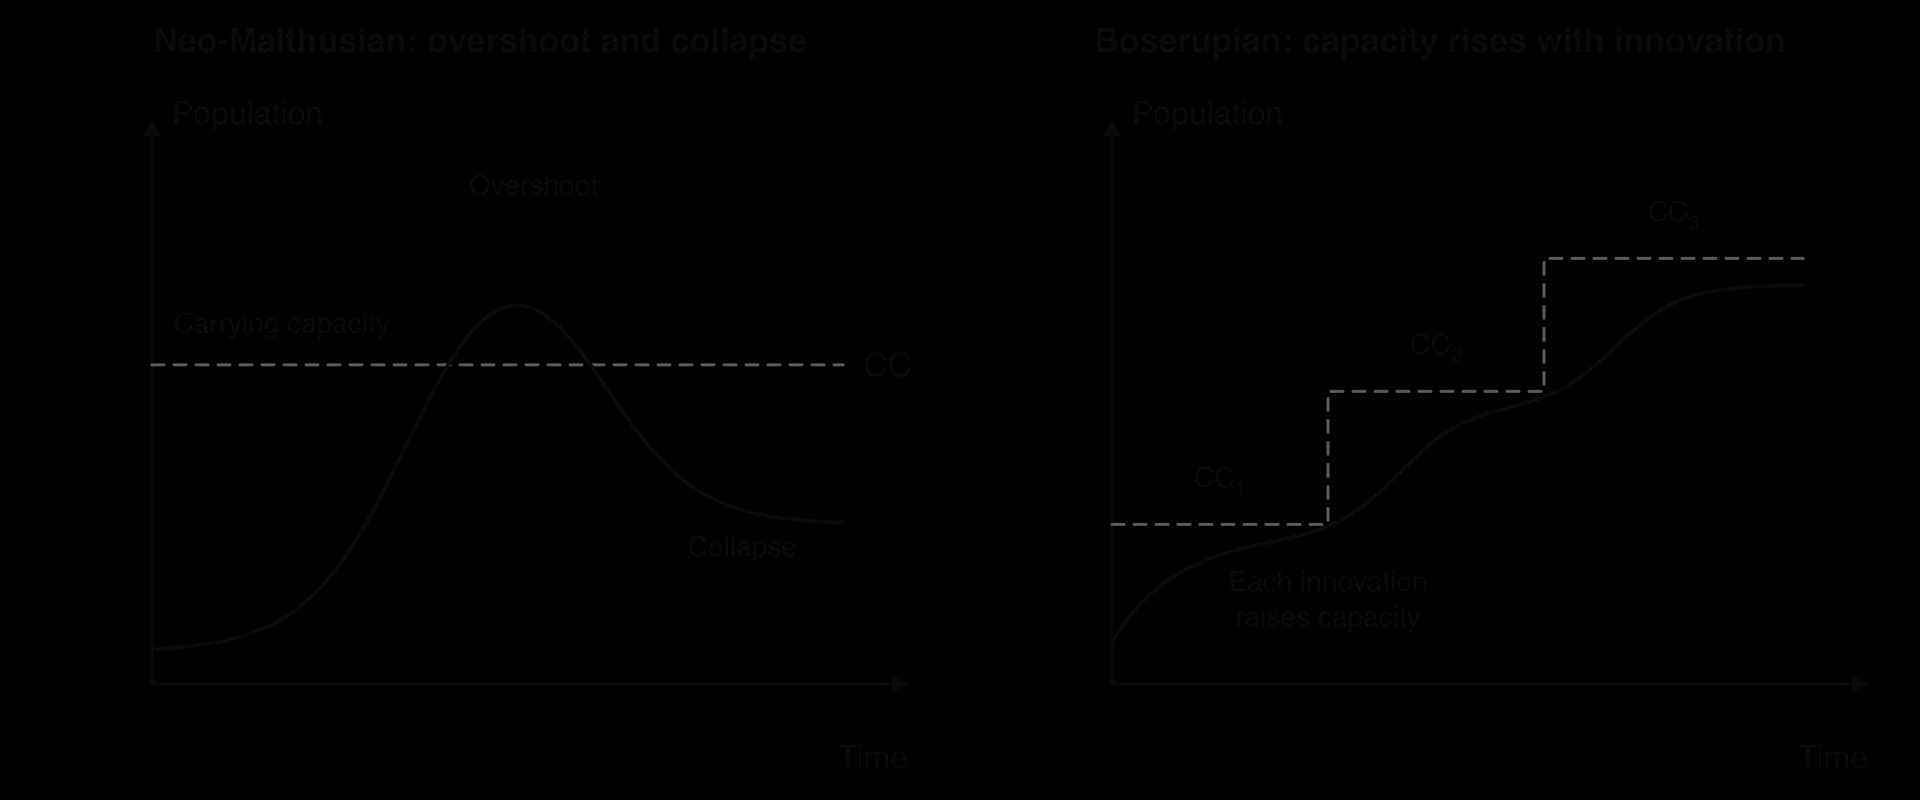
The difference between the two graphs is the assumption about carrying capacity. In the left-hand graph it is fixed, so growth above it uses up resources faster than they are renewed and leads to collapse. In the right-hand graph it rises each time people innovate, so population can keep growing in steps, provided innovation keeps pace.
Supporters of the neo-Malthusian view point to signs that humanity is already in overshoot, using renewable resources faster than they regenerate and producing more waste than ecosystems can absorb.

Ecological overshoot: Earth Overshoot Day fell on 31 December in 1972 but on 30 July in 2026, implying that humanity’s ecological footprint equals the biocapacity of about 1.7 Earths each year.
Collapse of renewable resources: the northern cod fishery off Newfoundland, Canada, collapsed from overfishing and was closed in 1992; stocks have still not fully recovered, and the closure ended the main livelihood of many coastal communities.
Groundwater depletion: aquifers that irrigate key farming regions, such as the High Plains (Ogallala) aquifer in the United States and the North China Plain, are being pumped faster than they recharge.
Climate change and planetary boundaries: emissions are overloading the atmosphere’s capacity to absorb carbon dioxide, and seven of nine planetary boundaries were judged to have been crossed by 2025.
Model performance: a 2008 comparison by Graham Turner of CSIRO found that real data for 1970–2000 closely matched the Limits to Growth business-as-usual scenario, and a 2020 analysis by Gaya Herrington concluded that, under business as usual, growth may stop and decline sharply around 2040.
Rwanda was the most densely populated country in mainland Africa in the early 1990s, and most families farmed very small plots on steep hillsides. A study by the economists Catherine André and Jean-Philippe Platteau of one commune in the north-west found that farms had become too small to feed many households, that land disputes within families were rising, and that land was increasingly held by a richer few. Some writers, including Jared Diamond in Collapse (2005), used such evidence to argue that land scarcity helped to drive the violence of the 1994 genocide, a neo-Malthusian reading.
Most historians reject population pressure as the main cause. The genocide was planned and organised by political and military leaders, drew on decades of ethnic division created under colonial rule, and took place during a civil war and an economic crisis caused partly by the collapse of coffee prices. Land scarcity may have made poor young men easier to mobilise and gave some people a motive to seize neighbours’ land, but it did not make violence inevitable. The case shows how neo-Malthusian arguments can turn a political event into a natural one, and why evidence of resource pressure has to be weighed against the decisions of people with power.
The famines predicted for the 1970s and 1980s did not occur on the scale forecast: India, which Ehrlich had expected to be unable to feed itself, became self-sufficient in cereals during the Green Revolution.
Fertility has fallen: world population growth has slowed from about 2% a year in the 1960s to below 1%, and the UN projects that population will peak in the 2080s, a result neo-Malthusian models of the 1960s did not foresee.
Falling real food prices: adjusted for inflation, world prices of staple foods such as wheat, rice and maize fell for most of the 20th century, despite short spikes in 1973–74, 2007–08 and 2022. If food were becoming scarce relative to population, its real price would have risen over the long run.
Resource prices: many resources did not run out as predicted, because higher prices encouraged exploration, substitution and recycling.
Poverty and politics: modern famines, such as those in Somalia in 2011 and Sudan since 2023, are caused mainly by conflict, drought combined with poverty, and the failure of food distribution, not by global food shortage.
Sources: Global Footprint Network, 2026; Wikipedia, “Planetary boundaries” and “The Limits to Growth”, 2026; World Bank WDI, 2026.
The Danish economist Ester Boserup turned Malthus’s argument around in The Conditions of Agricultural Growth (1965). From her studies of farming systems in Africa and Asia she concluded that population growth is not held back by the food supply; instead, population growth is what drives farmers to produce more food. Her view, known as Boserup’s theory, is often summarised as “necessity is the mother of invention”.
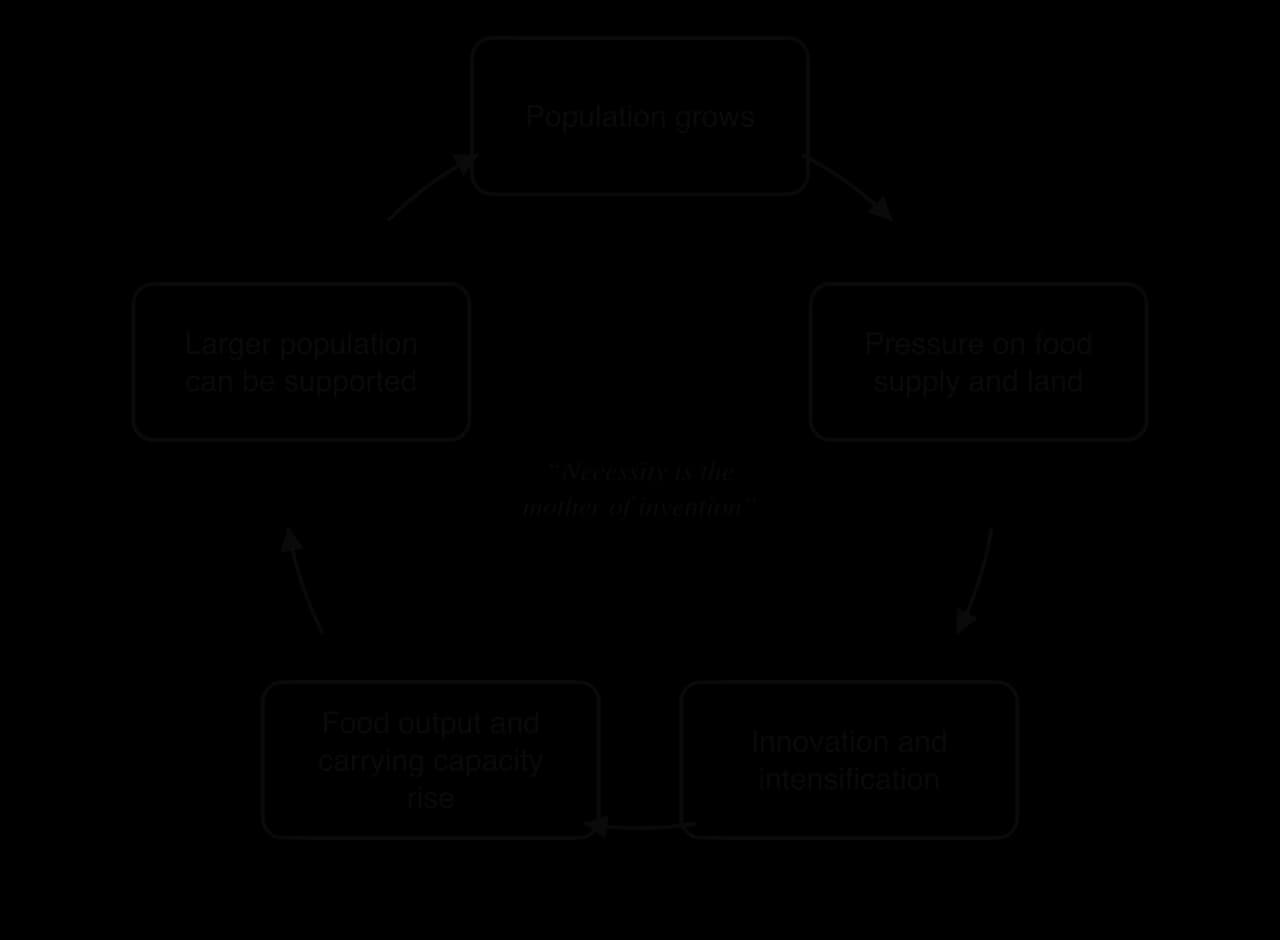
Boserup described how farming systems become more intensive as population density rises. Where land is plentiful, farmers use long fallows, clearing a plot, farming it for a year or two, then leaving it for 20 years or more. As density rises, fallows shorten, and farmers must invest more labour to keep the soil fertile: manuring, ploughing, terracing, irrigation and growing several crops a year on the same land. This is agricultural intensification.
Stage of intensification | Typical fallow | Example of method |
|---|---|---|
Forest fallow (shifting cultivation) | 20–25 years | Slash-and-burn clearing in low-density rainforest |
Bush fallow | 6–10 years | Shorter rotations, hoe cultivation |
Short fallow | 1–2 years | Ploughing, use of animal manure |
Annual cropping | None, or a few months | Crop rotation, fertiliser |
Multi-cropping | None: two or three crops a year | Irrigated rice terraces in densely populated parts of Java and southern China |
The best-known evidence for Boserup’s theory comes from Machakos District, south-east of Nairobi in Kenya’s semi-arid eastern highlands. In the 1930s colonial officials were deeply concerned about the area: photographs from 1937 show bare hillsides with deep gullies, sheet erosion and few trees, and officials linked poverty, famine and land degradation to population growth. Over the next 60 years the district’s population grew about fivefold.
A study by Mary Tiffen, Michael Mortimore and Francis Gichuki, published in 1994 as More People, Less Erosion, found that the landscape had recovered rather than collapsed. Photographs from 1991 of the same hillsides show terraced fields, planted trees (fruit, coffee and timber) and healed gullies, and output per hectare and incomes per person had risen faster than population.
The authors argued that population growth supplied the labour for terracing and the local market for produce, while secure land tenure, new roads, access to markets in Nairobi and the spread of schooling helped farmers invest. Critics accept that erosion fell but point to declining soil fertility since, and note that much household income came from jobs in Nairobi, so the case may be hard to repeat elsewhere.
Sources: Drylands Research and IIED, “The Machakos study”, 2026; Mail & Guardian, 9 April 1998.
The Green Revolution is often presented as Boserup’s theory at a global scale. From the 1960s, scientists bred high-yielding varieties (HYVs) of wheat and rice, such as the rice IR8 released by the International Rice Research Institute in the Philippines in 1966, which responded strongly to fertiliser and irrigation. Norman Borlaug, who led wheat breeding in Mexico, received the Nobel Peace Prize in 1970. India and Pakistan doubled wheat production within a few years, and India became self-sufficient in cereals.
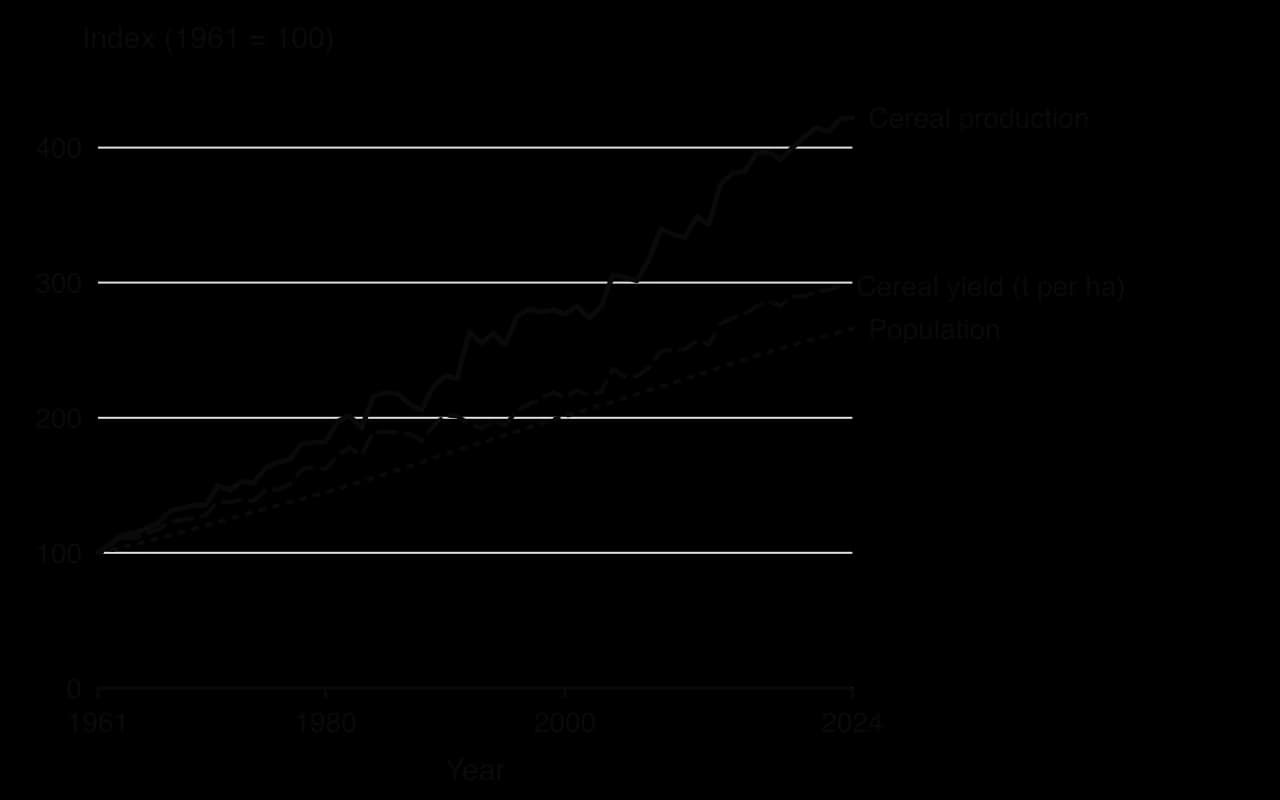
The chart shows that between 1961 and 2024, world population rose about 2.7 times, from 3.1 billion to 8.1 billion, while cereal production rose about 4.2 times, from 741 million to 3,130 million tonnes. Most of the increase came from higher yields: average cereal yield rose from 1.42 t per hectare in 1961 to 4.23 t in 2023. The cropped area grew much less. This is the strongest single piece of evidence against Malthus’s assumption that food could grow only arithmetically.
The Green Revolution also had costs. Irrigation from tube wells has lowered water tables in north-west India; heavy fertiliser and pesticide use has polluted rivers and soils; the new varieties replaced many traditional crop varieties, reducing genetic diversity; and richer farmers who could afford seeds, fertiliser and pumps often gained more than poor farmers and landless labourers. The Green Revolution had much less effect in sub-Saharan Africa, where most farming is rain-fed, rather than irrigated, and markets for inputs are weaker.
Cornucopian thinkers go further than Boserup. The economist Julian Simon argued in The Ultimate Resource (1981) that human ingenuity is the ultimate resource: when a resource becomes scarce, its price rises, which encourages people to find more of it, use it more efficiently or replace it with something else. More people mean more minds to solve problems.
In 1980 Simon challenged Paul Ehrlich to a bet. Ehrlich chose five metals (chromium, copper, nickel, tin and tungsten) and US$1,000 was notionally invested in them; if their inflation-adjusted price rose by 1990, Ehrlich would win. Although world population grew by more than 800 million during the decade, all five prices fell, and Ehrlich paid Simon US$576.07. Later analysis showed that Simon would have lost over many other ten-year periods, so the bet proved less than it seemed.
Modern examples used by optimists include the Netherlands, one of the world’s largest exporters of food by value despite its small area, through intensive greenhouse farming; vertical farms in cities such as Singapore; desalination in the Gulf states; and the rapid fall in the cost of solar and wind power. Critics reply that substitution has limits: there is no substitute for fresh water, fertile soil or a stable climate, and technology often increases total resource use by making it cheaper.
Malthus and neo-Malthusians | Boserup and cornucopians | |
|---|---|---|
View of population growth | A threat that will exceed resources | A stimulus to innovation; people are a resource |
Carrying capacity | Fixed, or rising slowly | Raised by technology and investment |
Response needed | Limit population and consumption | Invest in technology, markets and education |
Supporting evidence | Overshoot, fisheries collapse, groundwater depletion, planetary boundaries | Green Revolution, Machakos, falling real resource prices |
Main weakness | Underestimates technology, trade and falling fertility | Underestimates environmental costs, inequality and absolute limits |
Scale at which it fits best | Global systems (climate, oceans) and fragile local environments | Farming systems where markets, tenure and investment are available |
Between the pessimistic and optimistic views lies a balanced position. It accepts that resources and ecosystems have limits, as the neo-Malthusians argue, and that people can innovate and manage resources better, as Boserup argued. The key ideas are sustainability, sustainable development and resource stewardship.
Sustainable development applies this idea to development. The most widely used definition comes from the Brundtland Report, Our Common Future, published by the World Commission on Environment and Development in 1987.
Sustainable development is development that meets the needs of the present without compromising the ability of future generations to meet their own needs.
— World Commission on Environment and Development, Our Common Future, 1987
Sustainable development is usually described as having three dimensions, or pillars: environmental (conserving resources and ecosystems), economic (growth and jobs) and social (equity, health and education). The pillars often conflict. A coal mine may provide jobs and electricity (economic, social) while damaging the climate and local water (environmental), and different stakeholders weigh the three differently.
Resource stewardship is the practical approach that follows from these ideas.
A steward looks after something on behalf of others. The idea implies that resources are held in trust for future generations, for other places and for other species, not owned outright. Stewardship works at every scale:
Scale | Stewards | Examples of stewardship |
|---|---|---|
Individual and household | Consumers | Reducing food waste, repairing rather than replacing, using public transport |
Local | Communities, municipalities, firms | Kalundborg’s industrial symbiosis; community forest management; Amsterdam’s circular strategy |
National | Governments | Rwanda’s ban on plastic bags (2008); energy and water efficiency standards |
International | Trade blocs, UN agencies, treaties | EU right-to-repair rules (2024); the Sustainable Development Goals; the Montreal Protocol on the ozone layer |
Corporate | Transnational corporations | Take-back and repair schemes; certified supply chains; corporate social responsibility |
Debates about resource use often turn on how the problem is defined. Two debates run through discussions of resource use: whether the main pressure comes from population growth or from consumption, and whether the solution lies in technology or in restraint.
From one perspective, rapid population growth in low-income countries, especially in sub-Saharan Africa, is the main threat, because it increases demand for land, water, fuelwood and food in places that are already stressed. From another, consumption in high-income countries is the larger problem, because each person there uses far more resources and produces far more waste and emissions.
Country | CO₂ emissions per person, 2024 (t) | Total fertility rate, 2024 |
|---|---|---|
Qatar | 41.3 | 1.7 |
United States | 14.2 | 1.6 |
China | 8.7 | 1.0 |
Germany | 6.8 | 1.4 |
World | 4.7 | 2.2 |
India | 2.2 | 2.0 |
Nigeria | 0.58 | 4.4 |
Niger | 0.12 | 5.9 |
Sources: Global Carbon Budget via Our World in Data, 2025 (CO₂ per person, 2024); World Bank WDI (SP.DYN.TFRT.IN), 2026.
The table shows an inverse relationship: the countries with the highest fertility have the lowest emissions per person. A person in Qatar emitted more than 340 times as much CO₂ as a person in Niger in 2024, and a person in the United States about 6.5 times as much as a person in India. On this evidence, adding one more person in Niger adds far less pressure on the climate than adding one more person in the United States, and slowing population growth in low-income countries would do little to reduce global emissions in the short term.
The population perspective still matters at the local scale. In parts of the Sahel and the Ethiopian highlands, rising rural populations farm smaller plots and steeper slopes, and depend on fuelwood, so local pressure on soils, water and forests is real. The two perspectives therefore apply at different scales: consumption dominates global pressures such as climate change, while population growth can dominate local pressures in poor rural areas.
Technology optimists (often governments and businesses) argue that renewable energy, efficiency, recycling and new farming methods can allow growth to continue while impacts fall, an idea known as “green growth” or decoupling.
Advocates of restraint (some environmental groups and “degrowth” economists) argue that efficiency gains are cancelled out by rising consumption, so high-income societies must consume less.
Development perspectives (many governments of low- and middle-income countries) stress that their citizens need more energy, food and materials to escape poverty, and that limits should apply first to those who have consumed most.
Indigenous and local perspectives often emphasise long-term relationships with land and responsibility to future generations, close to the idea of stewardship.
A shrinking or ageing population can still increase resource use if consumption per person rises. Smaller households use more energy and materials per person (more homes, more appliances), and older, wealthier populations may travel and consume more. Japan’s population has been falling since 2008, yet its consumption of energy and materials per person remains high. The IPAT identity shows why: impact depends on population and affluence and technology.
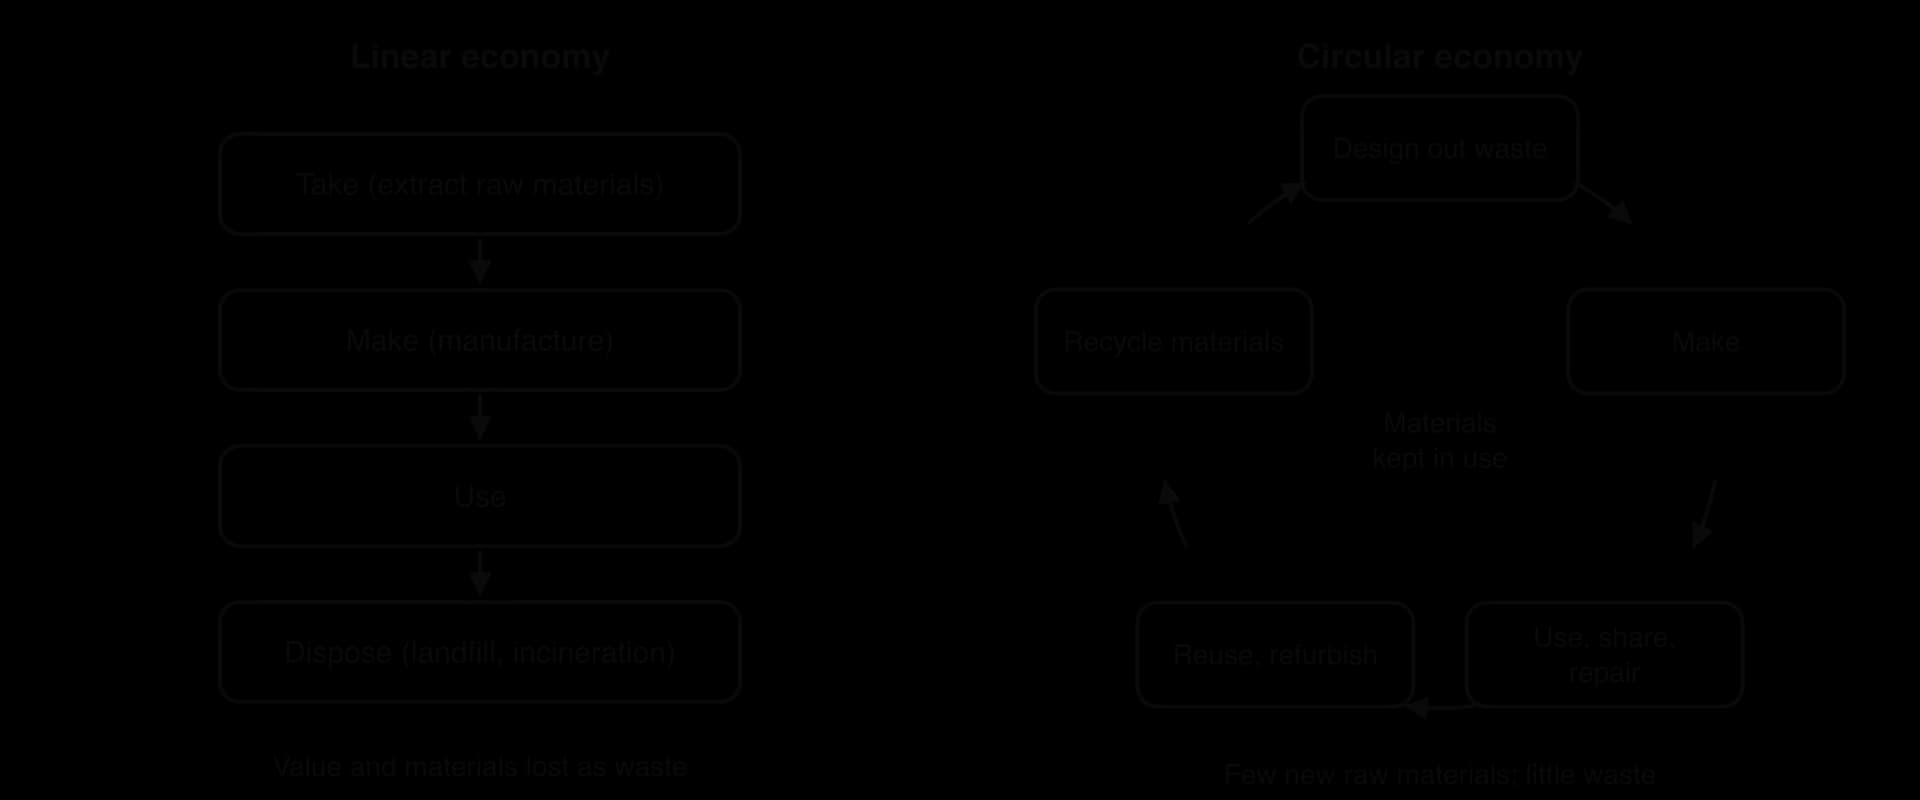
Most of the world economy is a linear economy: raw materials are taken from the environment, made into products, used, and then thrown away. The model depends on cheap materials and energy and on places to dump waste, and it loses the value of materials at the end of each product’s life.
A circular economy aims to keep materials and products in use for as long as possible, so that fewer raw materials are extracted and less waste is produced. It is a systems approach: instead of treating extraction, manufacture, use and disposal as separate stages, it designs the whole system as a set of loops, in the same way that nutrients cycle in an ecosystem.
The Ellen MacArthur Foundation, founded in 2010 and the main promoter of the idea, sets out three principles:
Design out waste and pollution: products are designed from the start to be durable, repairable and easy to take apart, and to avoid toxic materials.
Keep products and materials in use: through sharing, maintenance, reuse, refurbishment, remanufacturing and, last of all, recycling.
Regenerate natural systems: return biological materials (food waste, wood, natural fibres) safely to the soil, and farm in ways that rebuild soils and biodiversity.
 YouTube
The Foundation’s “butterfly diagram” separates two kinds of material. Technical materials, such as metals, plastics and glass, cannot safely return to nature, so they must be kept circulating in the economy. Biological materials, such as food, wood and cotton, can be returned to the biosphere after use.
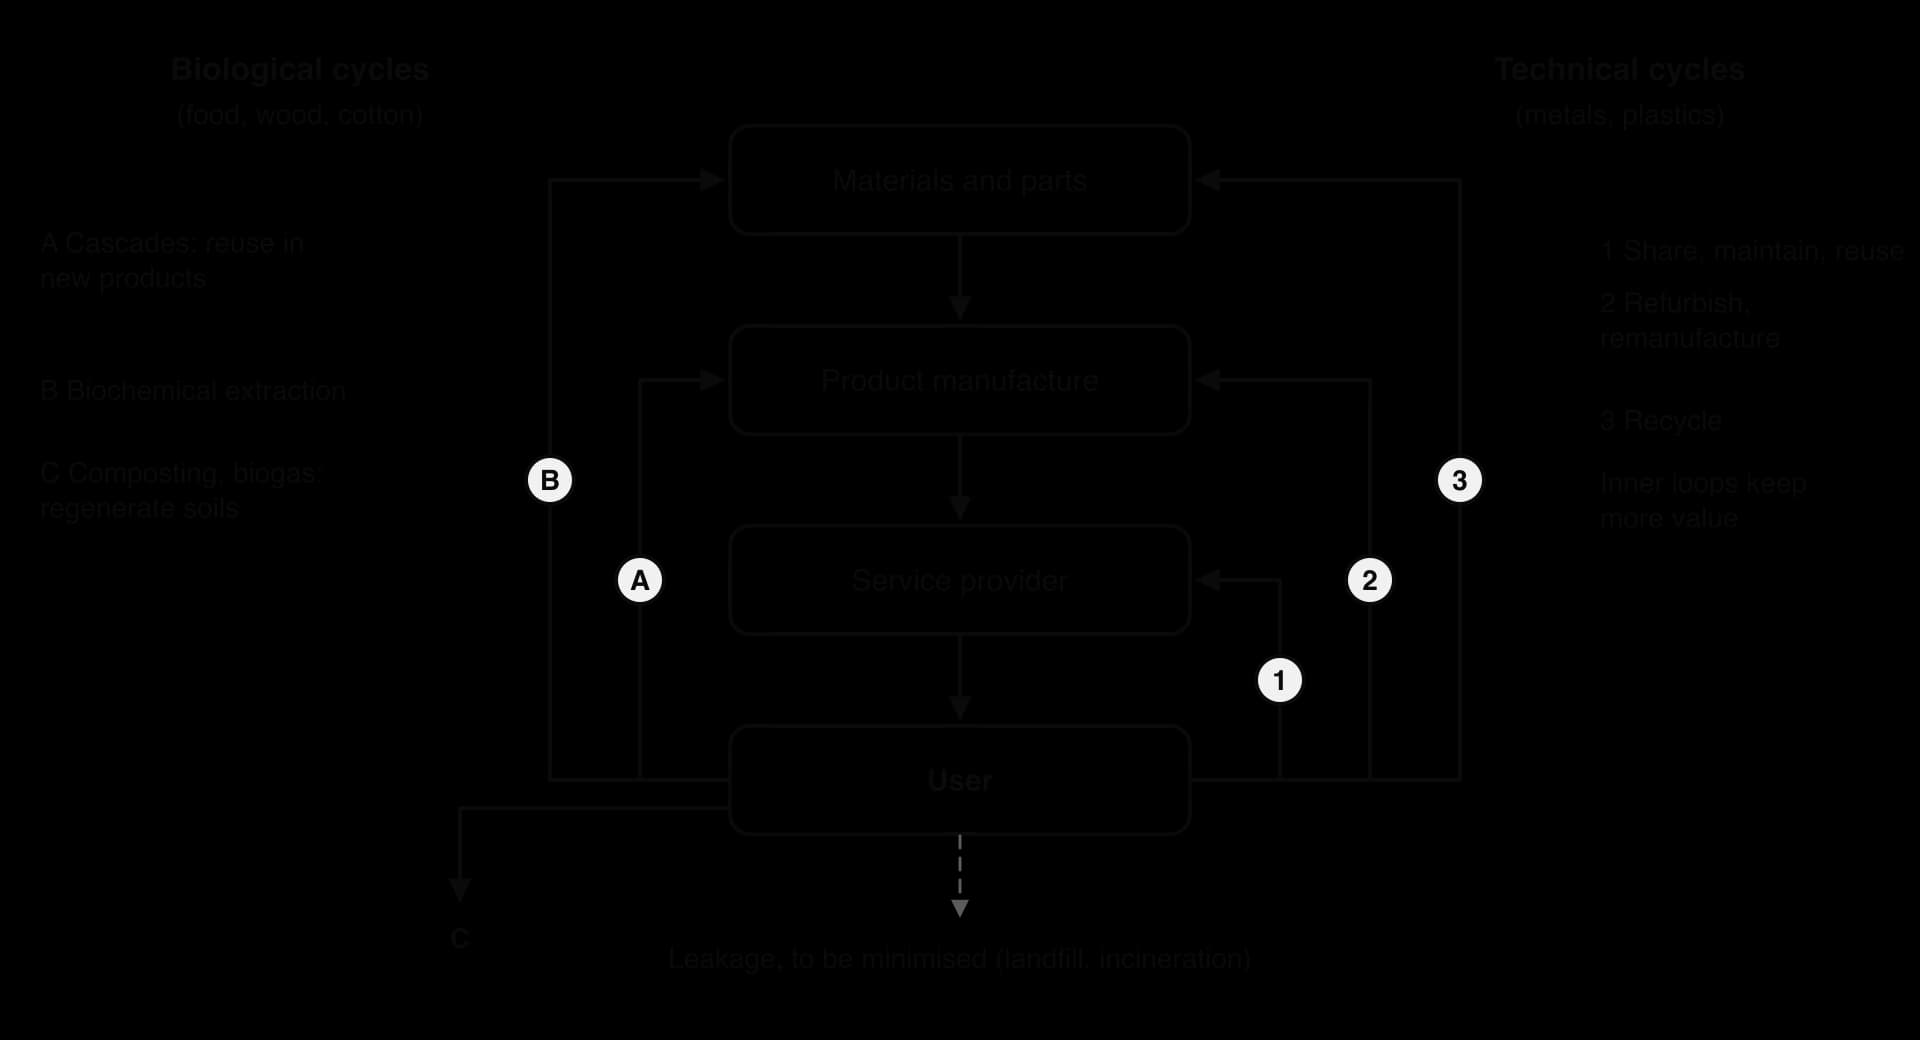
The diagram shows why recycling is not the main goal of a circular economy. Repairing a phone keeps the whole product, its parts and the energy used to make it in use; recycling it recovers only some of the metals, uses energy and loses the value of the assembled product. The tighter the loop, the more value is kept. This order of priority is the same as the waste hierarchy: reduce, reuse, recycle, recover energy, and dispose of waste only as a last resort.
Scale | Example | What it does |
|---|---|---|
Local (industrial) | Kalundborg Symbiosis, Denmark | Firms exchange steam, water, gypsum and other by-products, so one firm’s waste becomes another’s input |
City | Amsterdam Circular Strategy (2020) | Based on Kate Raworth’s “doughnut” model; aims to halve the use of new raw materials by 2030 and become fully circular by 2050 |
National | Rwanda’s plastic bag ban (2008, extended to other single-use plastics in 2019) | Bans non-biodegradable bags to cut waste and litter |
Regional | EU Circular Economy Action Plans (2015, 2020) and Right to Repair Directive (2024) | Ecodesign rules; manufacturers must offer repair at a reasonable price; the legal guarantee is extended by a year when consumers choose repair |
Corporate | Take-back, resale and repair schemes (Dell’s free computer recycling; clothing resale by fashion brands such as Patagonia and Eileen Fisher) | Keep products in use and recover materials |
Sources: Wikipedia, “Right to repair”, “Circular economy” and “Kalundborg Eco-industrial Park”, 2026; European Commission, 2026.
Industrial symbiosis is the circular economy applied to a group of firms in one area. It works best where several large industries with complementary flows are close together, because steam, water and bulky by-products are expensive to transport. Kalundborg, the world’s best-known example, is the extended case study.
Strengths | Limitations |
|---|---|
Reduces extraction of raw materials and the waste sent to landfill | Less than 10% of the world economy is circular (Circle Economy estimated 8.6% in 2020) |
Saves firms money (Kalundborg’s firms save up to US$15 million a year) | Recycling and remanufacturing need energy and transport; materials degrade with each cycle (downcycling) |
Cuts emissions: Circle Economy estimates that full adoption could cut global emissions by about 39% | Rebound effect: cheaper reused goods can raise total consumption |
Creates jobs in repair, refurbishment and recycling | Complex products (phones, batteries, composite materials) are hard to separate; matter cannot be recycled endlessly |
A systems approach: links firms, households and governments | Firms that profit from selling new products may resist; “circular” claims can be greenwashing |
Reduces dependence on imported materials (energy security and resource security) | Can cost jobs in exporting and waste-processing economies in the Global South |
The circular economy is most effective for materials that are valuable, bulky and easy to separate, such as steel, aluminium, paper, glass and water, and least effective for mixed plastics and complex electronics. It complements, rather than replaces, reducing total consumption: a circular economy that keeps growing its material use still puts pressure on resources. Its value as a stewardship strategy therefore depends on combining circular design with lower overall demand in high-income countries.
The Millennium Development Goals (MDGs) were eight goals agreed by UN member states in 2000 for the period to 2015, such as halving extreme poverty and hunger, achieving universal primary education and reducing child mortality. They focused on low- and middle-income countries and were funded largely through aid. Their best-known target, halving the share of people in extreme poverty from its 1990 level, was met about five years early.
The Sustainable Development Goals (SDGs) replaced them in 2015. Adopted by all 193 UN member states in September 2015 as part of the 2030 Agenda for Sustainable Development, they set 17 goals and 169 targets for 2030. Progress on each target is tracked by one or more indicators; after the refinements agreed by the UN Statistical Commission in March 2026, the framework has 234 unique indicators.
MDGs (2000–2015) | SDGs (2015–2030) | |
|---|---|---|
Number | 8 goals, 21 targets | 17 goals, 169 targets |
Who they apply to | Mainly low- and middle-income countries | All countries, including high-income countries (universal) |
How they were made | Mostly by experts at the UN | Through negotiation among governments with wide consultation of civil society |
Focus | Poverty, health, education | Poverty and development together with the environment, inequality, cities, consumption and peace |
The SDGs most closely linked to resources are SDG 2 (zero hunger), SDG 6 (clean water and sanitation), SDG 7 (affordable and clean energy), SDG 12 (responsible consumption and production, which includes halving food waste and reducing waste through prevention, reuse and recycling) and SDG 13 (climate action). SDG 12 makes resource stewardship a target for every country: high-income countries, with the largest footprints, have the most to change.
The UN’s Sustainable Development Goals Report 2025, its tenth annual stocktake, concluded that the goals have improved millions of lives but that the pace of change is too slow to meet them by 2030. Of the targets with enough data to measure a trend, only 35% were on track or making moderate progress, nearly half were moving too slowly or making only marginal progress, and 18% had gone backwards. The 2026 report, released in July 2026 with four years left, gave a similar picture: 36% of assessable targets on track or making moderate progress, nearly half stalled and 15% regressed.
Independent assessments reach the same conclusion. The SDG Index of the Sustainable Development Solutions Network (SDSN) scores every country on all 17 goals; its 2026 edition found only 16% of the targets on course globally. Finland, Sweden and Denmark ranked highest, and 19 of the top 20 countries were in Europe. The index also counts the “spillovers” that rich countries create elsewhere through their consumption, which lowers the standing of many high-income countries on SDG 12.
Sources: United Nations, The Sustainable Development Goals Report 2025 and 2026; SDSN, Sustainable Development Report 2026 (dashboards.sdgindex.org, accessed October 2026).
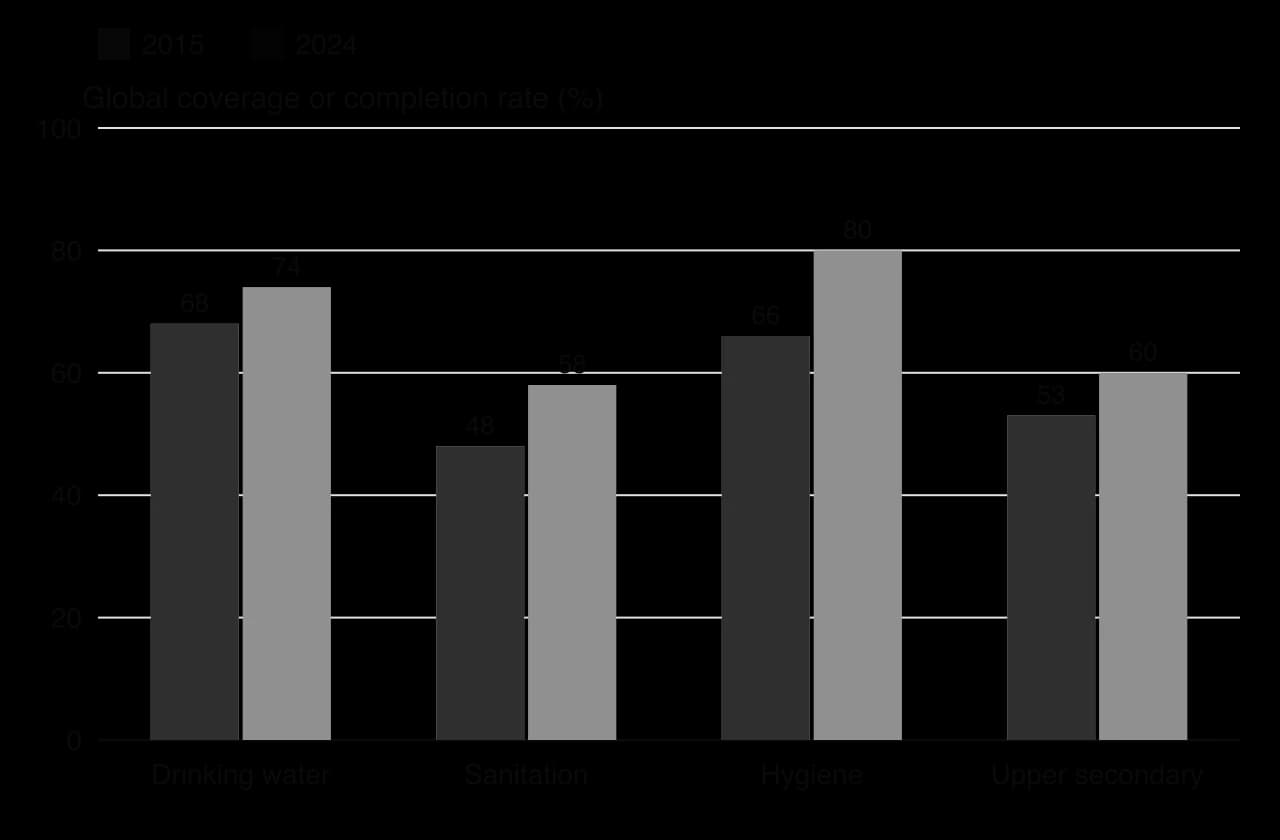
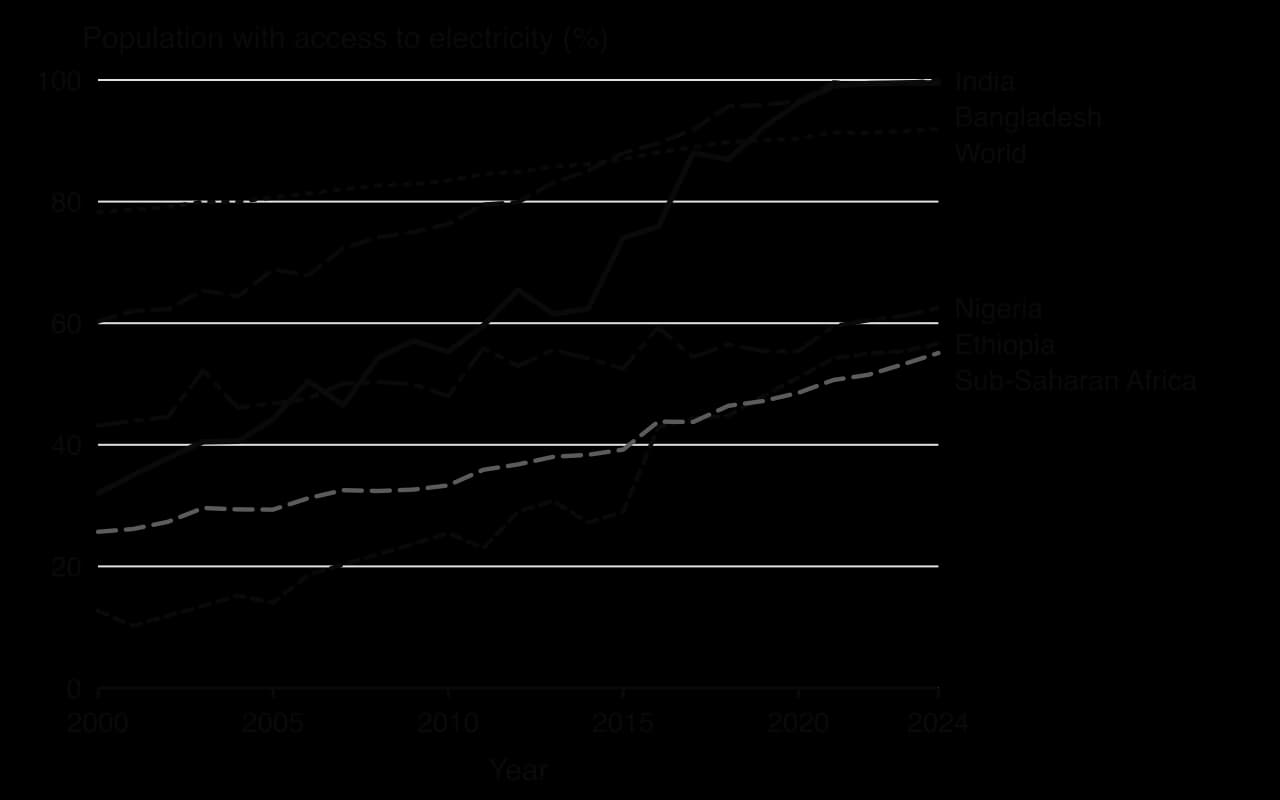
Access to electricity has grown steadily, to 92% of the world’s population in 2023, and 45 countries had reached universal access. Bangladesh is one of the clearest successes: the share of its population with electricity rose from 32% in 2000 to 99.5% in 2023, through expansion of the grid and millions of solar home systems in rural areas. India reached almost universal access in the same period.
Progress on hunger has gone into reverse. The share of the world’s population that was undernourished fell from 13% in 2001 to about 7.2% in 2017, but rose again with the COVID-19 pandemic, conflict and high food prices; nearly 1 in 11 people faced hunger in 2023. In sub-Saharan Africa undernourishment rose from 17.8% in 2013 to 22.3% in 2024, so SDG 2 (zero hunger by 2030) will not be met there.

Indicator (UN SDG Report 2025 unless stated) | Progress |
|---|---|
Extreme poverty | More than 800 million people, nearly 1 in 10, still lived in extreme poverty in 2025; only one in five countries is on track to halve national poverty by 2030 |
Water and sanitation | 2.1 billion people lacked safely managed drinking water and 3.4 billion safely managed sanitation in 2024 (WHO/UNICEF JMP, 2025) |
Clean cooking | 2.1 billion people still lacked clean cooking fuels and technologies in 2023 |
Renewable energy | The fastest-growing energy source, projected to overtake coal as the main source of electricity in 2025 |
Finance | Developing countries face an SDG financing gap of about US$4 trillion a year; official development assistance fell by 6.1% in 2024 and by 23.1% in 2025 |
Sources: United Nations, The Sustainable Development Goals Report 2025: Key Findings, 14 July 2025; WHO/UNICEF Joint Monitoring Programme, 2025; OECD, preliminary ODA data, April 2026.
Shocks: the COVID-19 pandemic (2020–2022) pushed millions back into poverty and interrupted schooling; conflicts in Sudan, Gaza, Ukraine and the Sahel have increased hunger and displacement.
Finance and debt: low- and middle-income countries faced record debt-service costs of US$1.4 trillion in 2023, leaving less money for health, education and infrastructure.
Climate change: droughts, floods and heat damage harvests and infrastructure, hitting the countries least able to respond.
Place: progress is fastest in East and South Asia and slowest in sub-Saharan Africa and in fragile and conflict-affected states, which were projected to hold more than three-quarters of the world’s extreme poor by 2025.
Data gaps: many targets cannot be measured in many countries, so progress on them is unknown.
The SDGs have real strengths: they are universal, so high-income countries are also judged on consumption, emissions and inequality; they link economic, social and environmental goals; they give civil society a common framework to hold governments to account; and they guide spending by governments, aid agencies and businesses. Their weaknesses are that they are voluntary and not legally binding, that 169 targets are too many to prioritise, that some goals conflict (economic growth under SDG 8 and lower resource use under SDG 12), and that progress depends on finance that has not been provided.
The SDGs work best as a shared measuring stick rather than as a plan. Whether a target is met depends on national power and capacity: Bangladesh met its electricity goal because its government invested and donors supported it, while countries in conflict cannot deliver basic services however clear the target. The possibility of meeting the goals by 2030 is now small for most targets, but they have changed what governments measure and report.
Resource stewardship strategies operate at every scale, and their effectiveness depends on the scale of the problem, the power of those involved and the incentives they face.
Scale | Examples | Strengths | Limitations |
|---|---|---|---|
Local | Kalundborg Symbiosis; community forests; city repair cafés | Practical, trusted, quick to act; benefits are visible to participants | Small impact on global problems; depends on local conditions that are hard to copy |
National | Rwanda’s plastic bag ban; Bangladesh’s electrification; Germany’s renewable energy laws | Governments can legislate, tax and invest at large scale | Depends on political will and capacity; can shift problems abroad (importing goods instead of producing them) |
Regional | EU Circular Economy Action Plan and Right to Repair Directive | A large single market can set standards that manufacturers worldwide follow | Slow negotiation; uneven application between member states |
Global | SDGs; Paris Agreement; Montreal Protocol | Matches the scale of global problems; shared goals and data | Voluntary; weak enforcement; the most powerful states can ignore them |
The most successful example of global stewardship, the Montreal Protocol of 1987, which phased out ozone-depleting chemicals, succeeded because substitutes existed, a small number of firms produced the chemicals and every country signed. Most resource problems lack these conditions. Local schemes are often most effective at what they do, but too small to change global trends on their own; global agreements match the scale of the problem but depend on national action. Effective stewardship therefore needs multi-scale action, in which global goals are carried out through national laws and local practice.
Kalundborg is a small port town on the west coast of Zealand, Denmark, about 100 km west of Copenhagen. It is home to the world’s best-known example of industrial symbiosis, in which a power station, an oil refinery, pharmaceutical and enzyme plants, a plasterboard factory, the municipality and its utilities exchange energy, water and materials. The organisation that coordinates it, Kalundborg Symbiosis, describes itself as an umbrella for seventeen public and private companies.
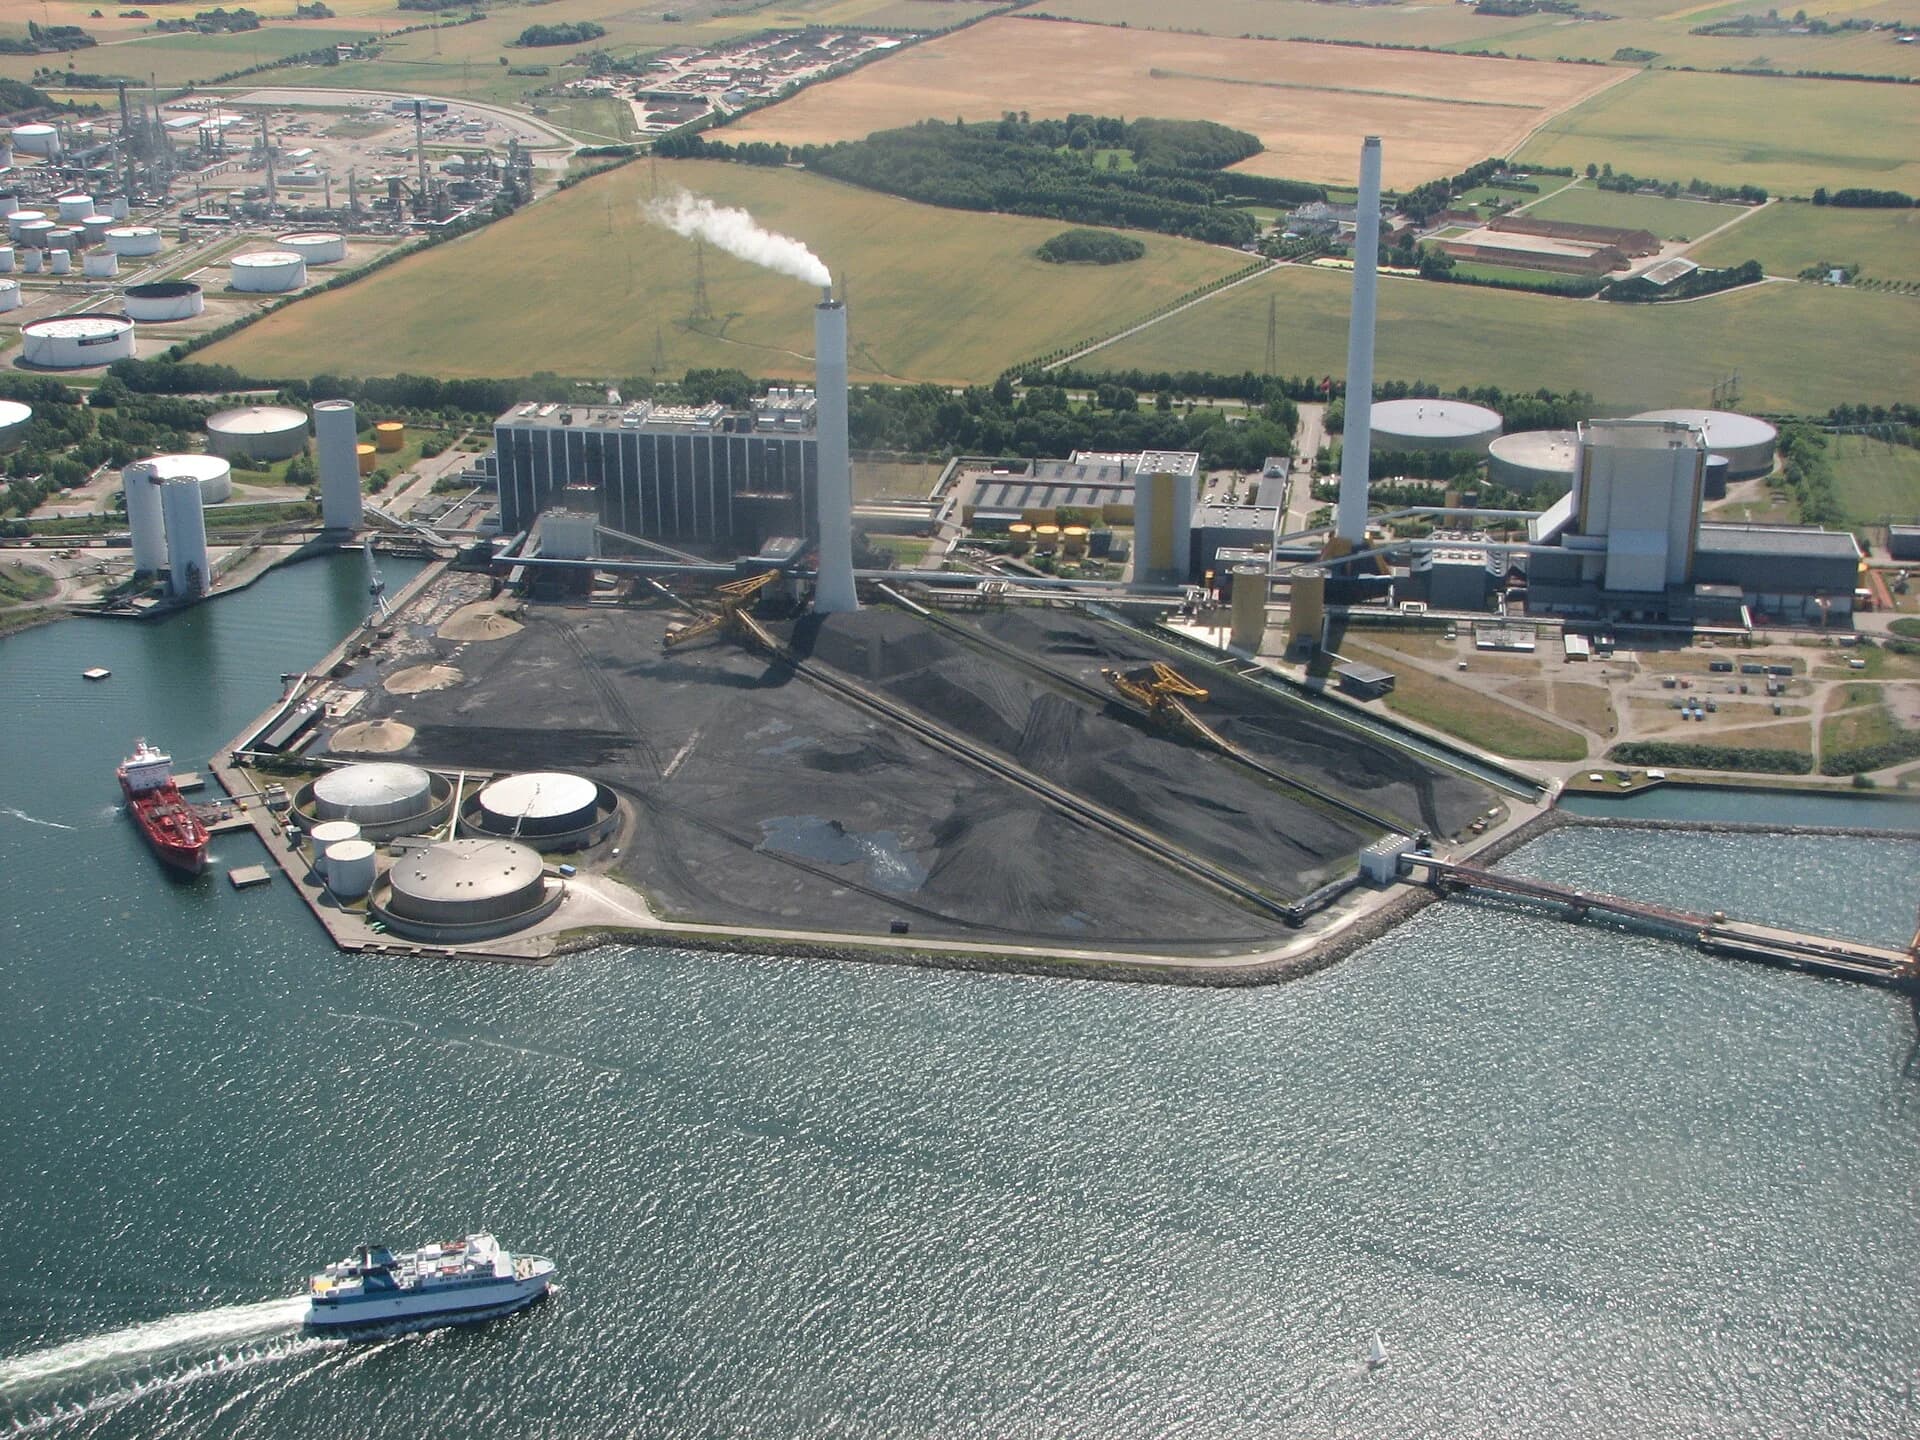
The symbiosis was not planned. Asnæs power station opened in 1959 and an oil refinery soon after. The first exchange came in 1972, when a pipeline began carrying surplus gas from the refinery to Gyproc’s plasterboard factory.
Further links were added one at a time over the next two decades, each negotiated as a separate commercial deal that went ahead only if it saved both partners money: in 1981 the municipality began using waste heat from the power station for district heating; from 1982 the refinery and the pharmaceutical firm Novo Nordisk bought steam from the power station; and from 1993 gypsum from the power station’s flue-gas cleaning replaced imported natural gypsum at Gyproc.
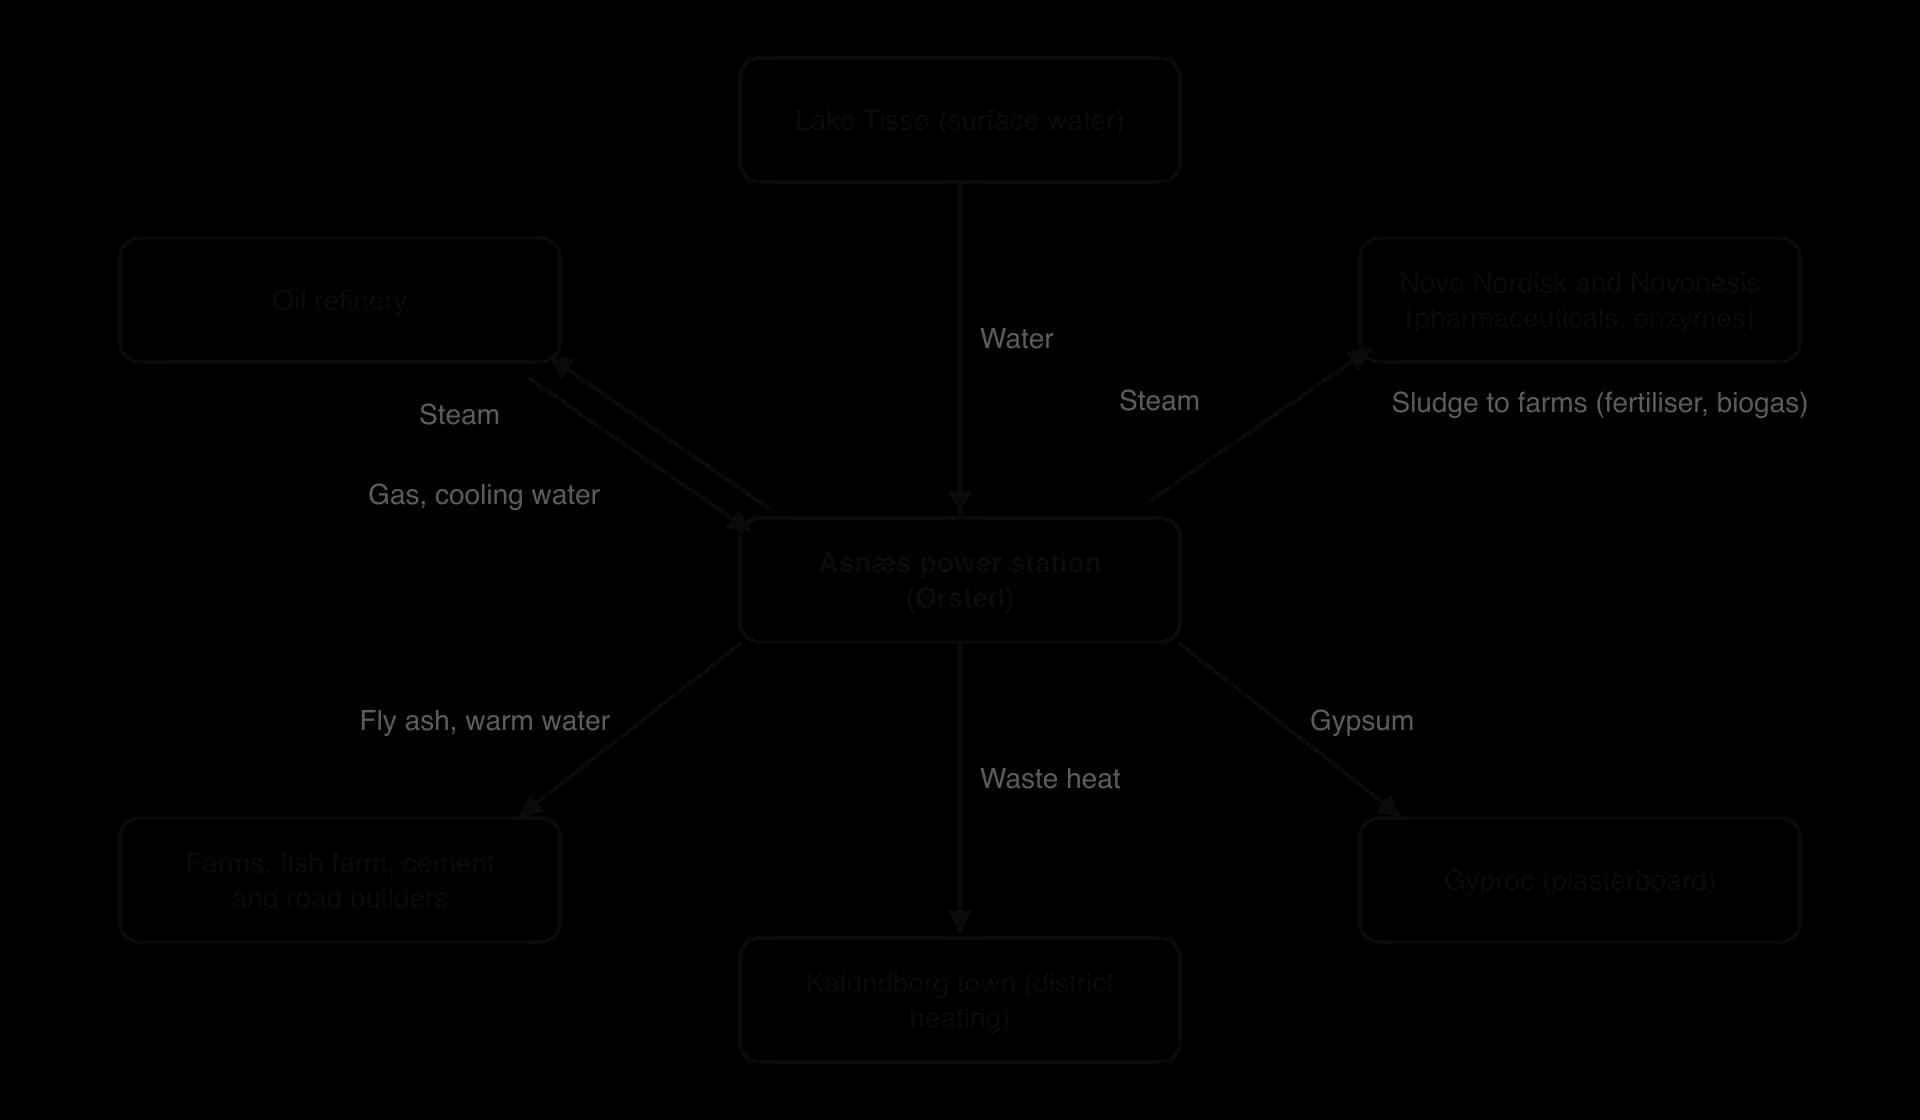
Energy: steam from Asnæs meets 40% of the refinery’s steam needs and all of Novo Nordisk’s; the refinery’s waste gas fuels the power station; waste heat warms about 3,500 homes and a fish farm.
Water: cooling water and treated wastewater are reused. By 2002 exchanges supplied over 95% of the power station’s water, up from 70% in 1990.
Materials: gypsum from flue-gas desulphurisation goes to Gyproc; fly ash goes to cement makers and road building; sulphur from the refinery goes to a sulphuric acid producer; sludge from the pharmaceutical plants is used as fertiliser and to produce biogas.
Measure (estimates, about 2004 unless stated) | Value |
|---|---|
Groundwater saved per year | About 2.9 million m³ |
Surface water saved per year | About 1 million m³ |
Gypsum reused instead of mined | About 170,000 t |
Coal saved by Asnæs (1997) | 30,000 t, about 2% of its use |
Fly ash and clinker diverted from landfill (1997) | 200,000 t |
Total investment in the exchanges | About US$78.5 million |
Annual savings for the partners | Up to US$15 million |
Accumulated savings | About US$310 million |
Sources: Wikipedia, “Kalundborg Eco-industrial Park”, citing studies of 1997–2004, 2026; Kalundborg Symbiosis (symbiosis.dk), 2026; Wikipedia, “Asnæs Power Station”, 2026.
Several conditions came together. The partners are large industrial plants with complementary flows, located within a few kilometres of each other, so pipes for steam and water are short. Groundwater in the area was scarce, which made water reuse valuable. Each exchange made commercial sense on its own. Managers in a small town knew and trusted each other, and the municipality took an active role. Studies of eco-industrial parks elsewhere suggest that most successful ones grew, like Kalundborg, from such naturally occurring links, while parks planned from the top down have often failed.
Kalundborg is not a closed system. It still depends on fuel, raw materials and markets outside the park, and a 2002 study found that only 9,000 m³ of the 1.2 million m³ of refinery wastewater discharged each year was reused.
Most savings figures are estimates from studies before 2004, and the network has changed since. The biggest change came at the hub: Asnæs, built as a coal-fired station, closed its coal units and began running a new wood-chip unit in 2020. This cut fossil fuel use, but whether burning wood is sustainable depends on where the wood comes from and how those forests are managed, which shows that stewardship in one place can shift pressure to another.
 YouTube
Key concept | How Kalundborg shows it |
|---|---|
Possibility | Shows that industrial waste can be turned into resources profitably, and inspired eco-industrial parks in many countries |
Power | Built by private firms through voluntary deals, with the municipality as a partner; the firms decide which links continue, so it depends on their commercial interests |
Systems and sustainability | Flows of energy, water and materials are linked in loops, like an ecosystem; it saves water, materials and money (all three pillars) |
Scale | Effective locally, but tiny relative to global resource use; its conditions (proximity, trust, complementary industries) are hard to copy |
Kalundborg supports the balanced view: it is resource stewardship in practice, showing that technology and cooperation can reduce the use of raw materials and waste, as Boserup’s optimism suggests, while recognising that resources such as groundwater are limited. It contributes to SDG 12 (responsible consumption and production) and SDG 6 (water). It also shows the limits of local action: a single industrial park cannot change global trends unless its model is adopted widely, supported by national and regional policy.
Examine why industrial symbiosis developed at Kalundborg and why it has proved difficult to copy in other places.
To what extent is Kalundborg an example of a circular economy rather than simply an efficient linear one?
Suggest how the switch from coal to wood chips at Asnæs in 2020 affects the sustainability of the symbiosis at local and global scales.
Resource stewardship appears in Paper 2 as part of a Section A structured question on Unit 3 ([2], [2+2], [2+2]), possibly in the Section B infographic, and in Section C essays, which reward synthesis with population change and climate change.
Short structured parts reward precise terms. Several pairs are often confused and are worth distinguishing directly in an answer.
The table shows the percentage of the population with access to electricity in selected places.
Place | 2000 (%) | 2012 (%) | 2024 (%) |
|---|---|---|---|
Bangladesh | 32.0 | 65.5 | 99.5 |
India | 60.3 | 79.9 | 99.9 |
Nigeria | 43.2 | 53.0 | 62.5 |
Ethiopia | 12.7 | 29.0 | 56.6 |
Sub-Saharan Africa | 25.7 | 36.8 | 55.1 |
World | 78.2 | 84.9 | 91.9 |
Sources: World Bank WDI (EG.ELC.ACCS.ZS), 2026.
Part (b) asks for suggestions that fit the places in the table.
Part (c) moves from the stimulus to wider knowledge of the topic.
An infographic titled “The SDGs at 10: progress is real but insufficient” shows:
a horizontal bar divided into three parts for the targets with trend data: 35% on track or making moderate progress, about 47% making marginal progress or moving too slowly, and 18% regressed;
four icons with figures: more than 800 million people in extreme poverty in 2025; 2.1 billion without safely managed drinking water in 2024; access to electricity 92% in 2023; 110 million more children in school since 2015;
a map shading sub-Saharan Africa and fragile states, with the note that more than three-quarters of the extreme poor will live there by 2025;
a speech bubble: “With just five years to reach the Sustainable Development Goals, we need to shift into overdrive.” (António Guterres, UN Secretary-General, July 2025).
Sources: Infographic data: United Nations, The Sustainable Development Goals Report 2025, 2025; WHO/UNICEF JMP, 2025 (drinking water).
Part (b) needs a point taken from the infographic and a development.
Part (c) needs evidence from the infographic on both sides, then an overall appraisal.
Carrying capacity, overpopulation and optimum population describe the balance between people and resources; for people they depend on technology, trade and consumption (I = P × A × T).
Malthus (1798) argued that population grows geometrically and food arithmetically, so checks such as famine are inevitable; neo-Malthusians (Ehrlich 1968, Limits to Growth 1972, planetary boundaries 2009) extend this to all resources and sinks.
Evidence for neo-Malthusian views includes Earth Overshoot Day moving from 31 December 1972 to 30 July 2026, fisheries collapse, groundwater depletion and seven of nine planetary boundaries crossed by 2025.
Boserup (1965) argued that population pressure drives agricultural intensification; Machakos and the Green Revolution support her, and cornucopians such as Simon argue that ingenuity overcomes scarcity.
World cereal output rose about 4.2 times between 1961 and 2024 while population rose 2.7 times, but the Green Revolution had environmental and social costs.
Balanced views combine limits with innovation: sustainability, sustainable development (defined by the Brundtland Report in 1987) and resource stewardship by individuals, firms and governments.
Perspectives differ on whether consumption or population is the main pressure: a person in Qatar emitted more than 340 times as much CO₂ as a person in Niger in 2024.
The circular economy designs out waste and keeps materials in use through loops; Kalundborg Symbiosis shows its value locally, but less than 10% of the world economy is circular.
The SDGs (2015–2030, 17 goals, 169 targets, universal) replaced the MDGs; in 2025 only 35% of measurable targets were on track or progressing moderately and 18% had regressed.
Management is most effective when global goals are carried out through national laws and local practice; each scale alone has limits.
I can outline carrying capacity, overpopulation and optimum population, and use I = P × A × T.
I can explain Malthusian and neo-Malthusian views and evaluate the evidence for and against them.
I can explain Boserup’s theory and cornucopian views, using Machakos and the Green Revolution, and evaluate them.
I can distinguish sustainability, sustainable development and resource stewardship.
I can discuss perspectives on whether consumption or population growth is the greater pressure on resources.
I can explain the circular economy as a systems approach and evaluate it, using Kalundborg Symbiosis.
I can examine the role of the SDGs, with a named success and a shortfall, and evaluate progress towards them.
I can evaluate the effectiveness of resource management at local, national and global scales.
Scientific uncertainty: most species in the CCZ are not yet described, so environmental impact assessments are hard to make; the precautionary principle.
Political responses: many states have called for a moratorium or “precautionary pause”, and the ISA has not finalized its mining code; The Metals Company sought a permit through the USA's national seabed mining law in 2025, bypassing the ISA, which many states criticized.
Economic uncertainty: falling battery metal prices and new battery chemistries (eg lithium iron phosphate, which needs no cobalt or nickel) may reduce profitability; recycling may be an alternative.
Good answers may be well structured (AO4) and may additionally offer a critical evaluation (AO3) which examines whether costs and benefits can be compared at all when environmental costs are largely unknown and long-term while economic benefits are short-term and concentrated (time, perspectives). Another approach might be to consider for whom the benefits and costs fall: TNCs and sponsoring states versus the global commons and future generations (power, equity). Some responses may argue that land-based mining also has large environmental and social costs, so the comparison depends on the alternative (possibilities).
For 5–6 marks, expect some weakly-evidenced outlining of the costs and/or benefits of deep-sea mining.
For 7–8 marks, expect a structured account which includes:
either well-evidenced explanation of both environmental costs and economic benefits
or a discursive conclusion (or on-going evaluation) grounded in geographical concepts and/or perspectives.
For 9–10 marks, expect both of these traits.
NB. Do not credit answers that discuss offshore oil and gas only; seabed minerals are the focus.
Marks | Level descriptor |
|---|---|
0 | The response does not reach a standard described by the descriptors below. |
1–2 | Too brief, lists unconnected information, not focused on the question and lacks structure. Knowledge is very general, with large gaps or errors; examples or case studies are missing or only listed. No analysis; terminology is missing or used incorrectly. |
3–4 | Too general, lacks detail, not focused on the question and largely unstructured. Outlines examples, statistics and facts, both relevant and irrelevant, with links to the question only listed. Basic terminology is used, with errors or inconsistently. No critical evaluation of evidence; any conclusion is irrelevant. |
5–6 | Partially addresses the question, with a narrow argument, an unsubstantiated conclusion and limited evaluation. Describes relevant supporting evidence (examples, case studies) and outlines links to the question. The argument repeats one point or covers only part of the question. Other perspectives, or strengths and weaknesses of evidence, are listed. |
7–8 | Addresses the whole question; the analysis is evaluated and the conclusion is relevant but lacks balance. Relevant evidence is described correctly and covers all the main points. The argument is clear but one-sided or unbalanced. Complex terminology is used correctly but not consistently. Other perspectives, or strengths and weaknesses of evidence, are described. |
9–10 | In-depth and specific to the question (topic and command term). Correct, relevant examples, statistics and detail are integrated and their link to the question explained. The argument is balanced, explaining complexity, exceptions and comparisons. Evaluation of evidence and perspectives is well developed, and the conclusion is balanced and aligned with the evidence. Logically structured and easy to follow. |
Examine the extent to which strengthening the participation of local communities can secure access to clean, safe and affordable water in places at different levels of economic development.
10 marks
To what extent are demand-management strategies, such as improving water-use efficiency, more effective than supply-side schemes in meeting future water needs?
10 marks