B.1 Ocean–atmosphere interactions
Explain how ocean currents, the conveyor belt, ENSO and hurricanes link the oceans and atmosphere, interpret ONI and pH data, and evaluate the impacts of El Niño, La Niña, Hurricane Melissa and ocean acidification.
- IB Geography
- Part of B Oceans and coastal margins
- SL and HL
Key terms introduced here
Each is in the Geography glossary, with every other term in the subject.
- Atlantic Meridional Overturning Circulation
The Atlantic part of the global ocean conveyor belt, in which warm surface water flows north, cools and sinks in the North Atlantic, and returns south as cold deep water.
- Biological pump
The transfer of carbon from the surface ocean to the deep ocean and sea floor by organisms, as phytoplankton take up CO₂ and dead organisms and faecal pellets sink.
- Calcification
The process by which marine organisms such as corals, molluscs and some plankton build shells and skeletons of calcium carbonate from dissolved calcium and carbonate ions.
- Cold current
An ocean current colder than the surrounding water and air, usually flowing from high latitudes towards the Equator on the eastern side of an ocean basin.
- Coral reef
A structure built over thousands of years from the calcium carbonate skeletons of reef-building corals, in warm, shallow, clear tropical seas, supporting very high biodiversity.
- Coriolis effect
The apparent deflection of moving air and water caused by the Earth’s rotation, to the right in the northern hemisphere and to the left in the southern hemisphere; zero at the Equator.
- El Niño
The warm phase of ENSO, in which the trade winds weaken, warm water spreads east across the equatorial Pacific, upwelling off South America weakens and rainfall shifts east.
- El Niño–Southern Oscillation
The irregular cycle of coupled changes in sea surface temperature and air pressure across the tropical Pacific, with a warm phase (El Niño), a cold phase (La Niña) and a neutral state.
- Eye
The calm, often cloud-free centre of a tropical cyclone, typically 20–50 km across, where air sinks and surface pressure is lowest.
- Eyewall
The ring of towering thunderclouds around the eye of a tropical cyclone, where air rises fastest and the strongest winds and heaviest rain occur.
- Global ocean conveyor belt
The global pattern of the thermohaline circulation, in which dense water sinks in the North Atlantic and around Antarctica, flows through the deep ocean and returns as surface currents in about 1,000 years.
- Gulf Stream
A warm, fast ocean current flowing from the Gulf of Mexico along North America and across the Atlantic as the North Atlantic Drift, carrying heat towards north-west Europe.
- Gyre
A large, roughly circular system of surface ocean currents in an ocean basin, driven by prevailing winds and the Coriolis effect; clockwise in the northern hemisphere, anticlockwise in the southern.
- Hurricane
A tropical cyclone that forms in the North Atlantic, Caribbean Sea, Gulf of Mexico or north-east Pacific, with sustained winds of at least 119 km/h.
- La Niña
The cold phase of ENSO, an intensified form of normal conditions, in which stronger trade winds increase upwelling off South America and rainfall over the western Pacific.
- Latent heat
The energy absorbed when water evaporates and released when water vapour condenses, without a change in temperature; the main energy source of tropical cyclones.
- Marine heatwave
A period of days to months in which ocean temperatures in a region are unusually high for the time of year, commonly above the 90th percentile for at least five days.
- Ocean current
A continuous, directed movement of seawater, driven at the surface mainly by prevailing winds and at depth by differences in water density.
- Oceanic Niño Index
NOAA’s index of ENSO: the three-month running mean of sea surface temperature anomalies in the Niño 3.4 region; +0.5 °C or more indicates El Niño and −0.5 °C or less La Niña.
- Phytoplankton
Microscopic plant-like organisms, mainly algae and cyanobacteria, that drift in the sunlit surface ocean and photosynthesise, forming the base of most marine food webs.
- Rapid intensification
An increase in the maximum sustained wind speed of a tropical cyclone of at least 55 km/h (30 knots) within 24 hours.
- Saffir–Simpson scale
The Saffir–Simpson Hurricane Wind Scale, which classifies hurricanes into categories 1 to 5 by maximum sustained wind speed, from 119–153 km/h (category 1) to 252 km/h or more (category 5).
- Salinity
The concentration of dissolved salts in seawater, averaging about 35 g per kg; it rises with evaporation and sea-ice formation and falls with inputs of fresh water.
- Sea surface temperature
The temperature of the top few metres of the ocean, measured by ships, buoys and satellites; departures from average (anomalies) are used to monitor ENSO and marine heatwaves.
- Solubility pump
The physical transfer of carbon dioxide from the atmosphere to the deep ocean, as it dissolves in cold high-latitude surface water that then sinks with the thermohaline circulation.
- Southern Oscillation Index
An index of the difference in sea-level air pressure between Tahiti and Darwin; sustained negative values indicate El Niño and sustained positive values indicate La Niña.
- Storm surge
An abnormal rise in sea level generated by a storm, above the predicted tide, caused mainly by onshore winds piling water against the coast and partly by low pressure lifting the sea.
- Teleconnection
A link between a climate anomaly in one part of the world and changes in weather or climate in distant regions, transmitted through the atmospheric circulation.
- Thermocline
The layer of the ocean, between the warm mixed surface layer and the cold deep water, in which temperature falls rapidly with depth.
- Thermohaline circulation
The large-scale circulation of the oceans driven by differences in seawater density, which depend on temperature and salinity; cold, salty water sinks at high latitudes.
- Trade winds
The steady easterly winds blowing from the subtropical high-pressure belts towards the Equator, from the north-east in the northern hemisphere and the south-east in the southern hemisphere.
- Tropical cyclone
An intense, rotating low-pressure system over warm tropical oceans, with thunderstorms around a central eye and sustained winds of at least 119 km/h; called a hurricane, typhoon or cyclone by basin.
- Typhoon
A tropical cyclone that forms in the north-west Pacific Ocean, west of the date line, with sustained winds of at least 119 km/h.
- Upwelling
The rise of cold, nutrient-rich water from below the thermocline to the ocean surface, usually where winds move surface water away from a coast.
- Walker circulation
The east–west loop of air over the equatorial Pacific, rising over the warm west, flowing east aloft, sinking over the cool east and returning west as the trade winds.
- Warm current
An ocean current warmer than the surrounding water and air, usually flowing from low latitudes towards the poles on the western side of an ocean basin.
- Wind shear
The change in wind speed or direction with height; strong vertical wind shear tears developing tropical cyclones apart, while low shear lets them organise and strengthen.
- Zooxanthellae
Microscopic photosynthetic algae living inside the tissues of reef-building corals in a symbiosis, supplying most of the coral’s food and giving it its colour.
Notes on B.1 Ocean–atmosphere interactions
Learning objectives
Describe the distribution of the major warm and cold ocean currents and explain how winds and the Coriolis effect produce gyres.
Explain how ocean currents transfer energy and nutrients, including the role of upwelling.
Explain how the global ocean conveyor belt works and examine why a weakening of the AMOC matters.
Distinguish between normal, El Niño and La Niña conditions in the Pacific, using the Walker circulation and the thermocline.
Analyse an Oceanic Niño Index time series and examine the effects of El Niño and La Niña, using detailed examples.
Explain the formation, structure, distribution and intensity of hurricanes.
Explain the physical impacts of hurricanes on coasts, including storm surges, and evaluate the impacts of one hurricane on coastal places and people.
Explain how the oceans act as a store and source of carbon dioxide, and examine the impacts of ocean acidification on coral reefs.
Introduction
The oceans cover about 71% of the Earth’s surface and constantly exchange heat, water and gases with the atmosphere. Winds drive ocean currents, warm seas power hurricanes, and the ocean absorbs much of the carbon dioxide released by human activity, so a change in one part of the system can alter rainfall, harvests and storms thousands of kilometres away.
The topic is mainly about process, the mechanisms that move heat and water around the planet; place shapes the outcome, because the same El Niño floods Peru and dries Indonesia; and possibility enters through forecasts of ENSO, hurricanes and the Atlantic overturning circulation, each uncertain.
The ocean as a physical system
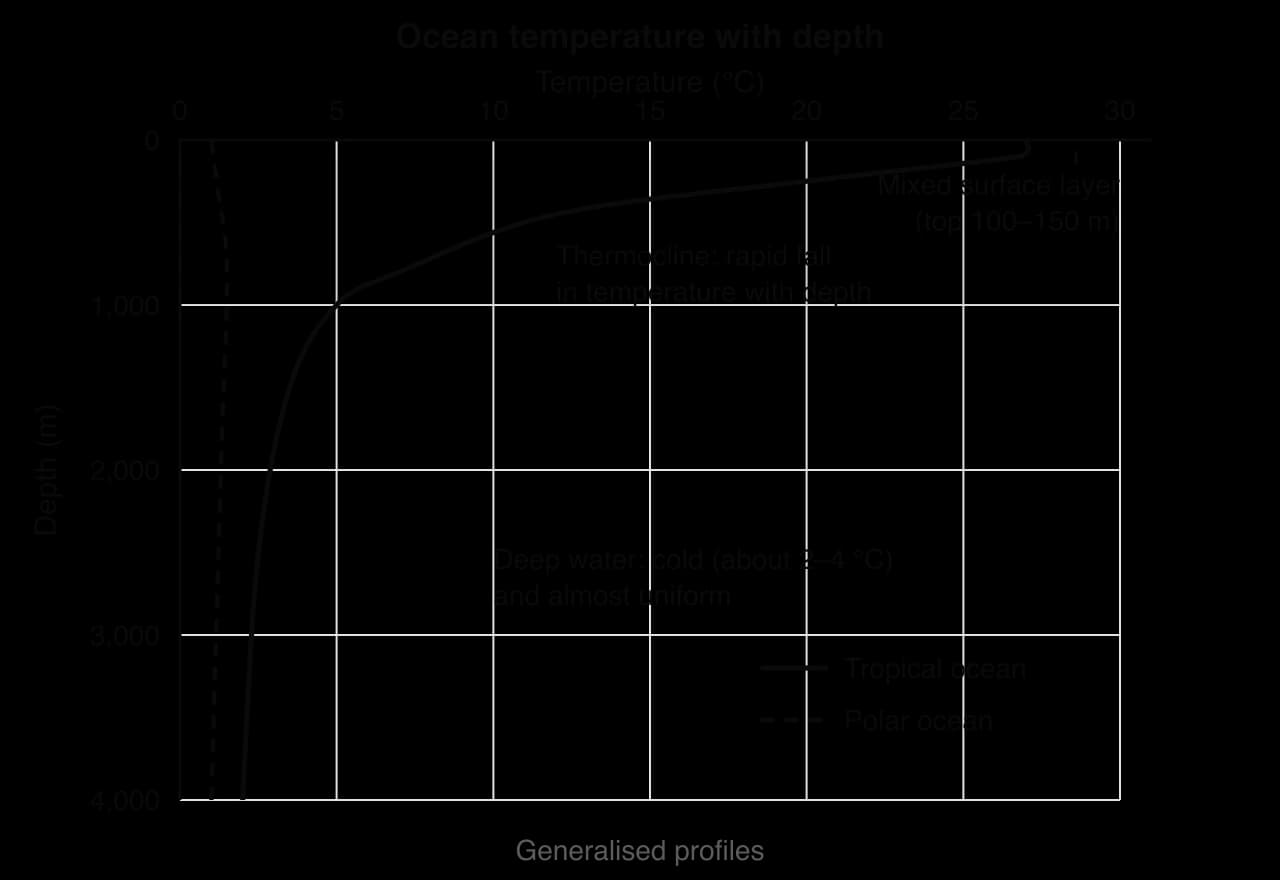
Seawater varies in temperature and salt content, and together these control its density. Surface water is warmest in the tropics (28–30 °C in the western Pacific) and coldest in polar seas (about −2 °C, the freezing point of seawater). Below about 1,000 m the ocean is cold, about 2–4 °C, at all latitudes.
Salinity is the concentration of dissolved salts in seawater and averages about 35 g kg⁻¹. It is higher where evaporation exceeds precipitation, as in the subtropics and the Red Sea, and when sea ice forms and leaves salty brine behind. It is lower where rivers, rain or melting ice add fresh water, as in the Baltic Sea.
In the tropics and middle latitudes, a warm, well-mixed surface layer sits above the cold deep ocean, separated by the thermocline. The thermocline acts as a barrier to mixing: the deep water below it is rich in nutrients, while the sunlit water above is often nutrient-poor, so anything that moves the thermocline up or down changes how productive the surface ocean is.
Surface ocean currents
An ocean current is a continuous, directed movement of seawater. Surface currents, in the top few hundred metres, are driven mainly by the wind; deep currents are driven by differences in density and move far more slowly.
Winds, the Coriolis effect and gyres
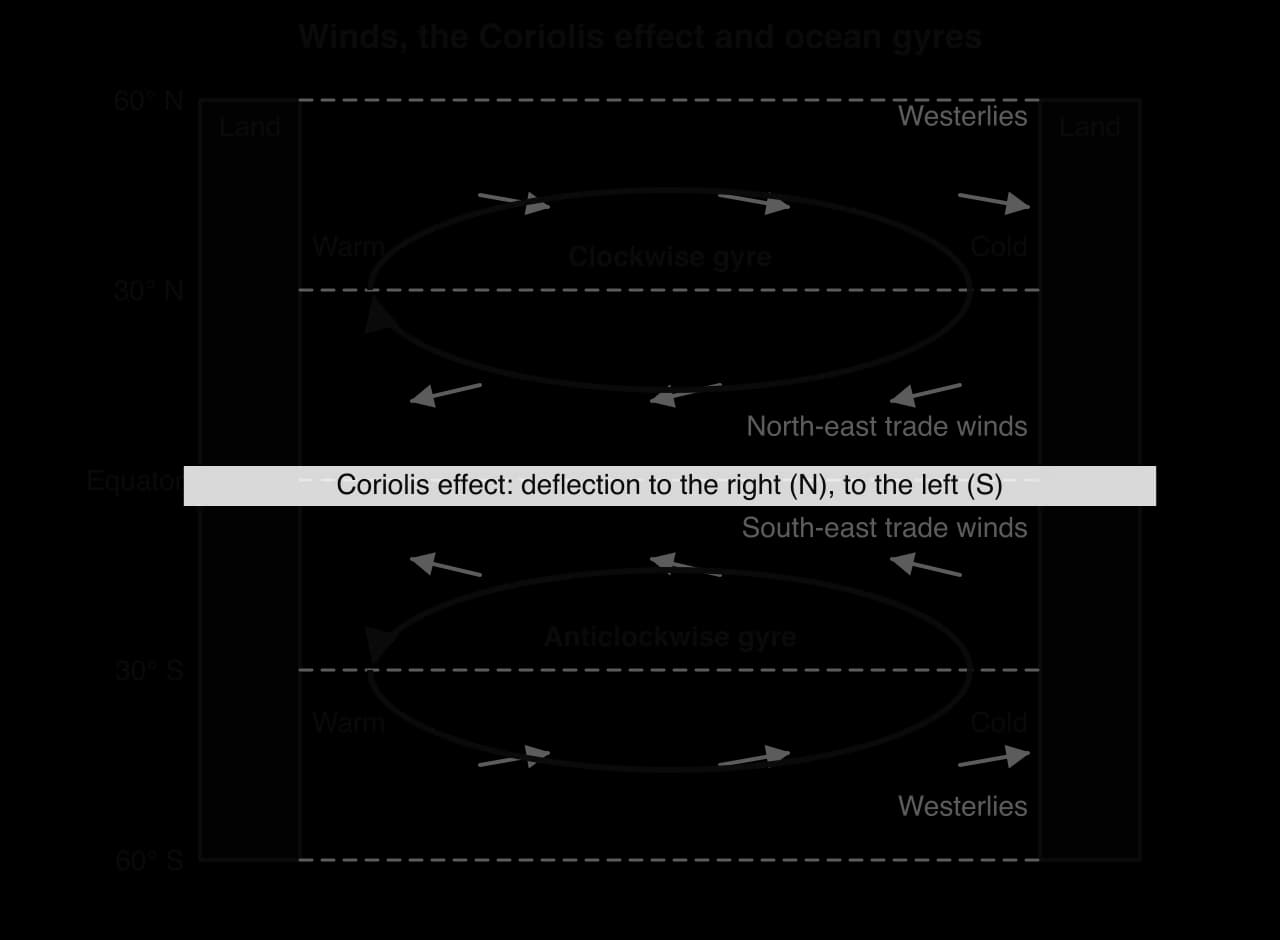
Friction from the prevailing winds drags the sea surface along. Between about 0° and 30° of latitude the trade winds blow from the east, and between about 30° and 60° the westerlies blow from the west, so surface water is pushed westward in the tropics and eastward in mid-latitudes.
Over a rotating Earth, moving water and air are deflected by the Coriolis effect: to the right in the northern hemisphere and to the left in the southern hemisphere, with no deflection at the Equator. Each layer of water drags the one beneath it and is deflected in turn, so the wind-driven surface layer moves at about 90° to the wind, a process called Ekman transport.
Continents block the flow, so currents turn and form large circular systems called gyres: the North and South Atlantic, the North and South Pacific and the Indian Ocean gyres. Northern hemisphere gyres turn clockwise and southern hemisphere gyres anticlockwise.
Warm and cold currents
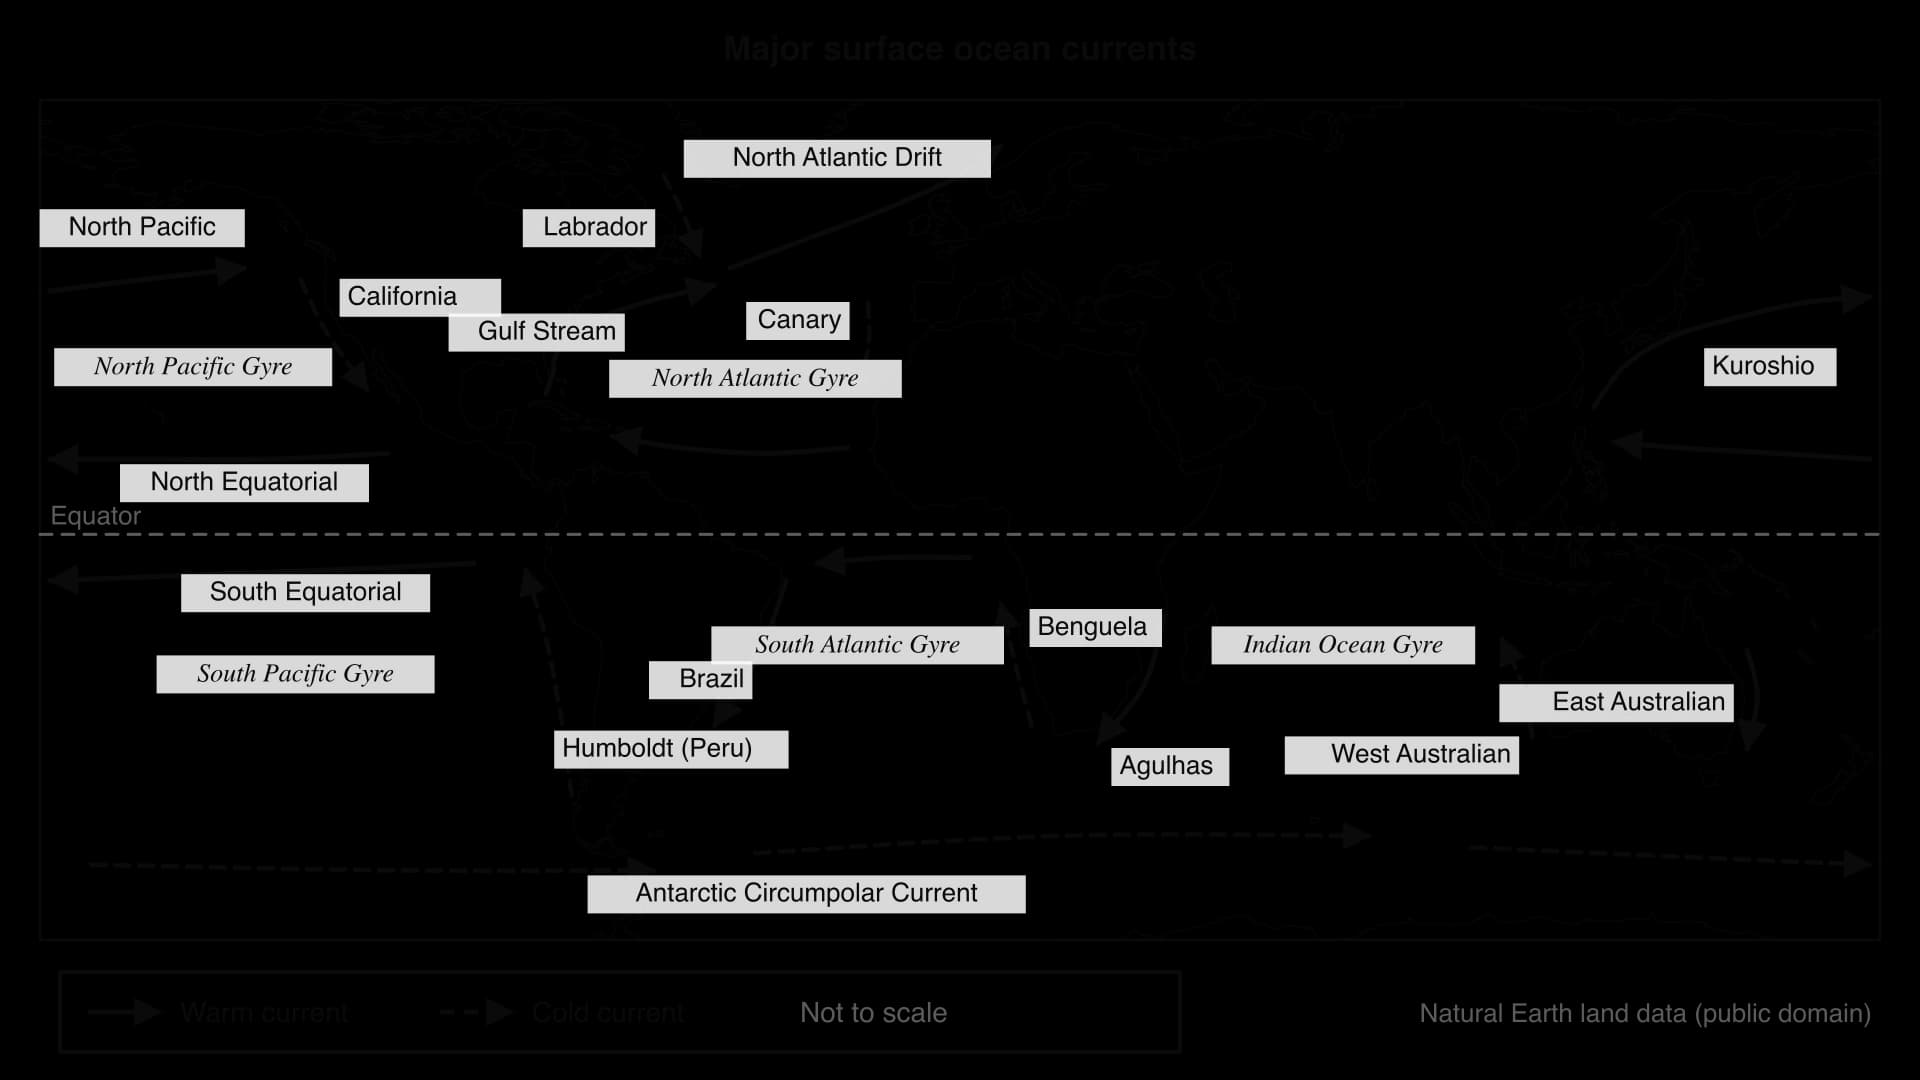
Each gyre carries a warm current poleward along its western side (the Gulf Stream, Kuroshio, Brazil, East Australian and Agulhas Currents) and a cold current towards the Equator along its eastern side (the Canary, California, Humboldt, Benguela and West Australian Currents). Around Antarctica, where no continent blocks the flow, the Antarctic Circumpolar Current flows eastward right round the globe, driven by the westerlies.
Energy and nutrient transfers
The tropics receive more energy from the Sun than they lose to space, and the polar regions lose more than they receive. Ocean currents and the atmosphere together move this surplus heat towards the poles: the oceans carry most of it in the tropics, while at higher latitudes the atmosphere carries more.
Warm currents, cold currents and coastal climates
The Gulf Stream carries about 30 million m³ of warm water every second through the Straits of Florida and continues across the Atlantic as the North Atlantic Drift. The heat it releases, carried inland by westerly winds, keeps north-west Europe mild: Ireland’s winters rarely fall far below freezing, while Labrador, at the same latitude beside the cold Labrador Current, has long frozen winters.
Cold currents have the opposite effect. Air flowing over cold water is cooled from below and becomes stable, so it does not rise to form rain clouds; if it is moist, it forms fog. The Atacama Desert beside the Humboldt Current and the Namib Desert beside the Benguela Current are among the driest places on Earth, and in the Namib, fog from the sea is the main water supply for plants and animals. Cold currents are one reason for the location of coastal hot deserts.
Upwelling and ocean productivity
Upwelling is the rise of cold, nutrient-rich water from below the thermocline. It is strongest on the eastern sides of ocean basins. Off Peru, for example, the south-east trade winds blow north along the coast, Ekman transport moves the surface water to the left of the wind, away from the coast, and deep water rises to replace it.
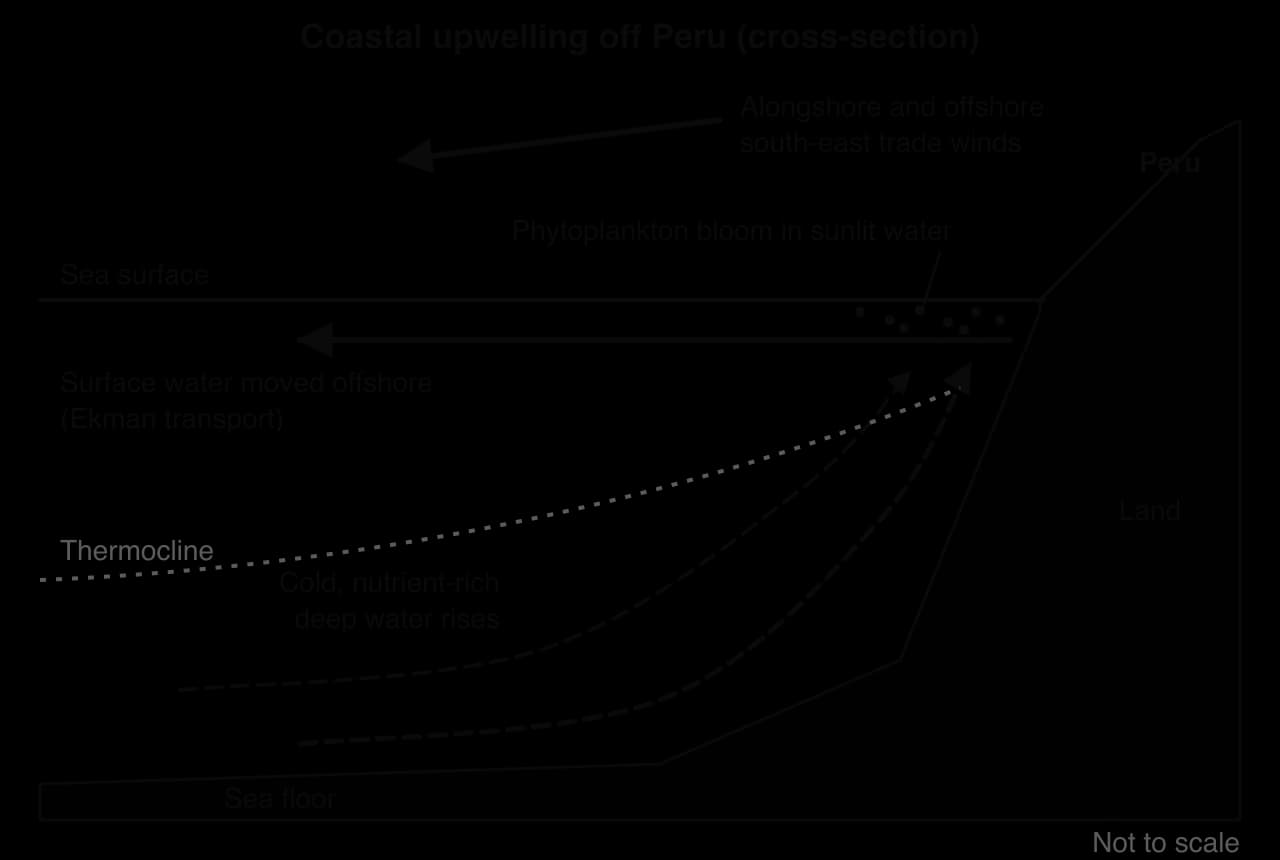
The rising water brings nitrates and phosphates into the sunlit layer, where phytoplankton use them to grow. Phytoplankton feed zooplankton, which feed small fish such as anchovies, which feed larger fish, seabirds and marine mammals.
About a quarter of the world’s marine fish catch comes from five upwelling regions covering about 5% of the ocean. The Peruvian anchoveta fishery, which reached a record 13.1 million tonnes in 1971, depends on the upwelling of the Humboldt Current.
Sources: Wikipedia, “Gulf Stream”, “Upwelling” and “Peruvian anchoveta”, citing NOAA and FAO data (accessed 2026).
The global ocean conveyor belt
Beneath the wind-driven currents, the whole ocean turns over slowly in one connected loop: the thermohaline circulation, driven by density differences from temperature (“thermo”) and salinity (“haline”). Its global pattern is called the global ocean conveyor belt.
Cooling and salt enrichment. Between Greenland and Norway, warm, salty water carried north by the North Atlantic Drift loses heat to the cold air. Around Antarctica, especially in the Weddell Sea, forming sea ice rejects salt into the water below.
Sinking. The water becomes colder, saltier and denser than the water beneath, and sinks to the deep ocean.
Deep flow. It flows slowly south through the Atlantic, east around Antarctica and north into the Indian and Pacific Oceans, at a few centimetres per second.
Upwelling and return. The deep water gradually rises, mainly in the Southern Ocean and the North Pacific, and returns as warm surface flow to the North Atlantic. A full circuit takes about 1,000 years.
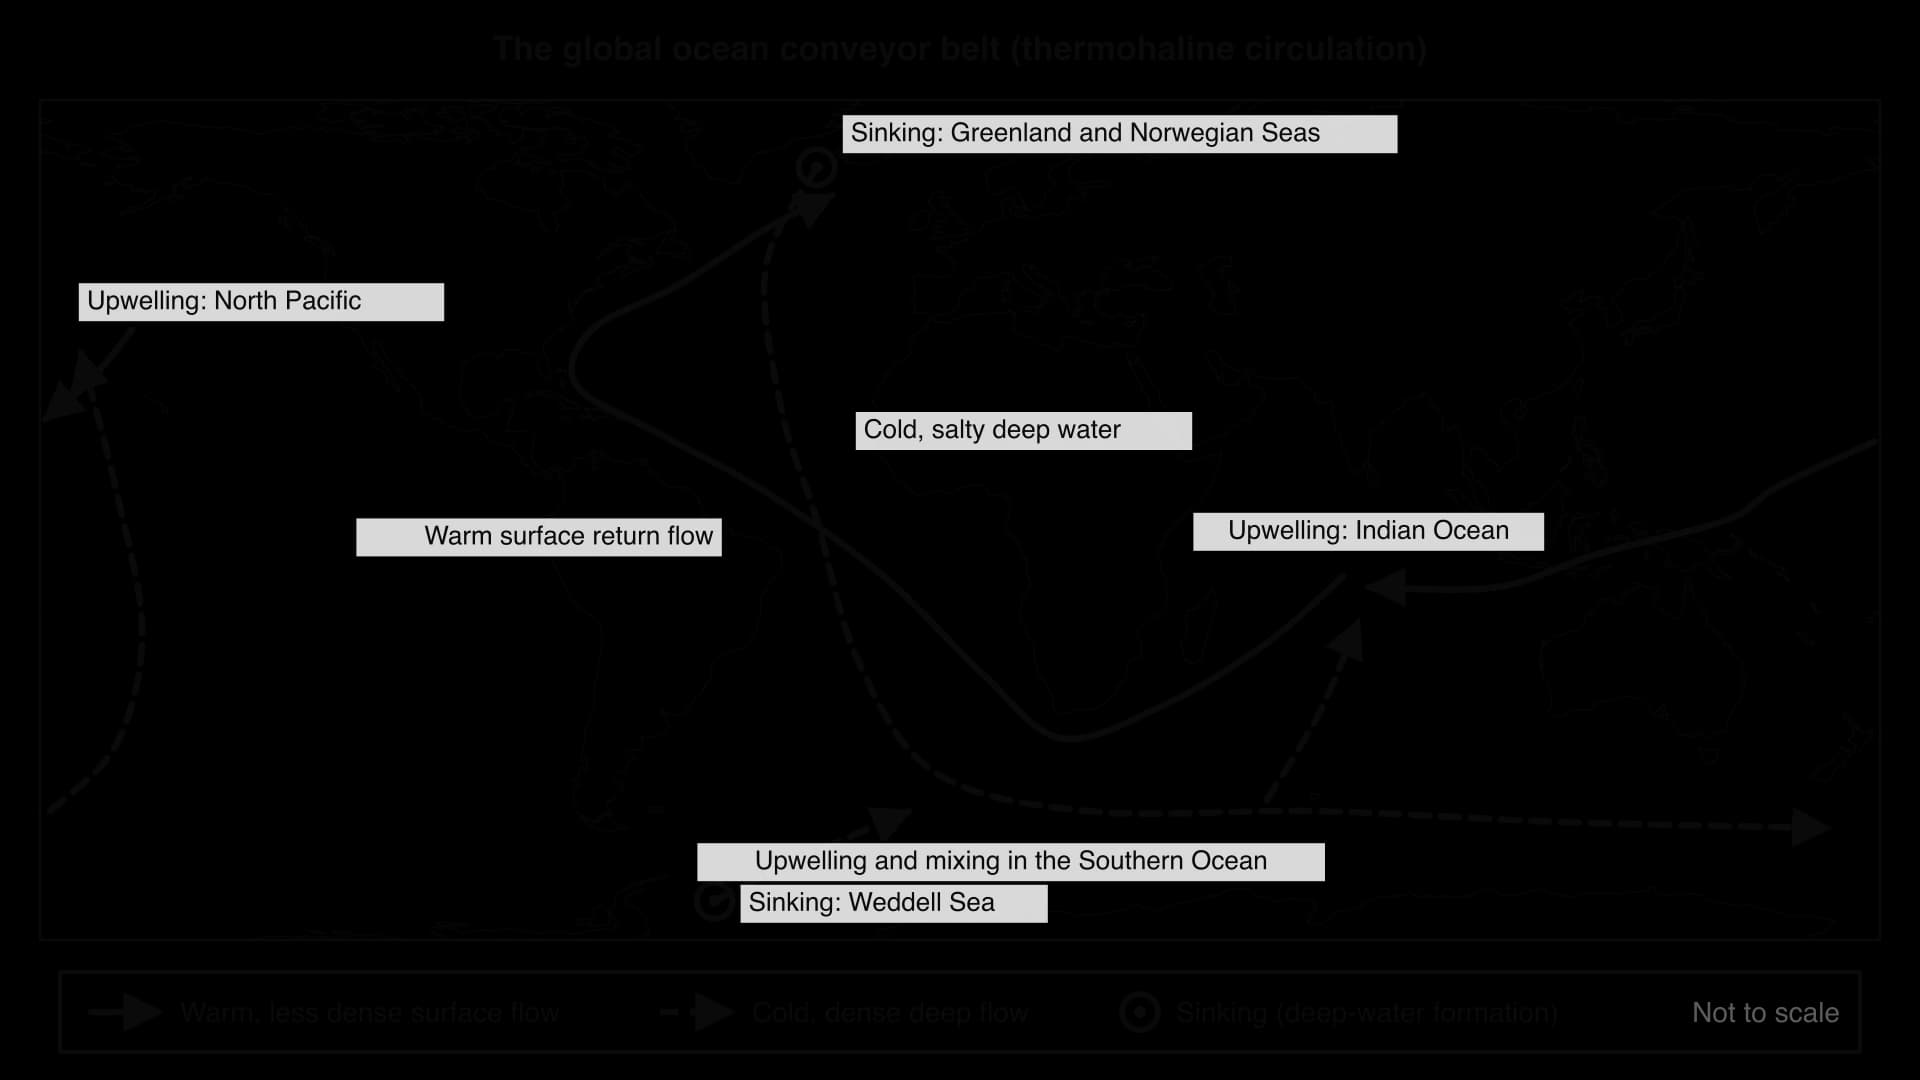
The conveyor belt matters because it redistributes heat towards the North Atlantic, carries dissolved CO₂ and oxygen into the deep ocean where surface water sinks, and returns nutrients to the surface where deep water rises. It links climate, the carbon cycle and marine ecosystems across the planet.
 YouTube
A weakening AMOC
The Atlantic Meridional Overturning Circulation (AMOC) is the Atlantic part of the conveyor belt: the northward flow of warm surface water, including the Gulf Stream, and the southward return of cold deep water. It depends on North Atlantic water becoming dense enough to sink, so global warming weakens it in two ways: warmer water is less dense, and fresh water from the melting Greenland ice sheet dilutes the salty surface water. Two studies in 2018 found the Gulf Stream system at its weakest for at least 1,600 years, and climate models project further weakening this century.
A severe slowdown could cool winters in north-west Europe, raise sea level faster along the east coast of North America and shift the West African and South Asian monsoons. A collapse would be a tipping point: the circulation might not recover even if warming stopped. Most assessments consider collapse unlikely this century.
Sources: Wikipedia, “Atlantic meridional overturning circulation” and “Thermohaline circulation”, citing Caesar et al. and Thornalley et al. (Nature, 2018) and IPCC AR6 (accessed 2026).
El Niño–Southern Oscillation (ENSO)
The El Niño–Southern Oscillation (ENSO) is a natural, irregular cycle of change in the ocean and atmosphere of the tropical Pacific, with a warm phase (El Niño), a cold phase (La Niña) and a neutral state. It is the largest source of year-to-year variation in the Earth’s climate.
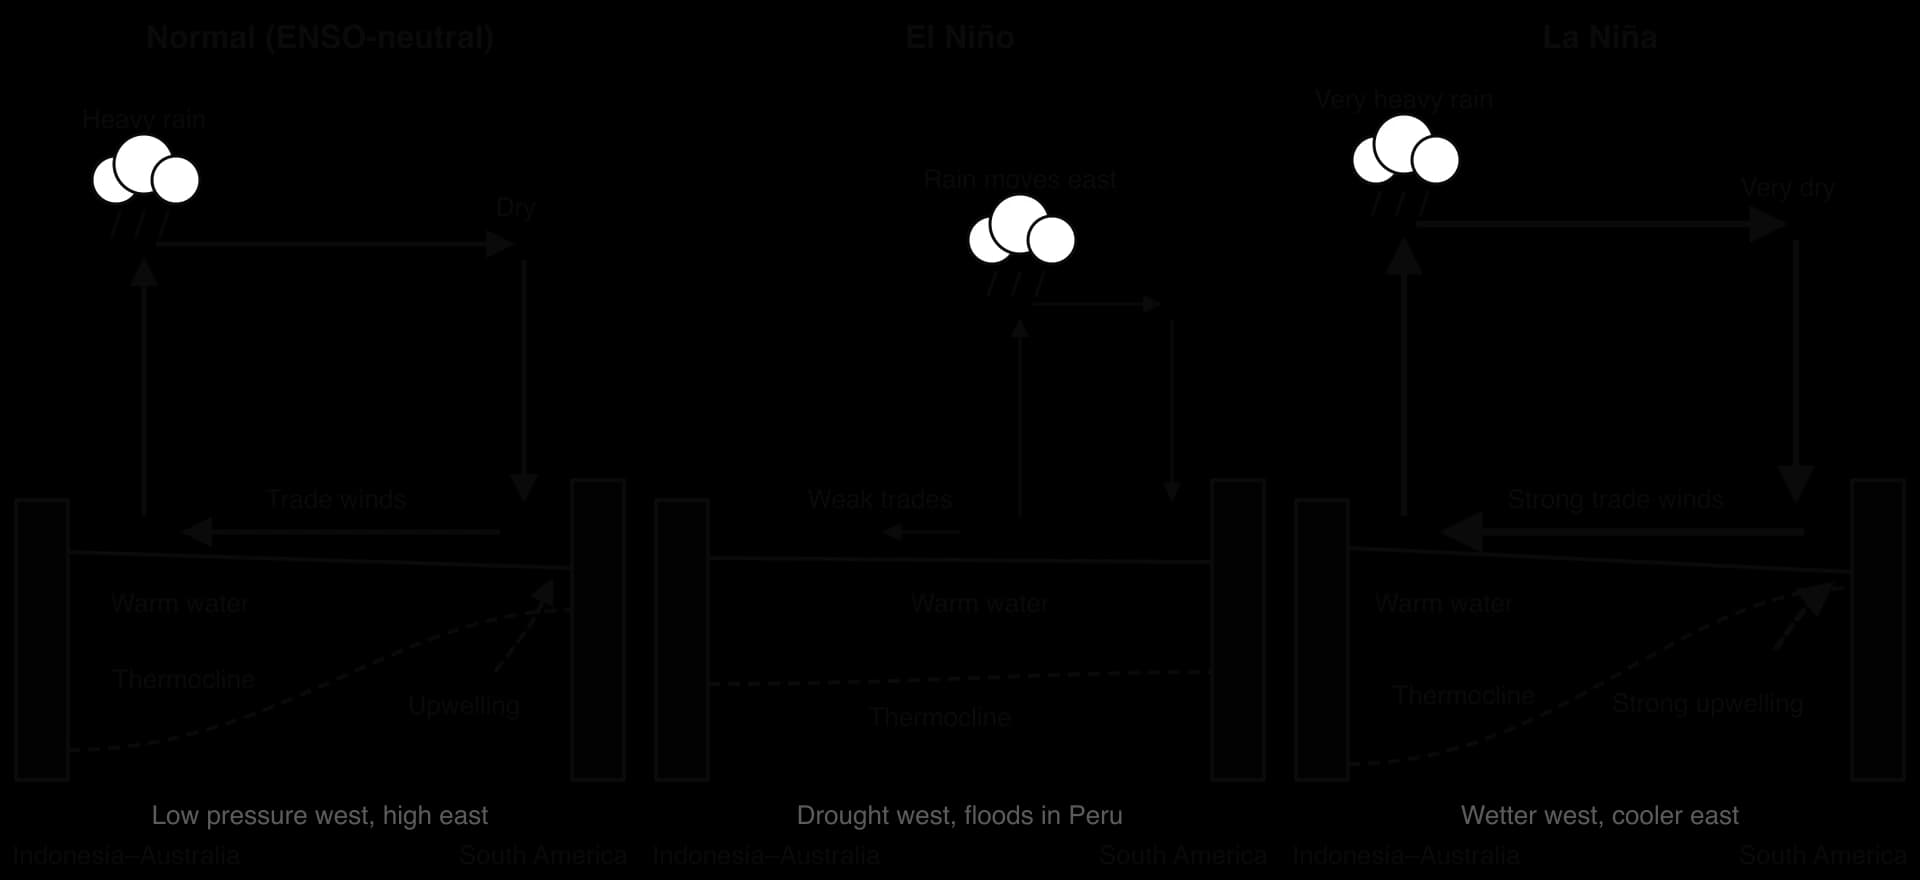
Normal (ENSO-neutral) conditions
Trade winds and warm pool. Strong easterly trade winds push warm surface water west, where it piles up near Indonesia and northern Australia at over 28 °C, with the sea surface about 0.5 m higher than off South America.
Rising air in the west. The warm water heats the air above it, which rises, forming low pressure and heavy rain.
Sinking air in the east. High in the troposphere the air flows east, sinks over the cool eastern Pacific (high pressure, dry conditions) and returns west at the surface as the trade winds. This loop is the Walker circulation.
Thermocline and upwelling. The thermocline is deep in the west (about 150–200 m) and shallow in the east (about 50 m), so upwelling off Peru brings cold, nutrient-rich water to the surface.
The system reinforces itself, a positive feedback: strong trade winds keep the west warm and the east cool, and that temperature contrast maintains the pressure difference that drives the trade winds. This is why the Pacific can lock in to one state for months.
El Niño
The trade winds weaken, and in strong events reverse near the date line.
Warm water flows back east, carried by large, slow waves beneath the surface called Kelvin waves, reaching South America in about two months.
The thermocline deepens in the east, so upwelling off Peru brings up only warm, nutrient-poor water.
Rain moves east. Rising air and heavy rain shift to the central and eastern Pacific, flooding Peru and Ecuador, while Indonesia and eastern Australia dry out.
Global temperature rises temporarily as the Pacific releases heat.
La Niña
La Niña is an intensified version of normal conditions. The trade winds strengthen, more warm water piles up in the west, the thermocline off South America rises and upwelling brings especially cold water to the surface, so Indonesia and eastern Australia become wetter and the eastern Pacific cooler and drier. Events recur irregularly every two to seven years and usually last 9–12 months, though La Niña can persist for two or three years; most peak between November and January.
Measuring and forecasting ENSO
The Southern Oscillation Index (SOI) measures the atmosphere: the difference in sea-level air pressure between Tahiti and Darwin compared with the long-term average. Sustained values below about −7 indicate El Niño (weak trade winds); sustained values above about +7 indicate La Niña.
The Oceanic Niño Index (ONI) measures the ocean. It is the three-month running mean of the sea surface temperature (SST) anomaly, the difference from the average for that time of year, in the Niño 3.4 region of the central equatorial Pacific (5° N–5° S, 170°–120° W). El Niño conditions are declared at +0.5 °C or more and La Niña at −0.5 °C or less; an episode counts when the threshold is met for at least five consecutive overlapping three-month periods. Smoothing into three-month means stops a single month of unusual weather from being mistaken for a change in ENSO.
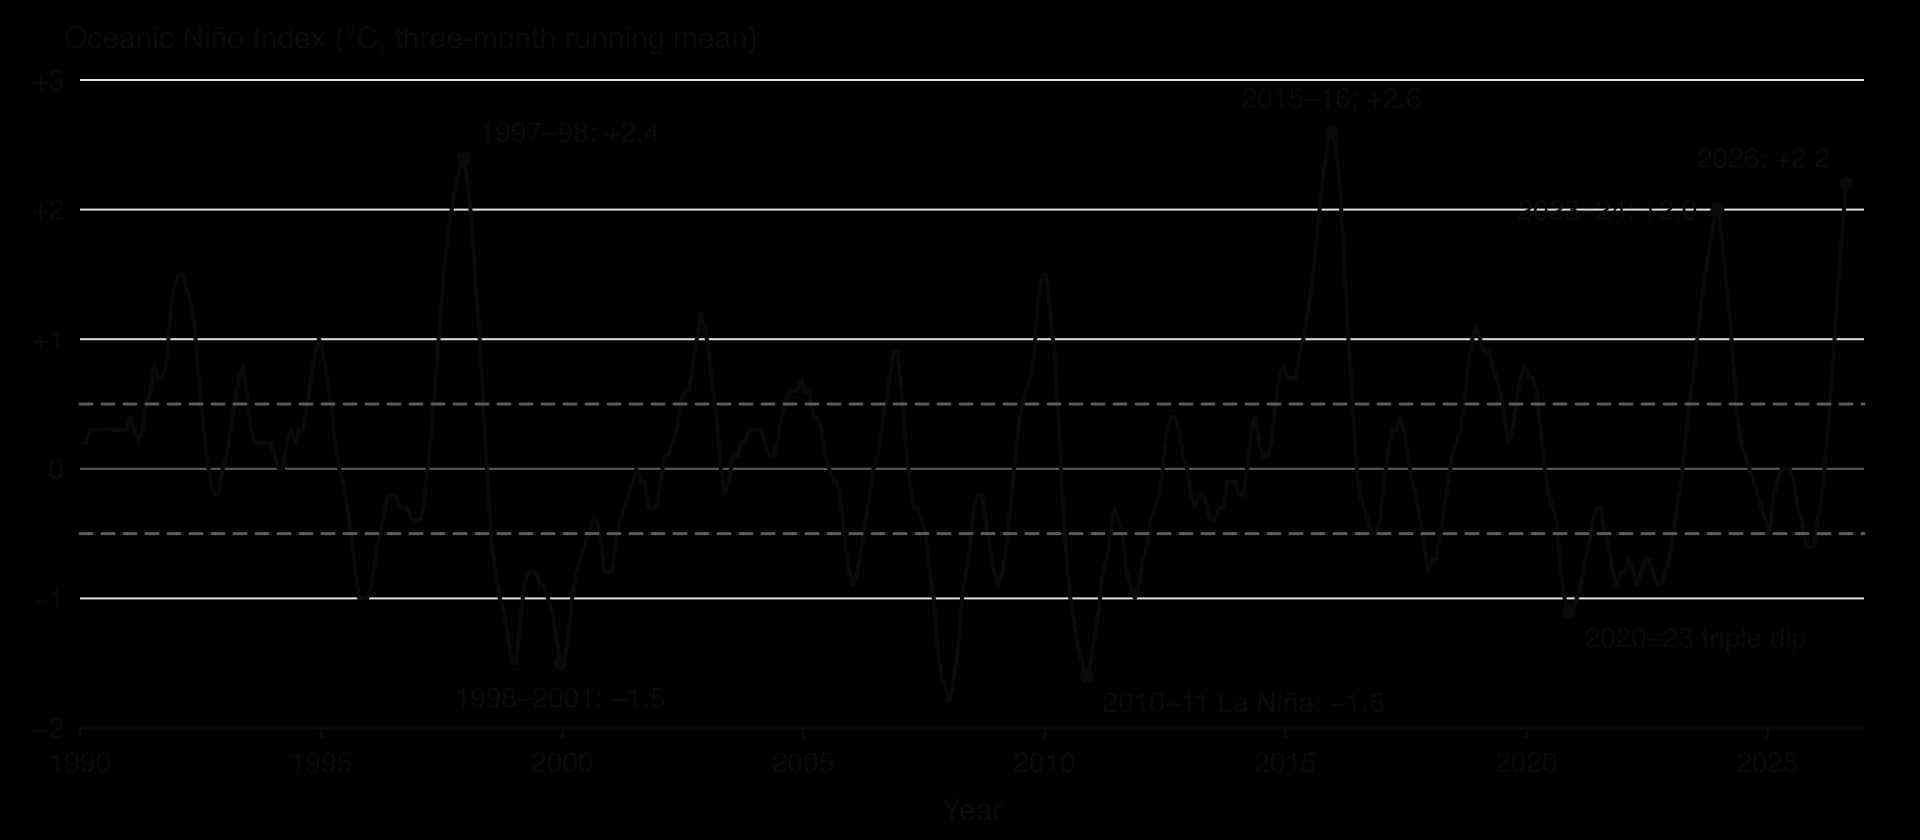
Since 1990 the ONI has peaked at +2.0 °C or more in three El Niño events (1997–98, 2015–16 and 2023–24). It rose again through 2026 and reached +2.2 °C for July–September, and in October 2026 NOAA expected a strong to very strong El Niño to last until at least January–March 2027. La Niña episodes reached −1.5 to −1.8 °C in 1998–2001, 2007–08 and 2010–11, and from late 2020 to early 2023 the ONI stayed below −0.5 °C through three northern winters, a rare “triple-dip” La Niña.
Sources: NOAA Climate Prediction Center, ONI table and ENSO diagnostic discussion of 8 October 2026.
Teleconnections and forecasting
ENSO affects distant places through teleconnections. When the zone of rising air shifts east during El Niño, it alters the Walker circulation, the jet streams and storm tracks, changing rainfall and temperature on several continents at once. The map shows the typical pattern, but no two events are identical.
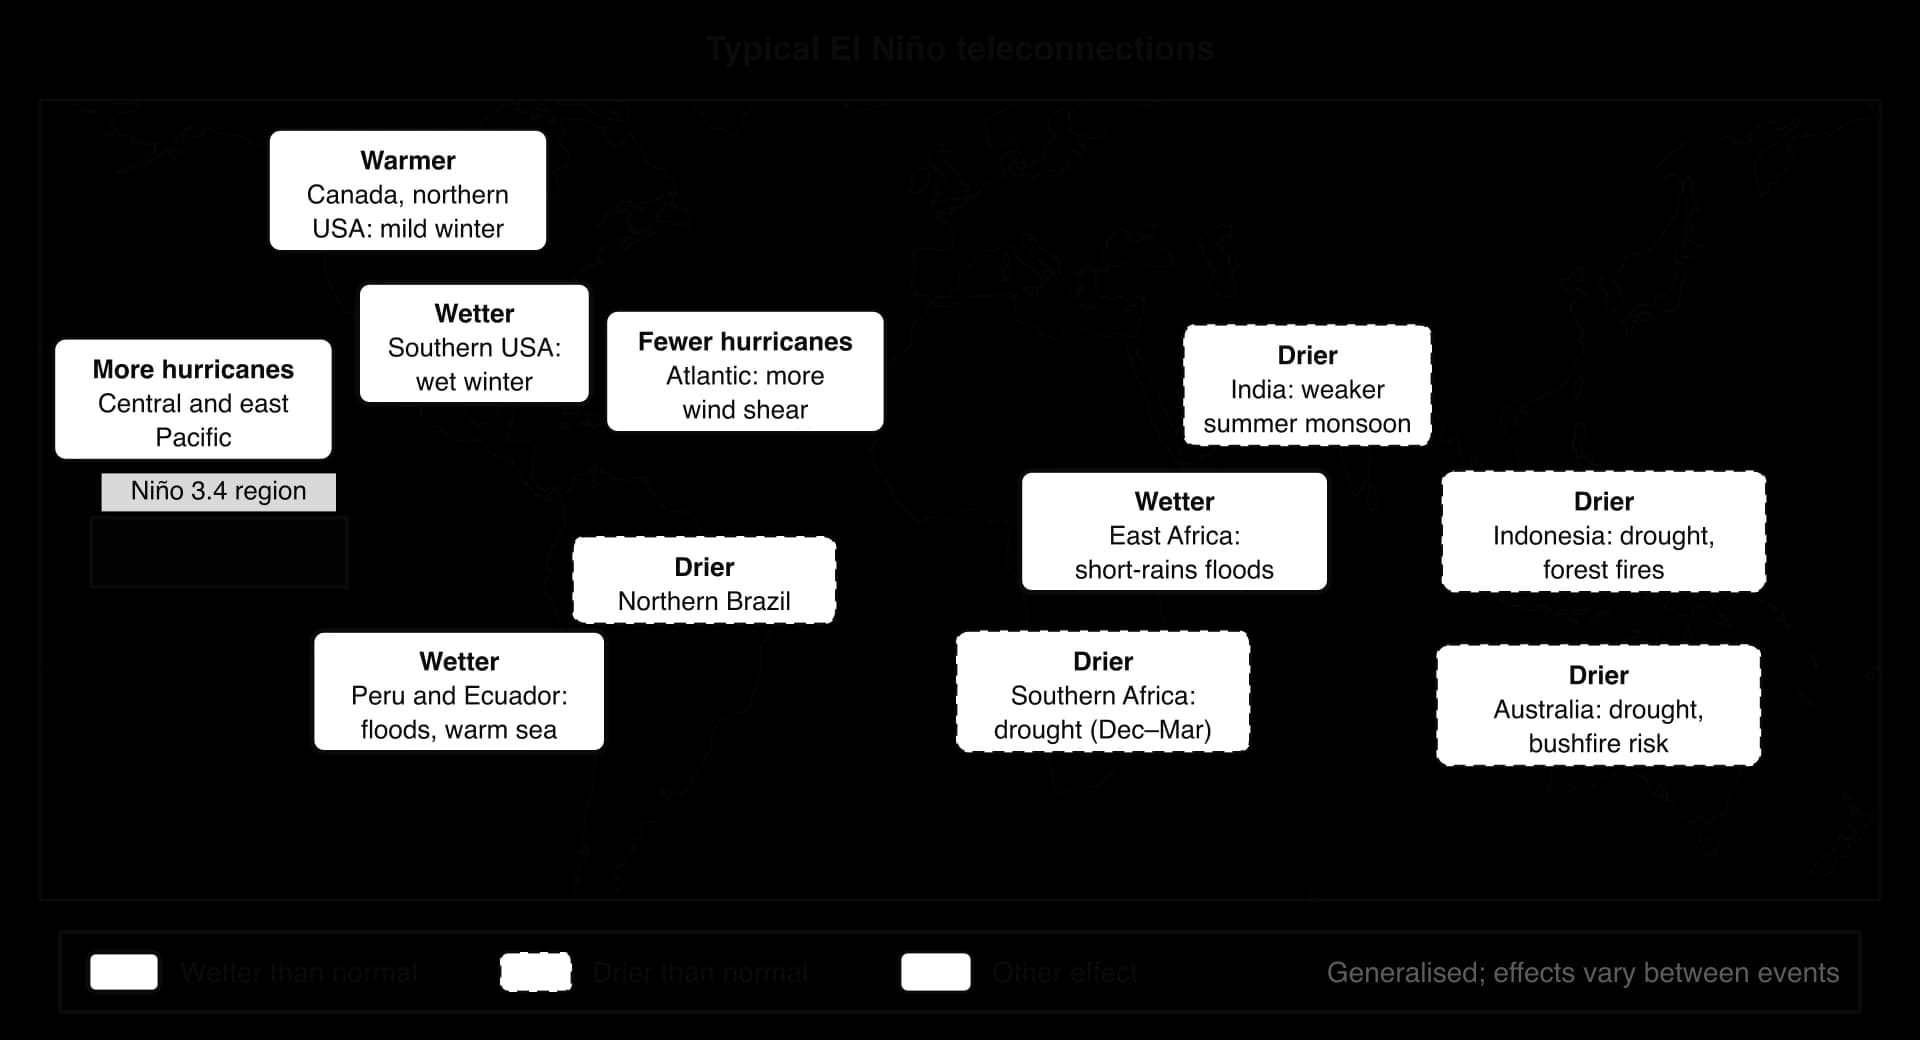
NOAA and the Australian Bureau of Meteorology issue monthly ENSO forecasts from buoys, satellites and computer models. They are reliable several months ahead once an event has begun, but least reliable in the northern spring, and they give farmers and aid agencies time to prepare.
Effects of El Niño and La Niña
ENSO’s effects are climatic, environmental and economic, and they are linked: drought leads to fires, and both lead to economic losses.
Peru’s anchoveta fishery shows how one physical change runs through all three. When upwelling weakens in an El Niño, phytoplankton and the anchoveta that feed on them decline or move south and deeper, seabirds that feed on the fish die or fail to breed, and catches, fishmeal exports and fishing jobs fall. After the strong El Niño of 1972, which came on top of years of overfishing, the catch collapsed from its 1971 record of 13.1 million tonnes.
Type | El Niño | La Niña |
|---|---|---|
Climatic | Drought in Indonesia, Australia, India and southern Africa; floods in Peru, Ecuador and East Africa; fewer Atlantic hurricanes; record global temperatures (2016, 2024) | Floods in eastern Australia and Indonesia; drought in the south-west USA and Horn of Africa; active Atlantic seasons |
Environmental | Food web off Peru collapses; seabird deaths; coral bleaching (2014–17); fires in Indonesia (1997, 2015) | Cold, productive water off Peru |
Economic and social | Fishmeal exports fall; poor harvests and higher food prices; low reservoirs; cholera after floods, more dengue and malaria | Crop and livestock losses in drought; flood damage to homes, mines and farms |
Positive effects | Milder winters in Canada and the northern USA; quieter Atlantic seasons | Reservoirs refilled in eastern Australia; good fishing off Peru |
Detailed examples of ENSO impacts
Event | Place | Physical effect | Impacts |
|---|---|---|---|
2015–16 El Niño (ONI +2.6 °C) | Indonesia | Drought; fires in drained peatlands | More than 28 million people affected by haze; one study estimated more than 100,000 additional deaths across the region |
2015–16 El Niño | Ethiopia | Failure of the summer rains | About 10 million people at risk of hunger and in need of food aid |
2010–11 La Niña | Queensland, Australia | Record December rain on saturated catchments | 33 deaths; more than 200,000 people affected; 78% of the state declared a disaster zone; economic cost about A$14.1 billion |
2020–23 La Niña | Horn of Africa | Five consecutive failed rainy seasons | Worst drought in 40 years; nearly 32 million people food insecure; about 43,000 excess deaths in Somalia in 2022 |
2023–24 El Niño (ONI +2.0 °C) | Panama | Drought lowered Gatun Lake, which fills the canal locks | Transits cut from 36 to 22 ships a day in December 2023, delaying world trade |
Sources: Wikipedia, “2015 Southeast Asian haze”, “2014–2016 El Niño event”, “2010–2011 Queensland floods”, “2020–2023 La Niña event”, “2023–2024 El Niño event” and “Panama Canal” (accessed 2026); WMO (2022), joint alert on East Africa.
Queensland and the Horn of Africa show the role of vulnerability: Australia’s wealth, insurance and emergency services kept Queensland’s death toll low despite huge costs, while in Somalia, where most rural people depend on rain-fed farming and conflict limits aid, five failed rainy seasons caused a humanitarian crisis.
ENSO and climate change
Whether global warming is changing ENSO itself is uncertain: some models project more frequent extreme events, others little change, and the reliable record is only about 70 years long. Its impacts are growing, however. Each El Niño now adds its warmth to a higher baseline, so the 2023–24 event helped make 2024 the first calendar year more than 1.5 °C above pre-industrial levels, and a warmer atmosphere holds more moisture, making ENSO rainfall extremes heavier.
How hurricanes form
A tropical cyclone is an intense, rotating low-pressure system that forms over warm tropical oceans, with organised thunderstorms around a central eye and sustained winds of at least 119 km h⁻¹ (74 mph). The same storm has different names in different basins: a hurricane in the North Atlantic and north-east Pacific, a typhoon in the north-west Pacific, and a cyclone in the Indian Ocean and South Pacific.
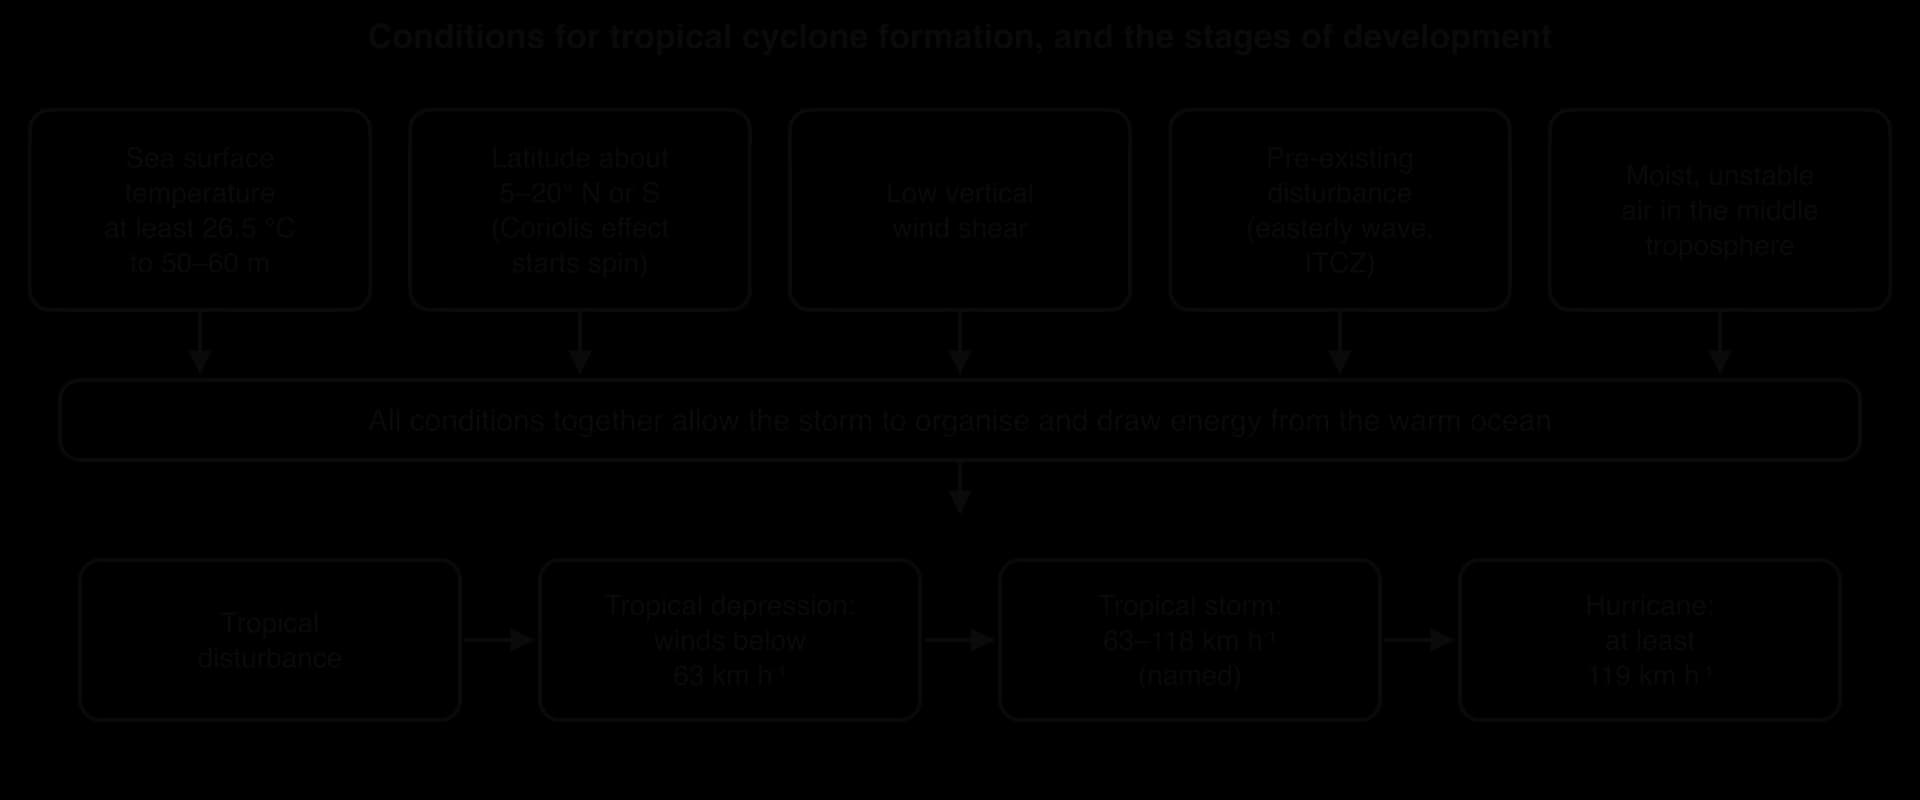
A storm grows through stages defined by its maximum sustained wind: a tropical disturbance (a cluster of thunderstorms), a tropical depression (winds below 63 km h⁻¹), a tropical storm (63–118 km h⁻¹, when it is named) and finally a hurricane, typhoon or cyclone.
Conditions for formation
Condition | Why it matters |
|---|---|
Sea surface temperature of at least about 26.5 °C, to a depth of about 50–60 m | Supplies heat and water vapour; the warm layer must be deep because strong winds mix up cooler water. |
Latitude about 5–20° N or S | The Coriolis effect starts the spin; it is zero at the Equator. |
Low vertical wind shear | Strong shear blows the top of the storm away from its base. |
A pre-existing disturbance | A trigger, such as an easterly wave off West Africa or a disturbance in the Intertropical Convergence Zone. |
Moist, unstable mid-troposphere | Dry air weakens updrafts; moist, unstable air lets tall clouds grow. |
How a hurricane works
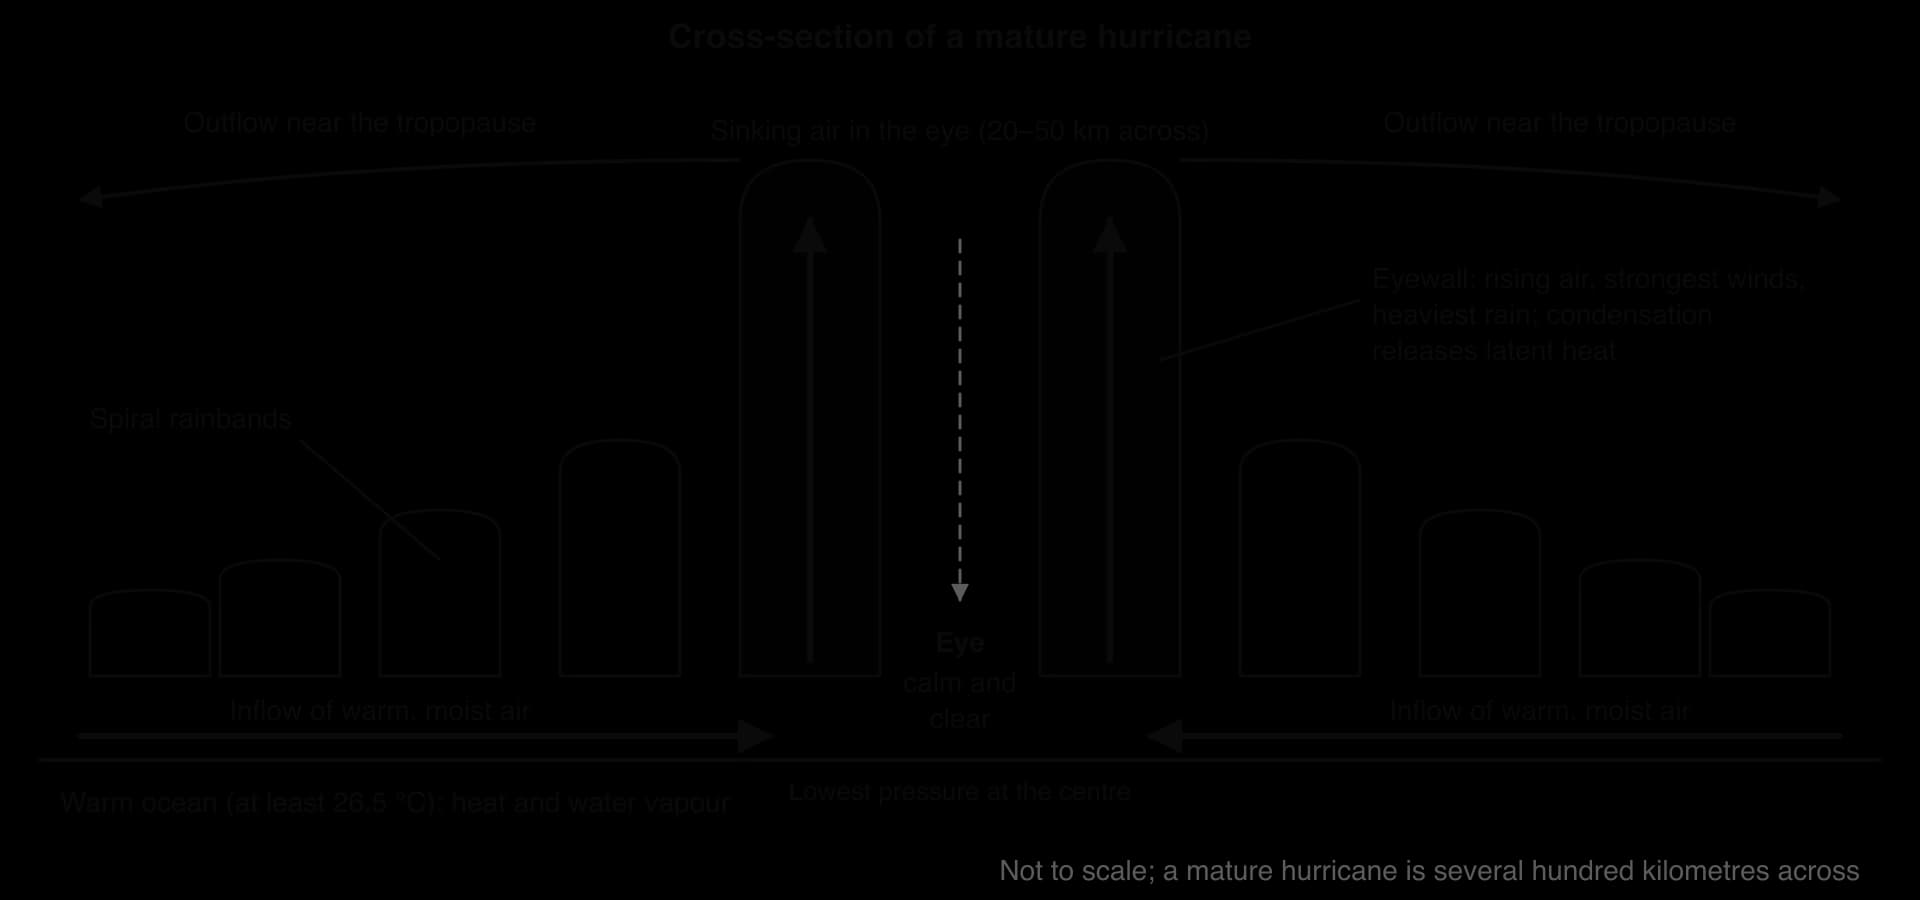
Evaporation, condensation and latent heat. Warm, moist air over the sea rises and cools, and its water vapour condenses into towering clouds, releasing latent heat, which warms the air, makes it rise faster and lowers the surface pressure.
Inflow and spin. Air rushes in at the surface towards the low pressure; the Coriolis effect deflects it, so it spirals inwards (anticlockwise in the northern hemisphere).
Positive feedback. More inflow brings more moisture, more latent heat and lower pressure, so the winds strengthen: a self-reinforcing feedback loop.
Outflow. Near the tropopause, about 12–15 km up, the air flows outwards, removing air from the top of the column so the surface pressure keeps falling.
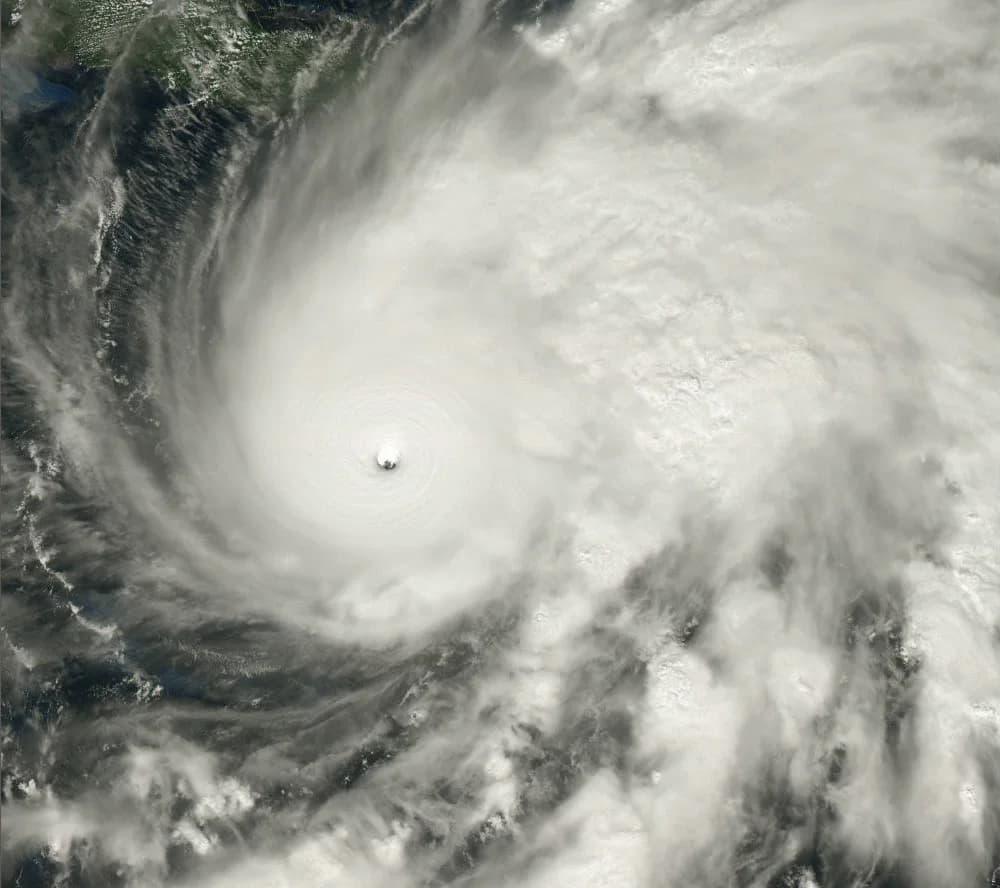
A mature hurricane is several hundred kilometres across. At its centre is the eye, a calm, often clear area typically 20–50 km wide, where air sinks and pressure is lowest. Around it is the eyewall, a ring of towering thunderclouds with the strongest winds and heaviest rain, and beyond that spiral rainbands curve outwards.
Distribution, seasonality and intensity
Tropical cyclones form in seven basins: the North Atlantic, north-east Pacific, north-west Pacific (the most active), north Indian, south-west Indian, Australian region and South Pacific. The South Atlantic almost never has them, because strong wind shear and relatively cool water prevent formation. Storms usually move west with the trade winds, then recurve poleward and eastward into the westerlies.
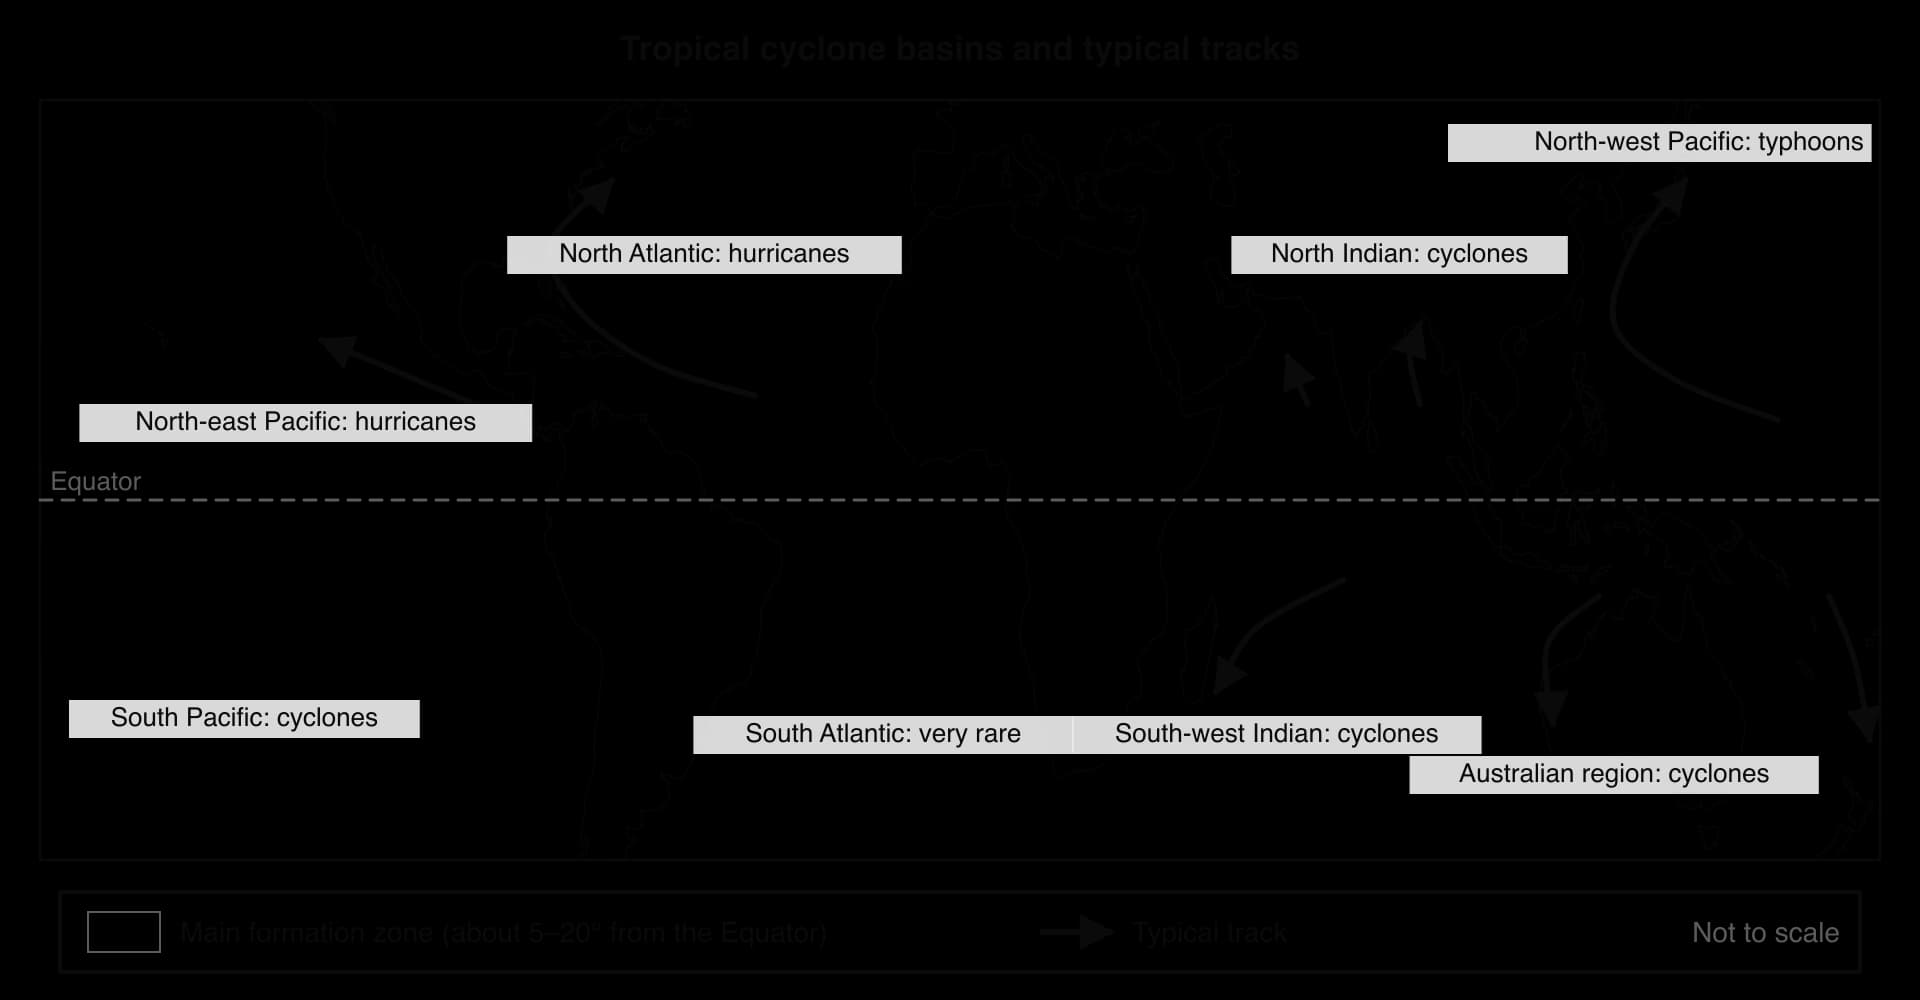
Each basin has a season set by when the sea is warmest: the Atlantic season runs officially from 1 June to 30 November and peaks in September; the north-west Pacific has typhoons in any month, peaking from July to October; the southern hemisphere season runs from about November to April.
The Saffir–Simpson scale
The Saffir–Simpson scale (Saffir–Simpson Hurricane Wind Scale) classifies hurricanes into five categories by maximum sustained wind speed; category 3 and above are major hurricanes.
Category | Sustained wind (km h⁻¹) | Typical damage |
|---|---|---|
1 | 119–153 | Damage to roofs and trees; power cuts |
2 | 154–177 | Major roof damage; many trees uprooted |
3 (major) | 178–208 | Serious damage to well-built houses; no power or water for days |
4 (major) | 209–251 | Loss of most roofs and some walls; uninhabitable for weeks |
5 (major) | 252 or more | A high share of homes destroyed; uninhabitable for weeks or months |
The scale measures wind only, yet most deaths are caused by water, through storm surge and rainfall flooding, which depend on a storm’s size, speed and rainfall and on the shape of the coast. A slow, large category 1 storm can kill more people than a fast category 4, so forecasters now issue separate storm surge warnings.
Sources: Wikipedia, “Saffir–Simpson scale”, citing the US National Hurricane Center (accessed 2026).
Rapid intensification and climate change
Rapid intensification is an increase in maximum sustained winds of at least 55 km h⁻¹ (30 knots) in 24 hours. It happens when a storm with low wind shear passes over water with very high ocean heat content, and it is a growing problem for forecasters, because a storm can become a major hurricane before people have evacuated. In October 2023, Hurricane Otis increased its winds by 165 km h⁻¹ in 21 hours and struck Acapulco, Mexico, as a category 5 hurricane, less than a day after it had been expected to arrive as a category 1.
Part of the National Hurricane Center’s best track for Hurricane Melissa shows a rapid intensification.
Time (UTC) | 25 Oct 0600 | 25 Oct 1800 | 26 Oct 0600 | 26 Oct 1800 | 27 Oct 0600 | 27 Oct 1800 |
|---|---|---|---|---|---|---|
Wind (knots) | 60 | 75 | 105 | 120 | 135 | 155 |
Pressure (hPa) | 986 | 976 | 958 | 944 | 923 | 906 |
Sources: NOAA National Hurricane Center, Tropical Cyclone Report AL132025 (2026), best track. 1 knot = 1.852 km h⁻¹.
Climate change is likely to alter tropical cyclones in several ways. Warmer oceans supply more energy, so the proportion of storms reaching categories 4 and 5 is projected to increase; a warmer atmosphere holds more water vapour, so rainfall rates are likely to rise; and sea-level rise lets every surge reach further inland. Whether the total number of storms will change is much less certain, and the short satellite record, which began in the 1970s, makes trends hard to detect.
Physical impacts of hurricanes on coastal margins
Tropical cyclones affect coasts through linked hazards: a primary hazard such as wind or surge, and secondary hazards such as landslides and disease that follow from it.
Storm surge
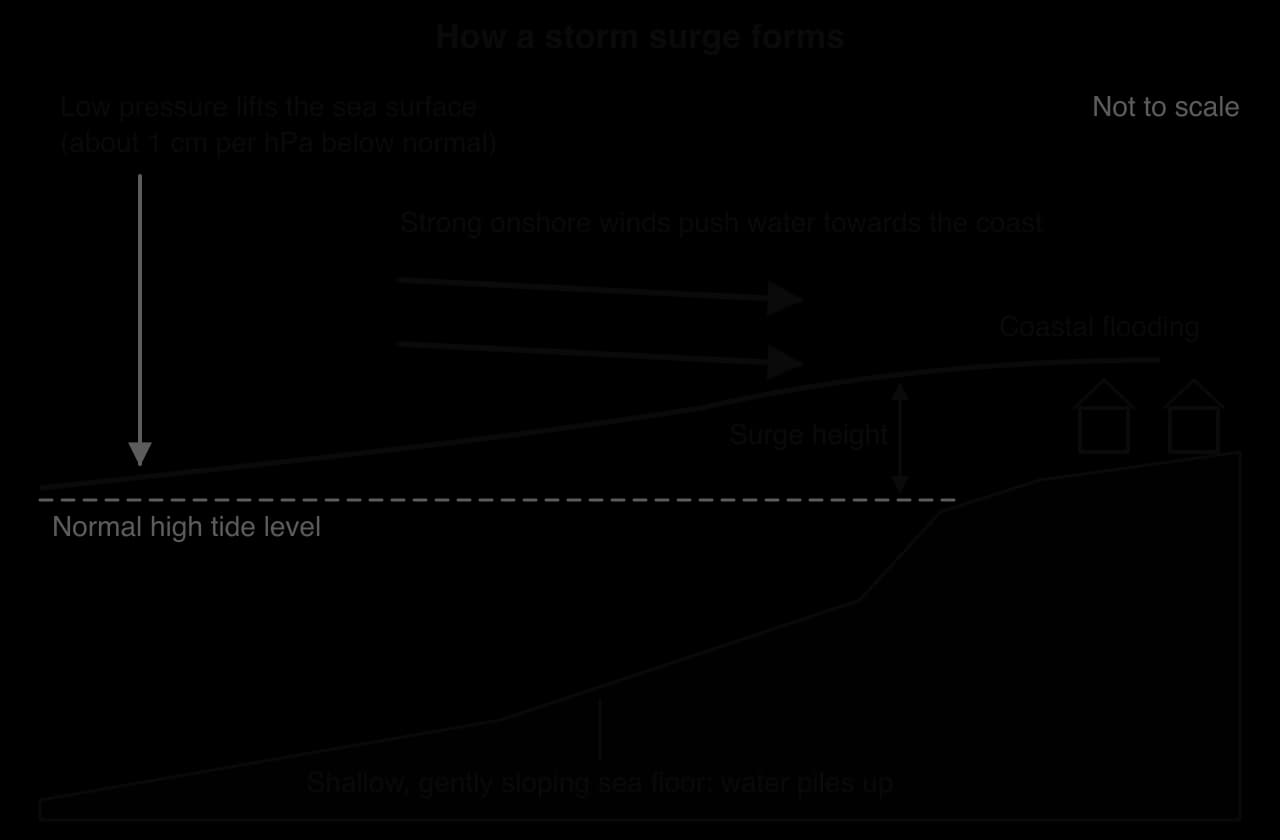
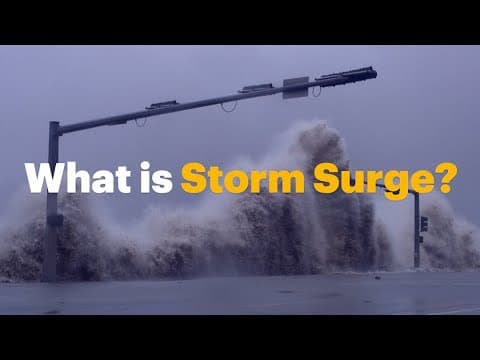
A storm surge is the abnormal rise in sea level generated by a storm, over and above the predicted tide. It is usually the deadliest hazard in a tropical cyclone, because it floods low-lying coasts suddenly and with great force.
Low pressure lifts the sea by about 1 cm for every hectopascal (hPa) the pressure falls below normal, usually adding up to about 1 m.
Onshore winds pile water against the coast. Over a shallow continental shelf the water cannot flow back underneath, so it builds up; this is usually the largest part of the surge.
The shape of the coast concentrates it. A gently shelving sea floor, a funnel-shaped bay or estuary, and the side of the storm with the strongest onshore winds (to the right of the track in the northern hemisphere) all raise the surge.
Timing and waves. A surge at high tide produces a higher storm tide, with large waves on top.
The deadliest surges strike low, densely populated coasts. Hurricane Katrina (2005) drove a surge of 8.47 m into Pass Christian, Mississippi, and breached the levees of New Orleans; 1,392 people died. Typhoon Haiyan (2013) sent a 5.2 m surge into Tacloban in the Philippines; the official death toll was 6,300, most of them in Eastern Visayas.
Sources: Wikipedia, “Storm surge”, “Hurricane Katrina”, “Typhoon Haiyan” and “Hurricane Otis”, citing NOAA, the National Hurricane Center and the Philippine NDRRMC (accessed 2026).
 YouTube
Wind, waves, rain and the coastline
Wind destroys roofs, light buildings, power lines and trees and turns debris into missiles; its force rises with the square of its speed.
Waves erode beaches and dunes and destroy sea walls and piers.
Heavy rain, especially from slow storms over mountains, causes river floods and flash floods, often the main cause of death after landfall, and landslides on saturated slopes.
Coastal change. Surge and waves cut back beaches, dunes and cliffs and can breach barrier islands; seawater contaminates farmland and wells with salt for years. Where mangroves, saltmarshes and reefs have been removed, impacts are usually greater.
The ocean as a store and source of carbon dioxide
The ocean is the largest active carbon store at the Earth’s surface: of the roughly 40,000 gigatonnes of carbon (Gt C) cycling between air, sea, soils and living things on timescales under 10,000 years, about 38,000 Gt C (95%) is in the ocean, mostly dissolved in the deep sea. Where surface water holds less CO₂ than the air above it, CO₂ dissolves and the ocean acts as a carbon sink; where it holds more, CO₂ escapes. Taken as a whole, the ocean has been a net sink since the Industrial Revolution, absorbing about a quarter of the CO₂ released by fossil fuels and land-use change.
Sources: Wikipedia, “Oceanic carbon cycle” and “Ocean acidification”, citing the Global Carbon Project and IPCC AR6 (accessed 2026).
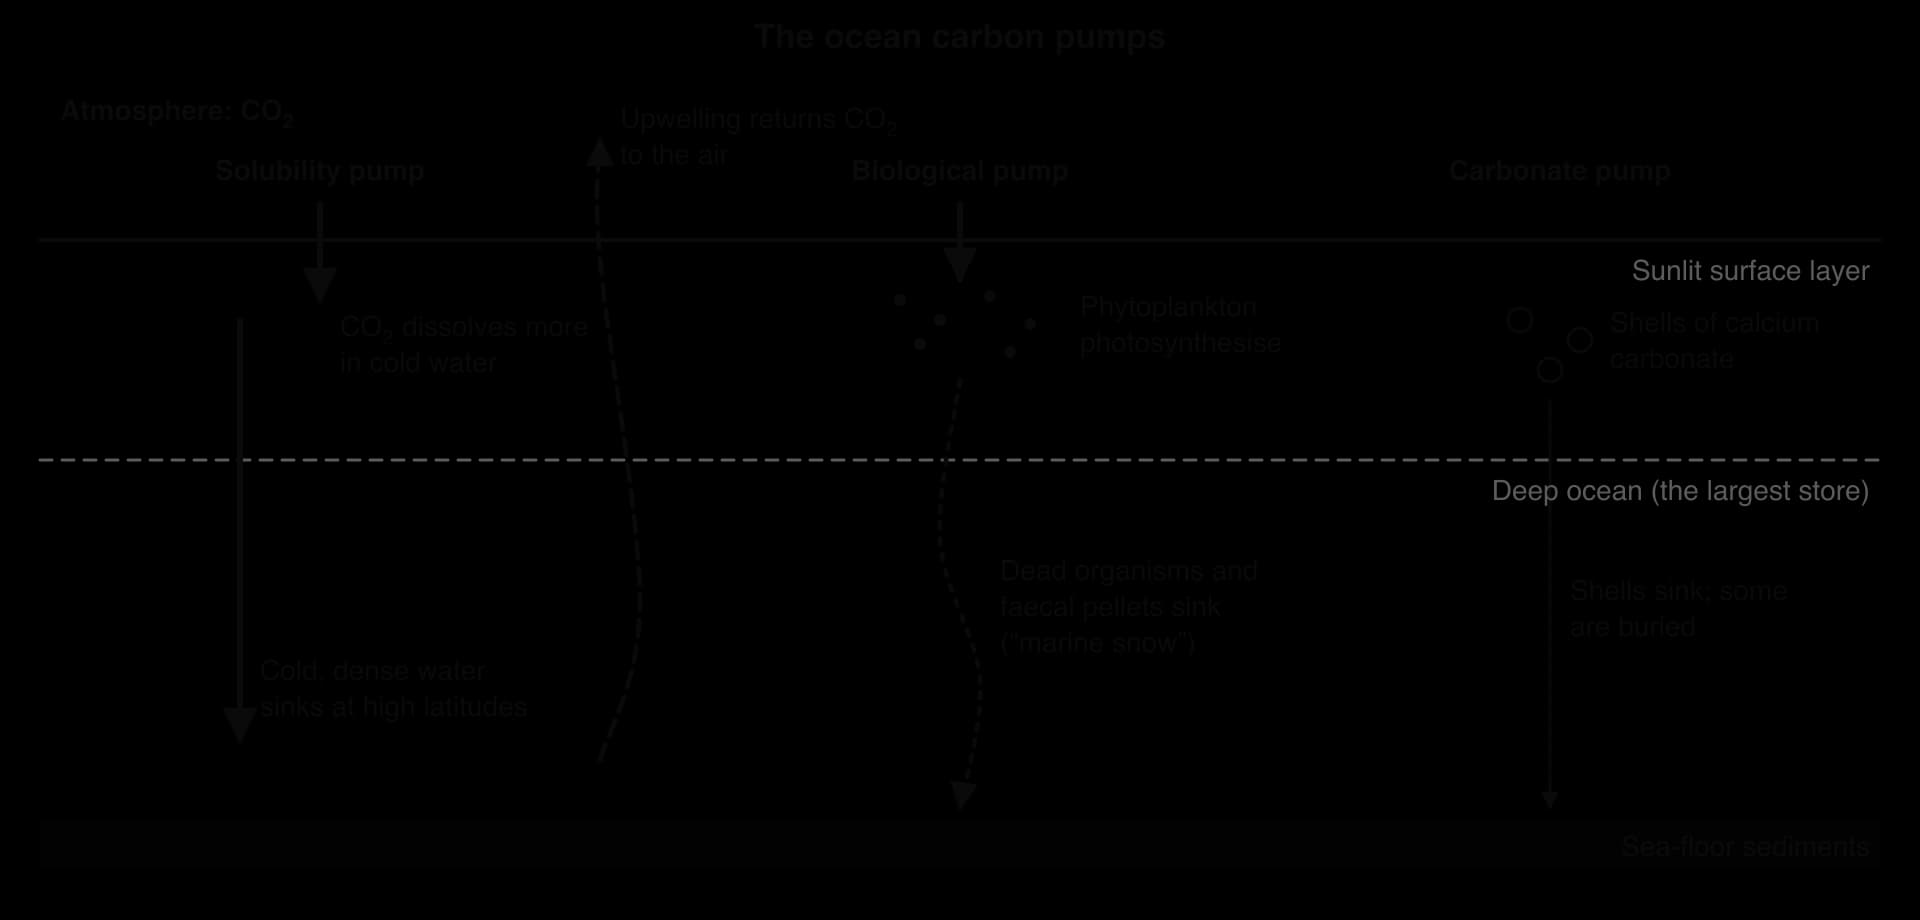
The solubility pump is the physical route. CO₂ dissolves more readily in cold water, so high-latitude surface water absorbs large amounts, and where it sinks with the thermohaline circulation the carbon is carried into the deep ocean for centuries. The biological pump is the living route: phytoplankton take up CO₂ in photosynthesis, and dead plankton, faecal pellets and clumps of debris (“marine snow”) sink, releasing carbon in the deep water or burying it in sediments. In the carbonate pump, plankton shells of calcium carbonate sink and build up as sediments such as chalk.
A changing role
Warming and stratification: warmer water holds less CO₂, and a warmer, lighter surface layer mixes less with the deep ocean, carrying less carbon down and fewer nutrients up.
A weaker AMOC sinks less cold water in the North Atlantic, weakening the solubility pump.
Upwelling regions, such as the eastern equatorial Pacific and the Southern Ocean, release CO₂ from old, carbon-rich deep water and act as sources.
Chemistry: as seawater absorbs CO₂, its capacity to absorb more falls.
Each change is a positive feedback: warming reduces ocean uptake, leaving more CO₂ in the air and causing more warming. Models suggest the share of emissions the ocean absorbs will fall if emissions stay high.
Ocean acidification and coral reefs
The CO₂ the ocean absorbs reacts with seawater. Ocean acidification is the resulting long-term fall in the pH of seawater. Dissolved CO₂ forms carbonic acid, which releases hydrogen ions (H⁺), lowering the pH:
Many of the extra hydrogen ions combine with carbonate ions (CO₃²⁻), so fewer carbonate ions remain. Corals, molluscs and many plankton need carbonate ions for calcification, building shells and skeletons of calcium carbonate, so calcification becomes slower and costlier, and in very acidic water shells can dissolve.
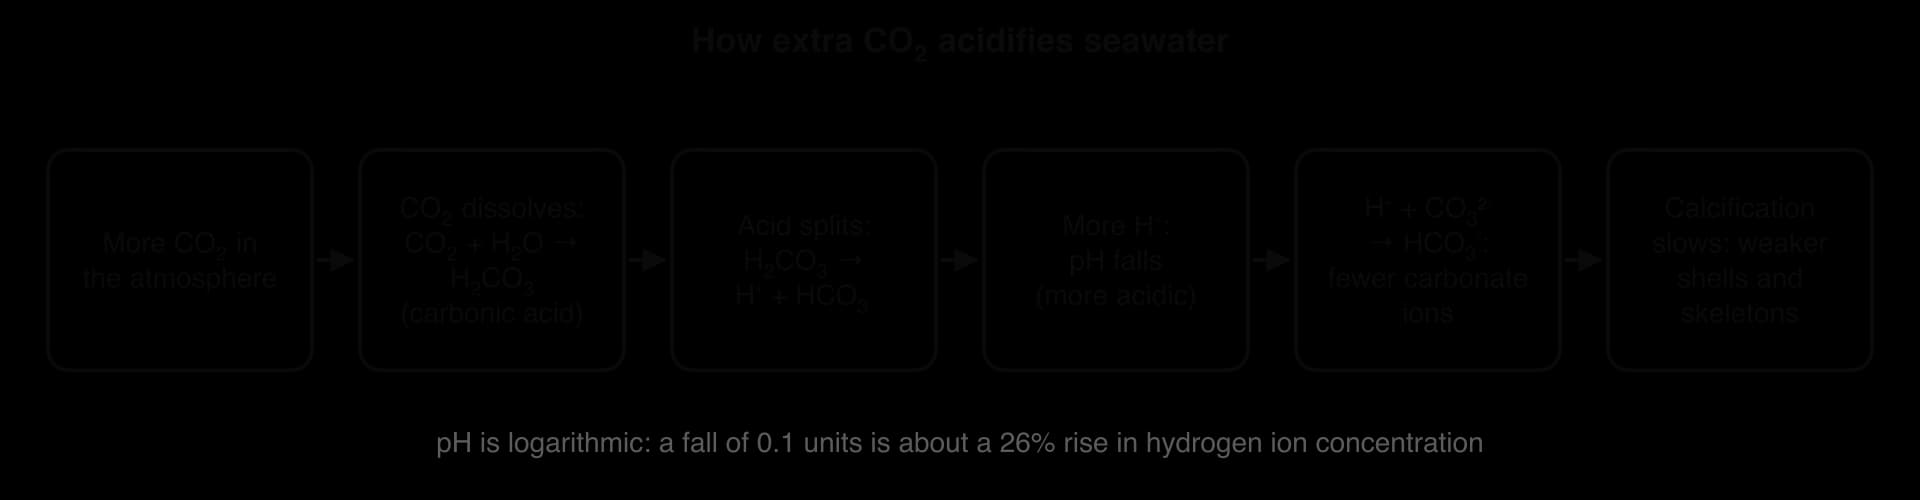
Between 1950 and 2020 the average pH of the ocean surface fell from about 8.15 to about 8.05. Because the pH scale is logarithmic, that is about a 26% rise in hydrogen ion concentration, and since pre-industrial times (pH about 8.2) the rise is about 30%. The ocean is still alkaline: “acidification” describes the direction of change. The longest records come from Hawaii: Mauna Loa (air, since 1958) and Station ALOHA, 100 km north of Oahu (seawater, since 1988).
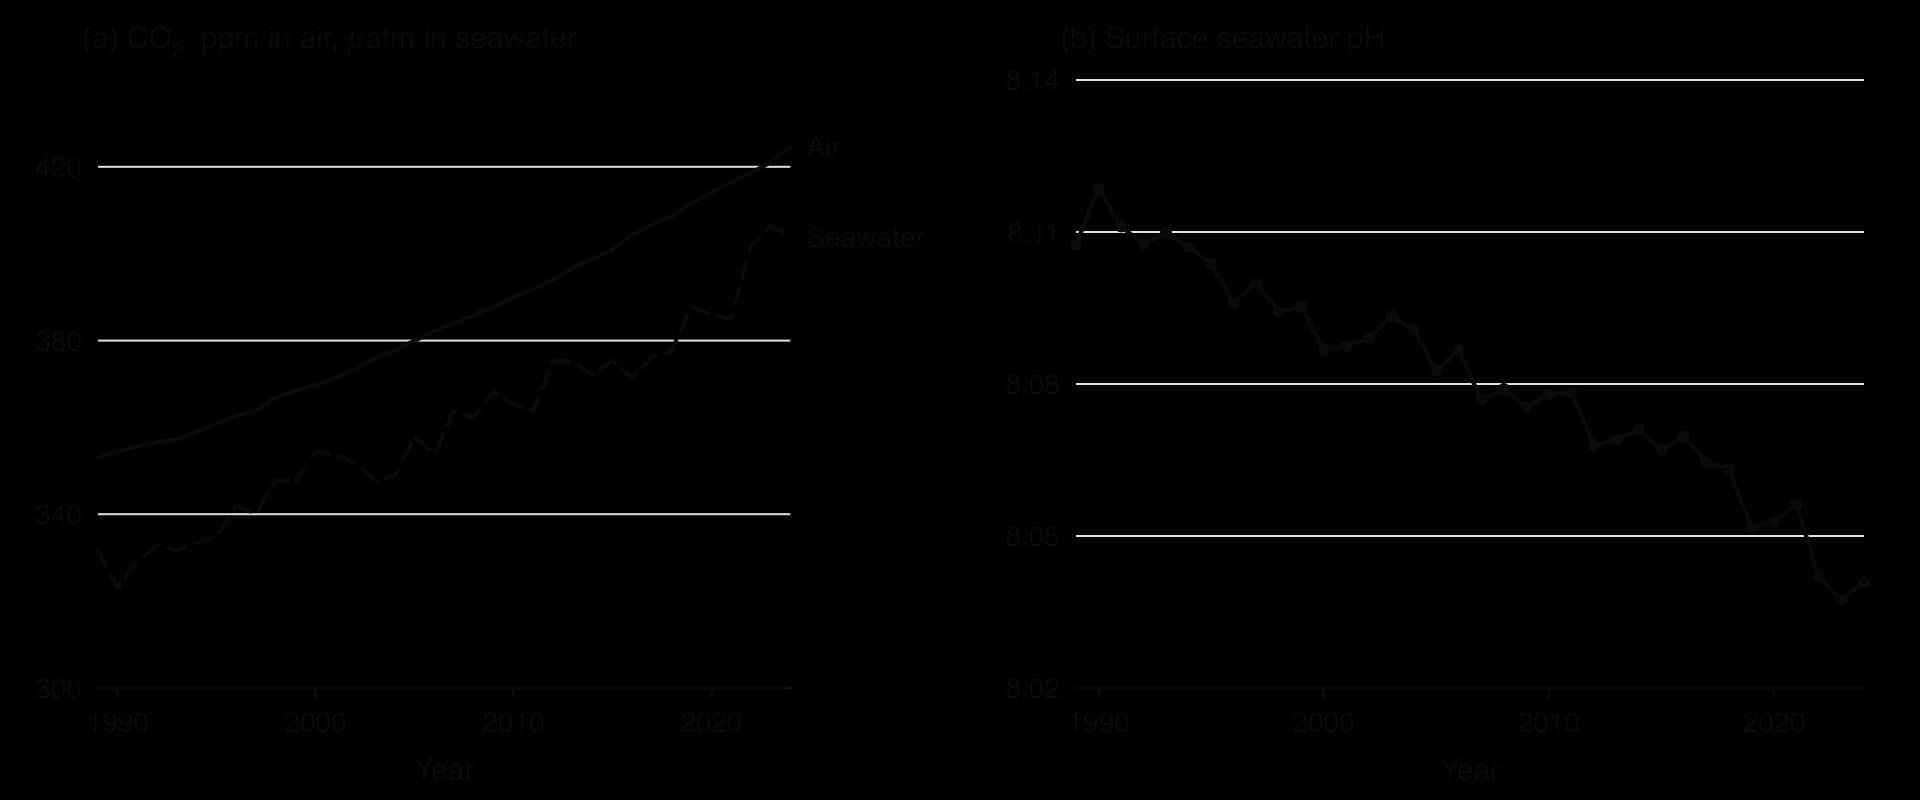
Sources: NOAA Global Monitoring Laboratory, Mauna Loa CO₂ annual means (2026); Dore et al., Hawaii Ocean Time-series surface CO₂ data product, University of Hawaii, updated January 2026 (annual means calculated from cruise data).
Coral reefs
A coral reef is a structure built from the calcium carbonate skeletons of colonies of coral polyps. Reef-building corals grow best in water of about 26–27 °C (few reefs exist below 18 °C) that is shallow, clear, sunlit and nutrient-poor, so reefs lie mainly between about 30° N and 30° S, away from cold currents and muddy river mouths. Microscopic algae called zooxanthellae live inside the coral’s tissues, photosynthesise and supply up to about 90% of its nutrients. Reefs cover less than 0.1% of the ocean yet support at least a quarter of all marine species.
The coral gives the algae shelter, carbon dioxide and nutrients from its waste, and the algae return sugars and oxygen from photosynthesis. Because nutrients are recycled so closely between the two partners, reefs can be highly productive in clear tropical water that holds few nutrients.
Reefs face two threats from the ocean’s uptake of CO₂ and heat. Acidification reduces calcification, so corals grow more slowly and their skeletons weaken and erode. Warming causes coral bleaching: during a marine heatwave stressed corals expel their zooxanthellae, turn white and begin to starve; they can recover if the water cools within weeks, but long heatwaves kill them.
The threats now come together and more often. NOAA confirmed the fourth global bleaching event in April 2024, and from January 2023 to September 2025 bleaching-level heat stress affected about 84% of the world’s reef area, in the Atlantic, Pacific and Indian Oceans; the Great Barrier Reef bleached in both 2024 and 2025. With heatwaves one or two years apart, corals cannot recover between events.
Sources: Wikipedia, “Coral reef”, “Great Barrier Reef” and “Coral bleaching”, citing NOAA Coral Reef Watch and the Australian Institute of Marine Science (accessed 2026); AIMS, Annual Summary Report on Coral Reef Condition (2025, 2026).
Case study: Hurricane Melissa, Jamaica, 2025
Hurricane Melissa was one of the most intense Atlantic hurricanes on record and the strongest ever to strike Jamaica, a small island state whose vulnerability shaped the impacts.
The place
Jamaica is a Caribbean island of about 2.8 million people (2024) at about 18° N, in the main Atlantic hurricane belt. It is an upper-middle-income country, with a gross national income per capita of US$7,190 in 2024 on the Atlas method. Its economy depends on coastal tourism (more than 4 million international arrivals in 2019) and on agriculture (about 8% of GDP). Much of its population, many hotels and the main airports lie on narrow coastal plains backed by steep mountains, and the south-west coast around Black River is low-lying.
Sources: World Bank, World Development Indicators (population, GNI per capita, agriculture value added, 2024; international arrivals, 2019), accessed October 2026.
Formation and rapid intensification
Melissa grew from a tropical wave that left West Africa on 13 October 2025, became a tropical storm south of Haiti on 21 October and was held weak for four days by wind shear. When the shear relaxed on 24–25 October, the storm sat over water of 30–31 °C with very high ocean heat content and intensified rapidly, becoming a major hurricane early on 26 October (45 knots, about 83 km h⁻¹, in 24 hours) and category 5 on 27 October.
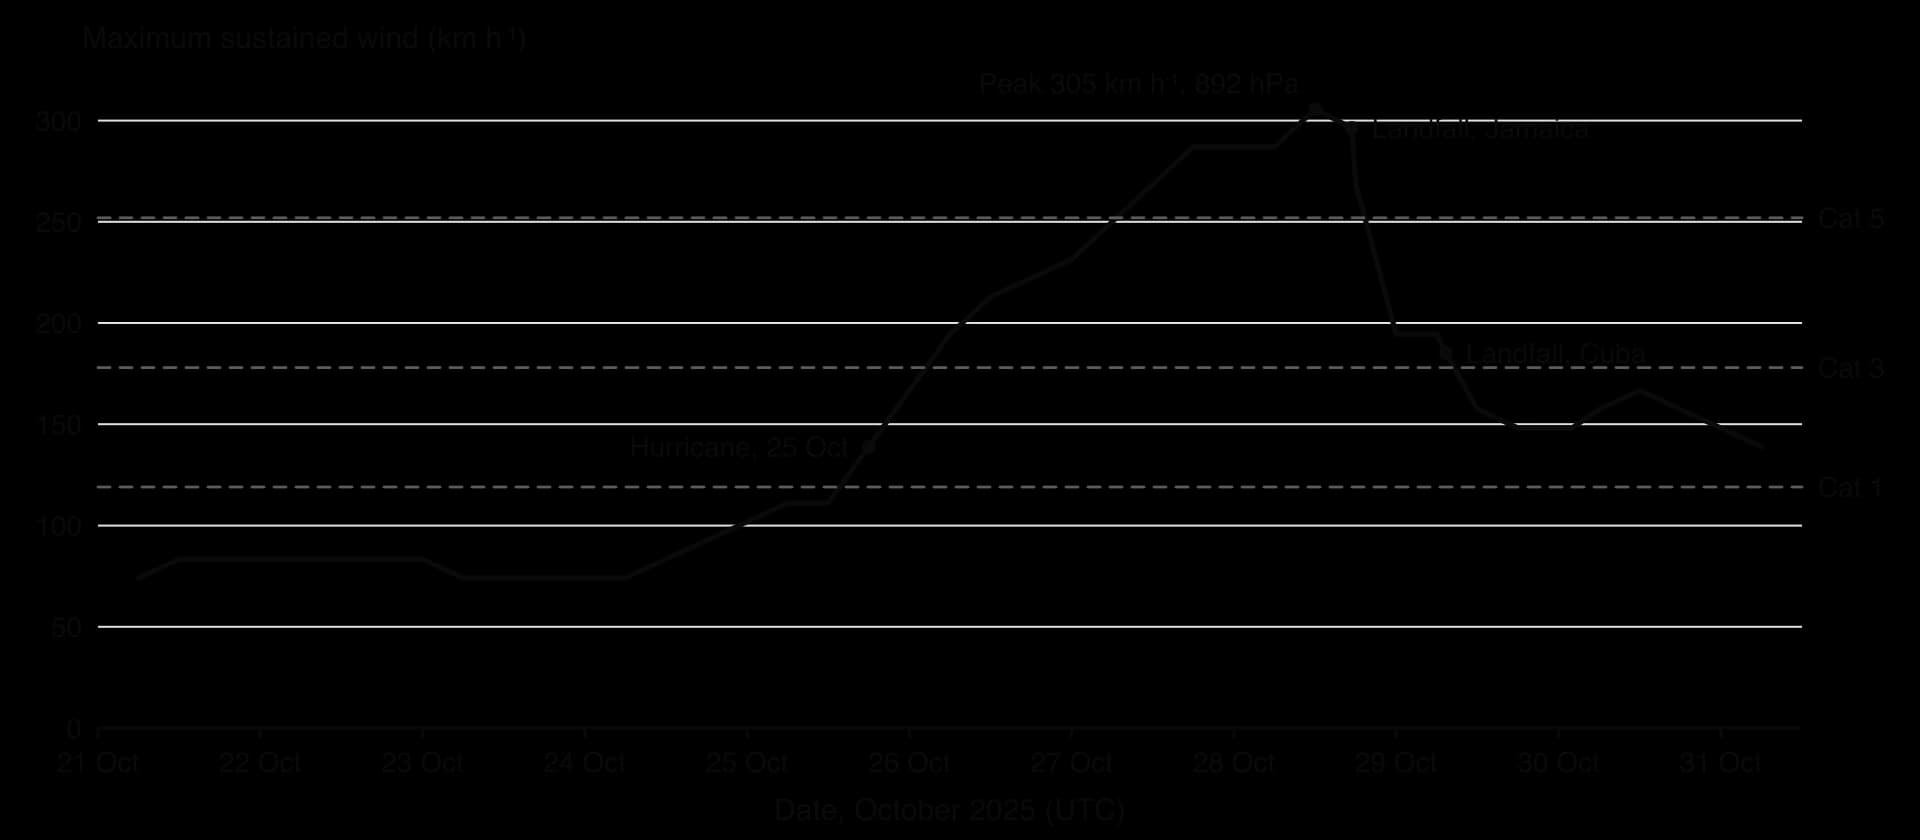
At its peak on 28 October Melissa had winds of 305 km h⁻¹ and a pressure of 892 hPa, tying the Atlantic record for wind speed. It made landfall near New Hope, Westmoreland, at about 1725 UTC with winds of 296 km h⁻¹ and a pressure of 897 hPa, the strongest landfall in Jamaica’s history and tied for the strongest in the Atlantic basin.
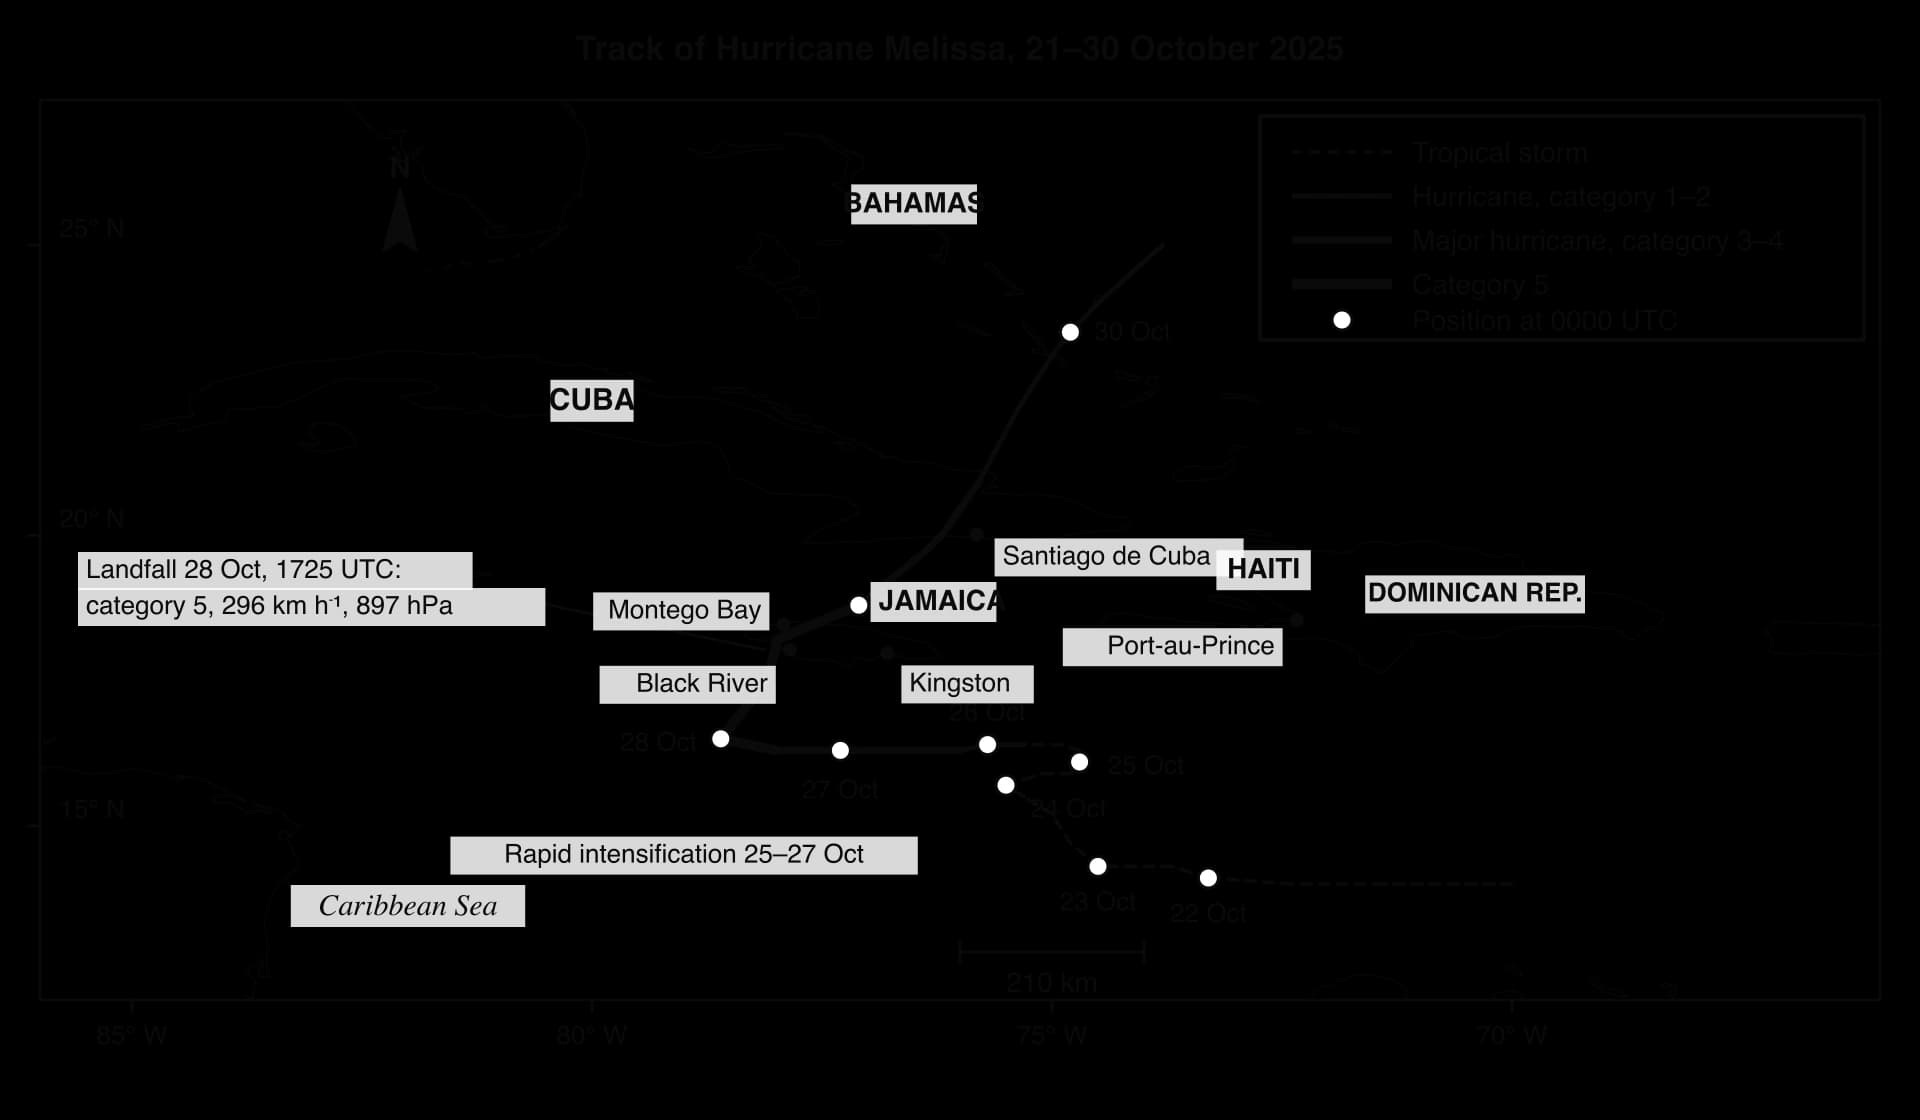
Physical impacts and impacts on people
Storm surge: no tide gauge survived, but a model estimated 2.1–3.4 m above normally dry ground around Crawford and Black River, with destructive waves; 0.6–1.2 m on the north coast at Montego Bay and Falmouth.
Wind: almost all wooden buildings in the south-western parishes were destroyed and most roofs stripped; in Black River nearly 90% of homes lost their roofs.
Rain: moving slowly over high ground, Melissa brought up to 817 mm (Knock Patrick), causing river floods and landslides.
Impact | Jamaica |
|---|---|
Deaths | 45 (18 in St Elizabeth, 15 in Westmoreland); 93 in all countries, 43 of them in Haiti |
Buildings | About 150,000 structures damaged and 24,000 destroyed; several hospitals out of action; 695 of 1,033 public schools damaged |
Agriculture | About 41,390 ha of farmland affected; more than 70,000 farmers lost crops; about 40% of coffee trees damaged; more than 1.25 million livestock died |
Services and health | About 530,000 people without power; a leptospirosis outbreak from contaminated floodwater, with deaths, led to a health emergency |
Economy | Physical damage of US$12.2 billion (World Bank, March 2026); tourism lost about US$62 million in the first week |
Sources: NOAA National Hurricane Center, Tropical Cyclone Report AL132025 (Kelly, Álamo and Mahoney, revised 19 May 2026); Wikipedia, “Hurricane Melissa”, citing the Government of Jamaica and the World Bank (accessed October 2026).
The impacts fell unevenly. The worst damage was in the rural south-west, where many households depend on small farms and fishing and live in lightly built houses, and where surge and eyewall struck together.
Responses and how well they worked
Forecasting was a success: four days before landfall, when Melissa was still a 74 km h⁻¹ tropical storm, the National Hurricane Center forecast a powerful hurricane striking western Jamaica, with a track error of only about 20 km. Preparation on the ground was weaker: only about 1,700 people were in shelters by 27 October, some shelters closed as people arrived, and misinformation kept others away. A catastrophe bond paid Jamaica US$150 million, and in December 2025 development banks and the International Monetary Fund announced up to US$6.7 billion of support over three years, but thousands of families were still homeless months later and the damage far exceeded insurance cover.
What the case shows
Melissa shows process, as latent heat release turned a weak storm into a category 5 hurricane in three days, and place, as surge and wind struck Jamaica’s low south-west coast while rain flooded Haiti’s mountains. It raises power: Jamaica emits a tiny share of greenhouse gases but bears the costs of storms fed by a warming ocean, a point its ministers made at the UN climate conference in November 2025.
Hurricane Melissa changed the life of every Jamaican in less than 24 hours.
— Matthew Samuda, Jamaica’s Minister of Economic Growth, COP30, November 2025, as reported in “Hurricane Melissa”, Wikipedia
By contrast, Hurricane Katrina in the USA in 2005 caused about US$125 billion of damage, ten times Melissa’s, but only about 1% of US GDP; Melissa’s damage was more than half of Jamaica’s annual output. How hard a country is hit, and how fast it recovers, depends on the size and diversity of its economy as well as on the strength of the storm.
To what extent was Melissa’s destructiveness a result of its physical characteristics rather than the vulnerability of the places it struck?
Examine why accurate forecasts four days ahead did not lead more people to use shelters.
Suggest how rising ocean heat content in the Caribbean might change the hurricane risk Jamaica faces.
Exam practice
Paper 1 tests this subtopic’s content through a 10-mark structured question on a stimulus (an ONI series, a currents map, a hurricane track, a pH graph) and 10-mark extended answers.
Most questions on ocean–atmosphere interactions pair a process with a place, so each point needs both a mechanism and a named, located example.
Structured question
Stimulus. Oceanic Niño Index (ONI) values (°C) for overlapping three-month periods, June 2014 to July 2016 (NOAA CPC, ERSSTv6).
Year | JJA | JAS | ASO | SON | OND | NDJ | DJF | JFM | FMA | MAM | AMJ | MJJ |
|---|---|---|---|---|---|---|---|---|---|---|---|---|
2014–15 | +0.1 | +0.1 | +0.2 | +0.5 | +0.7 | +0.8 | +0.7 | +0.7 | +0.7 | +0.9 | +1.0 | +1.2 |
2015–16 | +1.4 | +1.7 | +2.0 | +2.3 | +2.5 | +2.6 | +2.5 | +2.2 | +1.7 | +1.1 | +0.6 | +0.1 |
Extended response
Summary
Trade winds and westerlies, deflected by the Coriolis effect, drive gyres with warm currents on the western sides and cold currents on the eastern sides of ocean basins.
Currents carry heat poleward; cold currents bring fog and coastal deserts, and upwelling supports rich fisheries such as the Peruvian anchoveta.
The global ocean conveyor belt, driven by cold, salty water sinking in the North Atlantic and around Antarctica, takes about 1,000 years per circuit; the AMOC appears to be weakening.
Normally the Walker circulation keeps warm water and rain in the western Pacific; in El Niño warmth and rain shift east, and La Niña intensifies normal conditions.
ENSO is measured by the SOI and ONI (±0.5 °C) and affects distant places through teleconnections, with impacts that depend on vulnerability.
Hurricanes need warm, deep water (about 26.5 °C or more), 5–20° latitude, low wind shear, a disturbance and moist air; latent heat drives a positive feedback, and the Saffir–Simpson scale classifies wind speed.
Storm surge, mainly wind-driven and worst on shallow, funnel-shaped coasts at high tide, is usually the deadliest hurricane hazard.
The ocean stores about 38,000 Gt C and absorbs about a quarter of human CO₂ emissions, but warming and stratification may weaken this sink.
Absorbed CO₂ lowers pH and removes carbonate ions, slowing calcification, while marine heatwaves cause bleaching; together they threaten reefs such as the Great Barrier Reef.
Self-check
- To do:
I can describe and locate the main warm and cold surface currents and explain how gyres form.
- To do:
I can explain how ocean currents transfer energy and nutrients, including upwelling off Peru.
- To do:
I can explain how the global ocean conveyor belt works and why a weaker AMOC matters.
- To do:
I can draw and annotate cross-sections of normal, El Niño and La Niña conditions.
- To do:
I can interpret an ONI time series and examine ENSO’s effects with detailed, located examples.
- To do:
I can explain hurricane formation and structure and classify a storm on the Saffir–Simpson scale.
- To do:
I can explain how a storm surge forms and evaluate Hurricane Melissa’s impacts on coastal places and people.
- To do:
I can explain the ocean carbon pumps and ocean acidification, and distinguish acidification from coral bleaching.
Questions on B.1
55 exam-style questions on this subtopic, written in the style of the IB papers. The first has its markscheme open. Counted on
Question 1 · GEO-0007110 marks
Examine the role of ocean currents in transferring energy and nutrients between different parts of the oceans.
10 marks
Markscheme
Marks should be allocated according to the markbands.
Ocean currents are large-scale, persistent movements of seawater. Surface currents are driven mainly by the prevailing winds (trade winds and westerlies) and deflected by the Coriolis effect into gyres; deep currents form part of the thermohaline circulation (the oceanic conveyor belt), driven by differences in density caused by temperature and salinity. "Energy" here means mainly heat; "nutrients" includes nitrates, phosphates, silicates and iron that support phytoplankton. Credit both horizontal transfers (between latitudes and ocean basins) and vertical transfers (upwelling and downwelling).
Possible applied themes (AO2) demonstrating knowledge and understanding (AO1):
Warm currents on the western margins of ocean basins carry heat poleward from the tropics, eg the Gulf Stream and North Atlantic Drift (Current) in the Atlantic, the Kuroshio off Japan, the East Australian Current; this helps to balance the Earth's energy surplus at low latitudes and deficit at high latitudes.
Cold currents on eastern margins (Humboldt/Peru, California, Canary, Benguela) carry cooler water towards the equator, cooling adjacent coasts and stabilizing the air above them (coastal fog, aridity of the Atacama and Namib deserts).
The thermohaline circulation: dense, cold, salty water sinks in the North Atlantic (Greenland, Norwegian and Labrador seas) and around Antarctica (Weddell Sea), flows through the deep ocean and rises slowly elsewhere; a full circuit takes in the order of 1000 years, so it transfers heat and dissolved substances between ocean basins over long timescales.
Upwelling: offshore Ekman transport along eastern boundaries brings cold, nutrient-rich water from depth to the sunlit surface, supporting phytoplankton and very productive fisheries, eg Peruvian anchoveta, Benguela (Namibia) and Canary (NW Africa) systems; eastern boundary upwelling zones cover a very small fraction of the ocean but supply a large share of the global wild fish catch.
Downwelling and convergence zones (eg the centres of subtropical gyres) are nutrient-poor "ocean deserts" with low productivity, showing the uneven pattern of nutrient transfer.
Equatorial upwelling in the eastern Pacific, and the way ENSO disrupts it (El Niño suppresses upwelling off Peru, cutting nutrient supply and fish catches).
Deep water formation also carries dissolved oxygen and carbon dioxide to depth, linking nutrient and carbon transfers.
Good answers may be well structured (AO4) and may additionally offer a critical evaluation (AO3) which examines the relative importance of surface and deep currents, or of horizontal and vertical transfers, for different places (eg heat transfer matters most for the climate of NW Europe, nutrient transfer for the economy of Peru). Another approach might be to consider timescales: surface currents move energy within months, while the conveyor belt operates over centuries. Some answers may examine how transfers vary over time (ENSO, possible weakening of the Atlantic Meridional Overturning Circulation) and the consequences for people. A well-annotated world map of currents or a diagram of upwelling should be credited (AO4).
For 5–6 marks, expect some weakly-evidenced outlining of how currents move energy and/or nutrients, possibly with only one type of current.
For 7–8 marks, expect a structured account which includes:
either well-evidenced explanation of both energy and nutrient transfers, using named currents
or a discursive conclusion (or on-going evaluation) grounded in geographical concepts and/or perspectives, eg about scale or the importance of different currents.
For 9–10 marks, expect both of these traits.
NB. Maximum [6] if only energy or only nutrient transfers are addressed.
Markbands (10 marks, 2 marks per band)
Marks | Level descriptor |
|---|---|
0 | The response does not reach a standard described by the descriptors below. |
1–2 | Too brief, lists unconnected information, not focused on the question and lacks structure. Knowledge is very general, with large gaps or errors; examples or case studies are missing or only listed. No analysis; terminology is missing or used incorrectly. |
3–4 | Too general, lacks detail, not focused on the question and largely unstructured. Outlines examples, statistics and facts, both relevant and irrelevant, with links to the question only listed. Basic terminology is used, with errors or inconsistently. No critical evaluation of evidence; any conclusion is irrelevant. |
5–6 | Partially addresses the question, with a narrow argument, an unsubstantiated conclusion and limited evaluation. Describes relevant supporting evidence (examples, case studies) and outlines links to the question. The argument repeats one point or covers only part of the question. Other perspectives, or strengths and weaknesses of evidence, are listed. |
7–8 | Addresses the whole question; the analysis is evaluated and the conclusion is relevant but lacks balance. Relevant evidence is described correctly and covers all the main points. The argument is clear but one-sided or unbalanced. Complex terminology is used correctly but not consistently. Other perspectives, or strengths and weaknesses of evidence, are described. |
9–10 | In-depth and specific to the question (topic and command term). Correct, relevant examples, statistics and detail are integrated and their link to the question explained. The argument is balanced, explaining complexity, exceptions and comparisons. Evaluation of evidence and perspectives is well developed, and the conclusion is balanced and aligned with the evidence. Logically structured and easy to follow. |
Question 2 · GEO-0007210 marks
Evaluate the importance of the oceanic conveyor belt for the climates of different places.
10 marks
Answer it, then compare with the markscheme.Check this one with a free account
Question 3 · GEO-0007310 marks
Examine the extent to which upwelling of ocean water determines the productivity of fisheries in different places.
10 marks
Answer it, then compare with the markscheme.Check this one with a free account
Carry on with B.1 in Augment
With a free account, Augment remembers where you stopped and what you have practiced.