
Evaluate community participation, multipurpose dams, integrated drainage basin management and wetland protection, using the Mekong dams, the Murray–Darling Basin Plan and the Pantanal.
Each is in the Geography glossary, with every other term in the subject.
An approach in which management decisions are treated as experiments, monitored, and revised as new information about their effects becomes available.
An approach in which local communities identify their own water needs and plan, build and maintain solutions, often small-scale and low-cost, with outside support where needed.
A small, low barrier built across a stream or gully to slow runoff, trap sediment and let water infiltrate and recharge groundwater; the johad of north India is one form.
The involvement of local water users in decisions about the planning, construction, operation, maintenance and financing of water services and resources.
A method of appraising a project by comparing its expected costs and benefits, usually in monetary terms over its lifetime, to judge whether it is worthwhile.
A barrier built across a river or stream to hold back water, raise its level or control its flow.
An approach to water scarcity that reduces or reshapes demand, through pricing, metering, restrictions, efficient technology and education, rather than increasing supply.
The benefits people obtain from ecosystems, grouped as provisioning (food, water), regulating (flood control, purification), supporting (habitat, nutrient cycling) and cultural (recreation, heritage) services.
Explain why the participation of local communities improves water management in different economic development contexts.
Distinguish between top-down and bottom-up approaches to water management, and evaluate examples of each.
Examine strategies for sustainable and efficient water use, and for access to clean, safe and affordable water.
Describe the purposes of multipurpose dam schemes and evaluate their costs and benefits for different stakeholders.
Evaluate contemporary dam building in one major drainage basin, the Mekong.
Explain the principles of integrated drainage basin management (IDBM) and evaluate one recent IDBM plan.
Examine the pressures on major wetlands and evaluate efforts to protect them, including the Ramsar Convention.
Discuss the future possibilities for one wetland area.
Water management is the planning and control of how water is stored, distributed, used and protected. As demand grows and the climate changes, the choices made now, between big dams and small community schemes, between managing a river piece by piece or as a whole basin, between draining wetlands and protecting them, will shape water security for decades.
The topic is about possibility: the alternative futures that different management choices open or close. It is equally about power, because each choice favours some groups over others. A dam may bring electricity to a capital city while ending the fishery of a village downstream, and a basin plan that returns water to rivers may cost irrigators their livelihoods.
71 exam-style questions on this subtopic, written in the style of the IB papers. The first has its markscheme open. Counted on
Evaluate the effectiveness of strategies to reduce the impacts of agricultural activities on freshwater quality in one or more named places.
10 marks
Marks should be allocated according to the markbands.
Agriculture affects freshwater quality mainly through nutrient pollution (nitrates and phosphates from fertilisers and manure, leading to eutrophication), salinization from irrigation, pesticides, and sediment from soil erosion. Strategies may be regulatory (laws, limits, zoning), economic (taxes, subsidies, payments to farmers), technical (buffer strips, wetlands, drip irrigation, drainage) or voluntary/community-led. Places must be named; accept places at any scale from a single lake catchment to a country.
Possible applied themes (AO2) demonstrating knowledge and understanding (AO1):
the EU Nitrates Directive (1991) and Nitrate Vulnerable Zones limit when and how much manure and fertiliser can be applied; nitrate levels in some rivers have fallen but compliance is uneven
Denmark’s action plans for the aquatic environment from 1987 onwards combined fertiliser accounts, limits and buffer zones, and greatly reduced nitrogen surpluses, though coastal waters remain eutrophic
Lake Erie: after the 2014 Toledo drinking-water ban, the USA and Canada set a target of a 40% cut in phosphorus loads under the Great Lakes Water Quality Agreement; voluntary farm measures in the Maumee basin (eg Ohio’s H2Ohio programme) have had limited measurable effect, and blooms still recur
Lake Taihu (China): after the 2007 bloom, factories and livestock farms were closed or relocated and dredging was carried out; water quality improved but blooms continue
Murray–Darling Basin: salt interception schemes pump saline groundwater away from the River Murray and have lowered river salinity; replanting deep-rooted vegetation addresses dryland salinity but takes decades
With a free account, Augment remembers where you stopped and what you have practiced.
The quantity, timing and quality of water released or left in a river to sustain its ecosystems and the people who depend on them.
Lightly used household wastewater from sinks, baths, showers and washing machines, but not toilets, which can be reused for purposes such as flushing or irrigation.
The right of every person to sufficient, safe, acceptable, physically accessible and affordable water for personal and domestic use, recognised by the UN General Assembly in 2010.
Electricity generated by the flow of water through turbines, usually water released from a reservoir behind a dam.
The coordinated planning of land and water across a whole drainage basin, regardless of administrative or national borders, involving all stakeholders and balancing economic, social and environmental goals.
A process that coordinates the development and management of water, land and related resources to maximise economic and social welfare equitably without harming the sustainability of ecosystems.
A very large dam, usually more than about 150 m high, with a reservoir of several cubic kilometres or a capacity above 1,000 MW, whose impacts extend across a whole basin.
A dam and reservoir project designed to serve several purposes at once, such as hydroelectric power, irrigation, flood control, water supply and navigation.
Water that is produced and put into a supply network but not billed to customers, because of leaks, theft through illegal connections or metering errors.
A wetland in which waterlogged conditions slow decomposition, so partly decayed plant matter accumulates as peat and stores large amounts of carbon.
The collection and storage of rainwater, from roofs or the land surface, for later use or to recharge groundwater.
An international treaty signed at Ramsar, Iran, in 1971, under which countries commit to the conservation and wise use of wetlands and designate Wetlands of International Importance.
A wetland designated as being of international importance under the Ramsar Convention, which its country commits to conserve.
An artificial lake formed behind a dam, in which water is stored for later use.
The settling of sediment in the still water of a reservoir, which reduces its storage capacity and starves the river downstream of sediment.
A body created to plan, coordinate or regulate the use of water and land across a whole drainage basin, often across state or national borders.
A hydroelectric project that uses the natural flow of a river with little or no reservoir storage, so that flow downstream stays close to natural.
An approach in which decisions about water are made by central governments, agencies or large companies and implemented on users, usually through large-scale infrastructure.
The treatment of used water from homes and industry so that it can be used again for irrigation, industry or, after advanced treatment, drinking.
The process of sharing the available water in a basin between users, sectors and the environment, usually through licences, entitlements or caps.
Obtaining the same output or service, such as a crop or a product, with less water by reducing losses and waste.
The charges set for water supply and sanitation, which can recover costs, encourage saving and, through lifeline tariffs, protect access for low-income users.
An area of land saturated or covered by shallow water, permanently or seasonally, such as a marsh, swamp, bog, floodplain or delta, with soils and vegetation adapted to wet conditions.
The return of a degraded or drained wetland towards its natural condition, for example by blocking drains, restoring water flows or replanting vegetation.
The Ramsar principle that wetlands should keep their ecological character through sustainable use that benefits people, rather than being strictly preserved without use.
An independent international body (1997–2001) of governments, industry and civil society that reviewed the impacts of large dams and recommended guidelines for fairer dam decisions in 2000.
Scope: The topic covers community participation in water management in different development contexts, including efficient use and access to clean, safe and affordable water; the growth of multipurpose dam schemes and their costs and benefits; integrated drainage basin management (IDBM) plans; and pressures on wetlands and efforts to protect them. It uses three case studies: dam building in the Mekong basin (the extended case study), the Murray–Darling Basin Plan as a recent IDBM plan, and the future of the Pantanal wetland. Freshwater is one of seven options: SL students study two options and HL students three.
For much of the twentieth century water was managed from the top: governments and engineers decided where to build dams, pipes and wells, and users received what was provided. Many schemes failed, because pumps broke and nobody was responsible for repairing them, because supplies did not match what people needed, or because charges were unaffordable. Community participation means involving the people who use water in planning, building, running and paying for it.
Participation brings several advantages. Local people know where water is found, when it is scarce and which sources are polluted. Schemes they helped to choose and build are more likely to be maintained. Committees that set and collect charges can keep a pump working. Participation can also improve equity, if women, who in most low-income countries collect most household water, have a voice.
The case for participation was set out at the International Conference on Water and the Environment in Dublin in January 1992. The four Dublin Principles state that:
freshwater is a finite and vulnerable resource, essential to sustain life, development and the environment;
water development and management should be participatory, involving users, planners and policy-makers at all levels, with decisions taken at the lowest appropriate level;
women play a central part in the provision, management and safeguarding of water;
water has an economic value in all its competing uses and should be recognised as an economic good.
The principles remain influential but contain a tension. Treating water as an economic good supports charging for it, while treating access as essential to life suggests that no one should go without because they cannot pay.
The opposite approach starts from the users themselves.
Feature | Top-down management | Bottom-up management |
|---|---|---|
Who decides | National governments, water utilities, international lenders, engineers | Villagers, user committees, local NGOs |
Typical scale and technology | Large dams, transfers, treatment works, city networks | Wells, handpumps, rainwater tanks, check dams, kiosks |
Strengths | Serves large populations and cities; economies of scale; can store water across seasons | Cheap; uses local knowledge; strong ownership and maintenance; quick to build |
Limitations | Expensive; may displace people; may ignore local needs; slow to build | Limited capacity; depends on local leadership; may not reach the poorest; hard to scale up |
Examples | Three Gorges Dam; Singapore’s national water system | Johads in Alwar, Rajasthan; village WASH committees |
In practice the two approaches are combined. Top-down management is needed to supply a city of millions or to manage a whole river, while bottom-up management works best for scattered rural communities. The most successful schemes link the two: national programmes that fund and train village committees, or utilities that consult users before they build.
In many rural areas of LICs, water comes from handpumps, wells and springs. Thousands of handpumps were installed from the 1980s onwards, but a large share break down within a few years, because spare parts are not available locally and no one is responsible for repairs. A UNDP and World Bank study of handpump programmes (1981–1991) concluded that maintenance organised at village level works best, and introduced pumps designed for "village level operation and maintenance". Today, WASH (water, sanitation and hygiene) committees elected by villagers collect small fees and arrange repairs.
Rainwater harvesting is one of the oldest community methods. Rain is collected from roofs into tanks, or runoff is captured on the land and allowed to soak in. In semi-arid India, a traditional technique is the johad, a crescent-shaped earth check dam that holds back monsoon runoff in a small pond, from which water seeps into the ground and recharges wells.
A johad is one form of check dam.
By the 1980s Alwar district in Rajasthan, India, had become dry as deforestation, mining and boreholes lowered the water table. From 1985 the NGO Tarun Bharat Sangh (TBS), led by Rajendra Singh, helped villagers rebuild johads with their own labour. By the 2010s it had helped build more than 8,600 johads and other water-harvesting structures, brought water back to more than 1,000 villages and revived five rivers, including the Arvari. Villagers along the Arvari formed a "river parliament" of 72 villages that sets rules on water use and on which crops to plant. Singh won the Stockholm Water Prize in 2015.
Sources: Wikipedia, "Tarun Bharat Sangh", "Rajendra Singh" and "Johad".
The example shows the strengths of bottom-up management: low cost, local labour and rules made by those who obey them. It also has limits. Recharged water can be pumped out again unless villagers agree to restrict pumping, and the model depends on strong local leadership and on a geology that lets water soak in.
Access in towns raises different problems. Households without a piped connection often buy water from vendors at many times the utility price. Water kiosks, run by a community group or a private operator, sell treated water by the container, and many households in Kibera, Nairobi’s largest informal settlement, depend on them. Prepaid dispensers, often called water ATMs, allow users to buy small amounts with a card, which helps the poorest pay as they go but raises questions about whether people should have to pay for a basic need.
Collecting water is also a question of gender equity. In most countries with data, women and girls are mainly responsible for fetching water, and in sub-Saharan Africa and Central and Southern Asia many spend more than 30 minutes a day doing so. Time spent carrying water is time not spent in school or earning money.
In HICs nearly everyone has piped water, so the challenge is to manage demand as supplies tighten. Demand management means reducing the amount of water people use rather than finding more.
Metering and tiered tariffs. Households pay for what they use, and a higher price for each additional block of water discourages waste.
Restrictions. Temporary bans on hosepipes and garden watering during droughts, as in parts of England in the summer of 2022, or the 50-litre limit in Cape Town in 2018.
Efficient appliances. Low-flow showers, dual-flush toilets and efficient washing machines, sometimes required by building regulations.
Reuse. Greywater from baths, showers and washing machines can be used to flush toilets or water gardens.
Singapore shows a whole-society approach. With almost no land for reservoirs and a supply agreement with Malaysia that runs until 2061, it built "Four National Taps": water from local catchments, imported water, desalinated water and NEWater, a form of wastewater reuse in which used water is treated to drinking standard. Launched in 2003, NEWater can meet up to 40% of the country’s needs, a share planned to rise to 55% by 2060. Most of it goes to industry, which frees drinking water for households.
Sources: Wikipedia, "NEWater" and "Water supply and sanitation in Singapore" (PUB data).
Other HICs use markets and partnerships. In Australia, water entitlements in the Murray–Darling basin can be bought and sold, so water moves to the users who value it most; the system is often described as the most sophisticated water market in the world. In England, the Catchment Based Approach, launched in 2013, brings water companies, farmers, councils and environmental groups together in partnerships for each river catchment to improve water quality.
Because agriculture uses about 70% of freshwater, water efficiency on farms matters most. Drip and sprinkler irrigation deliver water more precisely than flooding fields; deficit irrigation gives crops slightly less water than they need at stages when yield is not harmed; and farmers can switch to crops that need less water. In cities, the largest saving often comes from fixing leaks. Non-revenue water is the water a utility produces but does not bill for.
During its drought, Cape Town’s losses from leaks were about 14% of supply, compared with a South African average of 35%. Mexico City planned to cut its non-revenue water from 36% to 25%. In LICs the World Bank estimates that about 40% of non-revenue water is lost to theft and illegal connections rather than leaks.
Sources: Wikipedia, "Cape Town water crisis", "Water management in Greater Mexico City" and "Non-revenue water".
Efficiency does not always reduce total use. When farmers save water with drip irrigation, they may use it to irrigate more land or grow thirstier crops, so total withdrawals stay the same or rise. This is the rebound effect (the Jevons paradox). Efficiency saves water overall only if the saved water is formally returned to rivers or aquifers, for example by reducing farmers’ licensed allocations.
Sustainable Development Goals target 6.1 aims at universal and equitable access to safe and affordable drinking water by 2030. The JMP drinking water ladder measures progress. The chart compares two countries at different levels of development.
Affordability depends on water pricing. Utilities need revenue to maintain networks, so most charge for water, but high prices exclude the poor. Many cities use a "lifeline" tariff, in which the first block of water each month is cheap or free and higher use is charged at a higher rate.
On 28 July 2010 the UN General Assembly, by Resolution 64/292, recognised safe and clean drinking water and sanitation as a human right; 122 countries voted in favour, and many abstained. The human right to water does not mean that water must be free, but it means that it must be available, safe, acceptable, physically accessible and affordable for all.
The tension between water as a right and water as an economic good became violent in Cochabamba, Bolivia’s fourth-largest city, in 2000. After the city’s water company was privatised under a concession to Aguas del Tunari, a consortium including the US firm Bechtel, water bills rose sharply. Protests organised by a coalition of farmers, workers and residents culminated in tens of thousands marching in April 2000, and on 10 April the national government agreed to reverse the privatisation.
Sources: Wikipedia, "Human right to water and sanitation" and "2000 Cochabamba protests"; WHO/UNICEF JMP (2025).
Perspective | View of water | Implication for management |
|---|---|---|
Human rights campaigners and many NGOs | A human right and a public good | Free or lifeline supply for basic needs; public ownership |
Water utilities and lenders | An economic good that must be paid for | Cost-recovery tariffs to fund maintenance and expansion |
Private operators | A service that can be run efficiently for profit | Concessions and investment, with regulated prices |
Low-income households | A daily necessity that is often expensive from vendors | Reliable, nearby supply at a price they can afford |
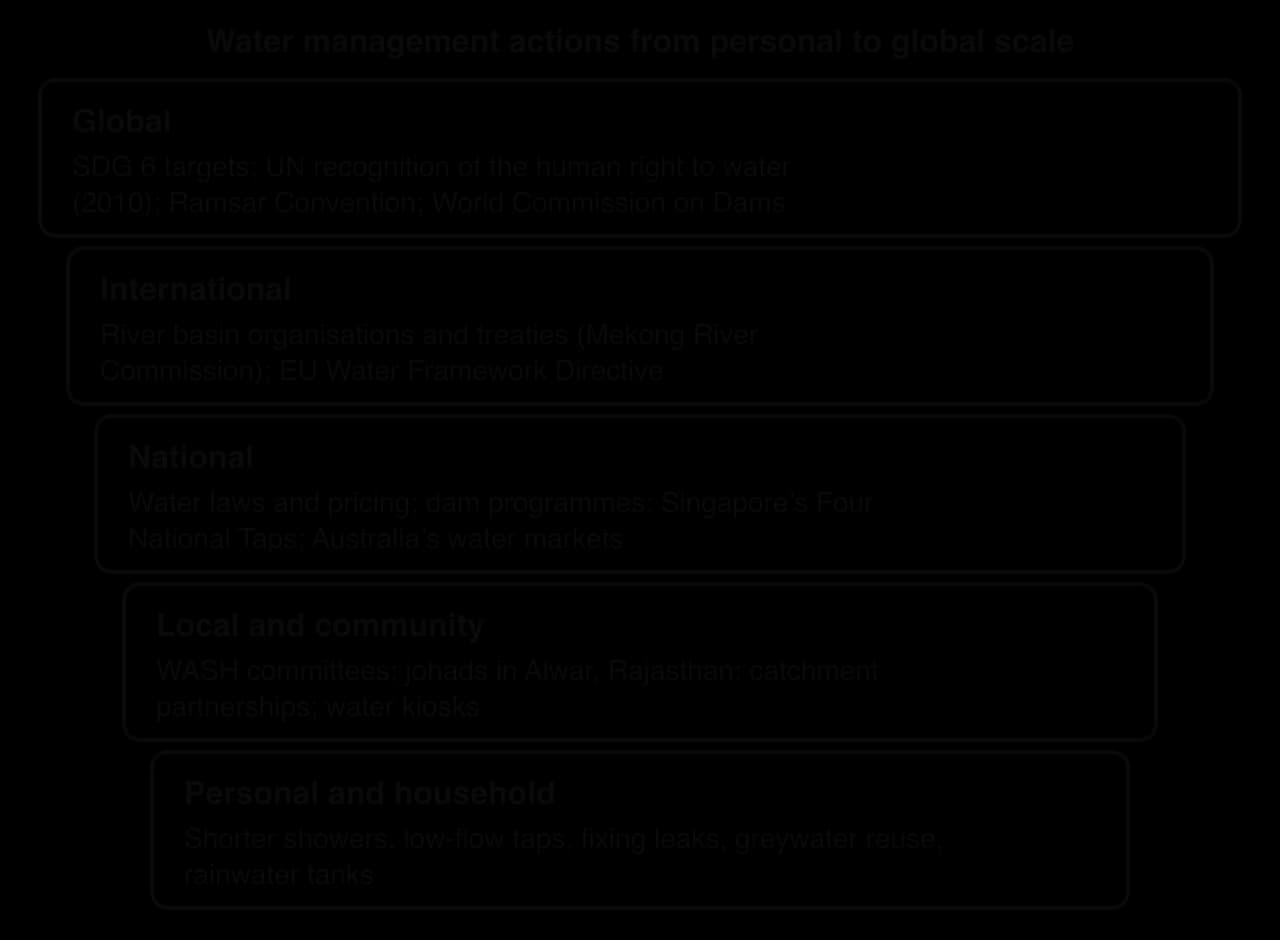
Management happens at every scale, from the household to the globe. The scale diagram shows how actions at each level, from fixing a household tap to a UN resolution, fit together.
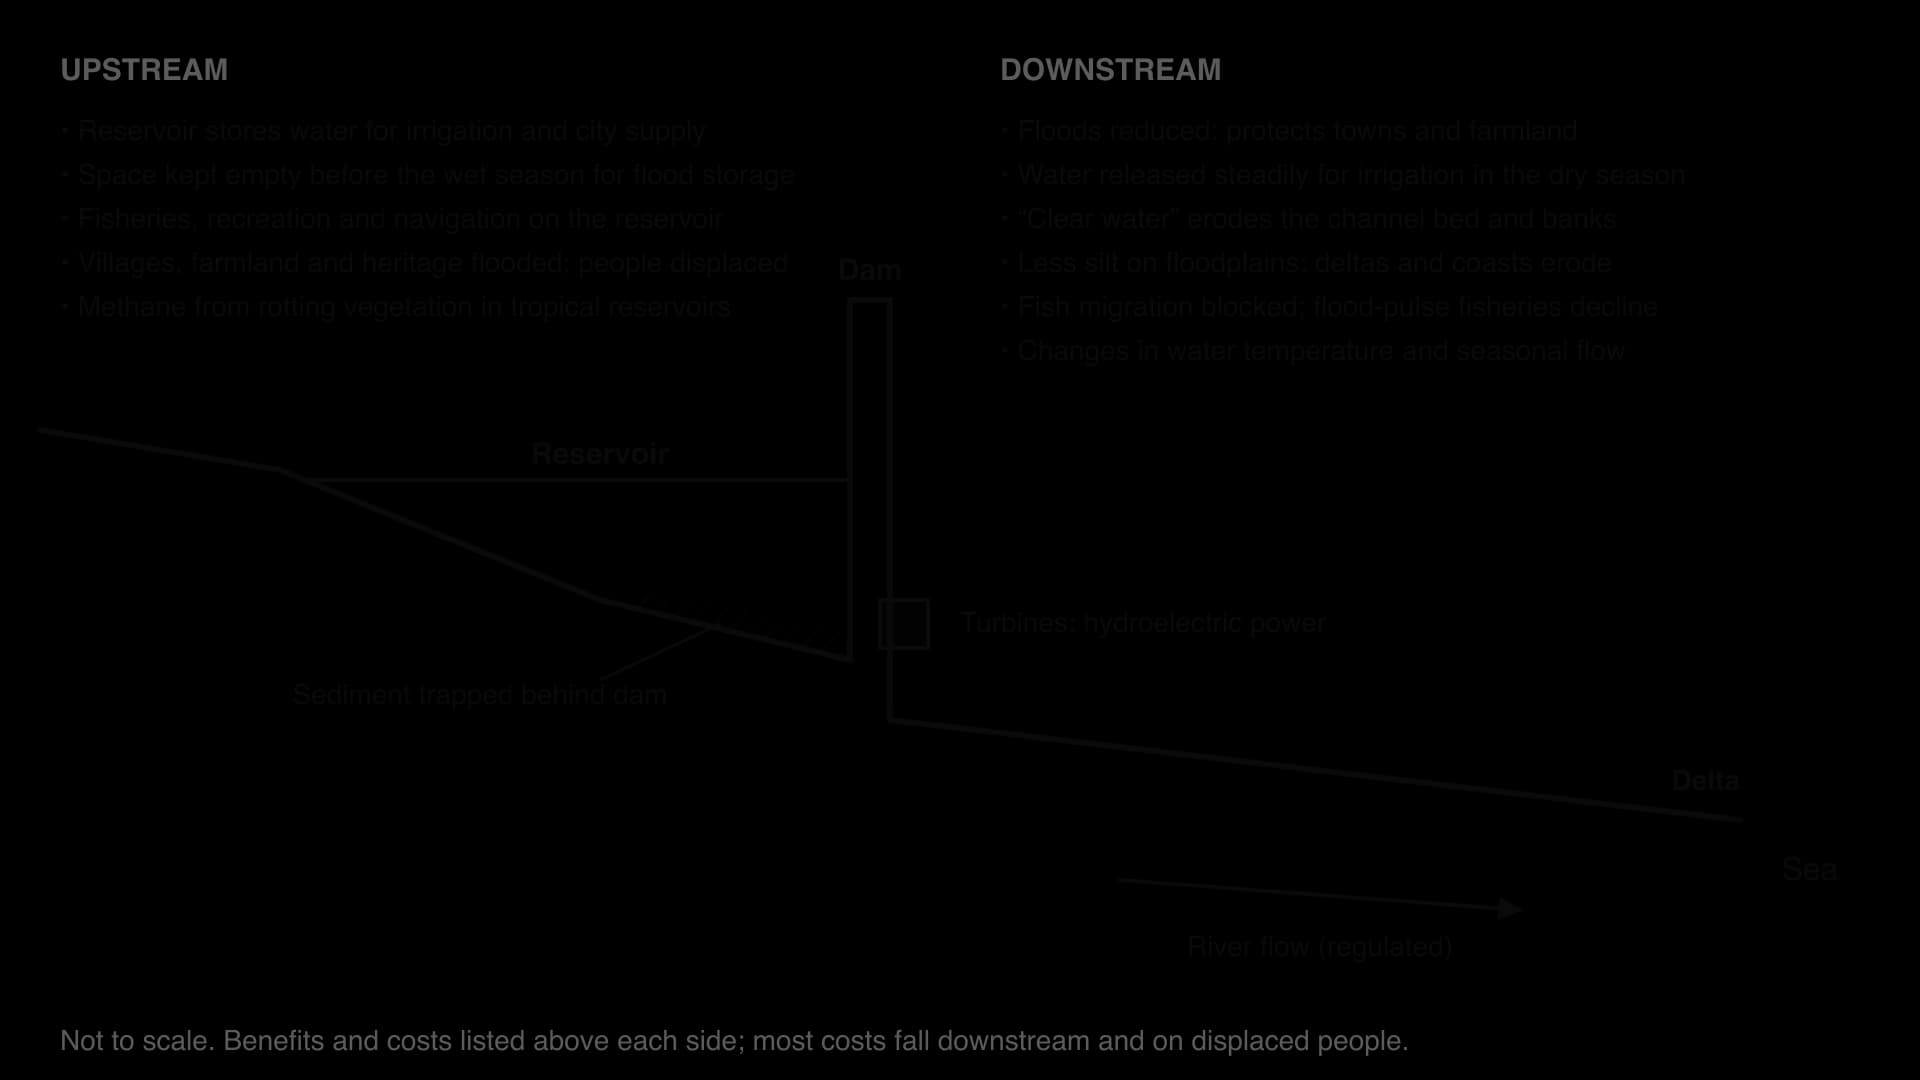
A dam is a barrier across a river that holds back water in a reservoir. Small dams have been built for thousands of years, but since the 1950s large dams have become central to national development. Most are now built as a multipurpose scheme, serving several uses at once.
The water stored behind it forms a reservoir.
One dam and reservoir usually serve several uses.
Electricity. Hydroelectric power (HEP) is generated as water released from the reservoir turns turbines. It produces little carbon dioxide once built and can be switched on quickly to meet peaks in demand.
Irrigation. Stored wet-season water is released to farms in the dry season, allowing more than one crop a year.
Flood control. Space kept empty in the reservoir before the wet season absorbs flood peaks.
Water supply for cities and industry.
Navigation, by deepening the river and drowning rapids, and fisheries and recreation on the reservoir.
The purposes can conflict. A reservoir kept low to leave room for floods produces less electricity, because power depends on the height of the water behind the dam. A reservoir kept full for power in a dry year cannot absorb a sudden flood. Releases timed for peak electricity demand may not match the timing farmers need downstream. Operators must constantly decide which use takes priority, and the decision reflects whose interests matter most.
China’s Three Gorges Dam on the Yangtze shows both sides at the largest scale. With 22,500 MW of capacity it is the world’s largest power station, generating about 95 TWh a year. It improves navigation and provides flood control that protects millions of people on the Yangtze Plain. Building it displaced between 1.13 million and about 1.4 million people, flooded 632 km² of land and drowned ancient and culturally significant sites, and the reservoir has increased the risk of landslides on its banks.
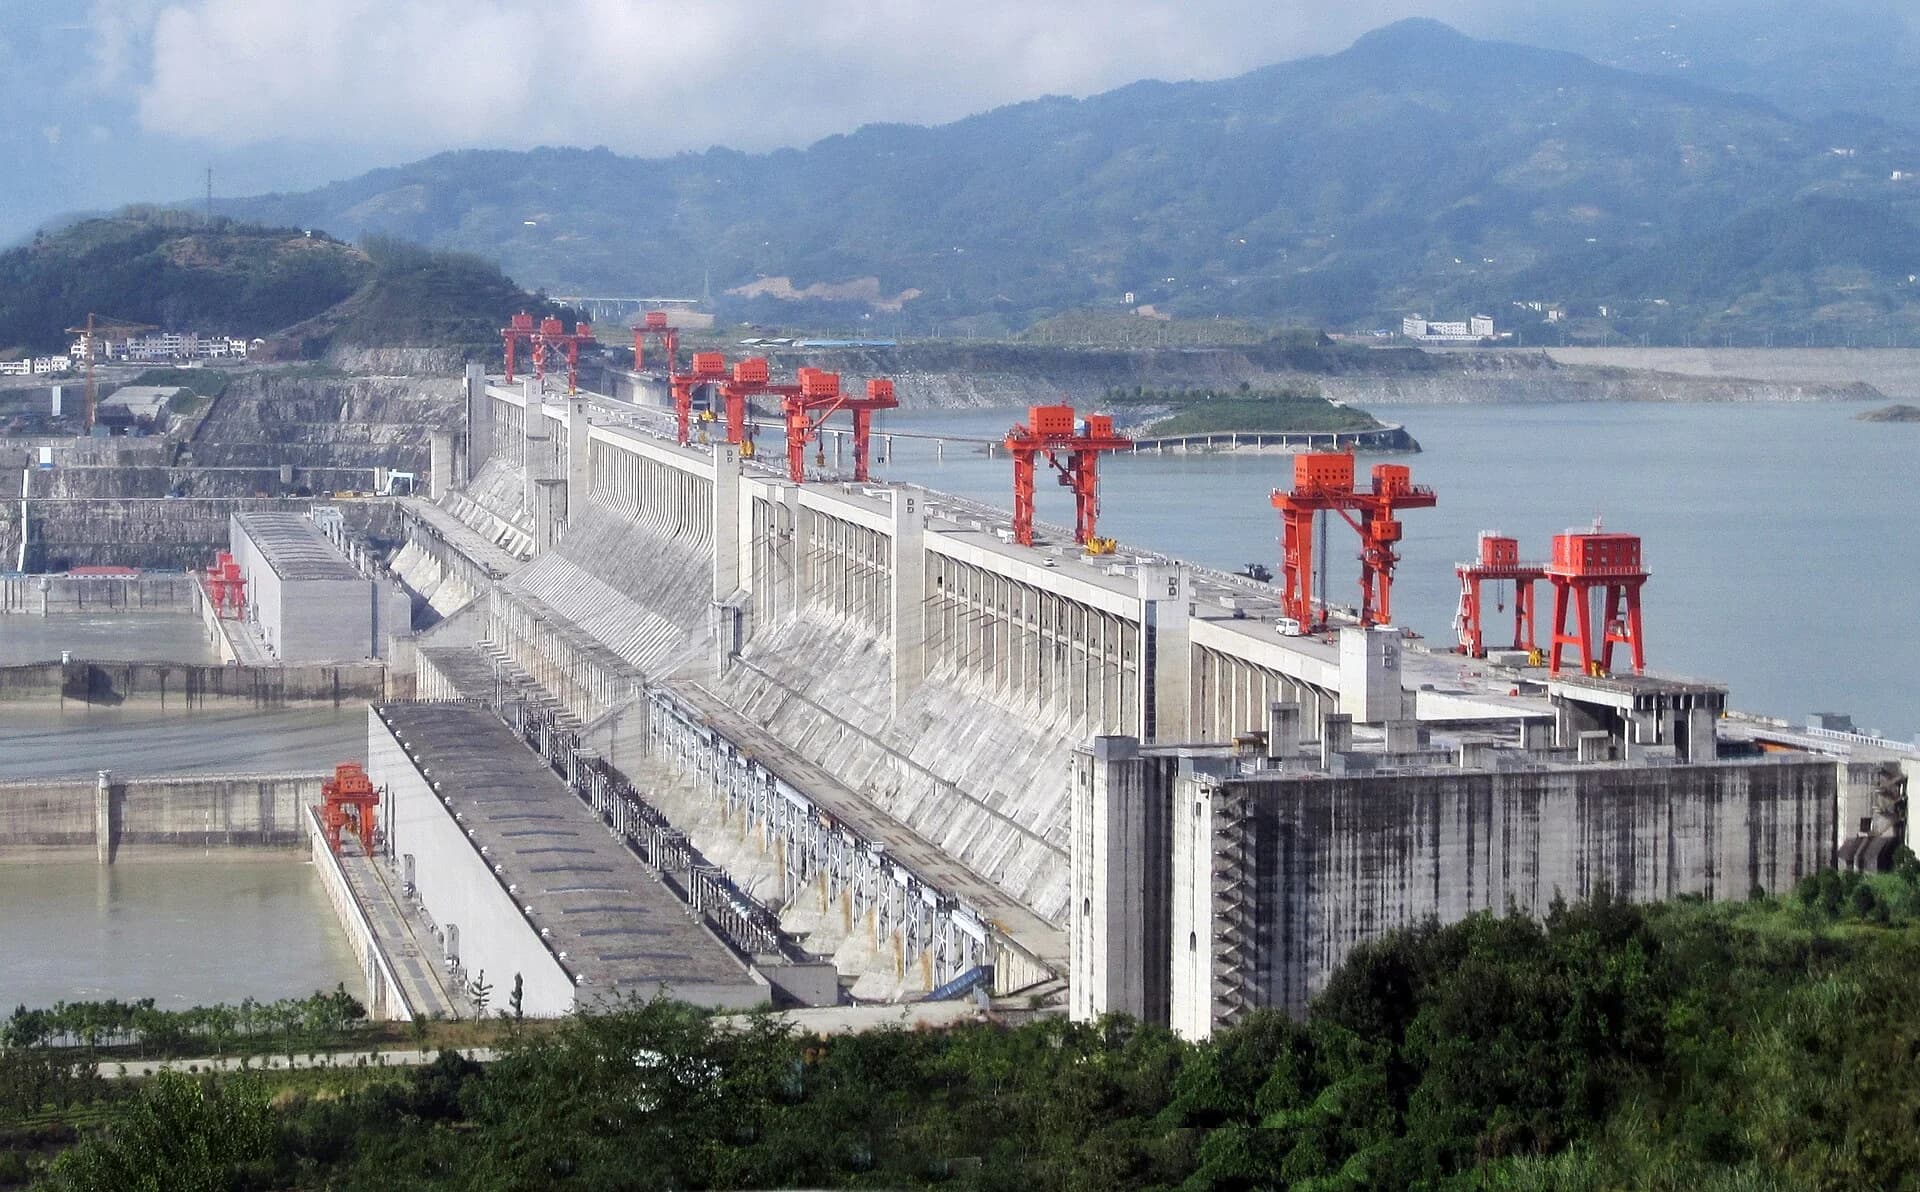
Sources: Wikipedia, "Three Gorges Dam" (China Three Gorges Corporation and resettlement estimates).
After a slowdown in the 1990s, dam building has accelerated again. A study by Zarfl and colleagues in 2015 counted about 3,700 major hydropower dams, each over 1 MW, either planned or under construction worldwide, mainly in emerging economies in South-east Asia, South America and Africa. Many are a megadam, with enormous reservoirs and installed capacity, such as the Grand Ethiopian Renaissance Dam on the Blue Nile.
Its drivers are rising electricity demand in emerging economies, the search for low-carbon energy, the need to store water as rainfall becomes more variable, and finance from development banks and from China.
Concern about the impacts of large dams led the World Bank and the IUCN to set up the World Commission on Dams in 1997. Its final report, Dams and Development, launched by Nelson Mandela in November 2000, found that dams had brought considerable benefits but that displaced people and downstream communities had too often paid an unacceptable price. It recommended that dams should be built only after options had been assessed openly, with the demonstrated acceptance of affected people, and with environmental flows.
The costs of a dam extend far beyond its construction price.
Displacement. People living in the reservoir area lose homes, farmland, graves and sacred sites; resettlement often provides poorer land and fewer livelihoods.
Sediment trapping. A reservoir is a still lake, so the sediment that the river carried settles on its bed. This is reservoir sedimentation. The reservoir gradually loses capacity, and water released downstream carries little sediment. This "hungry" water erodes the channel, and the floodplains and delta that depended on sediment are starved and begin to erode.
Loss of floodplain fertility and fisheries. Floods that once spread silt and nutrients onto farmland are controlled, so farmers need more fertiliser. Many fish depend on the annual flood to breed.
Barriers to migration. Fish that migrate upstream to spawn cannot pass a large dam; fish ladders work for some species only.
Changes to the river. Released water is colder and lower in oxygen, and releases for power make levels rise and fall suddenly.
Greenhouse gases. In tropical reservoirs, flooded vegetation decomposes without oxygen and releases methane.
Hazards. Large reservoirs can trigger earthquakes (reservoir-induced seismicity), and dam failure is catastrophic.
Debt and transboundary tension. Megadams can burden governments with debt, and on shared rivers upstream dams cause conflict with downstream states.
Egypt’s Aswan High Dam, completed in 1970, is the classic example of sediment trapping. It ended the destructive Nile floods and gave Egypt year-round irrigation, but the silt that had fertilised the floodplain and built the delta now settles in Lake Nasser. Farmers must buy fertiliser, the delta coast is eroding, and Egypt’s Mediterranean fish catch, once 35,000–40,000 tonnes a year, has fallen to 20,000 tonnes or less, largely because the sardines that fed on plankton nourished by the silt have disappeared.
Sources: Wikipedia, "Aswan Dam".
Two approaches aim to keep the benefits of hydropower at lower cost. An environmental flow is a release of water from a dam that mimics part of the natural flow regime, including small floods at the right season.
A run-of-river scheme generates electricity from the natural flow of a river, with little or no storage. Because the reservoir is small, it displaces fewer people and traps less sediment, but it produces less power in the dry season and still blocks fish migration. Both of the Lower Mekong’s mainstream dams in Laos are run-of-river designs.
A cost–benefit analysis compares the costs of a project with its benefits, ideally converted into money over its lifetime. For dams, the method is controversial because many costs, such as lost fisheries, cultural sites or species, are hard to value, and because costs and benefits fall on different groups.
Stakeholder | Main gains | Main losses |
|---|---|---|
National government | Electricity, export revenue, prestige, flood control | Debt; tension with neighbours |
City dwellers and industry | Reliable power and water | Higher bills if costs are passed on |
Farmers with irrigation | Year-round water, extra harvests | Loss of silt; salinisation in some places |
Investors, builders and foreign power buyers | Profits; cheap, low-carbon electricity | Financial risk if demand or flows fall |
Displaced people | Compensation, sometimes new services | Homes, land, livelihoods and cultural sites |
Downstream fishers and floodplain farmers | Fewer destructive floods | Fish catches, silt, flood-recession farming |
Ecosystems | New reservoir habitats for some species | Migration routes, deltas, wetlands, biodiversity |
The balance depends on place and time: benefits are immediate, while sediment starvation, silting and fishery losses accumulate. Dams in a country with high energy poverty, such as Ethiopia, offer greater social benefits than dams in a country with surplus power. A reasoned judgment is that large dams can be justified where few people live in the reservoir area, where sediment and fish can be managed, and where the gains are shared with those who bear the costs, but that many recent dams meet none of these conditions.
The Mekong is a transboundary water resource. It rises on the Tibetan Plateau and flows 4,909 km through China (where it is called the Lancang), Myanmar, Laos, Thailand, Cambodia and Vietnam to the South China Sea. Its basin covers 795,000 km² and it discharges about 475 km³ of water a year. The river has an extreme seasonal regime: monsoon rains from June to October produce a flood many times larger than the dry-season flow. Water from China’s Yunnan province makes up almost 30% of the dry-season flow even as far downstream as Kratié in Cambodia, which gives China considerable influence over the river’s low flows.
The flood pulse supports one of the world’s largest inland fisheries. In the wet season the Mekong rises so high at Phnom Penh that the Tonle Sap river reverses and flows into the Tonle Sap lake, which grows from about 2,500–3,000 km² to as much as 16,000 km². Fish breed in the flooded forest and return to the river as the water falls. About 2.56 million tonnes of fish and other aquatic animals are eaten in the Lower Mekong each year, and they provide between 47% and 80% of animal protein in rural diets; in Cambodia, about 80% of people’s protein comes from fish.
The delta in Vietnam, built by the river’s sediment, is one of the world’s most productive rice-growing regions.
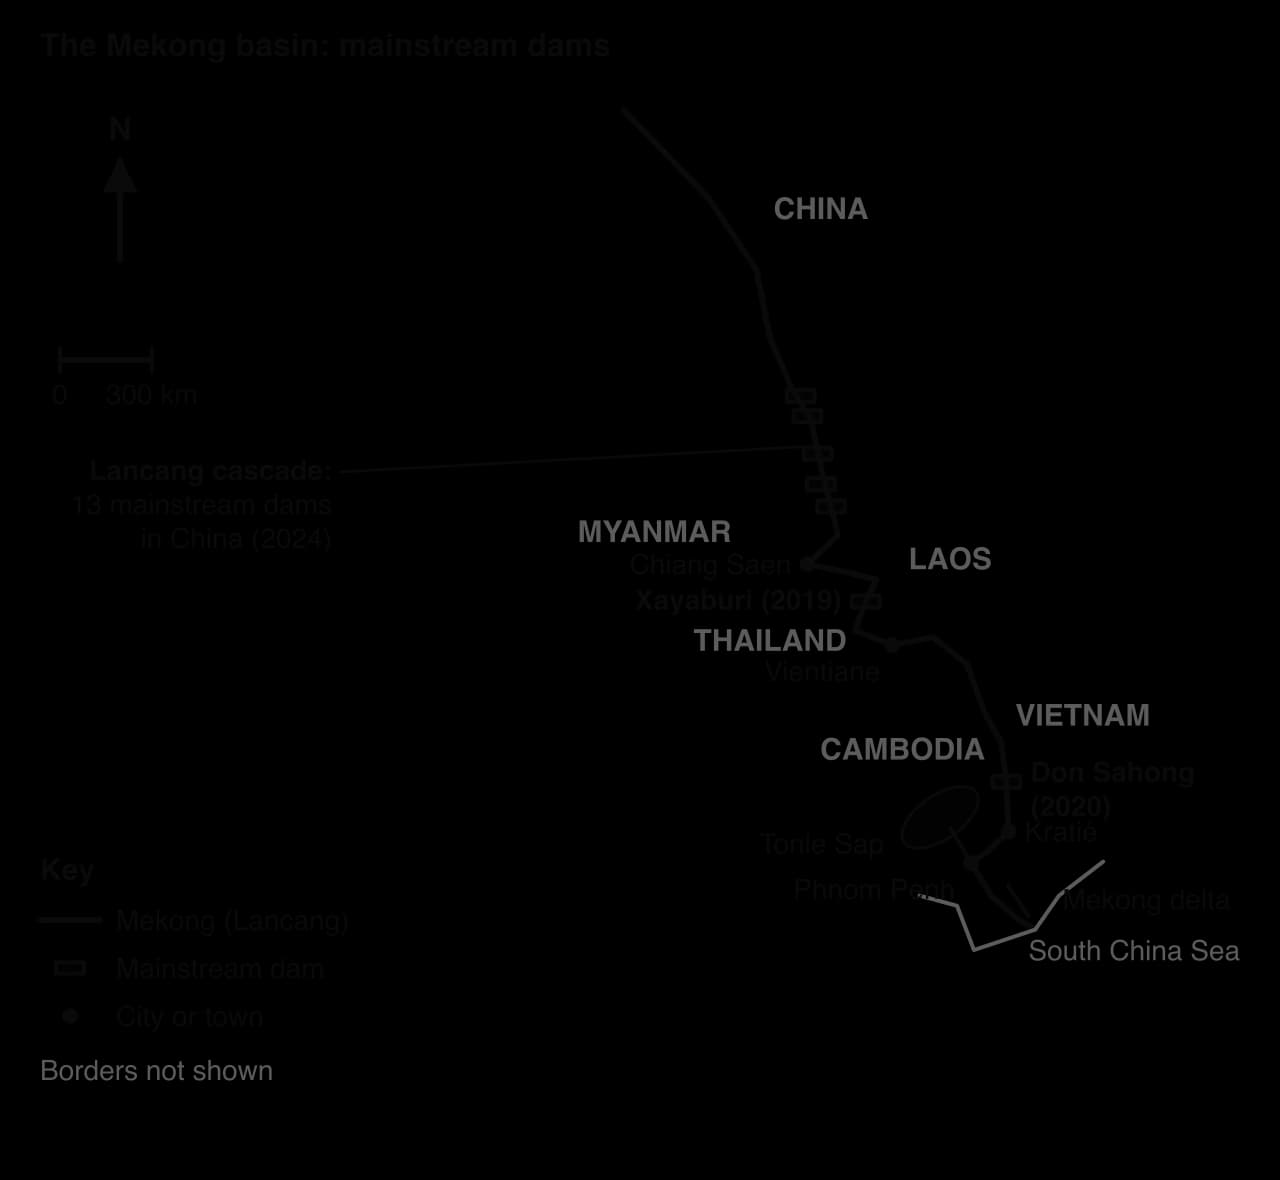
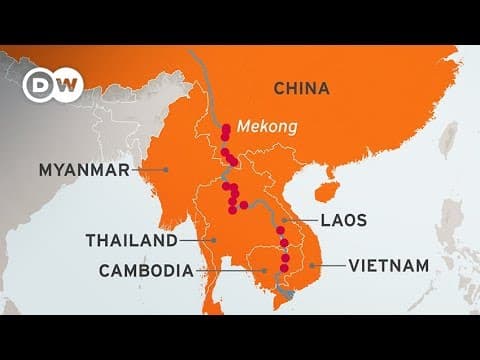
Until 1990 the Mekong was almost undammed. By February 2024 there were 371 dams in the basin, 121 of them hydropower plants of 15 MW or more. Fifteen hydropower dams stand on the mainstream itself: 13 in China and 2 in Laos, with more under construction.
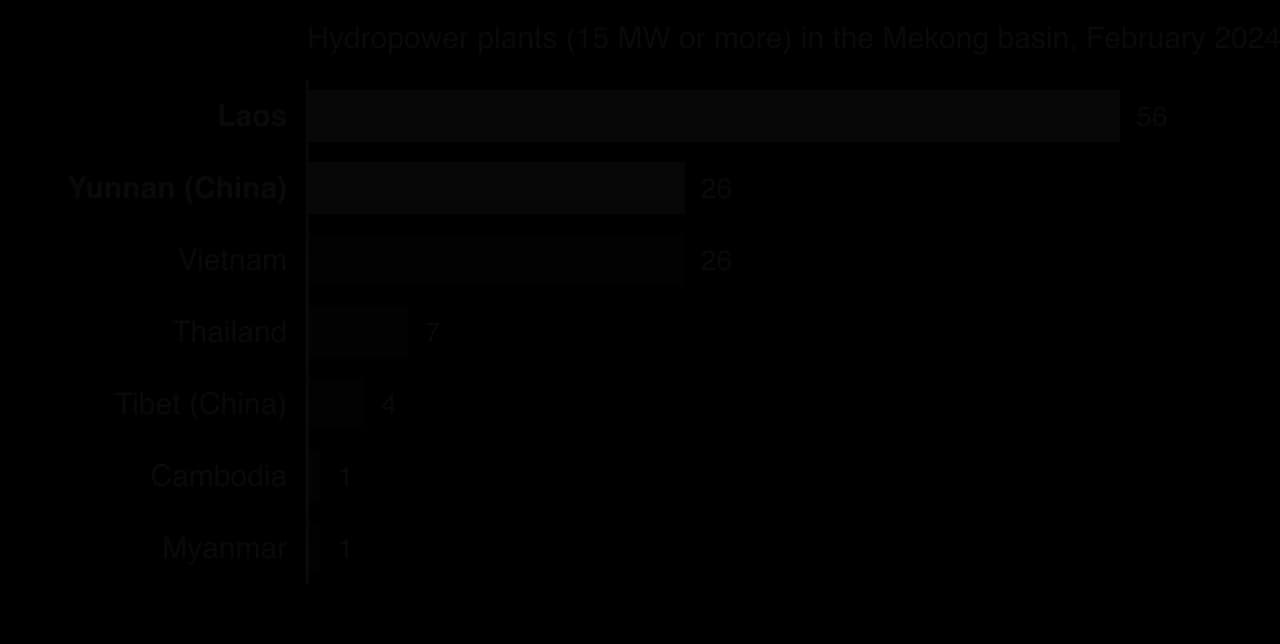
China’s Lancang cascade in Yunnan was built from the 1990s, with large storage reservoirs such as Xiaowan and Nuozhadu, to supply electricity to southern and eastern China. Downstream, Laos has adopted a strategy of becoming the "battery of Southeast Asia".
The Xayaburi Dam (1,285 MW), built by the Thai company CH. Karnchang for about US$3.5 billion, began commercial operation in October 2019; about 95% of its electricity is sold to Thailand’s Electricity Generating Authority (EGAT). The Don Sahong Dam (260 MW), developed by the Malaysian company Mega First, began full operation in January 2020 on the Hou Sahong, the only channel in the Khone Falls complex that migratory fish can pass in the dry season.
Dam | Country | Capacity | In operation | Developer and buyer of power |
|---|---|---|---|---|
Lancang cascade (13 mainstream dams) | China | Many thousands of MW | From the 1990s | Chinese state companies; power for Chinese cities |
Xayaburi | Laos | 1,285 MW | October 2019 | CH. Karnchang (Thailand); 95% sold to EGAT |
Don Sahong | Laos | 260 MW | January 2020 | Mega First (Malaysia); power mostly exported to Thailand and Cambodia |
In 1995 Cambodia, Laos, Thailand and Vietnam signed the Mekong Agreement, creating the Mekong River Commission (MRC). China and Myanmar, which hold the upper basin, became only "dialogue partners" in 1996. Under the MRC’s procedures, a country planning a mainstream dam must notify the others and enter "prior consultation" aimed at consensus.
Prior consultation is not a veto. When consultation on Xayaburi ended without agreement in April 2011, Laos allowed construction to continue, and the same happened with Don Sahong. Upstream power was evident from the start. In April 1995 a boat trip celebrating the agreement ran aground because China was filling the reservoir of its Manwan Dam.
The benefits are concentrated in power and revenue. Hydropower gives Laos export earnings, supplies Thai and Chinese cities with electricity that emits little carbon dioxide, and allows China’s reservoirs to release water in the dry season, which can raise low flows downstream.
Most of the costs fall on fishers, farmers and ecosystems, threatening the food security of the Lower Mekong. In July 2019, in what is normally the wet season, a drought left the river between Chiang Saen and Vientiane at its lowest level in a century, and downstream critics blamed upstream dams for holding water back. The last Irrawaddy dolphin in Laos, in a pool on the border with Cambodia downstream of Don Sahong, died in 2022, two years after the dam began operating.
The greatest long-term cost may be to sediment. Kondolf and colleagues modelled the cumulative effect of the dams on the sediment that reaches the delta.
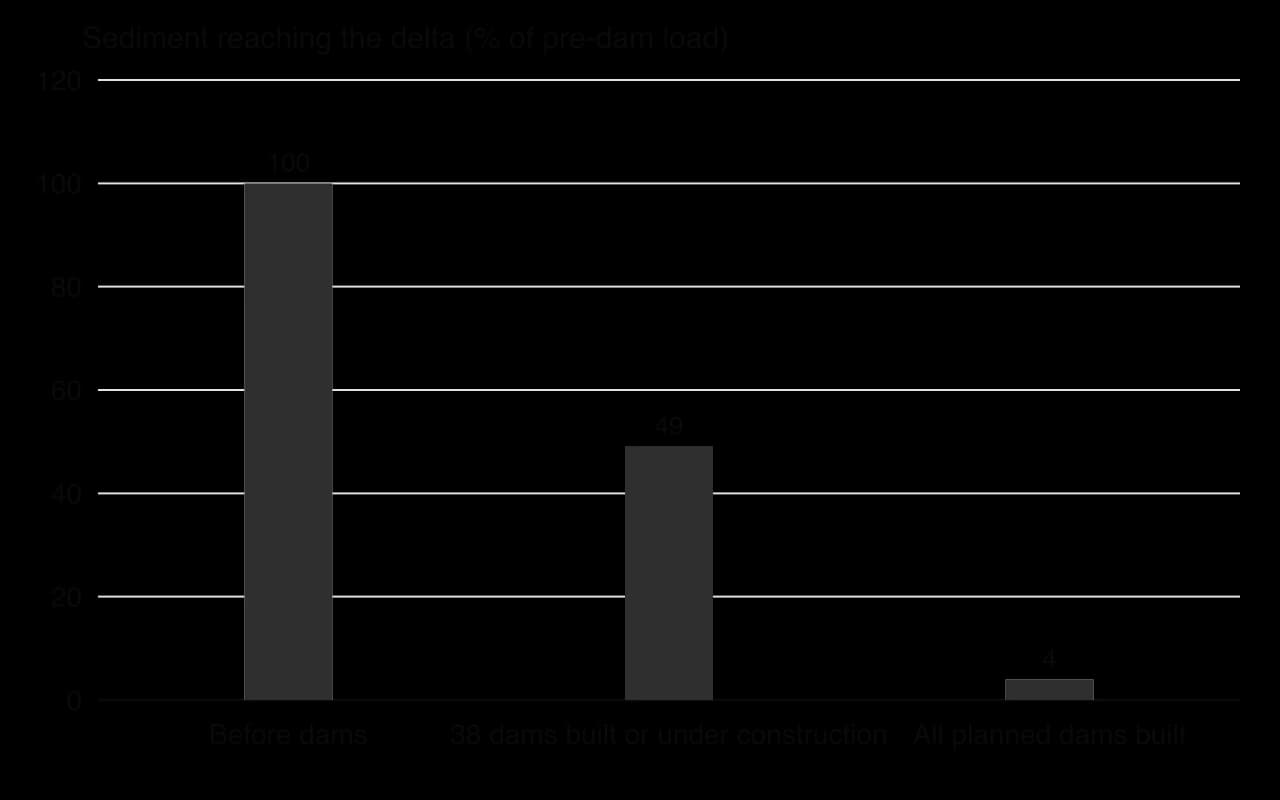
With 38 dams built or under construction, sediment reaching the delta would fall by 51%; with full build-out, by 96%. A delta that receives no sediment cannot keep pace with sea-level rise and subsidence, so the Mekong delta, home to millions of rice farmers in Vietnam, would erode and become saltier. Sand mining in Laos, Cambodia and Vietnam adds to the loss.
Sources: Wikipedia, "Mekong", "Xayaburi Dam", "Don Sahong Dam", "Mekong River Commission" and "Tonlé Sap" (MRC and CGIAR data); Kondolf, Rubin and Minear, Water Resources Research (2014).
Stakeholder | Position and power |
|---|---|
Government of China | Upstream; controls the cascade and dry-season releases; not bound by the MRC; shares some water-level data |
Government of Laos | Sees hydropower as the route to development and export revenue; host of the lower mainstream dams |
Thailand’s EGAT and Thai developers | Buy and build: gain cheap power and contracts |
Governments of Cambodia and Vietnam | Downstream; fear for fisheries, the Tonle Sap and the delta; objected in prior consultation but could not stop the dams |
Fishers and farmers | Depend on the flood pulse and sediment; little influence on decisions |
NGOs and scientists | Document impacts, call for a moratorium and a shift to solar power |
 YouTube
The Mekong shows power exercised through position on the river and through finance: China upstream and Thai buyers and developers shape outcomes for Cambodian fishers and Vietnamese farmers who have no say. It shows possibility in the range of futures still open. Studies of the river suggest that sediment can be passed through some dams, that dams could be sited on tributaries rather than the mainstream, and that solar power is increasingly competitive; but each further mainstream dam narrows these options.
Examine why the Mekong River Commission has been unable to prevent mainstream dams on the lower river.
Using the sediment chart, suggest the possible consequences for the Mekong delta of full dam build-out.
To what extent do the benefits of Mekong dams fall on different people and places from the costs?
On the Mekong, each country manages its own part of the river, so a dam in one place passes its costs to others. Integrated drainage basin management (IDBM) tries to avoid this by planning land and water use across a whole basin.
Two related terms are in use. Integrated river basin management (IRBM) means the same as IDBM. Integrated water resources management (IWRM), promoted after the 1992 Dublin and Rio conferences, is broader: it coordinates water with land and other resources, at any scale from a city to a country.
IDBM rests on four principles. It works at the basin scale, because water flows across borders. It involves all stakeholders, from farmers to environmental groups. It balances economic, social and environmental goals, so ecosystems receive a share of water. And it uses adaptive management, adjusting plans as monitoring shows what works.
IDBM is usually carried out by a river basin authority, which may plan, regulate, allocate water or simply coordinate.
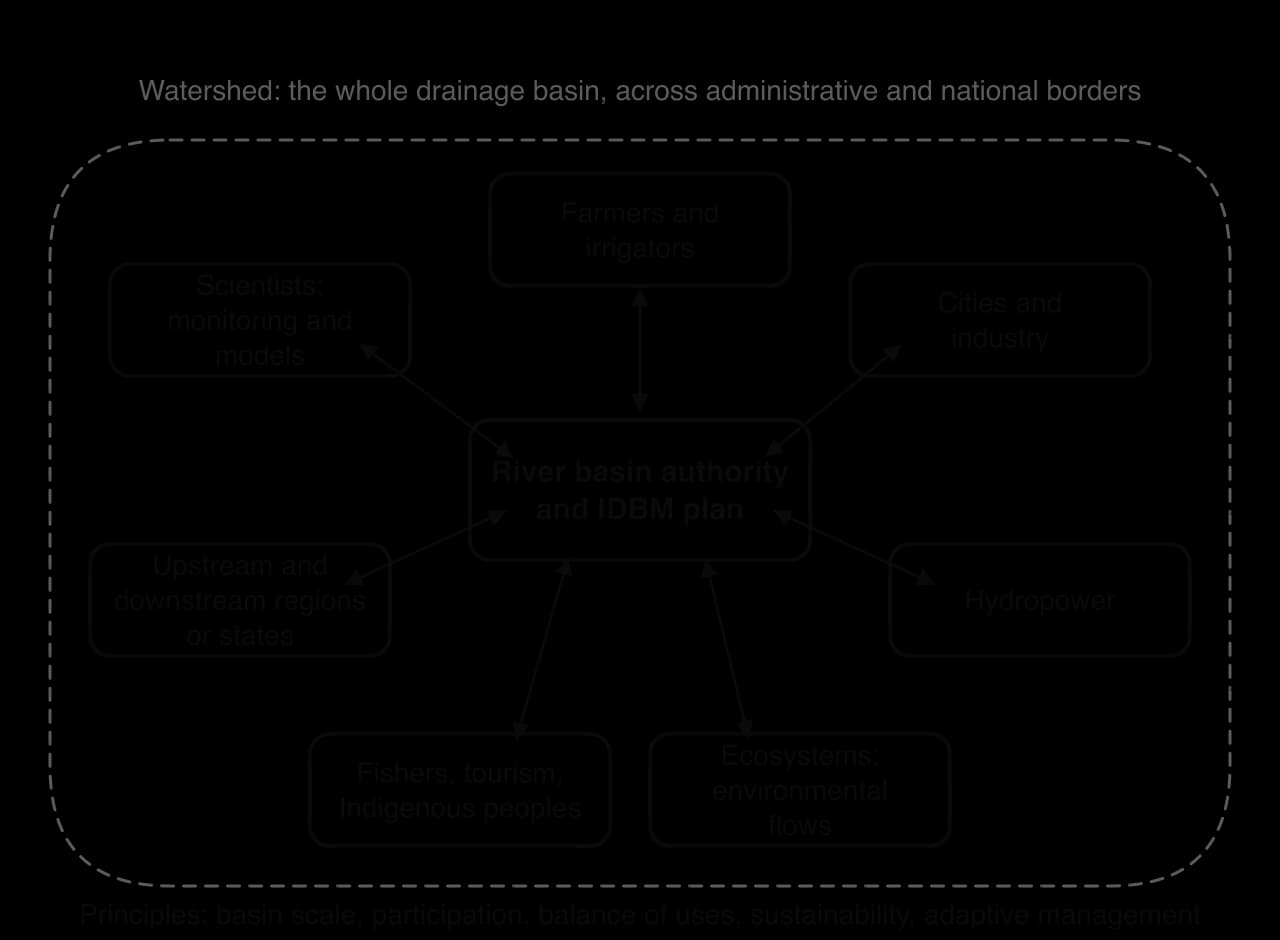
The European Union’s Water Framework Directive (2000) wrote IDBM into law. It divides Europe into river basin districts drawn on hydrological, not political, boundaries; requires each to have a river basin management plan; and set the target of "good status" for all surface and ground waters, originally by 2015. It also requires member states to encourage the active involvement of interested parties. Many water bodies still fall short of good status, and the deadline has been extended.
Sources: Wikipedia, "Water Framework Directive" and "Integrated water resources management".
Benefits | Costs and difficulties |
|---|---|
Problems are not simply passed downstream; upstream land use is linked to downstream flooding and pollution | Expensive and slow to set up; needs data, models and monitoring across the basin |
Balances competing uses, including environmental flows | Requires trust between states, regions and sectors that may be rivals |
Improves water quality and ecosystems | Produces winners and losers when allocations are cut |
Allows water trading and long-term planning | May lack enforcement powers; plans can be weakened by political pressure |
The central difficulty is water allocation. When a basin is over-allocated, returning water to rivers means taking it from someone, so IDBM is as much a political process as a technical one.
The Murray–Darling basin covers about 1.06 million km², about one-seventh of Australia, across Queensland, New South Wales, Victoria, South Australia and the Australian Capital Territory. It produces about a third of Australia’s food, yet its rivers carry little water: average total flow since 1885 is about 24,000 GL a year, with a range from 5,000 GL (1902) to 57,000 GL (1956). By the 2000s so much water had been licensed to irrigators that rivers, wetlands and the Coorong at the Murray mouth were in severe decline, worsened by the Millennium Drought.
The Water Act 2007 created the Murray–Darling Basin Authority (MDBA) in 2008, the first single body responsible for planning the whole basin. The Basin Plan, which became law in November 2012, sets sustainable diversion limits and aims to return about 2,750 GL a year from consumptive use to the environment, through government purchase of water entitlements (buybacks) and investment in more efficient irrigation.
Volume to return to the environment (GL per year) | Who proposed it |
|---|---|
7,600 | MDBA’s estimate of the best scenario for long-term sustainability, judged "not socially or economically viable" |
At least 4,000 | Wentworth Group of Concerned Scientists |
At least 3,000 | Mike Taylor, MDBA chair, who resigned in 2011 rather than oversee less |
2,750 | Adopted in the Basin Plan (2012) |
Sources: Wikipedia, "Murray–Darling Basin Plan" and "Murray–Darling basin" (MDBA, Royal Commission and NSW EPA sources).
The plan has been fiercely contested. In 2010 more than 5,000 people protested at a meeting in the irrigation town of Griffith, while environmental groups argued that the cuts were too small. A South Australian Royal Commission reported in January 2019 that the setting of sustainable limits had been a "major failure of process". Mass fish deaths in the Darling River at Menindee in 2018–2019, and again in March 2023, when millions of fish died after a heatwave, kept the debate alive.
 YouTube
Evaluation. The plan achieved what earlier arrangements could not: one authority, one basin-wide cap and a legal commitment to environmental water. Water trading has moved water to higher-value uses.
The plan also has clear limits. The volume returned was a political compromise; the plan did not count rising groundwater extraction or climate change in its limits; buybacks hurt some rural towns; and the MDBA has been criticised for combining the roles of helper and regulator. The plan shows that IDBM can work in an HIC with strong institutions and money for buybacks, but that even there the share for the environment was set by political negotiation, well below the volume the authority’s own modelling suggested.
A wetland is land that is saturated or flooded with water for long enough to support plants and animals adapted to wet conditions. Wetlands include marshes, swamps, bogs and fens, floodplain wetlands, lakes, inland and coastal deltas, and mangroves along tropical coasts. Wetlands in which peat accumulates are called peatland.
Peatlands hold more carbon than any other type of wetland.
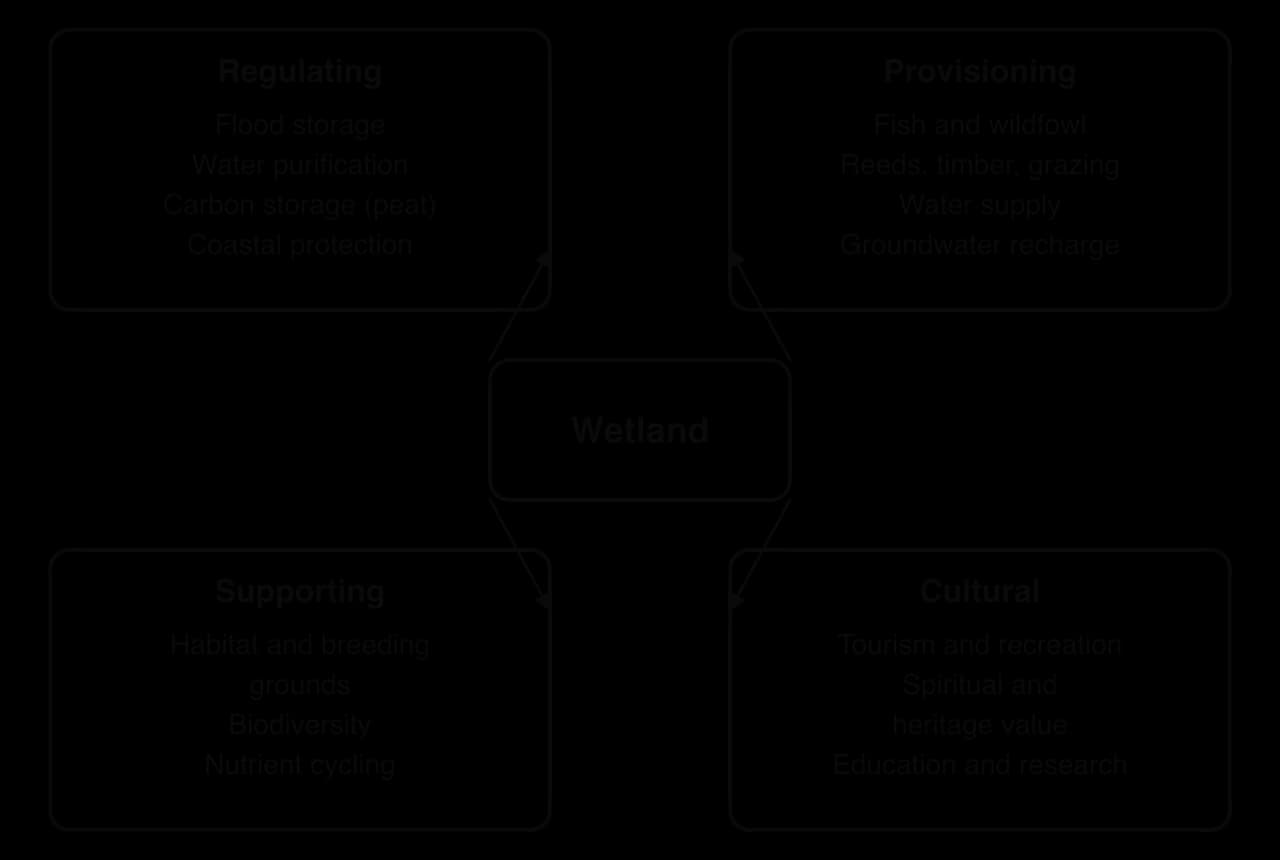
Wetlands provide ecosystem services, benefits that people receive from ecosystems. Floodplain wetlands store flood water and release it slowly; reed beds filter nutrients and pollutants; wetlands recharge aquifers; peatlands store more carbon than the world’s forests although they cover a small fraction of the land; and wetlands support fisheries, grazing, tourism and cultural traditions.
Drainage for farming and urban growth, the largest historical cause of loss.
Upstream abstraction and dams, which reduce the floods that wetlands need.
Pollution from farm runoff, sewage and mining.
Invasive species such as water hyacinth.
Climate change, through drought, fire and sea-level rise, which interacts with all the other pressures, linking wetlands to global climate change.
The scale of loss is large but uncertain. The Ramsar Convention’s Global Wetland Outlook of 2018 estimated that about 35% of the world’s wetlands were lost between 1970 and 2015. Its 2025 Outlook, using different data and wetland categories, estimated that about 411 million hectares, or 22% of wetlands, had been lost since 1970, and warned that a further fifth could be at risk by 2050.
Sources: Ramsar Convention, Global Wetland Outlook (2018 and 2025).
The Ramsar Convention was signed in 1971 at Ramsar, Iran, and is the oldest of the modern global environmental treaties.
Countries that join must designate at least one Ramsar site and commit to the wise use of all their wetlands. In February 2025 there were 2,531 Ramsar sites covering more than 2.6 million km²; the United Kingdom has the most sites (175) and Brazil the largest listed area, about 267,000 km². Sites whose character is changing for the worse can be placed on the Montreux Record, a list that draws attention and support.
Wise use applies to all of a country’s wetlands, not only its Ramsar sites.
Protection also comes from national parks, World Heritage listing and wetland restoration. The largest restoration effort is the Comprehensive Everglades Restoration Plan (CERP) in Florida, USA, authorised by Congress in 2000 to send water south through the Everglades again after a century of drainage canals. Estimated at US$8.2 billion over about 30 years when approved, it was expected by 2014 to take about 50 years.
Sources: Wikipedia, "Ramsar Convention" and "Comprehensive Everglades Restoration Plan".
Evaluating Ramsar. The convention has raised the profile of wetlands, created a global network of sites and promoted wise use rather than strict exclusion. Its weaknesses are that it is largely non-binding, with no penalties for damage; that a site can be protected on paper while dams, drainage or pollution upstream degrade it; and that many countries lack funds to manage their sites. Its success therefore depends on national law and on decisions made outside the wetland itself.
The Pantanal, in Brazil and parts of Bolivia and Paraguay, is the world’s largest tropical wetland, covering an estimated 140,000–195,000 km². It is a vast inland delta in a basin through which the Paraguay River drains the surrounding Planalto highlands. About 80% of its floodplain is submerged in the rainy season, and it supports one of the largest jaguar populations on Earth, some 463 bird species and a dense population of caimans. Part of it is protected as the Pantanal Matogrossense National Park, a Ramsar site since 1993.
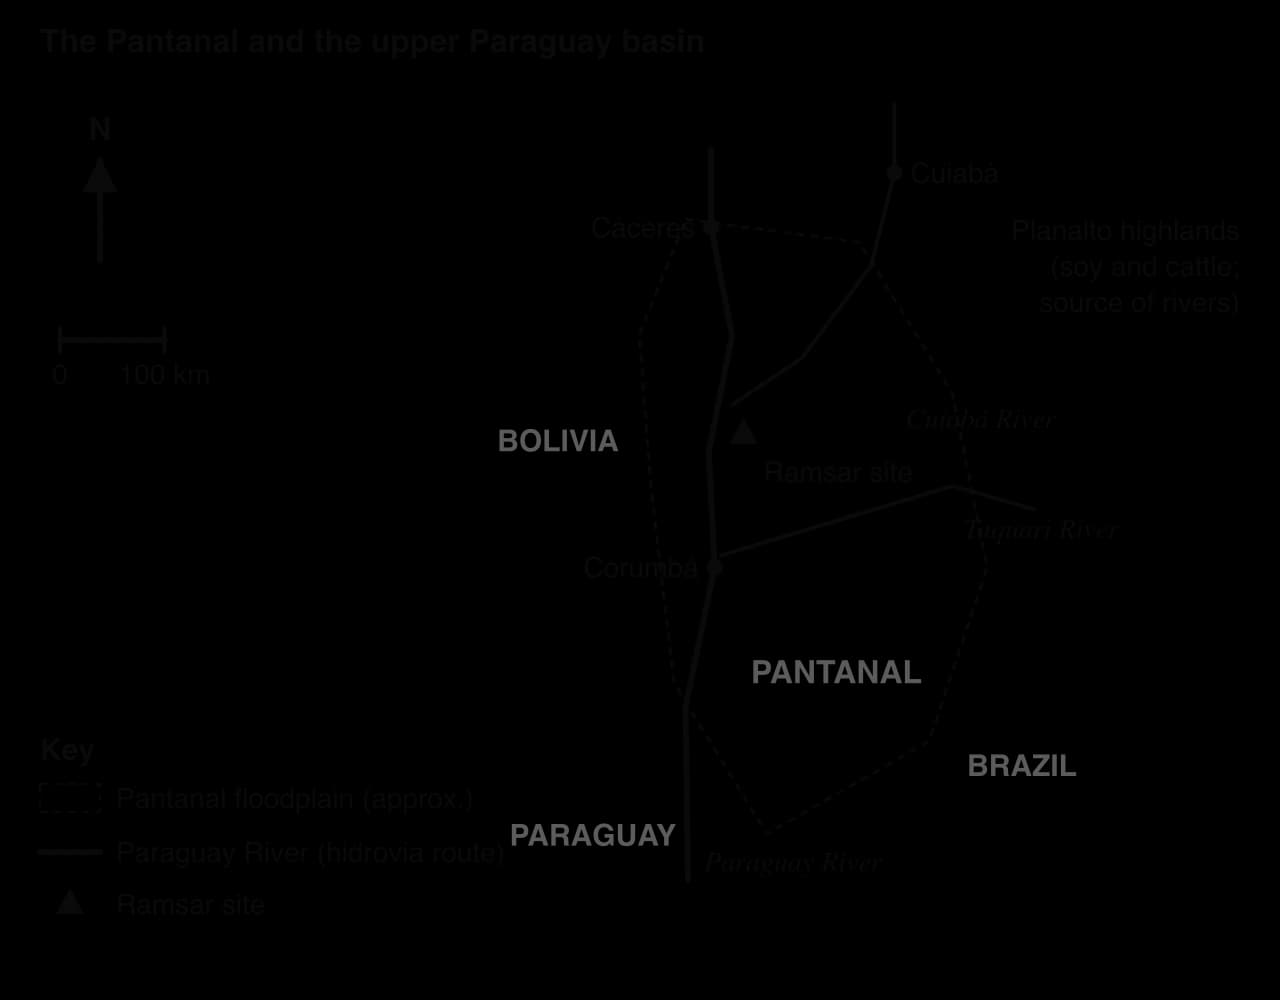
Pressures come from inside and outside the wetland. About 99% of the land is privately owned, with about 2,500 ranches and up to 8 million cattle. Soy farming on the Planalto sends pesticides and eroded silt into the rivers; gold mining pollutes; and a long-standing plan to dredge the Paraguay–Paraná waterway (hidrovia) for ocean-going ships 3,442 km inland would change the timing of floods and drainage.
Fire is now the most visible threat. In 2020 fires burned about a quarter of the wetland, and Brazil’s space agency INPE detected more than 21,200 fires by November; satellite monitoring by the Federal University of Rio de Janeiro’s LASA laboratory recorded 3.6 million hectares burned in 2020 and 2.6 million hectares, about 17% of the biome, in 2024.
Sources: Wikipedia, "Pantanal" (INPE); LASA/UFRJ fire data as reported in 2024–2025.
Possible future | What would happen | Conditions |
|---|---|---|
Continued degradation | More frequent drought and fire, silted rivers, loss of flooded grassland and wildlife | Climate change continues; upland farming expands; the hidrovia is dredged |
Managed sustainable use | Ranching continues alongside protected areas; ecotourism (jaguar viewing) grows | Fire management, controls on upland erosion, payments to ranchers for conservation |
Basin-scale restoration | Natural flood pulse protected; damaged areas recover | Brazil, Bolivia and Paraguay manage the upper Paraguay basin together; hidrovia plans abandoned |
The Pantanal’s future shows why wetlands cannot be protected only within their boundaries. Ramsar sites and parks cover a small part of it, while the decisions that matter most, on upland farming, fire use and the waterway, are taken by landowners and three national governments. Its most likely future lies between the first two scenarios, and which one dominates depends on whether its management becomes basin-wide.
Paper 1 sets, for each option, a 10-mark structured question on a stimulus and a choice of two 10-mark extended questions.
Table: dams in the Mekong basin by territory, February 2024.
Territory | Hydropower plants | Irrigation dams | Other dams | Total |
|---|---|---|---|---|
Cambodia | 1 | 9 | 1 | 11 |
Yunnan (China) | 26 | 25 | 10 | 61 |
Tibet (China) | 4 | 0 | 0 | 4 |
Laos | 56 | 4 | 6 | 66 |
Myanmar | 1 | 0 | 0 | 1 |
Thailand | 7 | 159 | 2 | 168 |
Vietnam | 26 | 33 | 1 | 60 |
Total | 121 | 230 | 20 | 371 |
Sources: CGIAR WLE Greater Mekong dams dataset via Wikipedia, "Mekong" (2024).
Part (b) asks for one reason and its development.
Part (c) asks for two developed explanations.
Extended questions usually ask for an evaluation of dams, IDBM or wetland protection, often with "costs and benefits" or "for different stakeholders" in the question.
A second essay might ask about IDBM or wetlands.
Community participation improves water management through local knowledge, ownership and maintenance; the Dublin Principles (1992) called for management at the lowest appropriate level.
Top-down management suits large systems and cities; bottom-up management, such as johads in Alwar, suits scattered rural communities; the best schemes combine both.
In HICs, demand management, reuse (Singapore’s NEWater), water markets and catchment partnerships manage scarcity; efficiency gains can be lost to the rebound effect.
Access is measured by the JMP ladder; water is both a human right, recognised by the UN in 2010, and an economic good, a tension shown in Cochabamba in 2000.
Multipurpose dams provide power, irrigation, flood control and supply, but displace people, trap sediment and block fish; costs and benefits fall on different stakeholders.
On the Mekong, 371 dams (2024) bring power and revenue to Laos, Thailand and China, while fisheries, the Tonle Sap and the delta bear the costs.
IDBM manages a whole basin with all stakeholders; the Murray–Darling Basin Plan returned 2,750 GL a year but remains politically contested.
Wetlands provide many ecosystem services but have lost an estimated 22–35% of their area since 1970; Ramsar promotes wise use but cannot stop pressures from outside a site, as the Pantanal shows.
I can explain why community participation improves water management, with examples from an LIC and an HIC.
I can distinguish top-down from bottom-up management and evaluate each.
I can examine strategies for efficient water use and for clean, safe and affordable access, including the rebound effect and water pricing.
I can describe the purposes of multipurpose dams and evaluate their costs and benefits for named stakeholders.
I can use the Mekong case study to evaluate contemporary dam building in one basin.
I can explain the principles of IDBM and evaluate the Murray–Darling Basin Plan.
I can examine pressures on wetlands and evaluate the Ramsar Convention.
I can discuss the future possibilities for the Pantanal.
technical measures at farm scale: riparian buffer strips, constructed wetlands, cover crops, precision fertiliser application, drip irrigation to reduce salinization
Good answers may be well structured (AO4) and may additionally offer a critical evaluation (AO3) which weighs effectiveness against cost, time lags (eg legacy phosphorus stored in soils and sediments) and the power of different stakeholders: regulation is often more effective than voluntary schemes, but is resisted by farming lobbies (power). Another approach might be to compare high-income and lower-income places, where enforcement capacity differs (places). Another approach might be to consider scale, noting that farm-level measures may be effective locally but insufficient for a whole drainage basin.
For 5–6 marks, expect some weakly-evidenced outlining of strategies to reduce agricultural impacts on water quality.
For 7–8 marks, expect a structured account which includes:
either well-evidenced explanation of two or more strategies in named places
or a discursive conclusion (or ongoing evaluation) grounded in geographical concepts and/or perspectives about their effectiveness.
For 9–10 marks, expect both of these traits.
NB. Maximum [4] if the strategies are not linked to agricultural impacts (eg sewage or industrial pollution only). Maximum [5] if no named place is used.
Marks | Level descriptor |
|---|---|
0 | The response does not reach a standard described by the descriptors below. |
1–2 | Too brief, lists unconnected information, not focused on the question and lacks structure. Knowledge is very general, with large gaps or errors; examples or case studies are missing or only listed. No analysis; terminology is missing or used incorrectly. |
3–4 | Too general, lacks detail, not focused on the question and largely unstructured. Outlines examples, statistics and facts, both relevant and irrelevant, with links to the question only listed. Basic terminology is used, with errors or inconsistently. No critical evaluation of evidence; any conclusion is irrelevant. |
5–6 | Partially addresses the question, with a narrow argument, an unsubstantiated conclusion and limited evaluation. Describes relevant supporting evidence (examples, case studies) and outlines links to the question. The argument repeats one point or covers only part of the question. Other perspectives, or strengths and weaknesses of evidence, are listed. |
7–8 | Addresses the whole question; the analysis is evaluated and the conclusion is relevant but lacks balance. Relevant evidence is described correctly and covers all the main points. The argument is clear but one-sided or unbalanced. Complex terminology is used correctly but not consistently. Other perspectives, or strengths and weaknesses of evidence, are described. |
9–10 | In-depth and specific to the question (topic and command term). Correct, relevant examples, statistics and detail are integrated and their link to the question explained. The argument is balanced, explaining complexity, exceptions and comparisons. Evaluation of evidence and perspectives is well developed, and the conclusion is balanced and aligned with the evidence. Logically structured and easy to follow. |
Examine the view that channel modifications move flood risk from one place to another rather than reducing it.
10 marks
Examine why climate modelling provides only limited certainty for planning future flood mitigation.
10 marks