
Explain how water moves through a drainage basin, how discharge and channel shape control a river’s energy, how rivers erode, transport and deposit, and how waterfalls, meanders, levees and deltas form.
Each is in the Geography glossary, with every other term in the subject.
An erosion process in which material carried by a river, waves, ice or wind is scraped and bounced against a surface, wearing it away; also called corrasion.
A body of permeable rock or sediment that can store water and allow it to move through it; it is unconfined when open to the surface and confined when sealed by impermeable layers.
An erosion process in which particles of load collide with each other and break into smaller, more rounded pieces.
The part of a river's discharge supplied by groundwater seeping slowly into the channel, which keeps the river flowing between storms and in dry seasons.
The lowest level to which a river can erode its bed, usually sea level, or the level of a lake for rivers that drain into one.
A model that summarises how river channel characteristics change downstream, with discharge, width, depth, velocity and load quantity increasing and particle size, bed roughness and gradient decreasing.
The total amount of load that a river can carry at a given discharge.
The size of the largest particle that a river can transport at a given velocity.
Describe the drainage basin as an open system of inputs, outputs, stores and flows, and distinguish it from the closed global hydrological cycle.
Explain how the type and intensity of precipitation, and the condition of the soil, control the pathways water takes to a river.
Construct a drainage basin water balance and interpret a soil moisture budget.
Explain the relationship between discharge, stream velocity, channel shape and hydraulic radius, using field measurements.
Evaluate the Bradshaw model as a description of how rivers change downstream.
Explain the processes of erosion, transportation and deposition, using the Hjulström curve.
Examine how spatial and temporal factors, including channel characteristics and seasonality, change the work a river does.
Explain the formation of waterfalls, meanders, ox-bow lakes, floodplains, levees and deltas, with annotated diagrams and located examples.
Every river is fed by an area of land that collects rainfall and snowmelt and passes it, by many routes, to a channel. How quickly that water arrives and how much energy the river has decide whether it carves a gorge, builds a floodplain or extends a delta into the sea.
The topic is about process above all: the movement of water through a system and the work it does on the landscape. It also shows place, because the same processes produce different results in a steep mountain catchment and on a lowland plain, and scale, because a hillslope, a drainage basin and the global water cycle can each be studied as a system. Knowing how a natural basin works is the starting point for understanding
68 exam-style questions on this subtopic, written in the style of the IB papers. The first has its markscheme open. Counted on
Examine the relative importance of inputs and stores in determining how much precipitation reaches a river channel in different drainage basins.
10 marks
Marks should be allocated according to the markbands.
The drainage basin is an open system. Inputs are precipitation of varying type (rain, snow, hail), intensity and duration. Stores include interception by vegetation, surface (depression) storage, soil moisture, groundwater in aquifers, channel storage and the cryosphere (snow and ice). The question asks how far the amount of water reaching the channel (as overland flow, throughflow and base flow) is controlled by the input compared with the capacity and condition of the stores. Accept answers that treat outputs (evaporation and transpiration) as part of the store argument, for example vegetation returning water to the atmosphere.
Possible applied themes (AO2) demonstrating knowledge and understanding (AO1):
Precipitation intensity: when intensity exceeds the infiltration capacity of the soil, Hortonian overland flow delivers water rapidly to the channel, so the input can override the stores (eg convectional storms on semi-arid slopes producing flash floods in wadis).
Precipitation type and duration: snow is held in the cryosphere and released later as meltwater; prolonged frontal rain gradually fills soil stores until saturation-excess overland flow occurs.
Interception stores: a dense forest canopy may intercept a significant share of light rain, much of which evaporates, but the store fills quickly and matters little in a long or intense event.
Soil moisture stores: deep, permeable soils absorb large volumes and release them slowly as throughflow; thin or already saturated soils (eg upland peat moorland in northern England) pass most rainfall on rapidly.
Groundwater stores: permeable rock such as chalk or sandstone holds water in aquifers and sustains base flow; chalk streams in southern England have very high base flow and a muted response to rain.
With a free account, Augment remembers where you stopped and what you have practiced.
The lowest mean velocity at which a particle of a given size is picked up and set in motion by flowing water; also called the entrainment velocity.
A landform of sediment deposited where a river enters a sea or lake faster than waves and currents can remove it, often divided by distributaries; arcuate, bird's-foot and cuspate are its main shapes.
The laying down of sediment by a river, waves, ice or wind when its velocity, and so its energy, falls too low to carry the load.
The volume of water passing a point in a river per unit of time, found by multiplying the cross-sectional area of the channel by the mean velocity, and measured in m³ s⁻¹ (cumecs).
A channel that branches off from the main river and flows away from it, usually across a delta, to reach the sea separately.
An area of land drained by a river and its tributaries, from which all precipitation that is not lost to the atmosphere flows to the same outlet; also called a catchment.
The total length of all streams in a drainage basin divided by the area of the basin, measured in km per km².
The wearing away and removal of rock and sediment by a moving agent such as a river, waves, ice or wind.
The tidal mouth of a river where fresh water mixes with sea water, and where tides and waves remove sediment rather than letting it build a delta.
The process by which liquid water is changed into water vapour and returned to the atmosphere from surfaces such as oceans, lakes, soil and wet vegetation.
The combined loss of water to the atmosphere by evaporation and transpiration; potential evapotranspiration (PET) is the amount that would be lost if water were always available.
The wide, flat area of a valley floor on either side of a river that is covered by water during floods and built of layers of alluvium.
Water stored in the pore spaces and cracks of rocks and sediments below the water table; its slow movement through rock towards rivers is groundwater flow.
A corkscrew-like flow of water through a meander bend, in which surface water moves towards the outer bank and returns along the bed towards the inner bank.
A graph that shows the mean velocity at which particles of different sizes are eroded, transported or deposited by a river, plotted on logarithmic axes from laboratory measurements.
An erosion process in which the force of moving water, and air compressed into cracks by it, loosens and removes material from the bed and banks of a channel or from a cliff.
A measure of channel efficiency found by dividing the cross-sectional area of a channel by its wetted perimeter; a larger value means less water in contact with the bed and banks and less friction.
The continuous circulation of water between the oceans, atmosphere, land and living things, driven by solar energy and gravity; at the global scale it is a closed system.
The downward movement of water from the ground surface into the soil.
The maximum rate at which water can soak into a soil under given conditions, measured in mm per hour; it falls as the soil becomes wetter or more compacted.
The capture and temporary storage of precipitation by vegetation before it reaches the ground; some intercepted water later evaporates and the rest drips or runs to the ground.
A sudden break of slope in the long profile of a river, often marked by a waterfall or rapids, where resistant rock or a fall in base level interrupts the smooth curve.
A raised bank along the edge of a river channel; natural levees are built of coarse sediment deposited when floodwater spills out of the channel and loses velocity.
A graph or section showing how the height of a river bed changes with distance from its source to its mouth, typically a concave curve that flattens towards base level.
A sinuous bend in a river channel, with erosion on the outer bank and deposition on the inner bank, that migrates across the floodplain over time.
The movement of water over the ground surface towards a channel, when rainfall exceeds the infiltration capacity of the soil or falls on soil that is already saturated; also called surface runoff.
A crescent-shaped lake on a floodplain formed when a river cuts through the narrow neck of a meander and deposition seals off the abandoned loop.
The slow downward movement of water from the soil into the underlying rock, where it may reach the groundwater store.
A gently sloping deposit of sand and gravel on the inside of a meander bend, where water is shallow and flow is slow.
A steep bank on the outside of a meander bend, formed by lateral erosion where flow is fastest and deepest; also called a cut bank.
A transport process in which pebbles and sand grains are lifted by the flow and bounce along the bed in a series of hops.
The mean velocity below which a particle of a given size can no longer be carried by flowing water and is deposited.
A measure of how much a river channel bends, found by dividing the channel length between two points by the straight-line distance between them; values above about 1.5 indicate a meandering channel.
An erosion process in which rock minerals, especially calcium carbonate in limestone and chalk, are dissolved by weakly acidic water; also called corrosion. Dissolved material carried away is the solution load.
A transport process in which fine particles such as silt and clay are carried within the body of the flowing water, held up by turbulence.
The line joining the deepest and fastest-flowing parts of a river channel along its course; it swings towards the outer bank on bends.
The lateral movement of water downslope through the soil towards a river channel, sometimes concentrated in natural pipes.
A transport process in which the largest particles, such as boulders, are rolled or dragged along the river bed by the force of the flow.
The loss of water vapour from plants to the atmosphere, mainly through the stomata in their leaves, after the water has been taken up from the soil by the roots.
The movement of eroded material by a river, waves, ice or wind, by traction, saltation, suspension or solution.
An equation that accounts for all water entering and leaving a drainage basin over a period: precipitation equals discharge plus evapotranspiration plus or minus the change in storage.
The upper surface of the saturated zone in rock or soil, below which all pore spaces are filled with water; its height rises after recharge and falls in dry periods.
A sudden vertical drop in the long profile of a river, often where a band of resistant rock lies over less resistant rock that is eroded more quickly.
The boundary of a drainage basin, usually a line of high ground, that separates water flowing into one river system from water flowing into a neighbouring one; also called a divide.
The total length of the bed and banks of a river channel in contact with the water at a cross-section, measured in metres.
Water moves continuously between the oceans, the atmosphere, the land and living things. This circulation is the hydrological cycle. It is driven by solar energy, which evaporates water, and by gravity, which brings it back as precipitation and drives it downhill to the sea.
At the global scale the cycle is a closed system: energy enters and leaves it, but the amount of water stays almost the same. What changes is where the water is stored.
Store | Share of all water | Share of fresh water | Typical residence time |
|---|---|---|---|
Oceans | 96.5% | — | About 3,200 years |
Ice sheets and glaciers | 1.74% | 68.7% | 20–100 years (glaciers); about 20,000 years (Antarctica) |
Groundwater | 1.69% | 30.1% (fresh groundwater) | 100–200 years (shallow); about 10,000 years (deep) |
Fresh lakes | 0.007% | 0.26% | 50–100 years |
Soil moisture | 0.001% | 0.05% | 1–2 months |
Atmosphere | 0.001% | 0.04% | About 9 days |
Rivers | 0.0002% | 0.006% | 2–6 months |
Sources: USGS Water Science School, “Where is Earth’s water?”, after Shiklomanov in Gleick (1993); residence times from Pidwirny, Fundamentals of Physical Geography (2006).
Only about 2.5% of the world’s water is fresh, mostly as ice or groundwater; rivers hold a tiny fraction. Stores also differ in residence time, the average time water spends in them: about nine days in the atmosphere, thousands of years in deep groundwater and the Antarctic ice sheet. Fast stores respond to a single storm; slow stores smooth out wet and dry years.
A drainage basin is the area of land drained by a river and its tributaries: all precipitation that falls inside it and is not lost to the atmosphere passes the same outlet. Its boundary is the watershed, usually a ridge of high ground. The basin is also called a catchment and the watershed a divide.
The source is where a river begins and the mouth where it ends. A tributary joins a larger river at a confluence, and an interfluve is the higher land between two valleys. In stream order, two first-order headwater streams join to make a second-order stream, two second-order streams make a third-order stream, and so on. Drainage density is the total length of streams divided by basin area, in km per km². It is high on impermeable rock such as clay or granite, where little water soaks in, and low on permeable chalk or limestone, where water travels underground.
On a topographic map the watershed is traced along the highest ground between neighbouring river systems. Starting at the river mouth or a chosen gauging point, the line follows ridge crests and hilltops, crossing contours only where they bend back on themselves at spurs and summits, and never crosses a stream. Contours that form a V pointing upstream mark a valley; contours that form a V pointing downhill mark a spur, which is where the watershed usually runs.
A drainage basin is an open system: water and energy cross its boundary. Water enters as precipitation and leaves as evaporation, transpiration and river discharge; some groundwater may leak beneath the watershed. Inside, water is held in stores and moved between them by flows (transfers).
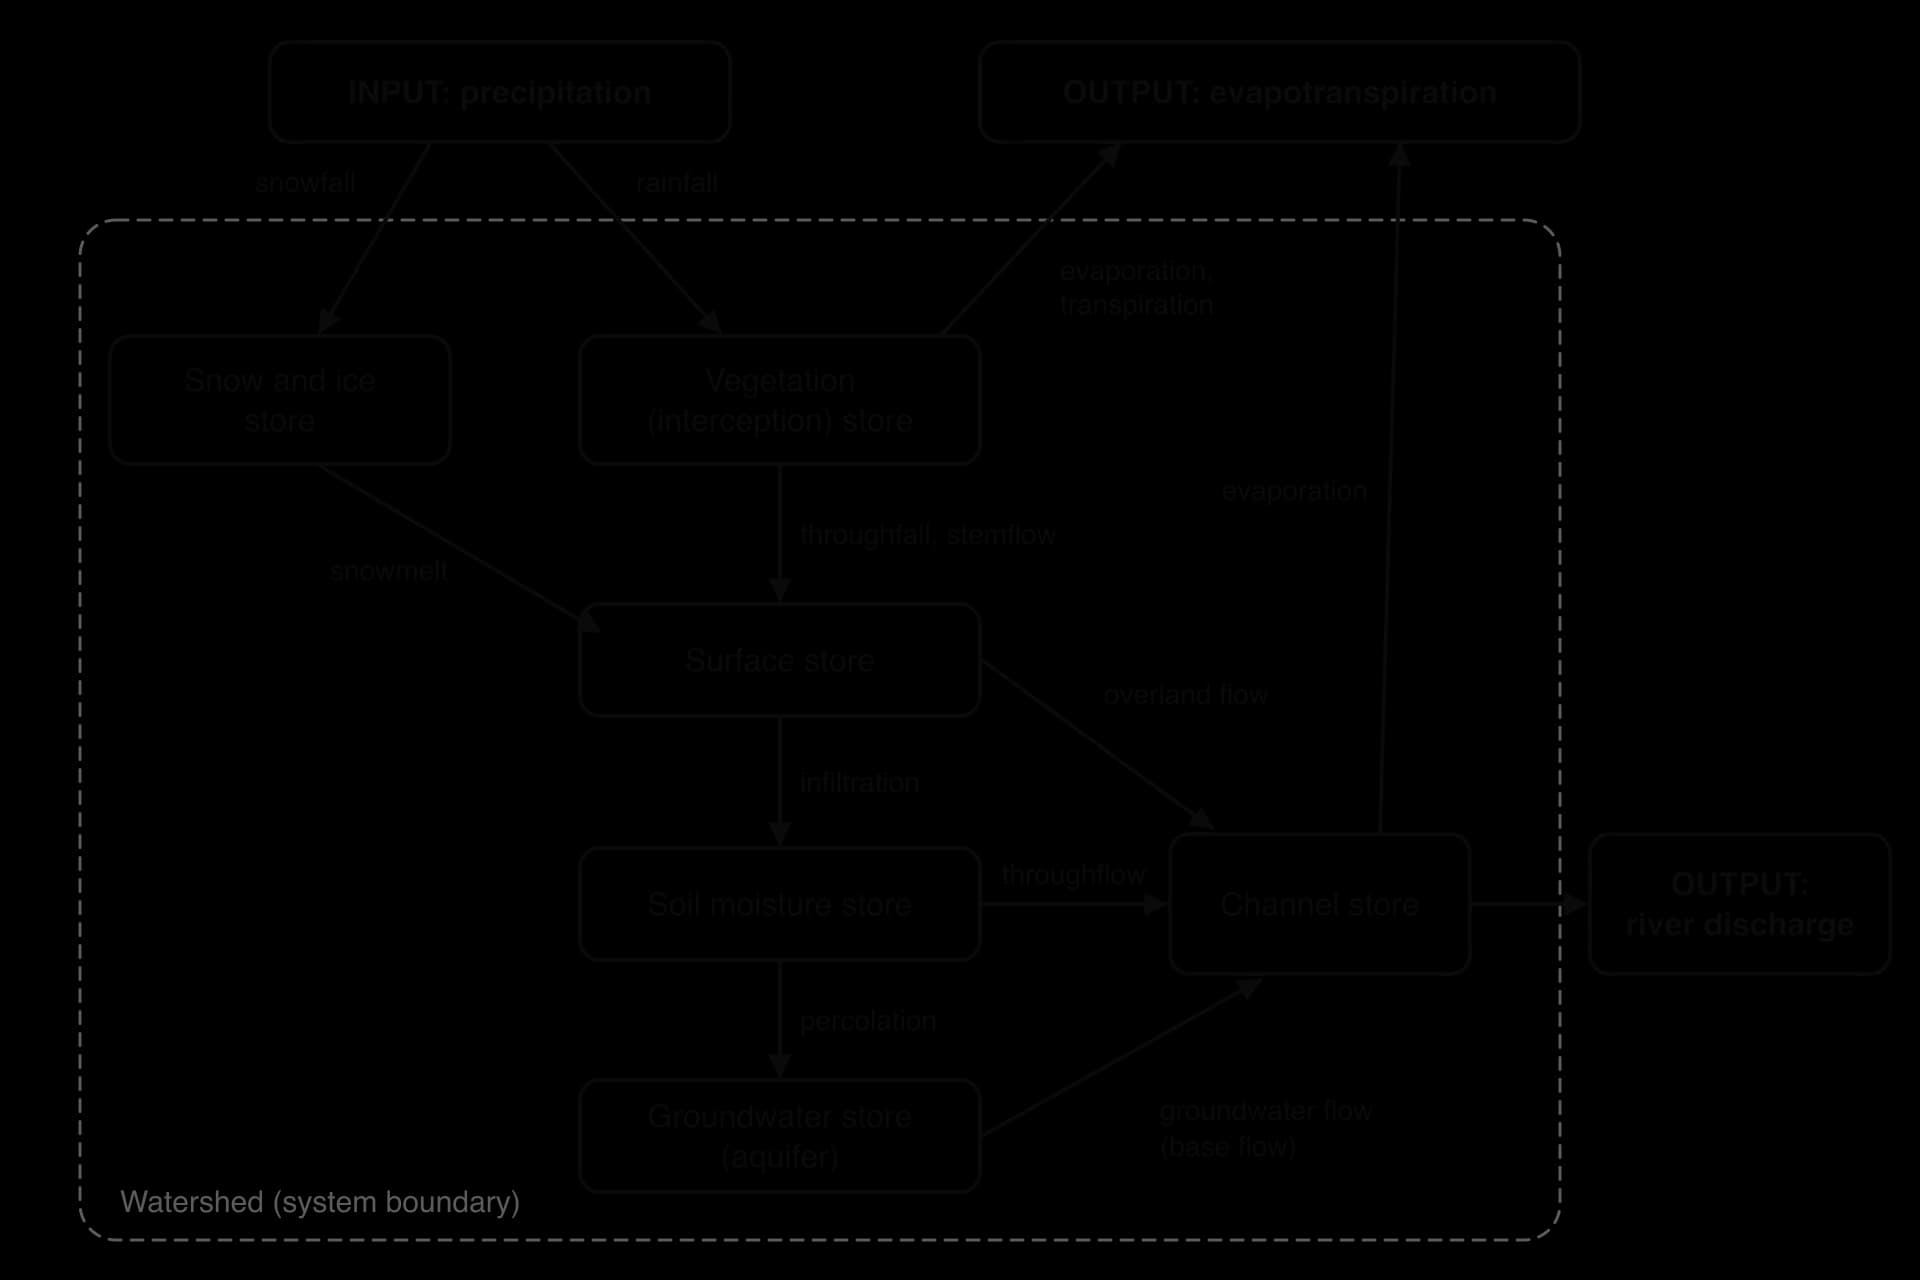
A proportional flow diagram draws the same system with each arrow’s width in proportion to the volume it carries over a period, such as a year. It shows at a glance which pathways dominate: in a forested basin on permeable rock the widest arrows are transpiration, throughflow and groundwater flow, while in an urban basin the overland flow arrow becomes one of the widest.
Precipitation (rain, snow, sleet, hail and fog drip) forms when moist air rises, cools to its dew point and condenses. Three mechanisms make air rise.
Type | How air rises | Character | Example |
|---|---|---|---|
Convectional | Heated ground warms the air, which rises in strong currents | Short, very intense storms over small areas | Afternoon storms in the Amazon and Congo basins |
Frontal (cyclonic) | Warm air rises over cold air in a mid-latitude depression | Long periods of moderate rain over large areas | Winter rain in north-west Europe |
Orographic (relief) | Moist air is forced over mountains | Heavy rain on windward slopes; a rain shadow on the lee side | The Western Ghats of India in the south-west monsoon |
The effect on a basin depends less on the total than on intensity (mm per hour), which decides whether water can soak in fast enough; duration, which decides how wet the soil becomes; frequency, which decides whether the basin drains between events; and areal extent. Snow is a delayed input, stored until it melts: the Indus, Ganges and Brahmaputra receive much of their spring and summer flow from snow and glacier melt.
Evaporation is the change of liquid water into vapour, from lakes, rivers, wet soil and wet leaves. It increases with temperature, wind and dry air, and needs water to be available. Transpiration is the loss of water vapour from plants through pores in their leaves (stomata); it varies with plant type and season, and plants close their stomata in drought.
The two are usually combined as evapotranspiration. Potential evapotranspiration (PET) is the amount that would be lost if water were always available; actual evapotranspiration is what is really lost. In a desert PET is very high but actual evapotranspiration is tiny, because there is almost no water. The other main output is river discharge through the basin’s mouth.
Interception is the capture of precipitation by plants before it reaches the ground; some evaporates from the leaves (interception loss). Dense forest intercepts far more than grass, and conifers intercept more than deciduous trees in winter. Water in hollows forms surface storage. Water in the soil is soil moisture: after drainage by gravity a soil holds its maximum, its field capacity, and when plants can no longer extract water it has reached its wilting point. Water in the river itself is channel storage.
Groundwater is water in the pores and cracks of rock. Porosity is how much empty space a rock has; permeability is how easily water passes through it. Clay is porous but almost impermeable; sandstone and chalk are both. An aquifer is rock that stores and transmits large amounts of water, and the top of its saturated zone is the water table.
An unconfined aquifer is open to the surface. A confined aquifer is sealed by impermeable layers and refilled only in its recharge area; its water is under pressure, so a well may flow without pumping (an artesian well). The refilling of an aquifer is recharge.
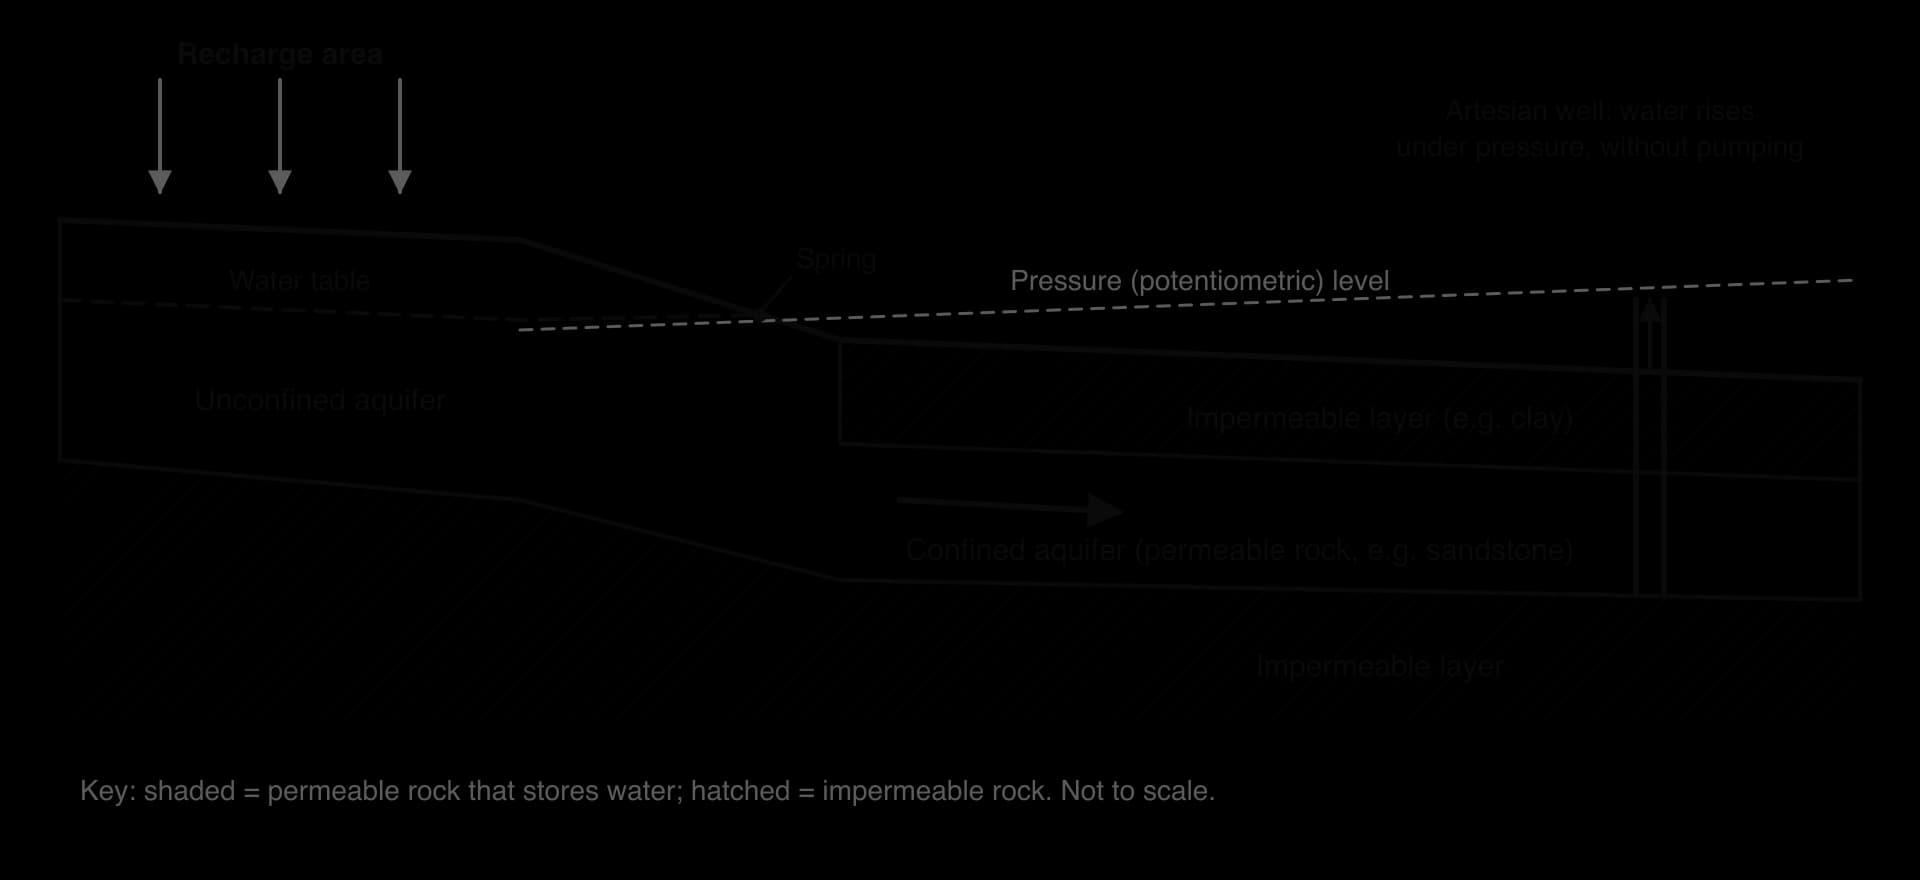
Snow, glaciers and frozen ground make up the cryosphere. Snowpack and glaciers act as seasonal reservoirs, releasing winter precipitation in spring and summer; in the Himalaya they keep major rivers flowing before the monsoon. Frozen ground, including permafrost, also seals the surface so that meltwater runs off.
Rain that falls through or drips from the canopy is throughfall; water running down stems and trunks is stemflow. Infiltration is the movement of water into the soil. The maximum rate at which a soil can absorb water is its infiltration capacity, in mm per hour. It is high in deep, sandy, dry, well-vegetated soils and low in clay, compacted, wet or frozen ground, and it falls during a storm as the pores fill.
Water moves deeper into rock by percolation. Throughflow is lateral flow downslope through the soil, faster where water rushes through natural pipes (pipeflow). Groundwater flow through rock is very slow, often metres per day. Groundwater seeping into the channel provides base flow, which keeps rivers flowing between storms and through dry seasons: rivers fed by chalk aquifers have high, steady base flow.
Overland flow (also called surface runoff) is water flowing across the ground to a channel, the fastest route to a river. It forms in two ways.
Infiltration-excess (Hortonian) overland flow, named after the hydrologist Robert Horton, occurs when rainfall intensity exceeds infiltration capacity. The soil need not be full; it cannot absorb water fast enough. It is typical of intense storms, crusted or compacted soil, bare ground and urban surfaces.
Saturation-excess overland flow occurs when the soil is already full and the water table reaches the surface, so even gentle rain runs off. It is typical of long frontal rain, valley floors and humid regions.
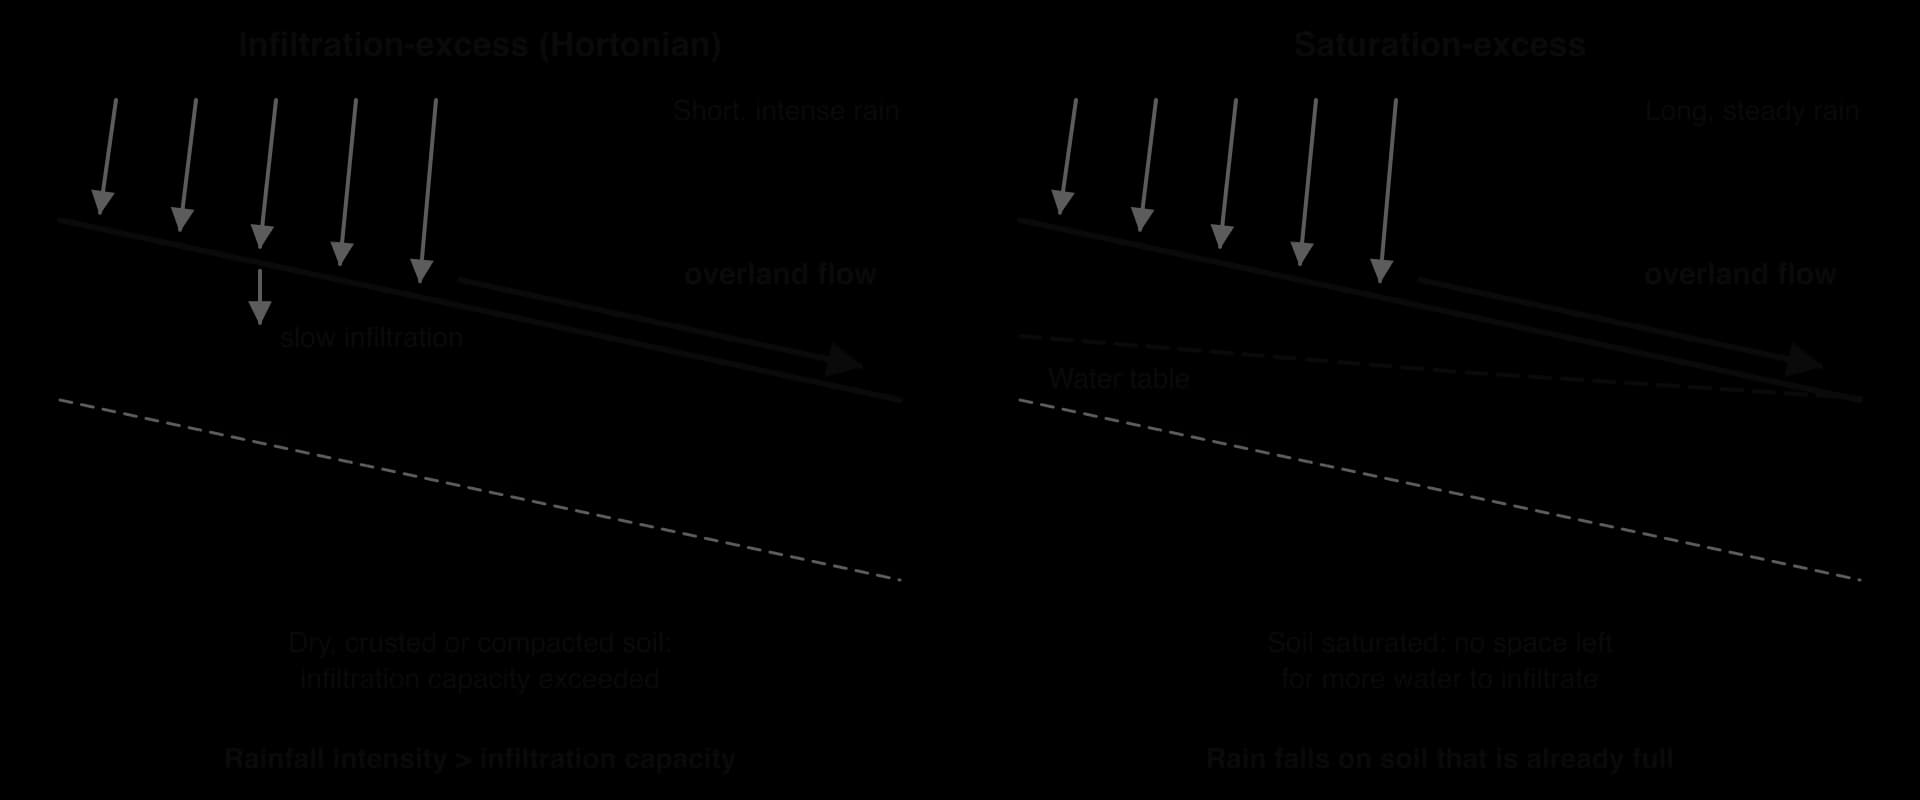
All flows end as channel flow. Overland flow reaches the channel in minutes to hours, throughflow in hours to days, groundwater flow in weeks or longer. A basin where water mostly travels by fast routes has rivers that rise and fall quickly; where it travels underground, rivers respond slowly and stay high for longer. This is the basis of the storm hydrograph, the main tool for studying floods.
Over a period such as a year, all water entering a basin must leave it or be added to its stores. This accounting is the water balance (water budget):
P is precipitation, Q discharge (runoff), E evapotranspiration and ΔS the change in storage in soil, groundwater, lakes and snow, all usually given as a depth of water in mm. In a wet year storage increases; in a dry year water is drawn from storage, which is why rivers keep flowing in droughts.
A soil moisture budget plots mean monthly precipitation and potential evapotranspiration on one graph; the gap between the lines shows whether the soil is gaining or losing water.
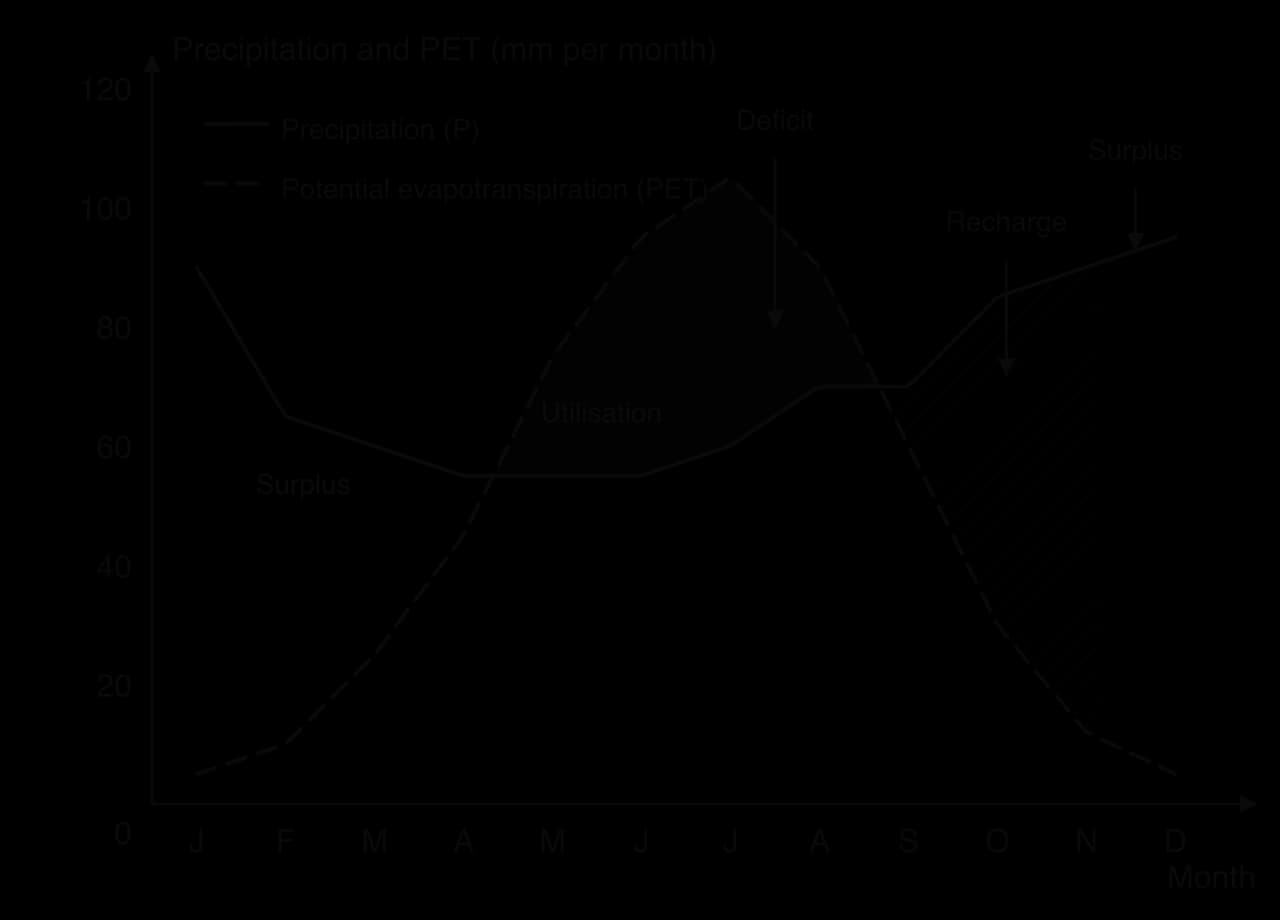
Stage | In the example | What happens |
|---|---|---|
Surplus | December–March | P exceeds PET and the soil is at field capacity: extra water runs off or percolates, rivers are high |
Utilisation | April–June | PET exceeds P, so plants draw on soil water |
Deficit | June–August | Soil water is used up; actual evapotranspiration falls below PET; rivers rely on base flow |
Recharge | September–November | P exceeds PET again and the soil refills; little runoff until field capacity is reached |
Human activity changes almost every part of the system. Deforestation reduces interception and transpiration and leaves soil to be compacted. Urbanisation covers soil with roofs and roads, and drains carry water straight to rivers. Ploughing, machinery and field drains change infiltration; irrigation and groundwater abstraction remove water from stores; reservoirs create new ones.
Discharge is the volume of water passing a point in a given time:
Q is in cubic metres per second (m³ s⁻¹, spoken as “cumecs”), A is the cross-sectional area (width × mean depth, m²) and v the mean velocity (m s⁻¹). Discharge controls a river’s energy to erode and transport and whether it floods.
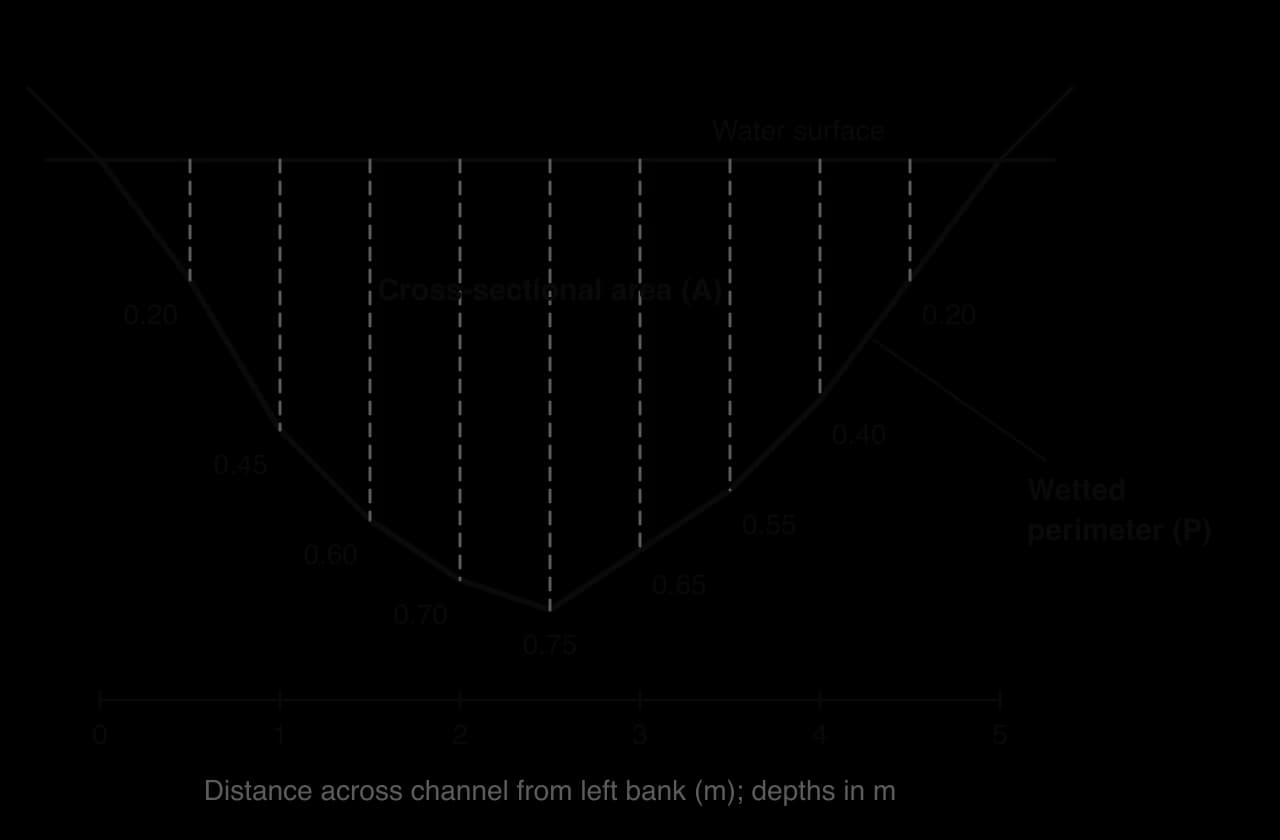
In fieldwork, depth is measured at intervals along a tape across the river, and velocity with a flow meter or a timed float, whose speed is multiplied by about 0.8 because surface water flows faster than the mean. Gauging stations record water level (stage) continuously, and a rating curve from occasional direct measurements converts stage into discharge.
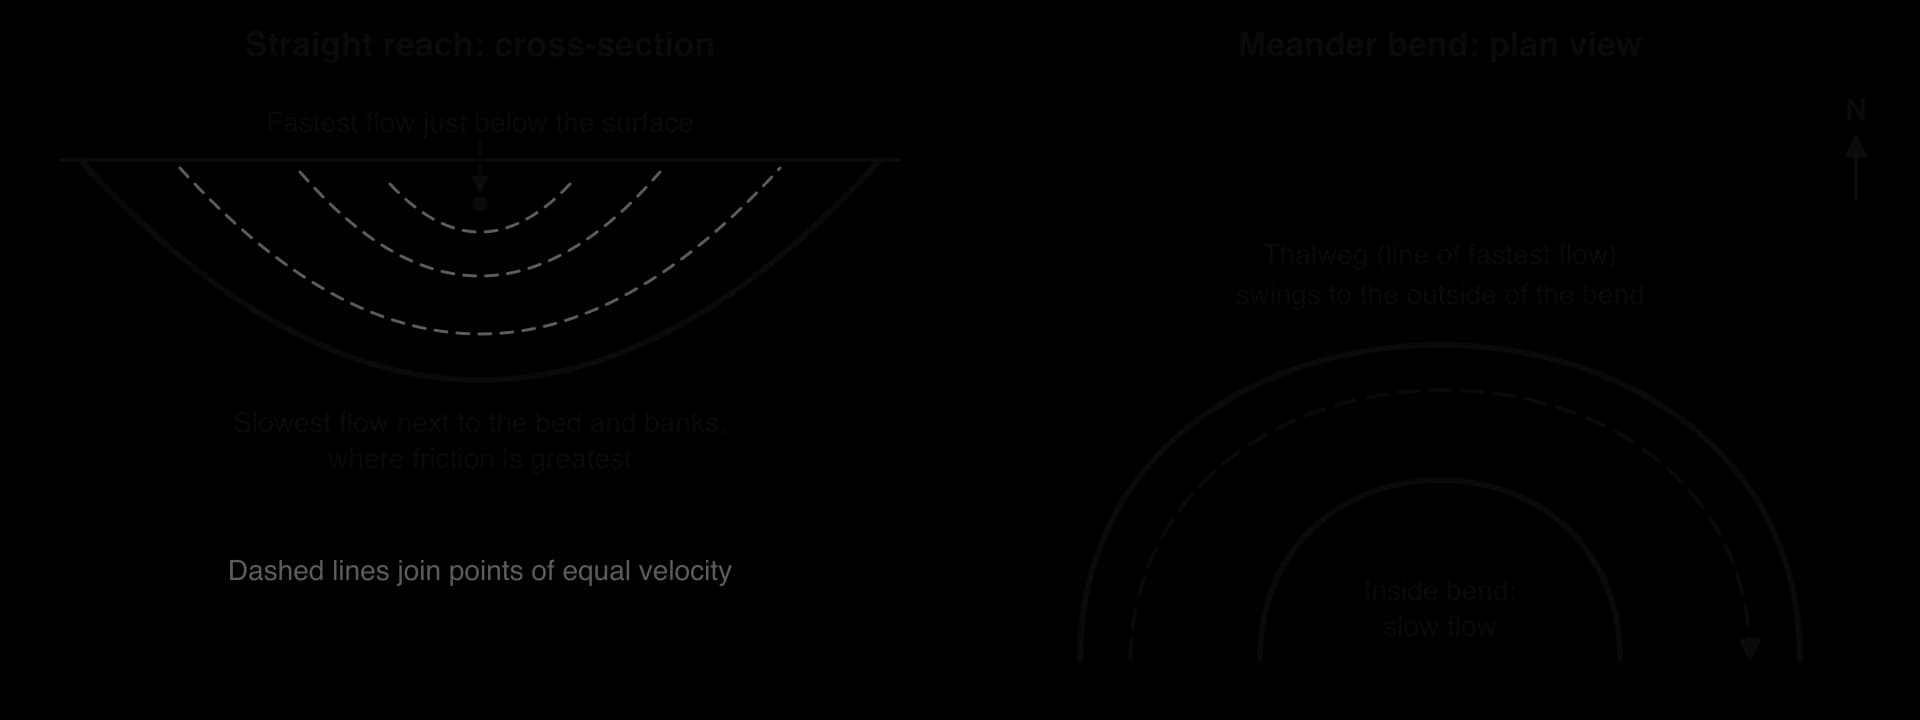
Almost all river flow is turbulent, moving in irregular eddies that lift fine particles; smooth laminar flow is rare. Friction slows water at the bed and banks, so velocity is highest just below the surface in mid-channel. On a bend the fastest flow moves to the outer bank. The line joining the deepest, fastest parts of the channel is the thalweg.
Most of a river’s energy is used to overcome friction. The length of bed and banks in contact with the water is the wetted perimeter (P), and channel efficiency is measured by the hydraulic radius (R):
A higher R means a smaller share of the water is slowed by friction, so it flows faster on the same gradient. A deep, semicircular channel is the most efficient shape and a wide, shallow one the least. For the measured river, P (from the slope of each bed segment) is about 5.25 m, so R = 2.25 ÷ 5.25 ≈ 0.43 m.
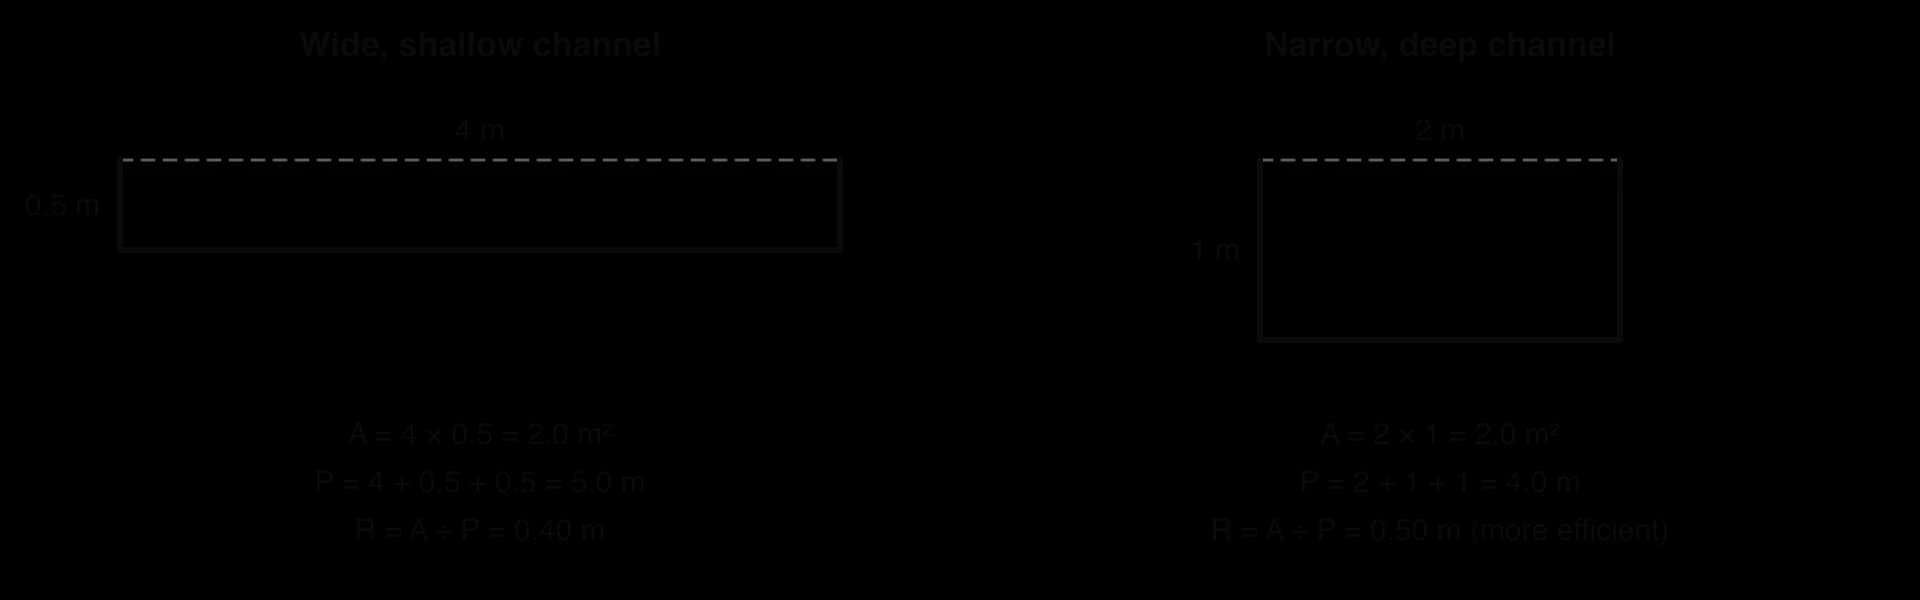
Bed roughness matters too: boulders create far more friction than sand or silt. Mountain streams look fast because they are turbulent, but with rough beds and shallow channels they lose much energy to friction, so large, smooth lowland rivers often have a higher mean velocity despite a gentler gradient.
Engineers estimate mean velocity v (m s⁻¹) from hydraulic radius R (m), channel slope S and a roughness coefficient n, about 0.03 for a clean earth channel and 0.05 or more for a bouldery mountain stream:
Velocity rises with R and S and falls with roughness: doubling n halves v, which is why a gentle but smooth lowland channel can outpace a steep, rocky stream.
The Bradshaw model, widely used in geography teaching and fieldwork, summarises how a river changes from source to mouth. Discharge, channel width, depth, mean velocity and load quantity increase downstream; load particle size, bed roughness and gradient decrease.
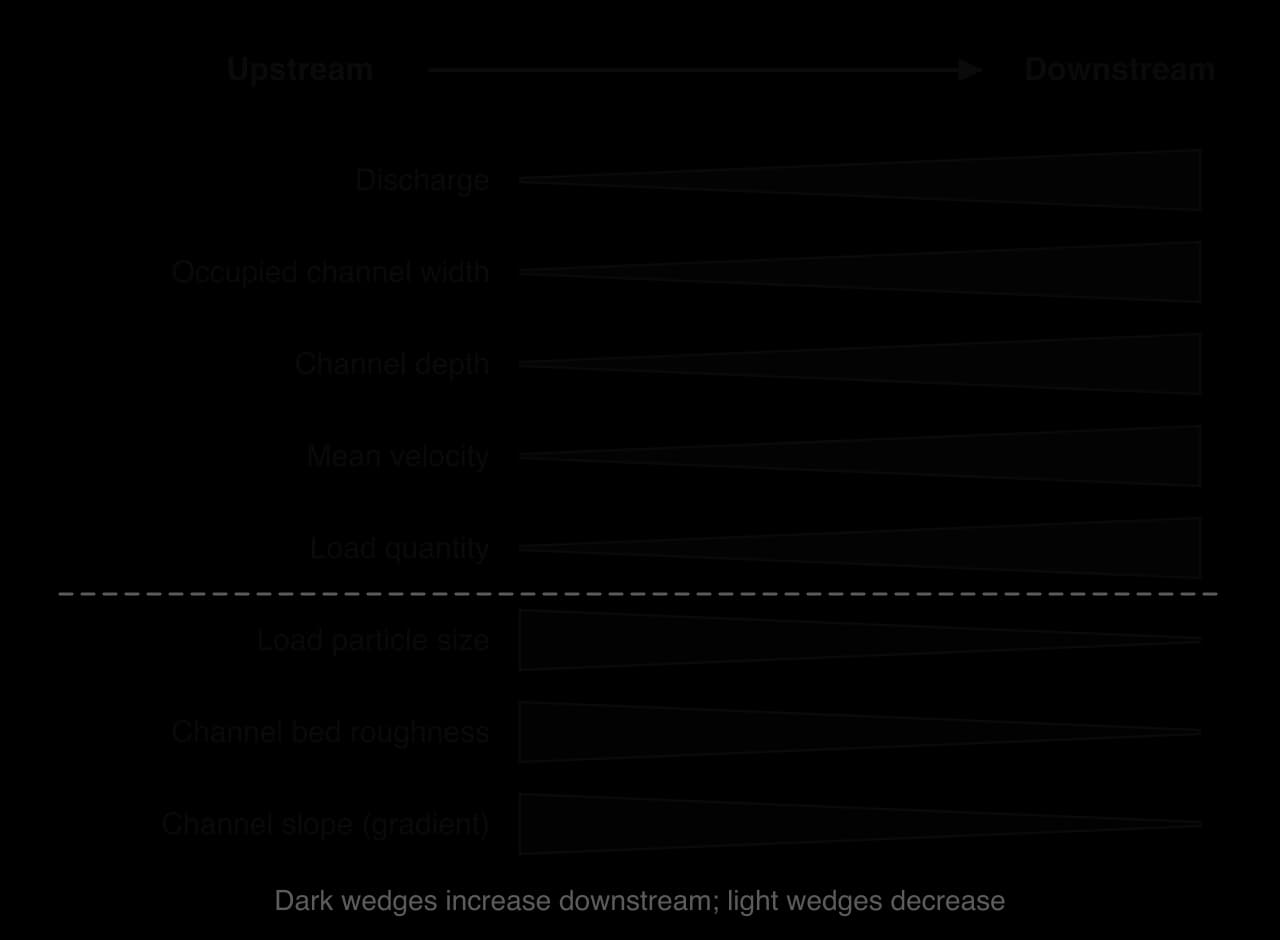
The trends are linked. Tributaries add water, so discharge rises and the channel enlarges. A larger channel has a higher hydraulic radius and a smoother bed, so velocity rises despite the gentler gradient. Attrition and abrasion make load particles smaller and rounder downstream, which makes the bed smoother.
Strengths | Limitations |
|---|---|
Summarises many linked changes in one simple diagram | A generalisation: real rivers change in steps, especially at tributary junctions |
Explains the unexpected rise in velocity downstream | Geology breaks the pattern: resistant rock can create steep, rough reaches far downstream |
Gives clear hypotheses for fieldwork | Dams, weirs and straightened channels change width, depth, velocity and load locally |
Links channel form to process (friction, attrition) | Ignores time: discharge, and so every variable, changes with season and storms |
The model describes an idealised river on one rock type without human interference, so it is best used as a hypothesis: the places where it fails show the effects of geology, tributaries or people.
The long profile shows the height of a river bed from source to mouth. It is usually concave: steep near the source and flattening towards base level, the lowest level to which the river can erode, normally sea level.
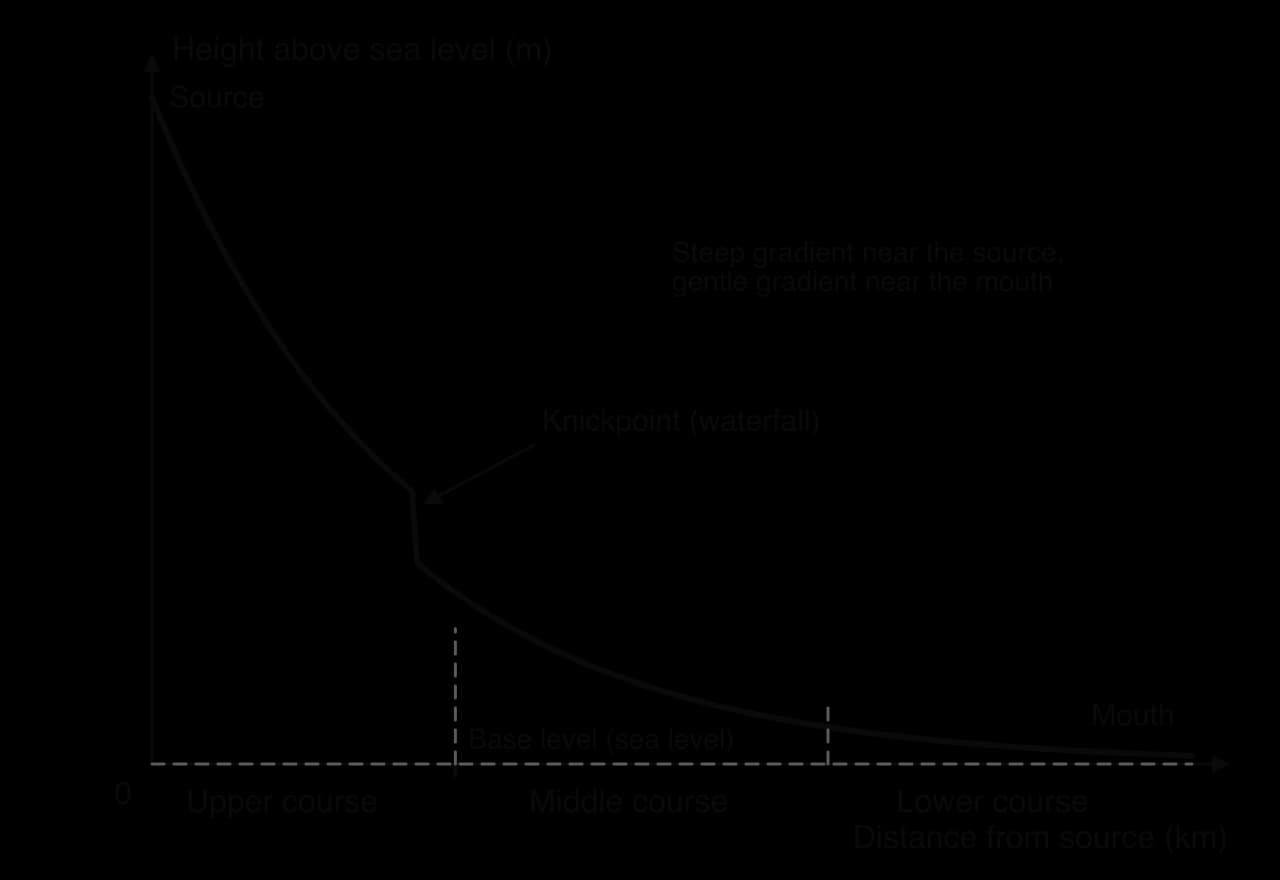
Upstream, small discharge and coarse load need a steep gradient; downstream, more water and finer load need only a gentle one. Breaks in the curve are knickpoints, caused by resistant rock, a fall in base level that makes the river cut down again (rejuvenation), a glacial hanging valley or a fault.
A river gains energy from water flowing downhill; the amount depends mainly on discharge and gradient. Most of it, often put at about 95%, is used to overcome friction and turbulence. Only the surplus can erode and transport, and it grows rapidly when discharge rises, so in many rivers most erosion and transport happen in a few days of high flow each year.
Erosion is the wearing away and removal of material by a moving agent. Rivers erode by four main processes; the same terms are used for waves, ice and wind.
Hydraulic action: the force of the water pushes against the bed and banks and compresses air in cracks, which expands suddenly as pressure drops. Repeated, this widens cracks and loosens material; it is effective on banks of sand and gravel and below waterfalls.
Abrasion (corrasion): the load is scraped and bounced against the bed and banks, wearing them away like sandpaper. It is usually the most effective process. Pebbles swirled in hollows by eddies drill round potholes.
Attrition: load particles knock against each other and break into smaller, rounder pieces. It wears down the load, not the channel.
Solution (corrosion): weakly acidic water, containing dissolved carbon dioxide, dissolves calcium carbonate in limestone and chalk and carries it away invisibly.
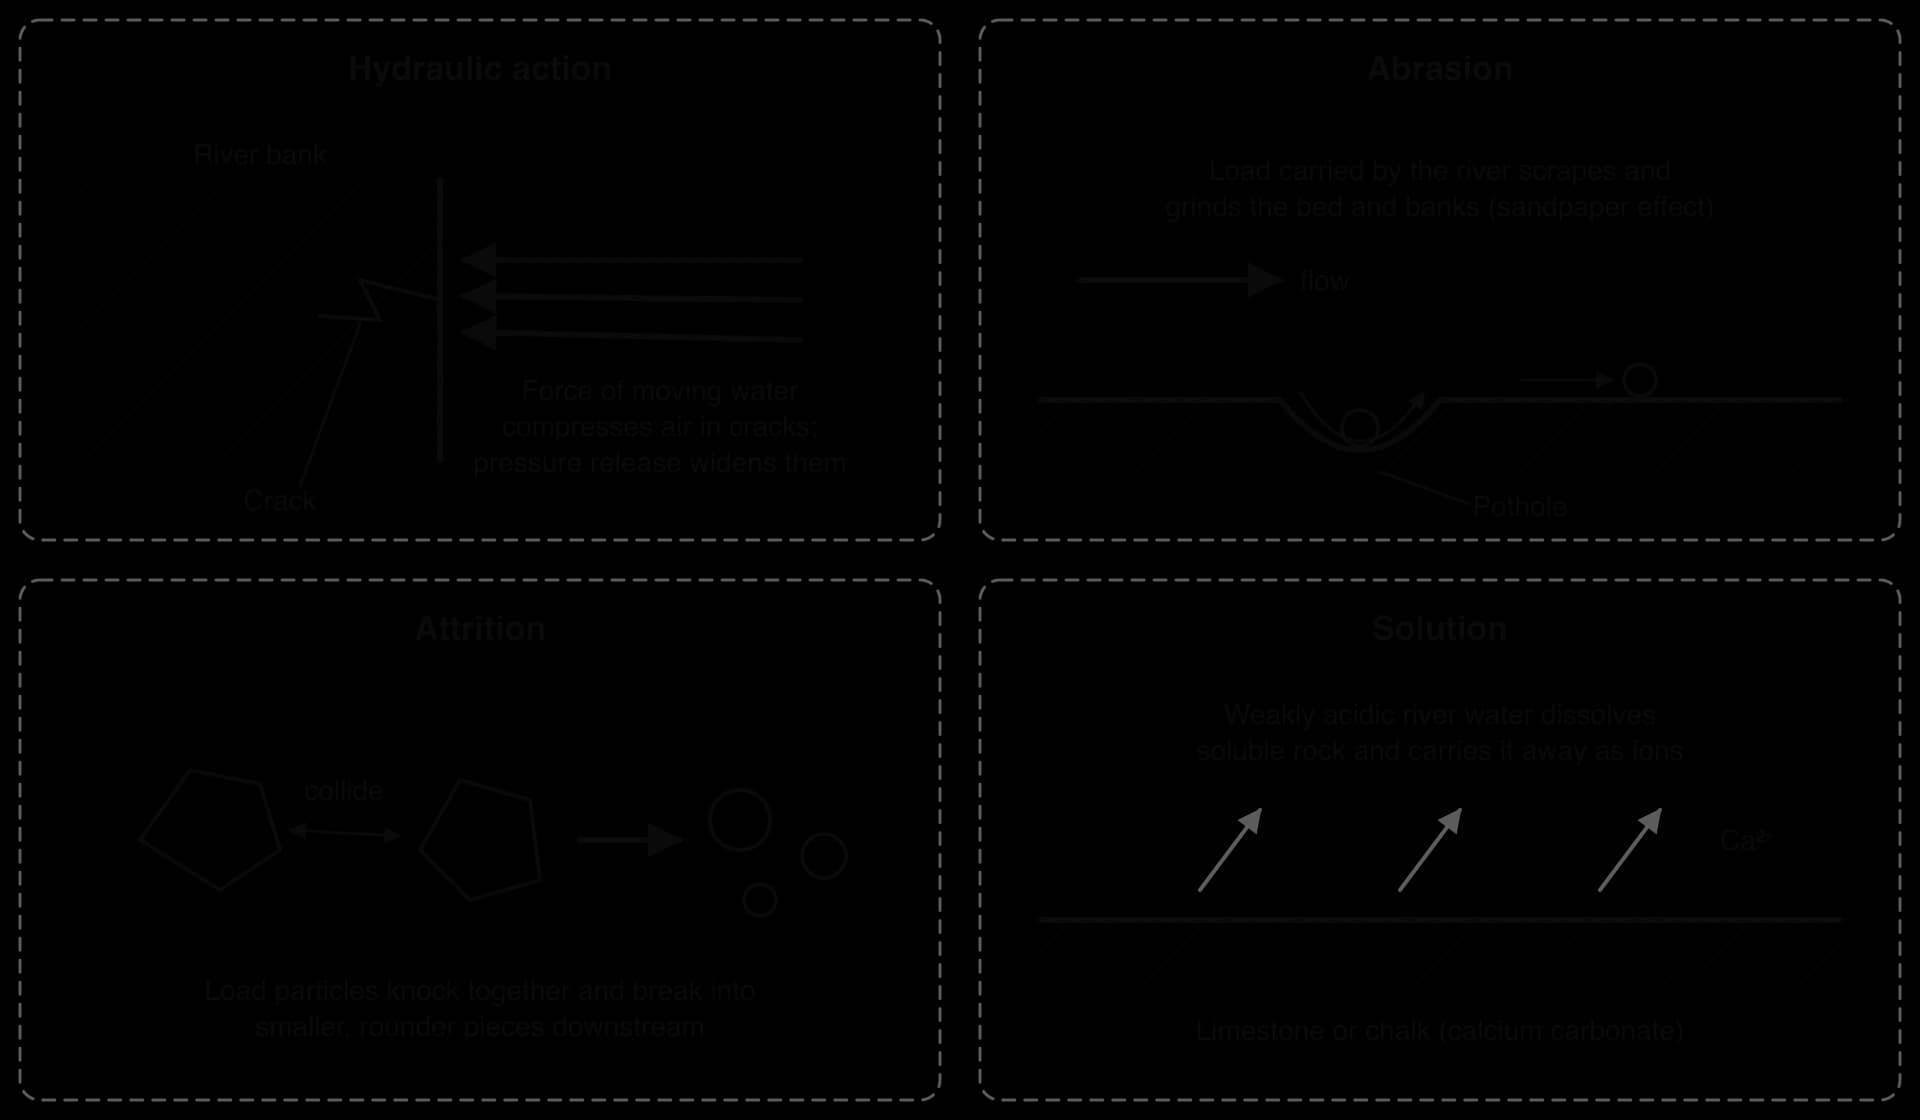
Erosion acts in three directions. Vertical erosion deepens the channel and dominates in the upper course, where the river is high above base level and the load coarse, producing V-shaped valleys. Lateral erosion widens the channel and valley and dominates in the middle and lower course, where meanders swing from side to side. Headward erosion cuts back towards the source, at valley heads and waterfalls.
A minor fifth process, cavitation, occurs where water moves very fast, for example over rapids and at the foot of waterfalls. Air bubbles form in the low-pressure parts of the flow and collapse violently against the bed, and the tiny shock waves weaken the rock surface.
The effect of attrition can be measured in fieldwork with Powers’ scale of roundness, which places each pebble in one of six classes from very angular to well rounded by comparing it with a chart. Samples of pebbles taken at intervals along a river usually become more rounded downstream, as well as smaller.
Transportation is the movement of the eroded load, in four ways that depend on particle size and velocity.
Process | What moves | How |
|---|---|---|
Traction | Boulders and cobbles | Rolled or dragged along the bed, mainly at high discharge |
Saltation | Pebbles, gravel and coarse sand | Lifted briefly and bounced along the bed in hops |
Suspension | Fine sand, silt and clay | Carried in the body of the water, held up by turbulence |
Solution | Dissolved minerals | Carried invisibly as ions |
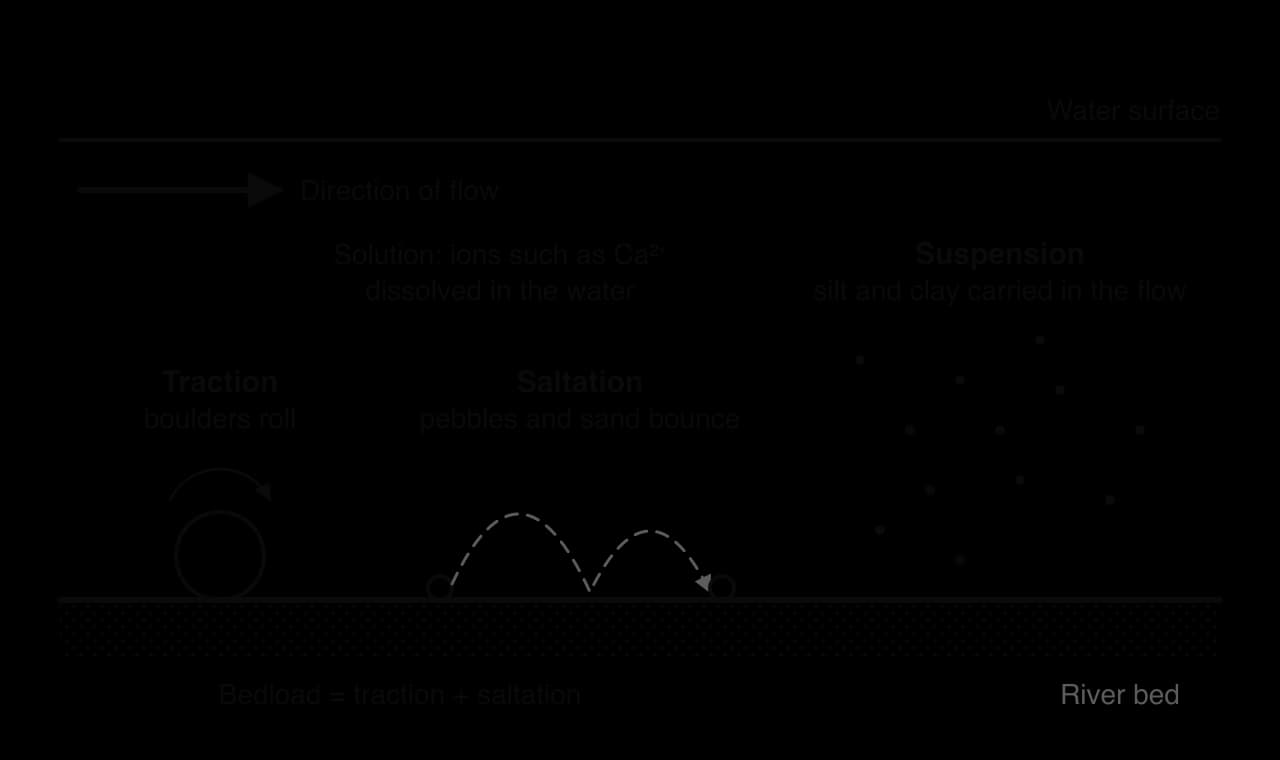
Traction and saltation make up the bedload, suspension the suspended load and solution the dissolved load. Large lowland rivers carry most of their load in suspension. The Huang He (Yellow River) in China crosses the Loess Plateau, whose fine windblown loess is easily eroded, and its sediment concentration has reached 920 kg per m³ of water.
Competence is the size of the largest particle a river can move at a given velocity; capacity is the total load it can carry. Both rise steeply with velocity and discharge, so a river in flood moves boulders that sit still for the rest of the year.
Deposition happens when a river no longer has the energy to carry its load: when velocity or discharge falls, on the inside of bends, where a river enters a lake or the sea, as floods recede, where the gradient flattens, or where load suddenly increases. In estuaries, fine clay particles clump together in salt water (flocculation) and sink. The largest particles settle first and the finest travel furthest, so river beds generally become finer downstream.
The Hjulström curve, drawn by the Swedish geographer Filip Hjulström in 1935 from laboratory experiments in a flume with beds of uniform particles, shows the velocities at which particles are eroded, transported and deposited. Both axes are logarithmic, so that clay and boulders fit on the same graph.
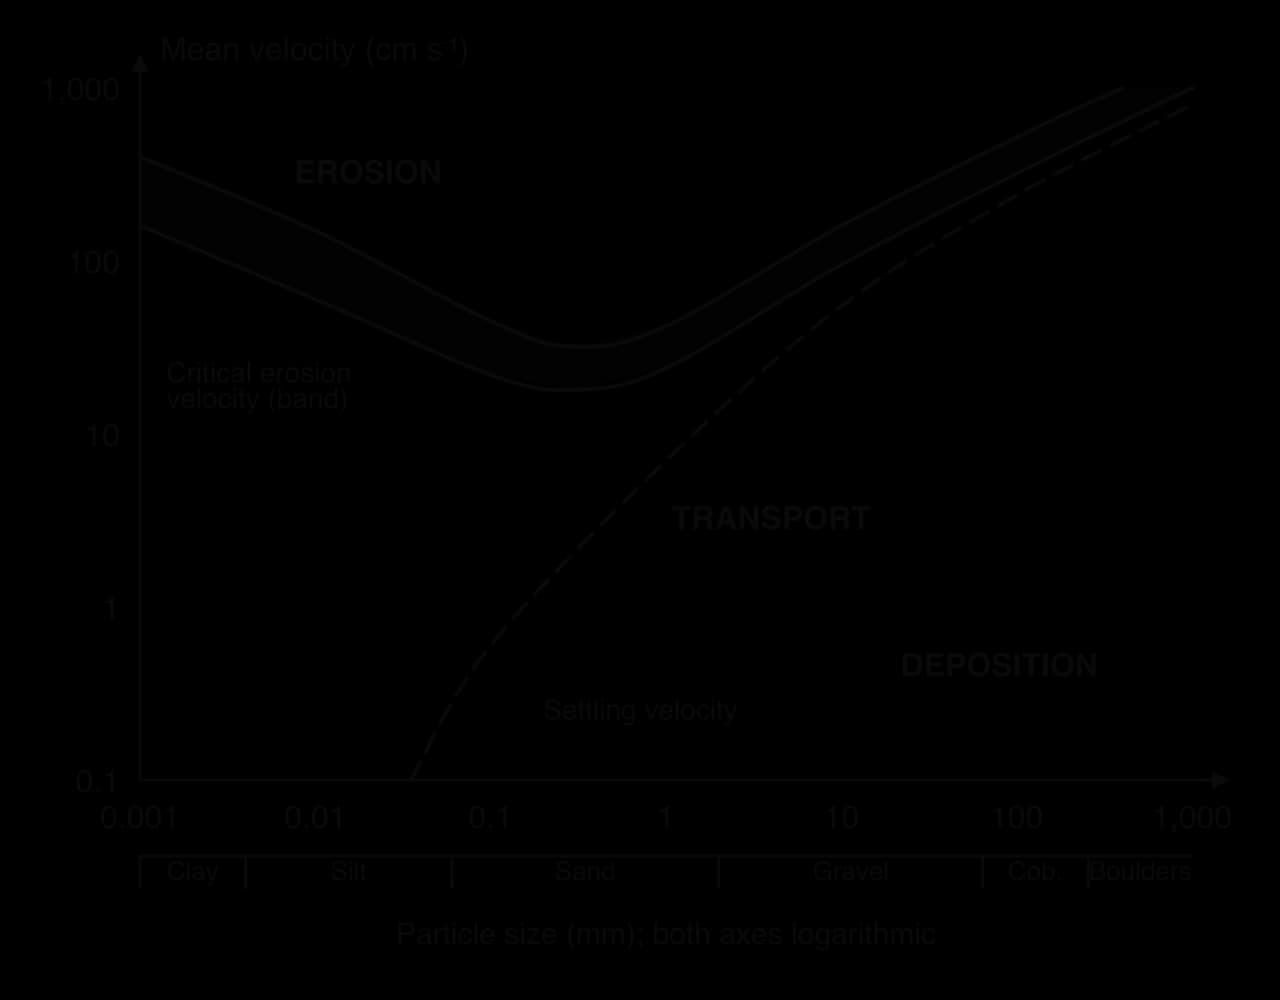
The upper band is the critical erosion velocity (entrainment velocity), drawn as a band because it depends on how tightly particles are packed. The lower line is the settling velocity (fall velocity). Above the band particles are eroded, between the lines they are transported, and below the lower line they are deposited.
Sand is the easiest material to erode: the lowest point of the band, roughly 20–40 cm s⁻¹, is in the sand range.
Larger particles need higher velocities, because they are heavier.
Fine clay and silt also need high velocities to be eroded. Clay is cohesive: electrical charges bind the particles into a smooth, compact bed that the flow cannot grip. A clay bank can resist velocities that would move gravel.
Once lifted, fine particles stay in suspension at very low velocities, so the gap between the lines is widest for clay and silt; they can travel hundreds of kilometres and settle only in still water.
For gravel and boulders the lines are close together, so these particles are deposited soon after velocity drops and move in short bursts during floods.
Strengths | Limitations |
|---|---|
Links particle size, velocity and process in one graph | Based on flume data for uniform particles; real beds are mixed and packed |
Explains why clays resist erosion and sand moves easily | Uses mean velocity, but velocity near the bed, where particles are lifted, is lower |
Helps engineers predict scour and sedimentation | Ignores particle shape and density, vegetation and the sediment already in the flow |
The curve is a general guide rather than a precise prediction: its value is in explaining the form of the relationship, especially the behaviour of fine sediment.
Gradient: steep slopes favour vertical erosion and transport of coarse load; gentle slopes favour deposition.
Geology: resistant rocks (granite, dolerite) erode slowly, weak rocks (shale, clay) quickly, and limestone is attacked by solution; alternating rocks create waterfalls and rapids.
Channel shape and hydraulic radius: efficient channels lose less energy to friction, leaving more for erosion and transport.
Load supply: coarse load allows abrasion; a river with little load, such as one below a dam, has energy to spare and often scours its bed.
Vegetation and structures: roots bind banks against lateral erosion; weirs, bridges, embankments and dams change velocity and sediment supply locally.
Discharge changes over hours, seasons and centuries. In one storm a river may erode on the rising flood and deposit as it falls. Seasonality is often the main control: monsoon rivers such as the Ganges move most of their annual load in a few months of very high discharge; alpine and Siberian rivers peak with spring snowmelt; dryland ephemeral channels flow only after rare storms, but those flows move large amounts of sediment in hours.
Glacier-fed and snow-fed rivers show the same pattern on a daily as well as a seasonal scale: discharge and sediment load are highest in the afternoon, after the day’s melting, and lowest before dawn.
Over decades, dams trap sediment, so rivers below them carry less load and erode their beds; climate change alters the timing of snowmelt and the intensity of rainfall; and deforestation can multiply the sediment washed from slopes.
A waterfall is a sudden vertical drop in a river’s course, most often where a band of resistant rock lies over less resistant rock.
The river flows over resistant rock onto less resistant rock, which is eroded faster by hydraulic action and abrasion, so a step forms.
Falling water and swirling boulders deepen the bed below into a plunge pool.
Spray and eddies undercut the less resistant rock beneath the resistant band, leaving an overhang.
The overhang collapses; the fallen blocks become tools for more abrasion in the plunge pool.
The cycle repeats, so the waterfall retreats upstream, leaving a steep-sided gorge of recession.
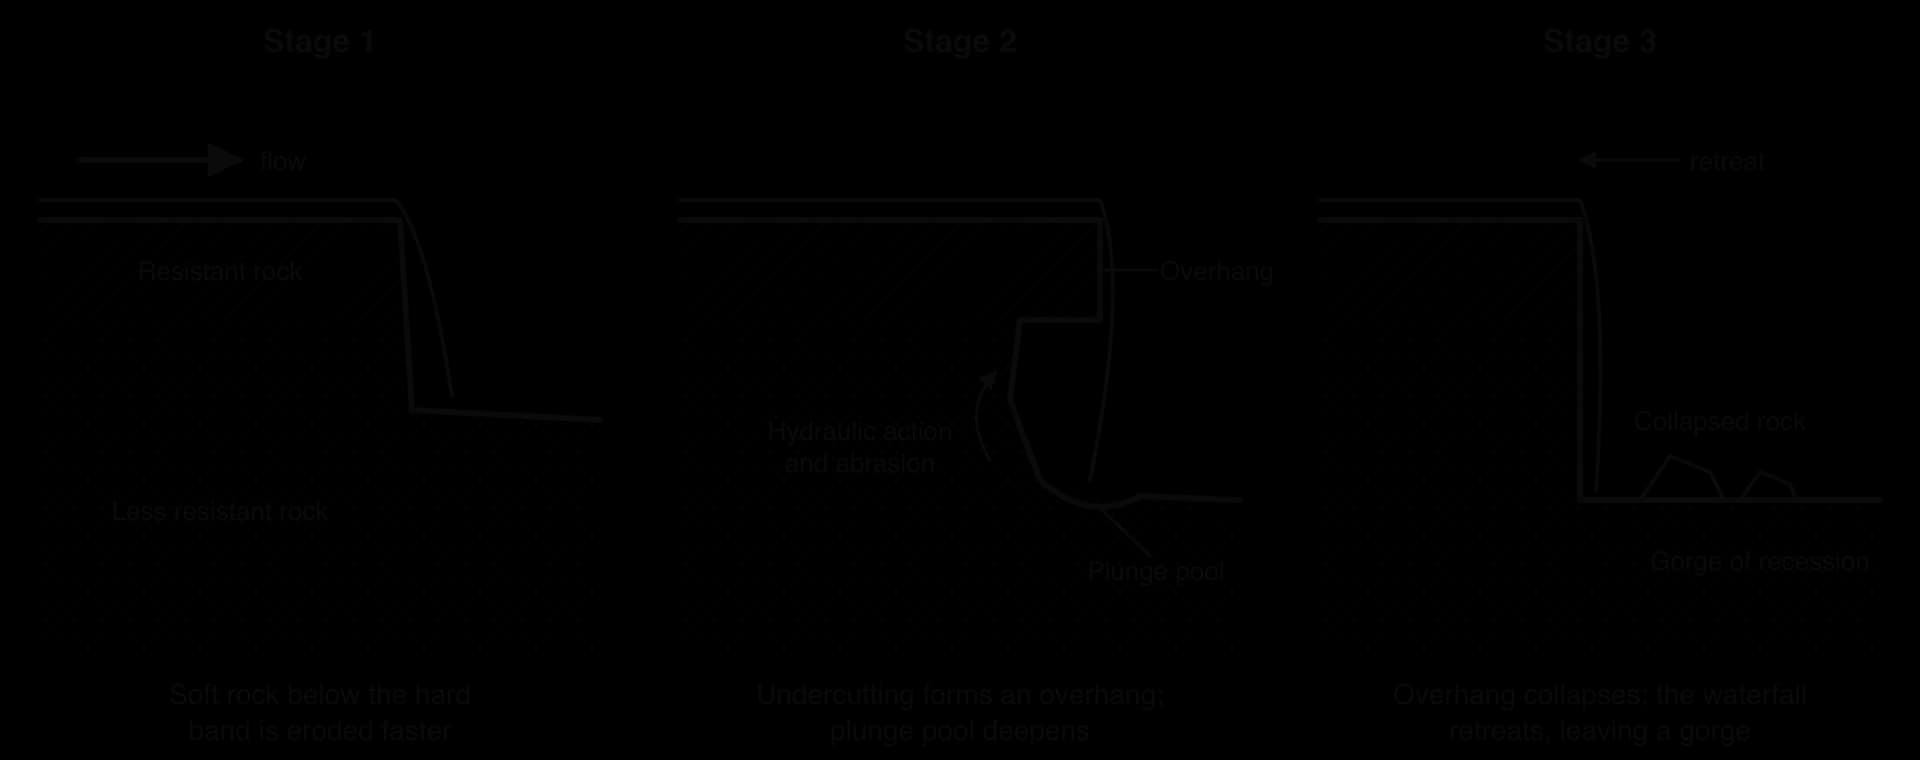
High Force on the River Tees in northern England drops about 21 m over the Whin Sill, a sheet of hard dolerite (whinstone) above softer Carboniferous limestone; its retreat has left a gorge about 700 m long. Niagara Falls, on the Canada–USA border, has a caprock of hard limestone and dolomite above weak shale. Over about 10,900 years it has retreated about 11 km upstream, and over at least the last 560 years the average rate was 1–1.5 m a year. Since 50–75% of the river’s flow has been diverted through tunnels for hydroelectric power, erosion has slowed to about 30 cm a year.
Waterfalls also form where a fall in sea level sends a knickpoint upstream (rejuvenation), below glacial hanging valleys and at fault scarps.
A meander is a sinuous bend in a river. Even a straight channel develops alternating shallow riffles and deep pools, about five to seven channel widths apart, which deflect the flow from bank to bank and start bends. Flow round a bend then takes a corkscrew path, helicoidal flow: surface water moves to the outer bank, sinks, and returns along the bed to the inner bank, carrying eroded sediment with it.
 YouTube
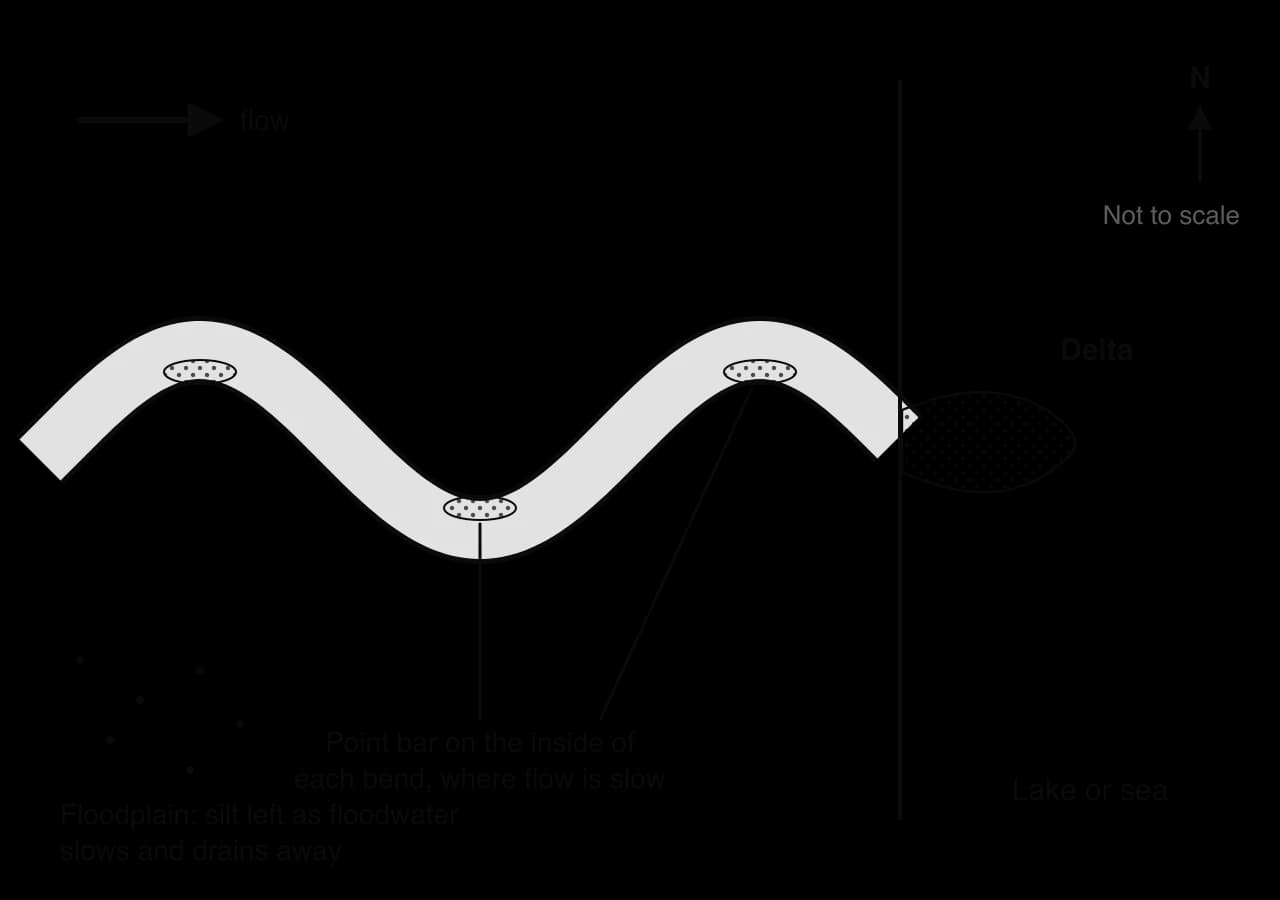
On the outside of a bend the water is deep and fast because the thalweg swings that way. Lateral erosion undercuts the bank, which collapses to form a steep river cliff (cut bank). On the inside the water is shallow and slow, and sediment builds a gently sloping point bar. The cross-section is asymmetric: deep beside the river cliff, shallow over the point bar.
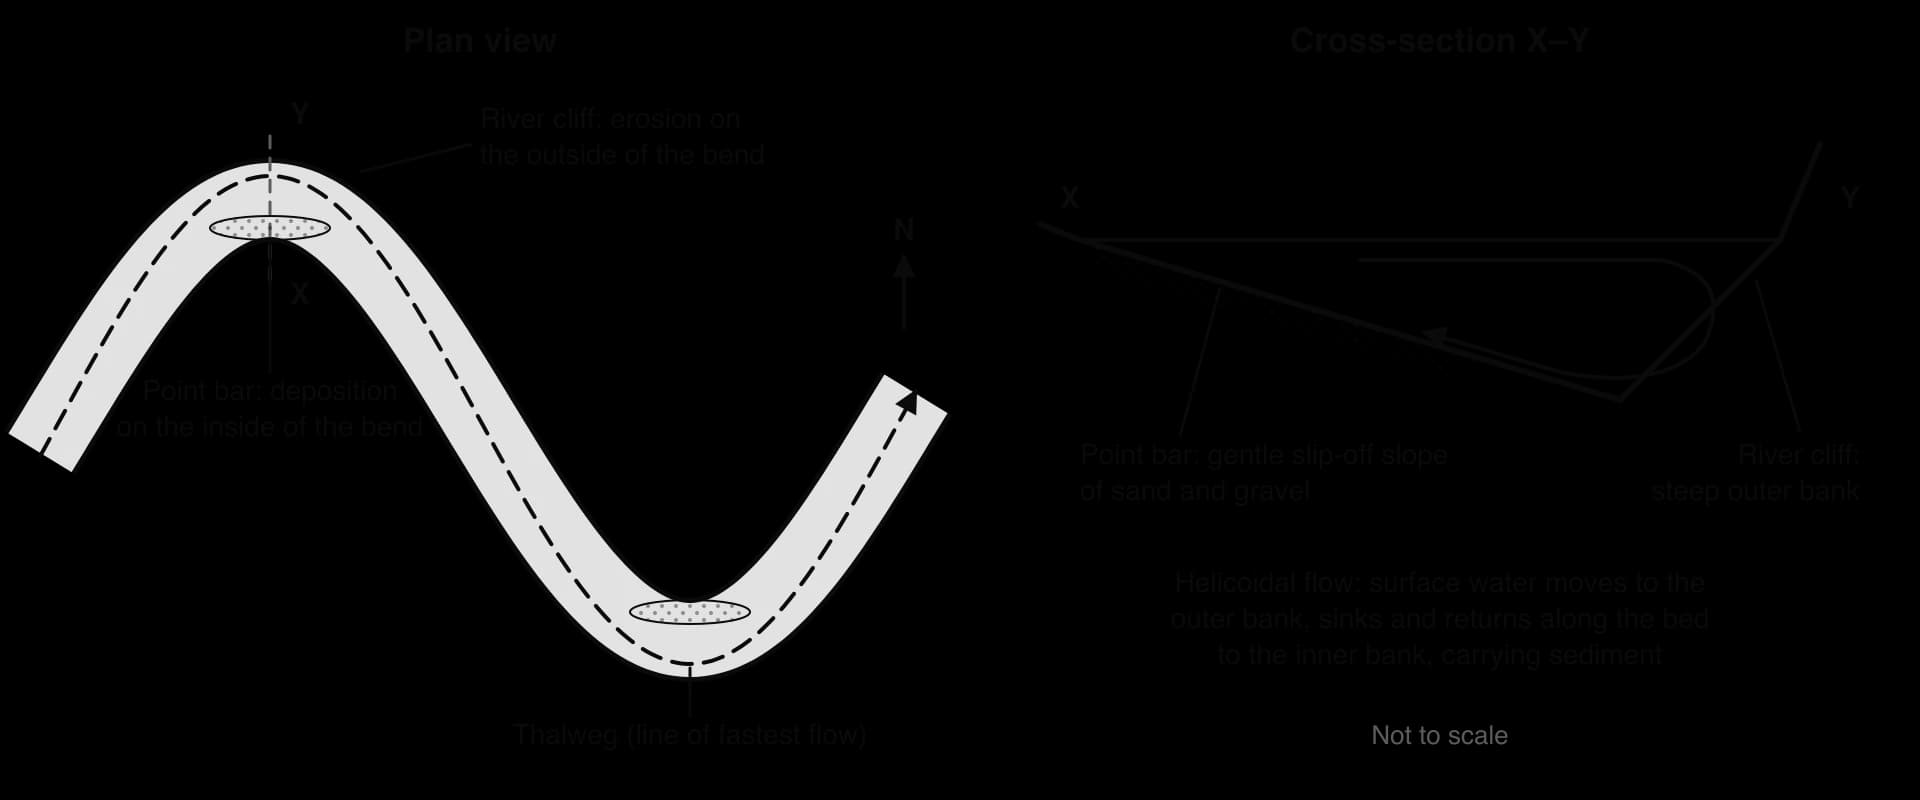
Because erosion is greatest on the outer bank, slightly downstream of each bend’s apex, meanders migrate sideways and downstream, becoming more pronounced while the meander neck between two bends narrows.
Erosion on the outer banks of two neighbouring bends narrows the meander neck.
The neck becomes very narrow.
In a flood, the river cuts through the neck and follows the shorter, steeper course.
Deposition seals the ends of the abandoned loop, leaving an ox-bow lake, which gradually fills to become a marshy meander scar.
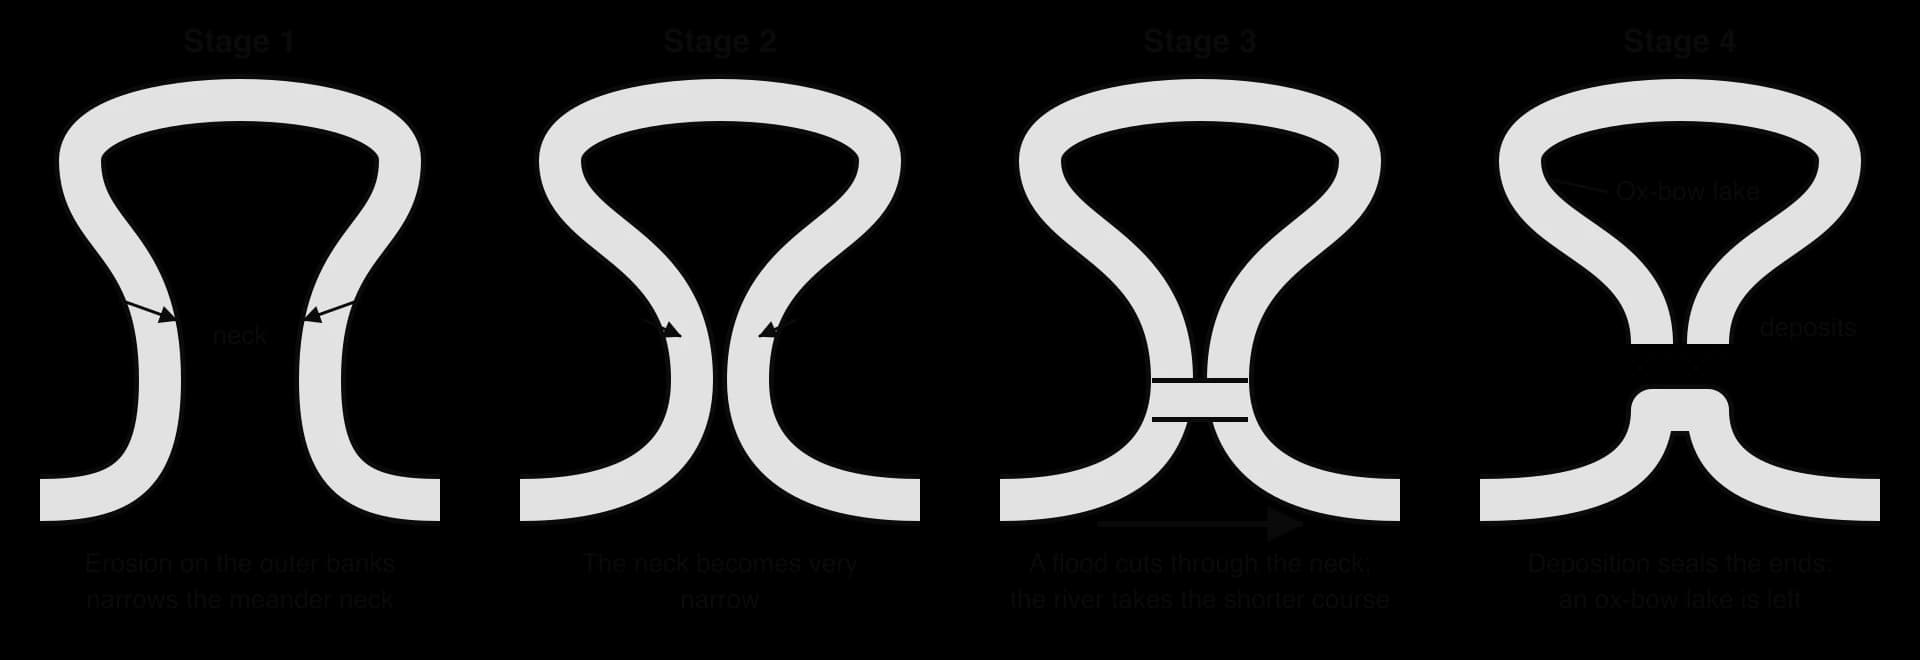
Satellite images of the Ucayali River, an Amazon headwater in Peru, show bends migrating and being cut off within a few decades.
Sinuosity is the channel length between two points divided by the straight-line distance between them. A straight channel scores 1; above about 1.5 a river is usually called meandering.
Not every river meanders. Where the load is large and coarse and discharge varies greatly, as below glaciers, the channel splits into many threads around gravel bars, forming a braided channel, such as the Brahmaputra in Bangladesh.
A floodplain is the wide, flat valley floor beside a river that is covered by water in floods. It forms in two ways at once: migrating meanders erode the valley sides laterally and leave point-bar deposits behind, and floodwater spreading over the land slows and deposits silt, building the floodplain upwards. River-deposited sediment is alluvium.
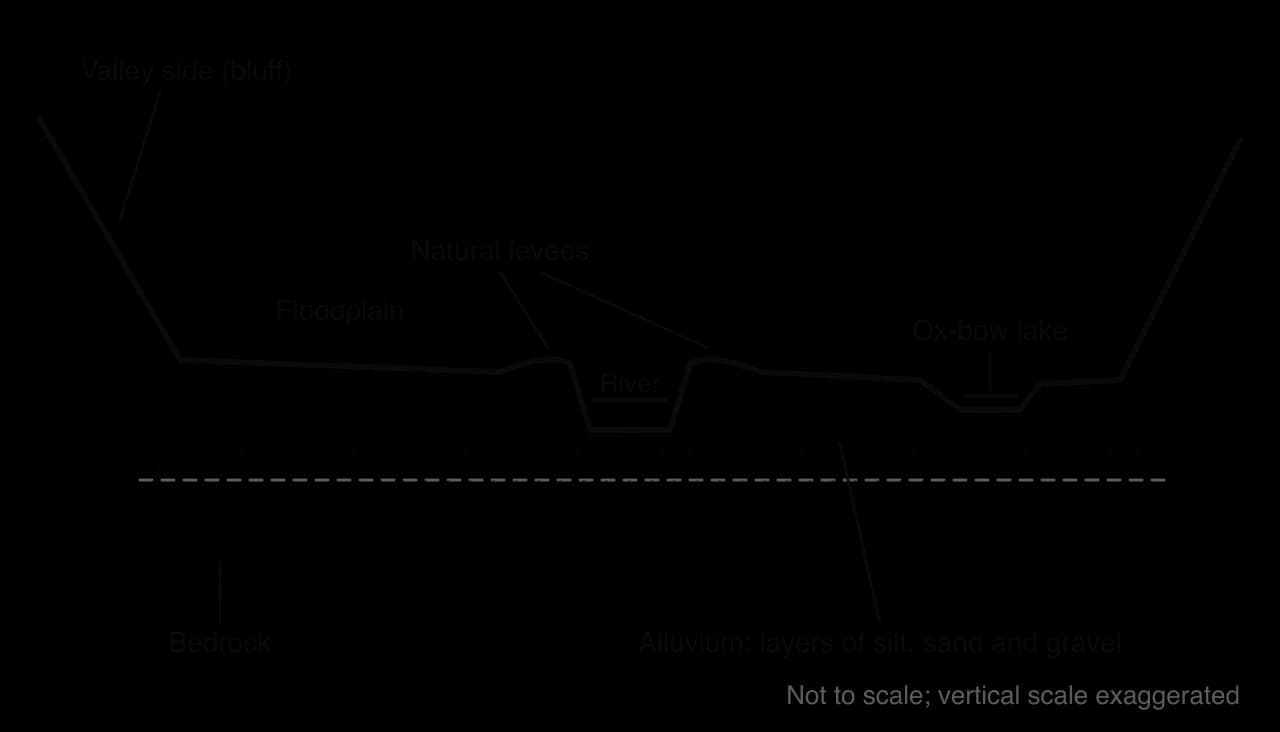
Fertile alluvium and flat land have drawn dense populations to floodplains, from the Nile valley to the Ganges plain.
A levee is a raised bank along a channel. Natural levees form during floods:
When the river overflows, the water on the floodplain is much shallower, so friction increases and velocity falls sharply.
The coarsest load is deposited first, at the channel edge; finer silt and clay settle further away.
Over many floods the coarse deposits build up into raised banks.
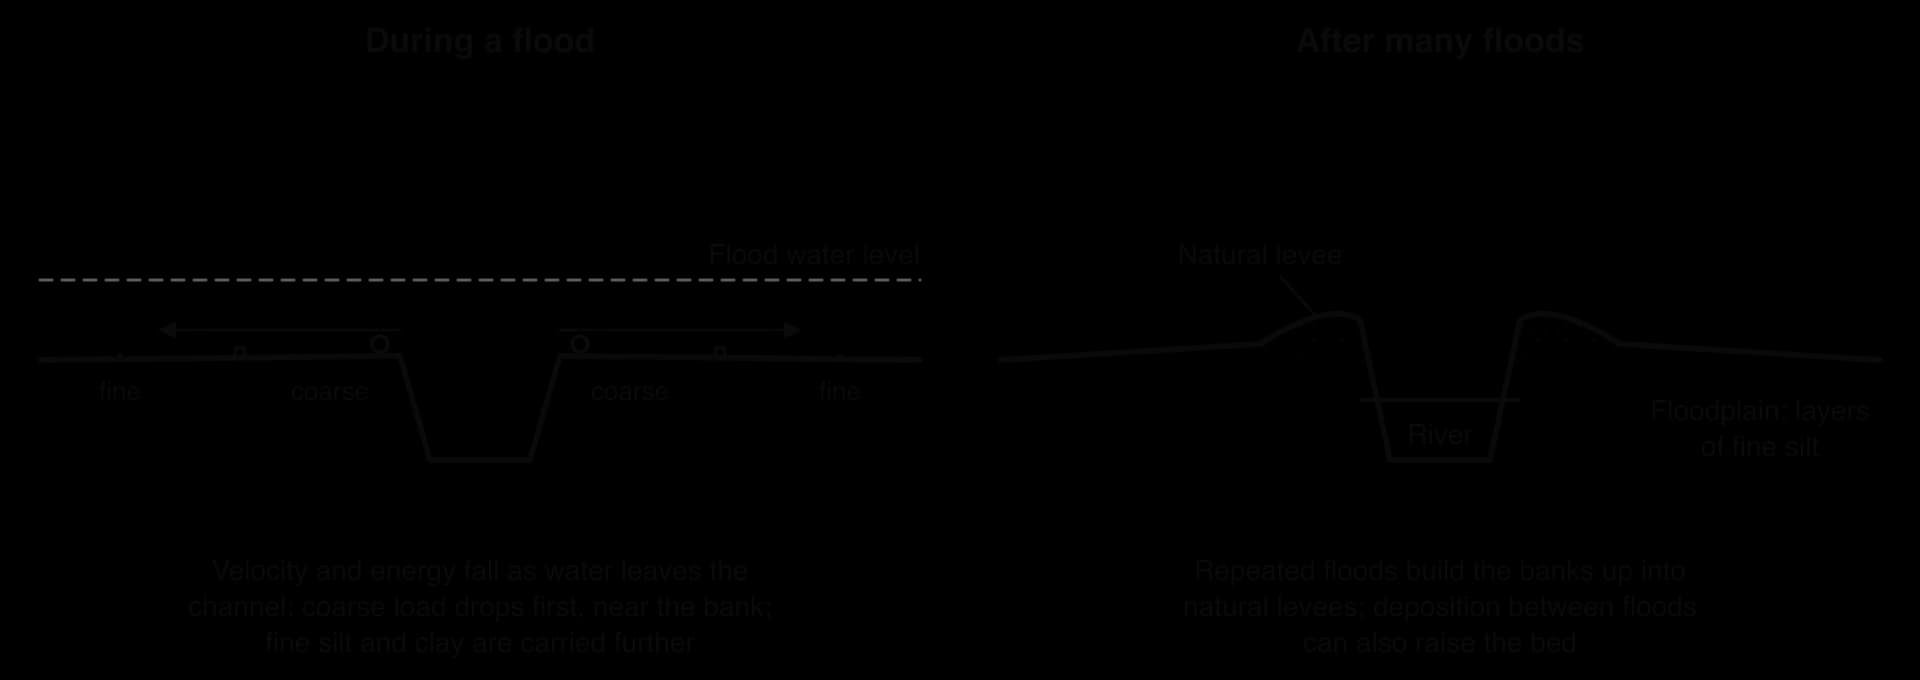
A river with a heavy load may also deposit on its own bed between floods, so that with growing levees it flows above its floodplain. On the lower Huang He the bed at Kaifeng is about 10 m above the surrounding land, a “suspended river”: if it breaks its levees, the water spreads far across the lower land and does not drain back.
A delta is a landform of sediment built where a river enters a sea or lake faster than waves, tides and currents can remove it. Deltas are favoured by a large suspended load, a sharp drop in velocity at the coast, a small tidal range and weak waves, flocculation in salt water and a shallow sea floor. Where tides and waves remove the sediment, the mouth becomes a funnel-shaped estuary instead, as on the Thames in England and the Río de la Plata.
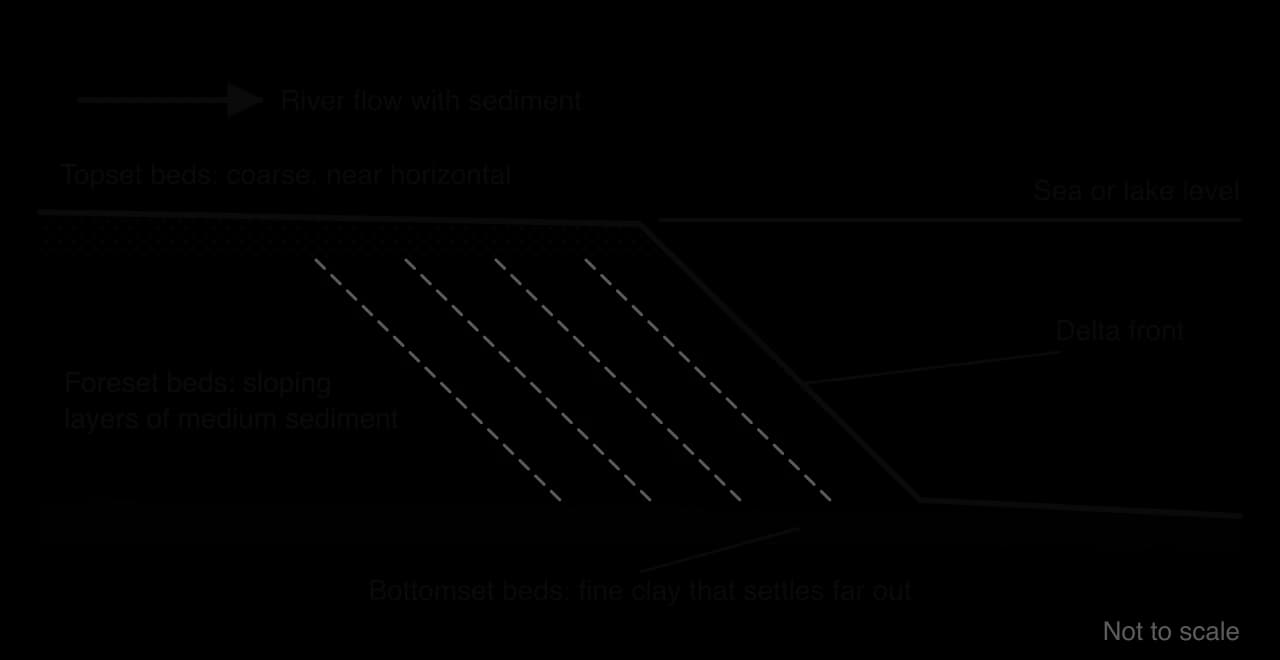
A delta builds in three layers. Coarse topset beds lie almost flat on its surface; foreset beds of medium material build out at an angle on its front, so it advances seaward; fine bottomset beds settle on the sea floor beyond. On the surface the river divides into distributaries.
Type | Shape and cause | Example |
|---|---|---|
Arcuate | Fan-shaped with a curved front and many distributaries; waves smooth the front | The Nile, Egypt |
Bird’s-foot | Long fingers along each distributary, where sediment supply overwhelms weak waves and tides | The Mississippi, USA |
Cuspate | Pointed; waves from both sides push sediment back around one main channel | The Tiber, Italy |

Flat, fertile and well watered, deltas are among the most densely populated places on Earth. The Ganges–Brahmaputra–Meghna delta, the world’s largest, holds the Sundarbans, the largest mangrove forest at about 10,277 km². Many deltas are now sinking or shrinking, because dams trap the sediment that built them, groundwater and gas extraction cause land subsidence, and sea level is rising.
Course | Dominant processes | Typical landforms |
|---|---|---|
Upper | Vertical erosion by abrasion and hydraulic action; coarse load moved by traction and saltation | V-shaped valleys, interlocking spurs, rapids, waterfalls, gorges, potholes |
Middle | Lateral erosion on outer bends, deposition on inner bends; more suspension | Meanders, river cliffs, point bars, a widening floodplain |
Lower | Deposition dominates; load mostly in suspension and solution | Wide floodplain, levees, ox-bow lakes, meander scars, deltas or estuaries |
The sequence is a generalisation: many rivers have waterfalls far downstream, or floodplains in upland basins.
The Mississippi is the largest river system in North America. Its main stem flows about 3,766 km south from Lake Itasca in Minnesota to the Gulf of Mexico, and its drainage basin, about 2.98 million km², covers nearly 40% of the land area of the contiguous United States, from the Rocky Mountains in the west to the Appalachians in the east. Major tributaries, the Missouri, Ohio, Arkansas and Red rivers, bring water from very different climates: snowmelt from the northern Rockies and Great Plains, and heavy rain from the humid south-east. Between 1980 and 2021 the river delivered an average of about 21,300 m³ s⁻¹ to its delta.
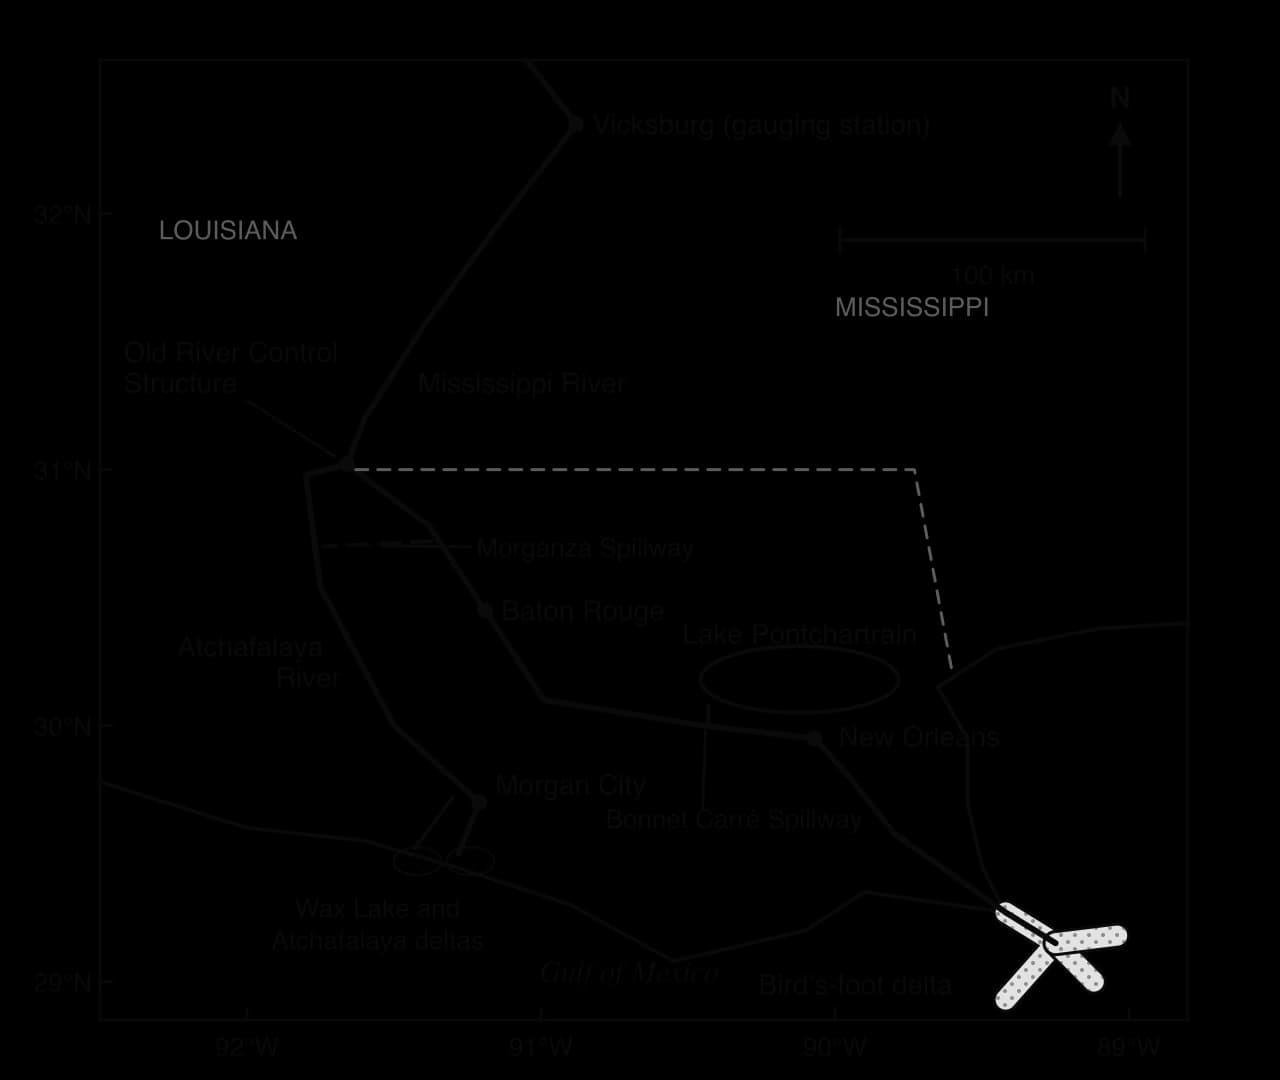
Below its confluence with the Ohio, the lower Mississippi crosses a wide alluvial floodplain with meanders, ox-bow lakes and broad natural levees, ends in a bird’s-foot delta, and would by now have shifted most of its flow to a new course without engineering. It shows drainage basin processes at the largest scale, and how people have reshaped them.
The US Geological Survey has recorded the river’s flow at Vicksburg, Mississippi, for more than a century. Annual peak discharge there usually reaches 30,000–50,000 m³ s⁻¹ in spring, when snowmelt from the north and rainfall from the Ohio basin combine. The highest peak in the record, about 65,400 m³ s⁻¹ in May 2011, was 65% above the 1990–2024 average peak. The great flood of 1927 reached about 64,600 m³ s⁻¹ at the same gauge.
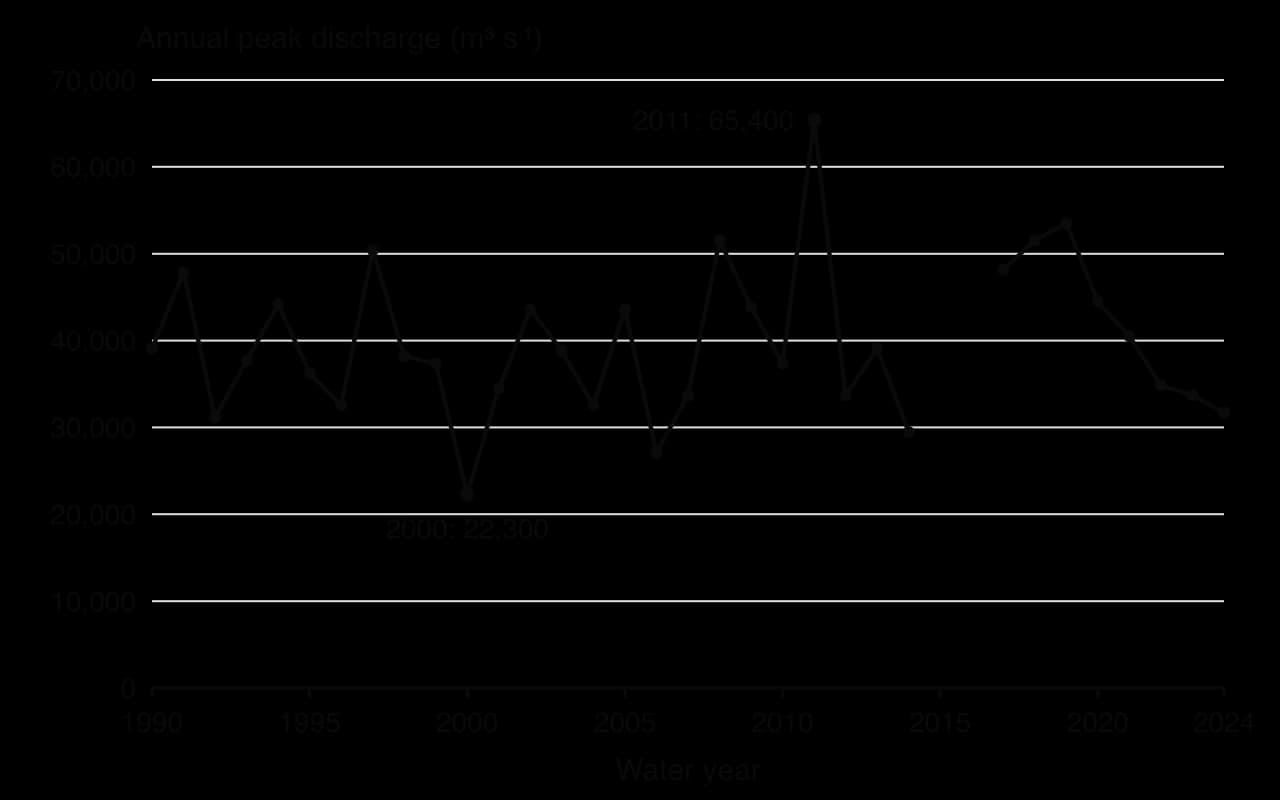
A peak at Vicksburg depends on whether floods from several tributaries coincide: in 2011 heavy April rain over the Ohio valley combined with snowmelt from the upper basin, while in 2000, a dry year, the peak was about a third as large.
Before 1900, the Mississippi carried an estimated 400 million tonnes of sediment a year to the Gulf, mostly fine silt and clay in suspension. Over the last two decades the load has averaged about 145 million tonnes a year, a fall of nearly two-thirds. The causes are human: large dams on the Missouri and other tributaries trap sediment in their reservoirs; engineers cut through meander necks and shortened the river; and concrete mats called revetments now line many banks, preventing the river from eroding sediment from them.
A delta survives only while new sediment arrives. Deltaic sediments compact and sink naturally, and floods used to spread fresh silt over the wetlands; now levees carry the river and its load straight to the edge of the continental shelf. Canals dug for oil and gas let salt water into freshwater marshes, extraction adds to subsidence, sea level is rising and hurricanes erode the weakened marsh.
The result is one of the fastest rates of land loss in the world. Between 1932 and 2016, coastal Louisiana lost about 4,833 km² of land, about 25% of its 1932 area. At the fastest rate, in the 1970s, the coast lost land equal to an American football field every 34 minutes; by the 2010s the rate had slowed to about one every 100 minutes.
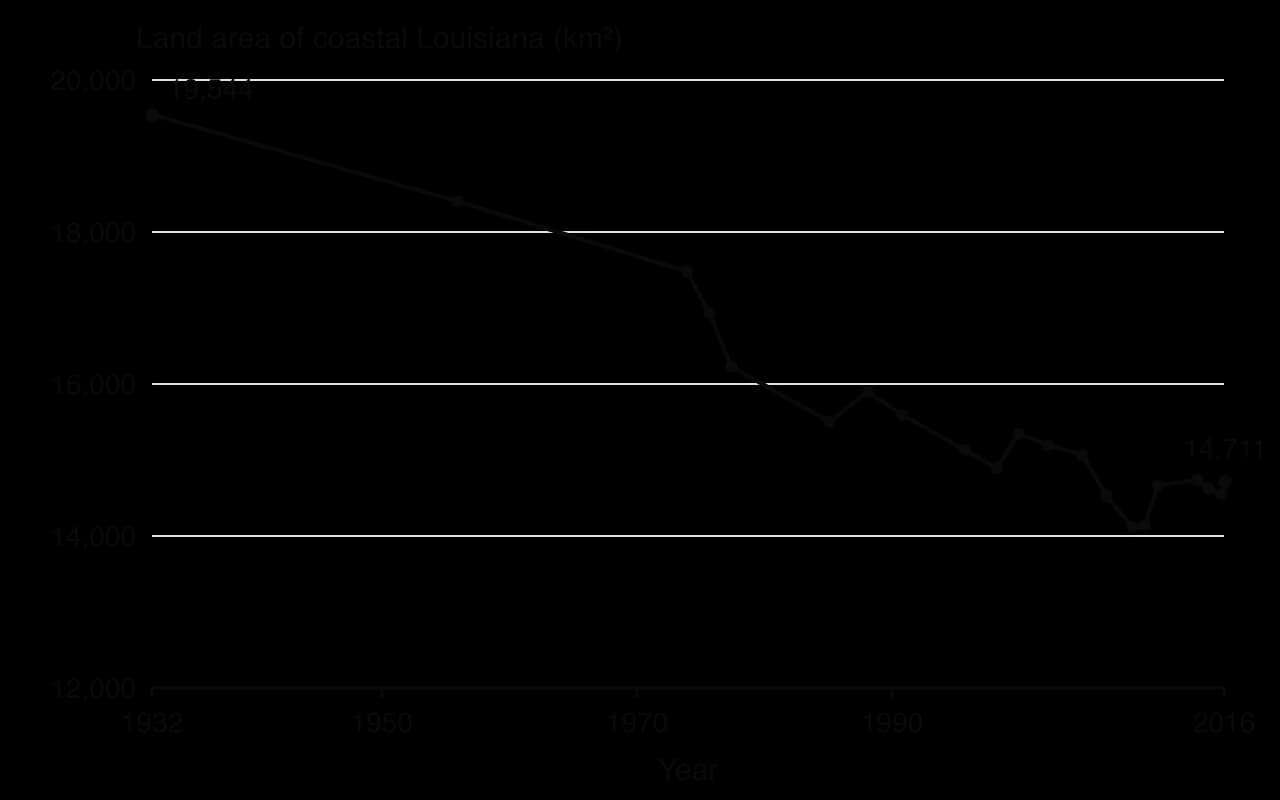
Hydrologic basin | Land area 1932 (km²) | Land area 2016 (km²) | Change |
|---|---|---|---|
Mississippi River Delta (bird’s-foot) | 679 | 304 | −55% |
Barataria | 3,833 | 2,713 | −29% |
Terrebonne | 4,472 | 3,170 | −29% |
Atchafalaya Delta | 551 | 567 | +3% |
Coastal Louisiana (all basins) | 19,544 | 14,711 | −25% |
The table shows the clearest evidence that sediment supply controls the fate of a delta. The bird’s-foot delta, where levees carry sediment out into deep water, lost more than half of its land. The Atchafalaya delta, where the river still spreads out and deposits its load in a shallow bay, gained land. Since 1942, part of the Atchafalaya’s flow has also been sent through the Wax Lake Outlet, where a new delta has grown.
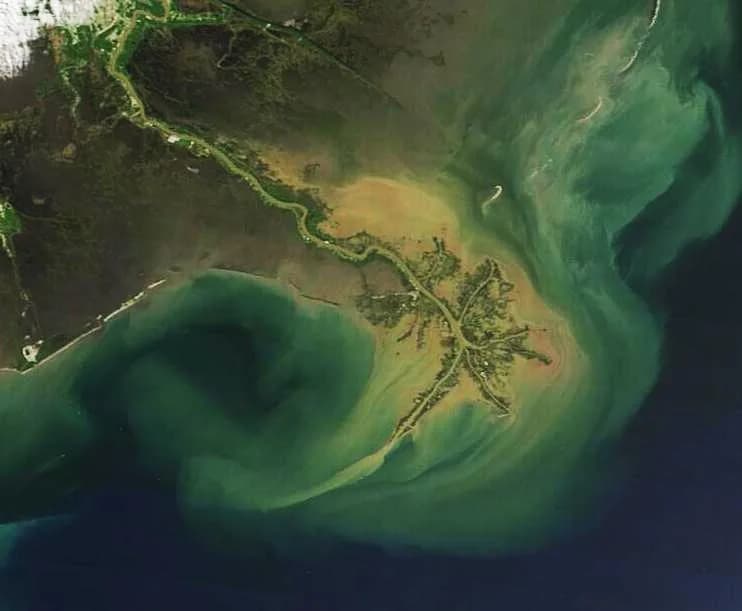
Over thousands of years the Mississippi has repeatedly switched course, abandoning old delta lobes and building new ones. The Atchafalaya offers a much shorter and steeper route to the sea than the present channel past Baton Rouge and New Orleans, and in 1953 the US Army Corps of Engineers concluded that it could capture the Mississippi’s main flow by about 1990, leaving the ports and industries of Baton Rouge and New Orleans beside a much smaller channel.
To prevent this, the Corps completed the Old River Control Structure in 1963. Its gates hold the split of the combined flow of the Mississippi and Red rivers at about 70% down the Mississippi and 30% down the Atchafalaya, the proportion when the structure was built. The 1973 flood almost destroyed the structure, and an auxiliary structure was added in 1986 to reduce the pressure on the original gates. Without the structure, most of the flow would be expected to follow the Atchafalaya to the sea.
Group | Interest in the river | How the system affects them |
|---|---|---|
Cities and ports (New Orleans, Baton Rouge) | A navigable channel and protection from floods | Depend on the Old River Control Structure and levees to keep the river in its present course |
US Army Corps of Engineers and the federal government | Flood control and navigation across the basin | Hold the decisions that shape flows and sediment over thousands of kilometres |
Coastal communities, including Indigenous and fishing communities | Land, fisheries and a way of life in the wetlands | Lose land and protection from storm surges as the delta shrinks |
The oil and gas industry | Access to offshore and wetland resources | Canals and extraction have contributed to land loss |
Farmers in the upper basin | Water and fertile land | Fertiliser and soil from their fields travel to the Gulf |
The case shows power at work over a whole basin. Decisions taken by federal engineers to protect cities and keep a shipping route open have changed the sediment budget of the entire coast, and the costs fall on coastal communities that had little say in them.
It shows process at continental scale, since the transport and deposition that build a point bar in a small stream build and destroy whole deltas here; change, since land loss has slowed since the 1970s; and possibility, in the debate over proposals to divert sediment-laden water back into the wetlands, which would work with natural processes but at a cost to fisheries and budgets.
Why does the Atchafalaya delta gain land while the bird’s-foot delta loses it, even though both are fed by the same river system?
To what extent is land loss in coastal Louisiana caused by processes inside the drainage basin rather than at the coast?
Who benefits from holding the Mississippi in its present course, and who bears the costs?
Sources: USGS National Water Information System, peak streamflow at Vicksburg (site 07289000), accessed 2026; Couvillion, B.R. et al., Land Area Change in Coastal Louisiana (1932 to 2016), USGS Scientific Investigations Map 3381, 2017; US Army Corps of Engineers via Wikipedia, “Old River Control Structure” and “Mississippi River”, accessed 2026.
In Paper 1 each option has a 10-mark structured question on a stimulus and a choice of two 10-mark extended questions, often on the formation of a landform or the explanation of a process.
The table shows fieldwork measurements at three sites along a stream on the same day (hypothetical data).
Site | Distance from source (km) | Cross-sectional area (m²) | Wetted perimeter (m) | Mean velocity (m s⁻¹) | Discharge (m³ s⁻¹) |
|---|---|---|---|---|---|
A | 1.2 | 0.48 | 2.9 | 0.31 | 0.15 |
B | 4.6 | 1.35 | 4.5 | 0.42 | 0.57 |
C | 9.8 | 3.10 | 6.2 | 0.55 | 1.71 |
The global hydrological cycle is closed; a drainage basin is an open system with precipitation as input, evapotranspiration and discharge as outputs, and stores linked by flows.
Rainfall intensity, infiltration capacity and antecedent wetness decide whether water reaches the river fast by overland flow or slowly by throughflow and groundwater flow.
The water balance (P = Q + E ± ΔS) and the soil moisture budget explain seasonal river flow.
Discharge = cross-sectional area × mean velocity; a higher hydraulic radius and smoother bed mean less friction and faster flow.
The Bradshaw model summarises downstream trends, but geology, tributaries and people break the pattern.
Rivers erode by hydraulic action, abrasion, attrition and solution, transport by traction, saltation, suspension and solution, and deposit when velocity falls.
The Hjulström curve shows that sand erodes most easily, while cohesive clay needs high velocities to erode but settles only in still water.
Waterfalls, meanders, ox-bow lakes, floodplains, levees and deltas form through sequences of erosion and deposition that change along the long profile.
The lower Mississippi shows how dams, levees and control structures cut sediment supply and contributed to the loss of about 25% of coastal Louisiana’s land between 1932 and 2016.
I can describe the drainage basin as an open system and explain how it differs from the global hydrological cycle.
I can explain the difference between infiltration-excess and saturation-excess overland flow.
I can use the water balance equation and read the stages of a soil moisture budget.
I can determine discharge, wetted perimeter and hydraulic radius from field measurements, with units.
I can evaluate the Bradshaw model using fieldwork data and named rivers.
I can explain the four erosion and four transport processes and read values from the Hjulström curve.
I can examine how gradient, geology, load, seasonality and human structures change river processes.
I can draw and explain annotated formation sequences for a waterfall, a meander, an ox-bow lake, a levee and a delta, each with a located example.
Antecedent conditions link the two: the same input produces very different channel flows depending on how full the stores already are.
Cryosphere stores in glacier-fed basins (eg the upper Indus or Ganges) delay the arrival of winter precipitation in the channel by months or longer.
Good answers may be well structured (AO4) and may additionally offer a critical evaluation (AO3) which recognizes that inputs and stores interact, so their relative importance depends on the event and the place. In a short, intense storm the input may dominate; over a season or a year the size of the stores (soil depth, aquifer storage, snowpack) may matter more. Another approach might be to contrast basins in different climates or geologies (eg an arid basin with little vegetation and a humid basin with deep soils and permeable rock), or to argue that human changes to stores (deforestation, urbanization) can change their importance over time. Diagrams of the drainage basin system may be credited.
For 5–6 marks, expect some weakly-evidenced outlining of how inputs and/or stores affect the amount of water reaching the channel.
For 7–8 marks, expect a structured account which includes:
either well-evidenced explanation of the role of both inputs and stores
or a discursive conclusion (or ongoing evaluation) grounded in geographical concepts and/or perspectives, such as how relative importance varies with places or timescales.
For 9–10 marks, expect both of these traits.
NB. Maximum [6] if only inputs or only stores are considered.
Marks | Level descriptor |
|---|---|
0 | The response does not reach a standard described by the descriptors below. |
1–2 | Too brief, lists unconnected information, not focused on the question and lacks structure. Knowledge is very general, with large gaps or errors; examples or case studies are missing or only listed. No analysis; terminology is missing or used incorrectly. |
3–4 | Too general, lacks detail, not focused on the question and largely unstructured. Outlines examples, statistics and facts, both relevant and irrelevant, with links to the question only listed. Basic terminology is used, with errors or inconsistently. No critical evaluation of evidence; any conclusion is irrelevant. |
5–6 | Partially addresses the question, with a narrow argument, an unsubstantiated conclusion and limited evaluation. Describes relevant supporting evidence (examples, case studies) and outlines links to the question. The argument repeats one point or covers only part of the question. Other perspectives, or strengths and weaknesses of evidence, are listed. |
7–8 | Addresses the whole question; the analysis is evaluated and the conclusion is relevant but lacks balance. Relevant evidence is described correctly and covers all the main points. The argument is clear but one-sided or unbalanced. Complex terminology is used correctly but not consistently. Other perspectives, or strengths and weaknesses of evidence, are described. |
9–10 | In-depth and specific to the question (topic and command term). Correct, relevant examples, statistics and detail are integrated and their link to the question explained. The argument is balanced, explaining complexity, exceptions and comparisons. Evaluation of evidence and perspectives is well developed, and the conclusion is balanced and aligned with the evidence. Logically structured and easy to follow. |
Examine the role of the cryosphere as a store in the drainage basin systems of different places.
10 marks
Examine how the type and intensity of precipitation can influence the flows of water through a drainage basin.
10 marks