Interpret storm hydrographs and river regimes, explain how natural factors and human activity change flood risk, assess flood prediction, and evaluate structural and planning mitigation in the Netherlands and Pakistan.
Each is in the Geography glossary, with every other term in the subject.
The planting of trees on land that was not recently forested; replanting land that was recently cleared is reforestation.
The amount of water already held in the soil and stores of a drainage basin before a rainfall event, which strongly affects how much of the rain becomes overland flow.
A raised embankment of earth, concrete or stone built along a river bank to increase the capacity of the channel and keep floodwater off the land behind it; called a dyke in the Netherlands.
The discharge at which a river fills its channel completely, just before it overflows onto the floodplain.
The modification of a river channel by straightening, deepening, widening or lining it, usually to carry floodwater away more quickly; also called channel modification.
A computer simulation of the climate system, based on the physics of the atmosphere, oceans, land and ice, used to project future climate under different scenarios of greenhouse gas emissions.
The permanent clearance of forest and its replacement by another land use, such as farming, grazing, mining or settlement.
The removal of sediment from the bed of a river, harbour or channel to make it deeper, increasing its capacity or allowing ships to pass.
Describe the characteristics of a storm hydrograph, including lag time, peak discharge, base flow and quickflow.
Explain how basin size and shape, relief, drainage density, geology, soils, vegetation, antecedent moisture and seasonality influence the shape of a hydrograph.
Distinguish between simple and complex river regimes using annual hydrographs.
Explain how urbanisation, deforestation and channel modification change the distribution, frequency and magnitude of floods.
Construct a flood frequency curve and estimate the recurrence interval of a flood.
Examine how flood prediction has improved, and why uncertainty remains in weather forecasts and climate models.
Evaluate structural measures and planning measures for flood mitigation.
Compare flood mitigation in two contrasting drainage basins: the Rhine and Meuse in the Netherlands and the Indus in Pakistan.
Floods are the most frequent natural hazard and affect more people each year than any other. A river floods when more water reaches it than its channel can carry, and how often that happens, and how much harm it does, depends on the drainage basin, the weather and the decisions people make about land, rivers and warnings.
The topic brings together process, because the shape of a flood is set by how water moves through the basin; place, because the same rainfall has different effects in a steep, urbanised valley and on a wide forested plain; and possibility, because forecasting, engineering and planning give communities choices about how to live with floods. Power matters too: who pays for defences, who is protected and who bears the risk.
63 exam-style questions on this subtopic, written in the style of the IB papers. The first has its markscheme open. Counted on
Examine the relative importance of overland flow and base flow in supplying river discharge at different times of the year.
10 marks
Marks should be allocated according to the markbands.
Overland flow (surface runoff) is water moving over the ground surface to the channel, either because rainfall intensity exceeds infiltration capacity or because the soil is saturated. Base flow is the slow contribution from groundwater (and, in some definitions, deep throughflow) that sustains river discharge between rainfall events. River discharge (m³/s) is fed by these flows and by throughflow and direct channel precipitation. The question requires a temporal dimension: how the balance of contributions changes over the year.
Possible applied themes (AO2) demonstrating knowledge and understanding (AO1):
In wet seasons and storm events, overland flow dominates peak discharge, producing the rising limb and peak of a storm hydrograph.
In dry seasons, base flow from aquifers may provide almost all river discharge; without it, rivers would cease to flow.
Geology controls the balance: rivers on permeable chalk (eg the Test and Itchen in southern England) are dominated by base flow all year, while rivers on impermeable rocks (eg granite in Dartmoor) respond quickly through overland flow and throughflow.
In monsoon climates (eg rivers of South Asia or the Mekong) overland flow is dominant in the wet season, while groundwater sustains much lower flows in the dry season.
In seasonally frozen basins, spring snowmelt over frozen ground produces a pulse of overland flow; in winter, base flow may be the only flow under the ice.
In arid areas, ephemeral rivers (wadis) flow only after intense rain and depend on overland flow; there may be no base flow as the water table lies below the channel.
With a free account, Augment remembers where you stopped and what you have practiced.
A system that detects or forecasts a hazard and sends timely, understandable warnings to people at risk so that they can act to protect themselves and their property.
A set of forecasts made by running a weather or flood model many times with slightly different starting conditions, so that the spread of results shows the probability of each outcome.
A river that flows only for short periods after rainfall and is dry for most of the year, common in arid regions; an intermittent river flows seasonally.
The part of a storm hydrograph after the peak that shows discharge decreasing as the basin drains; also called the recession limb.
A flood that rises within minutes or a few hours of intense rainfall, usually in a small, steep or urban drainage basin, giving very little warning.
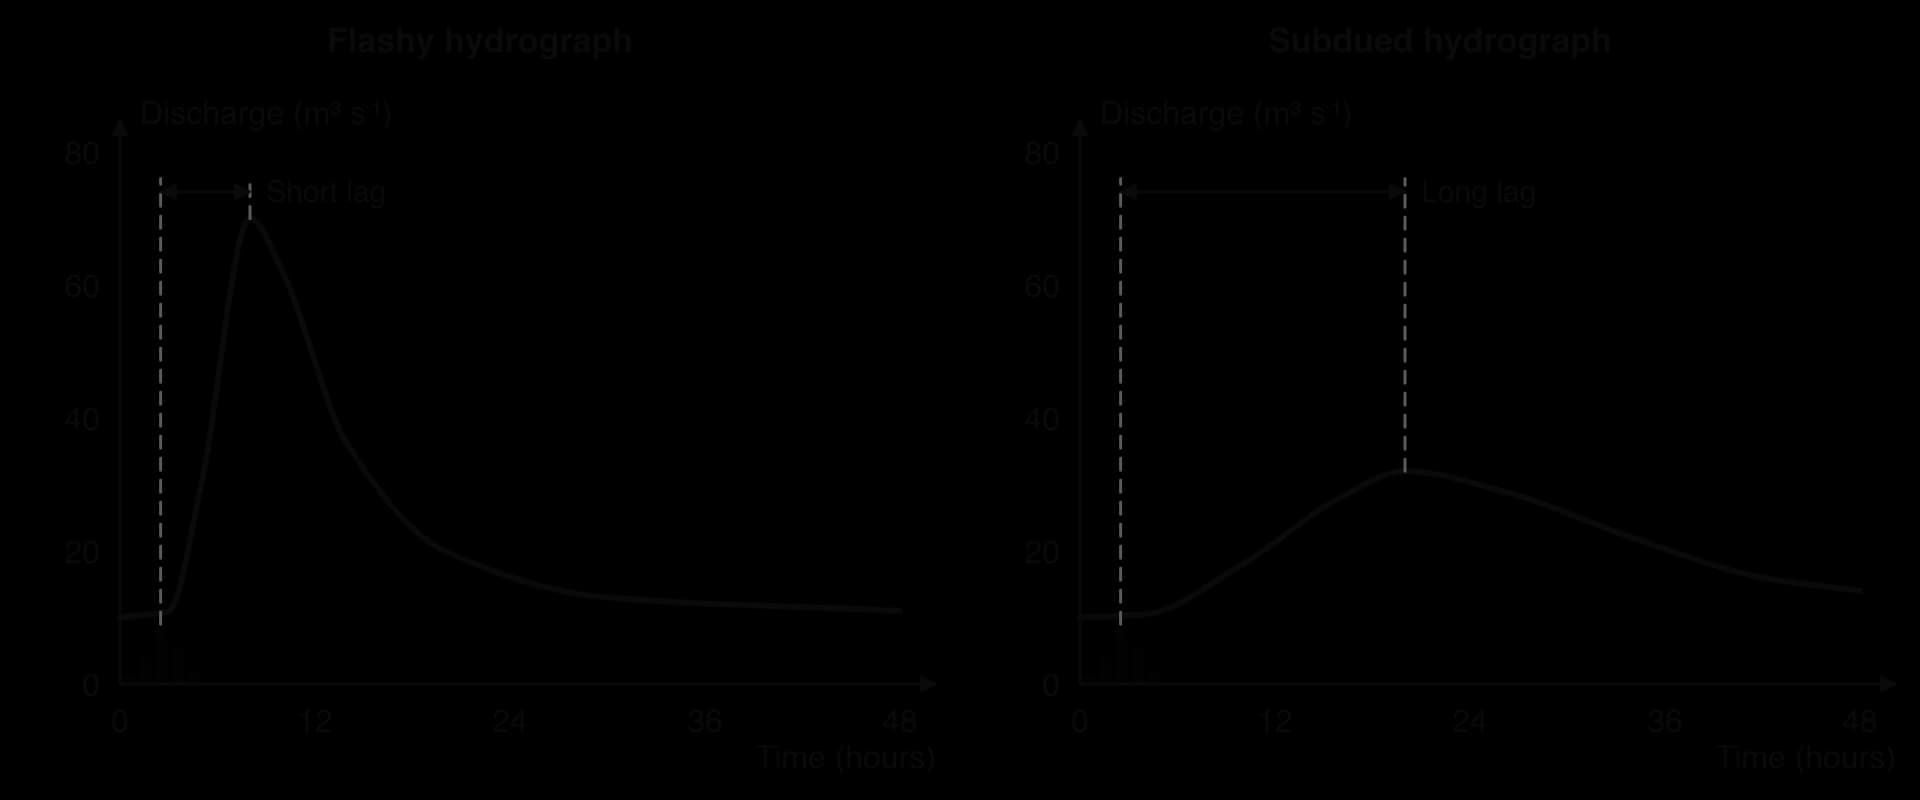
A storm hydrograph with a short lag time, steep rising and falling limbs and a high peak discharge; a subdued hydrograph has a long lag time and a low, broad peak.
An event in which water covers land that is normally dry, for example when a river's discharge exceeds the capacity of its channel and water spills onto the floodplain.
The prediction of when and where a flood will happen and how large it will be, by combining weather forecasts and river measurements with hydrological models.
A graph of annual peak discharge plotted against recurrence interval, usually on a logarithmic axis, used to estimate the size of a flood expected once in a given number of years.
Any action taken to reduce the likelihood of flooding or the harm that floods cause to people, property and the economy.
Actions taken before a flood to reduce its impact, such as flood plans, sandbags, flood boards, raised homes, emergency kits, shelters and evacuation routes.
An artificial channel that takes part of a river's flow around a settlement during high discharge and returns it downstream, reducing the flood level in the main channel.
The likelihood that a flood of a given size will occur in a place combined with the harm it would cause to people, property and activities there.
A surface such as tarmac, concrete or roofing that does not allow water to soak through it, so rainfall becomes overland flow.
A financial arrangement in which people or businesses pay regular premiums to an insurer, which pays for repairs and losses after an event such as a flood.
The time between the peak of rainfall and the peak of discharge in a river, usually measured in hours.
The planning control of what can be built or done on different areas of land, used on floodplains to keep housing and vital services away from the highest-risk zones; also called floodplain zoning.
The tendency for flood defences such as artificial levees to encourage more building on the land they protect, so that losses are larger when an extreme flood overtops or breaches them.
The risk that people take fewer precautions, or choose riskier places to live, because insurance or a government will pay for their losses.
An approach to flood mitigation that slows and stores water in a drainage basin using natural processes, for example by planting trees, building leaky dams and restoring wetlands and floodplains.
The forecasting of weather by solving equations of atmospheric physics on supercomputers, starting from observations of the present state of the atmosphere.
The highest discharge reached by a river during a storm or flood event, read from the top of the storm hydrograph.
Flood mitigation that changes how people use, prepare for and respond to flood-prone land, such as zoning, insurance, warnings and preparation, rather than changing the river itself.
The part of a river's discharge during a storm that arrives rapidly by overland flow and fast throughflow, shown as the area above the base flow line on a storm hydrograph; also called stormflow.
The average time between floods of at least a given size, calculated from a long record of annual peak discharges; a 1-in-100-year flood has a 1% chance of happening in any year.
The part of a storm hydrograph that shows discharge increasing from its pre-storm level to the peak, as storm water reaches the channel.
The pattern of variation in a river's discharge through an average year, shown on an annual hydrograph of mean monthly discharge.
A graph showing how the discharge of a river at one point changes over time in response to a period of rainfall, usually drawn with the rainfall as bars on the same time axis.
Physical changes to a river or drainage basin that reduce flooding, such as dams, artificial levees, channel modification and afforestation.
A flood is water covering land that is normally dry. River floods happen when discharge rises above bankfull discharge, the discharge at which the river fills its channel completely, so that water spills onto the floodplain. Floods can also be caused by storm surges and high tides at the coast, by intense rain that overwhelms urban drains (surface-water flooding), by rising groundwater, and by the failure of dams or glacial lakes.
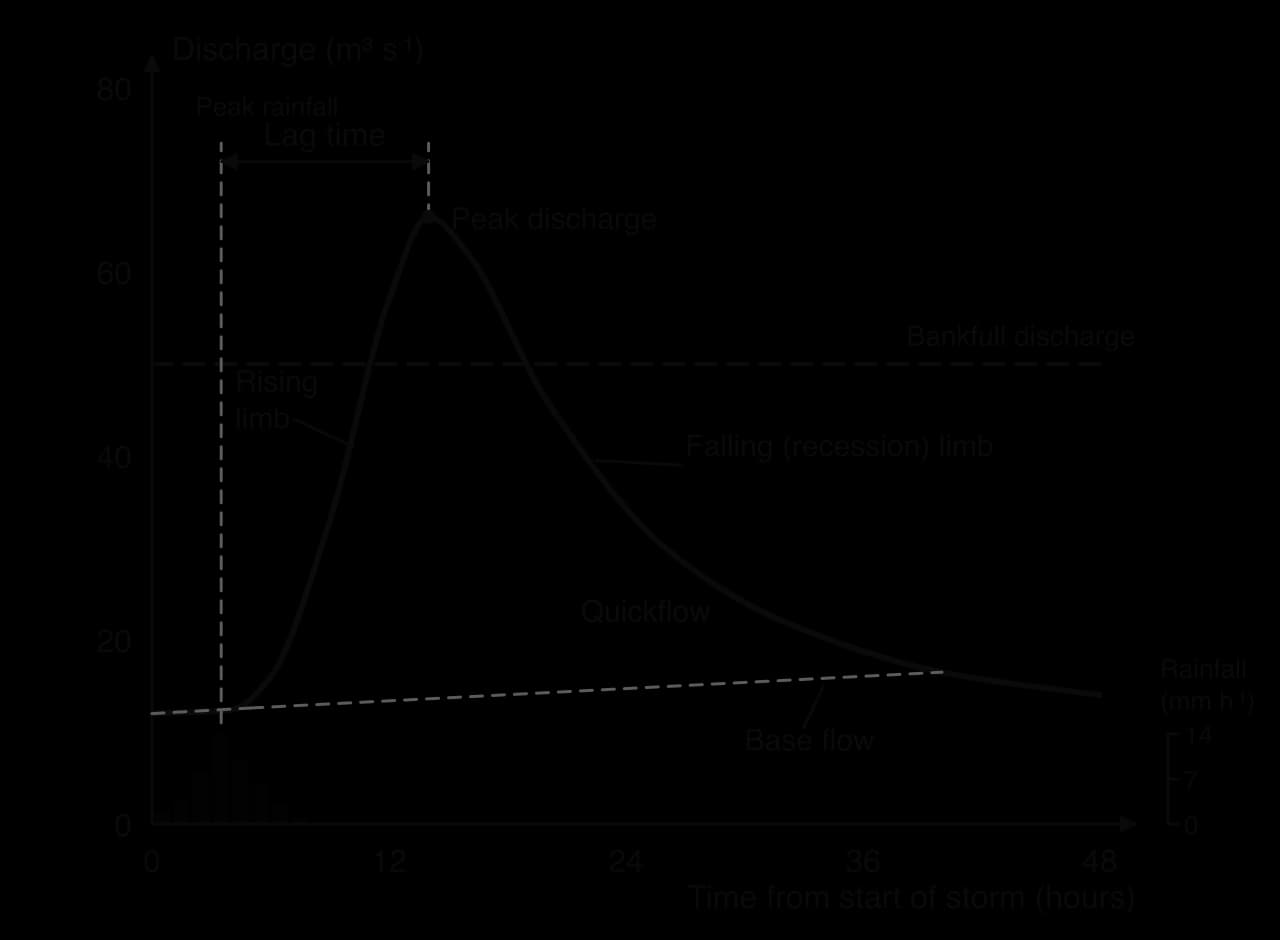
A storm hydrograph (or flood hydrograph) shows how the discharge of a river at one point changes over the hours or days after a period of rain. Rainfall is drawn as bars on the same time axis, so the river’s response can be compared with the rain that caused it.
Before the storm, discharge is at its normal level, supplied by base flow from groundwater. This early flat part is sometimes called the approach segment.
The rising limb shows discharge increasing as storm water reaches the channel, first as rain falling on the river and overland flow from nearby slopes, then as throughflow.
Peak discharge is the highest discharge reached.
Lag time is the time between peak rainfall and peak discharge.
The falling limb (recession limb) shows discharge decreasing as the basin drains.
Quickflow (stormflow) is the extra water that arrives quickly by overland flow and fast throughflow, shown as the area above the dashed base-flow line. Base flow rises slightly during and after the storm as groundwater is recharged.
The rising limb is usually steeper than the falling limb. Water arrives quickly by fast routes and all at once, but the basin drains slowly, because throughflow and groundwater flow keep feeding the river for days after the rain stops. The recession limb therefore shows the gradual emptying of the slower stores.
Basins respond to the same storm in different ways. A flashy hydrograph has a short lag time, steep limbs and a high peak; floods rise quickly and give little warning. A subdued hydrograph has a long lag time, gentle limbs and a low, broad peak. The difference depends on how quickly water moves from the slopes to the channel, which is controlled by the characteristics of the basin and by the weather.
Factor | Flashier hydrograph (short lag, high peak) | More subdued hydrograph (long lag, low peak) |
|---|---|---|
Basin size | Small basin: water has a short distance to travel | Large basin: water travels far, and tributary peaks arrive at different times |
Basin shape | Circular: water from all parts reaches the outlet at about the same time | Elongated: water from distant parts arrives later |
Relief | Steep slopes: fast overland flow, little time to infiltrate | Gentle slopes: slow flow, more infiltration |
Drainage density | High: many streams carry water quickly | Low: water travels slowly through soil and rock |
Geology | Impermeable rock (granite, clay): little percolation | Permeable rock (chalk, sandstone, limestone): water moves slowly as groundwater |
Soil | Thin, clay or compacted soil with low infiltration capacity | Deep, sandy, well-drained soil |
Vegetation | Bare ground, crops after harvest, deciduous trees in winter | Dense forest: interception, transpiration and deep roots |
Precipitation | Intense, prolonged rain, or rain on snow | Light rain or snow that is stored before melting |
Geology often makes the biggest difference. Rivers rising on chalk, such as the River Test in southern England, are fed mainly by groundwater and rise only slowly after storms, while rivers on impermeable granite moorland, such as those draining Dartmoor, rise within hours.
Antecedent moisture is how wet the basin is before a storm. When soils are dry, much of the rain soaks in; when they are already saturated after weeks of rain, even moderate rainfall becomes overland flow, and the hydrograph becomes flashier. Many of the largest floods happen after long wet periods for this reason.
Seasonality changes the same basin through the year. In temperate regions, low evapotranspiration and leafless trees make winter hydrographs flashier than summer ones. Frozen ground acts as an impermeable surface, so rain or snowmelt on frozen soil runs off rapidly. In hot seasons, high evaporation dries the soil and reduces runoff. In very dry conditions, though, soil baked hard can resist infiltration and produce rapid runoff from intense storms.
A storm hydrograph covers a single event. An annual hydrograph shows a river’s mean monthly discharge through a typical year, and the pattern it shows is the river regime. Regimes reflect the climate of the basin: when precipitation falls, whether it falls as snow, and when evapotranspiration is high.
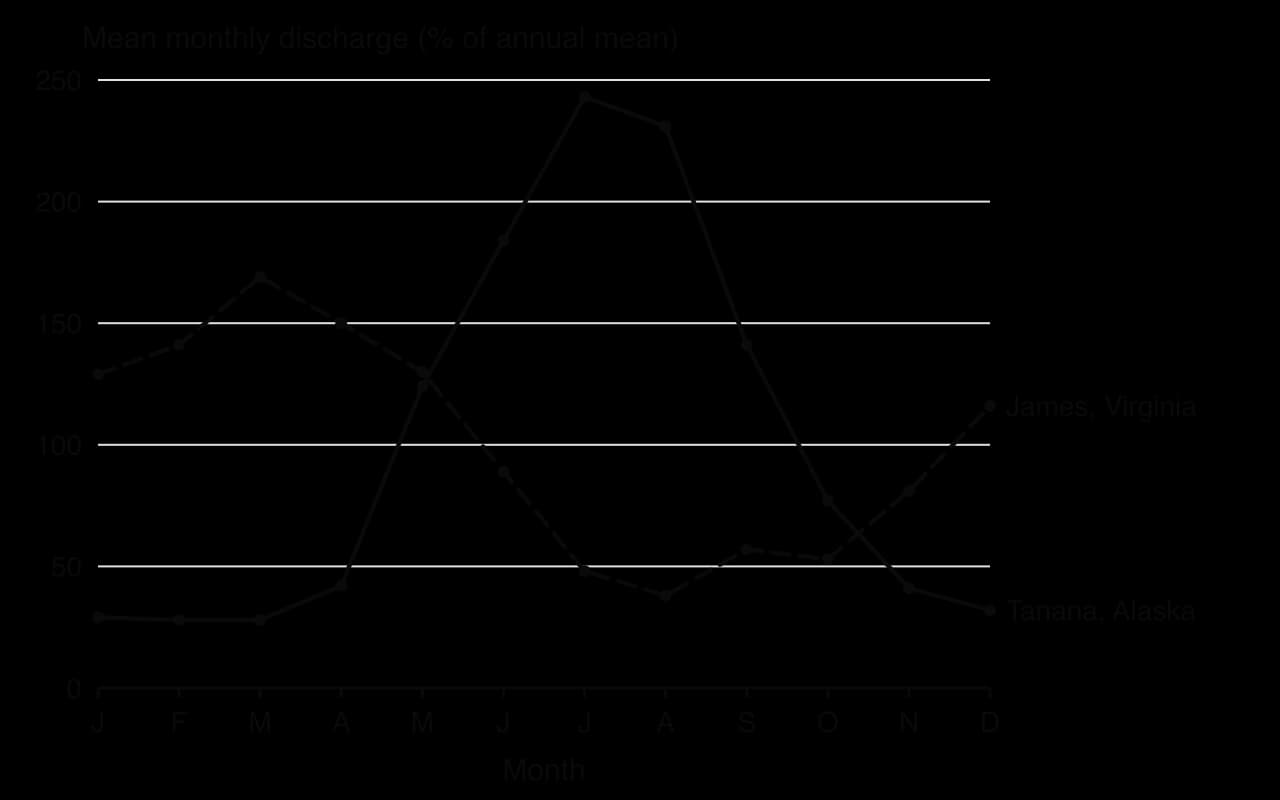
Regimes are described as simple or complex:
A simple regime has one clear high-flow season each year. Glacier- and snow-fed rivers such as the Tanana in Alaska peak in summer when ice and snow melt; monsoon rivers such as the Ganges peak in the wet season, in July to September.
A complex regime has more than one peak, or a pattern shaped by tributaries from different climates. Large rivers such as the Rhine combine Alpine snowmelt in early summer with winter rain from its lower tributaries, which smooths its regime; the Nile combines summer floods from the Ethiopian Highlands with steady flow from equatorial lakes.
Some rivers have no flow for much of the year. An ephemeral river flows only for short periods after rain, as in the wadis of desert regions; an intermittent river flows seasonally, drying up in the dry season. These channels can produce violent floods when rare storms strike.
Sources: USGS National Water Information System, monthly mean discharge, Tanana River at Nenana, Alaska (15515500) and James River at Cartersville, Virginia (02035000), 1991–2020, accessed 2026.
People change floods in two separate ways. They change the hazard, by altering how fast and how much water reaches the river, and they change the exposure, by placing people and property where floods occur. Flood risk combines both: the likelihood of a flood of a given size and the harm it would cause. Geographers describe changes in floods in terms of their frequency (how often a given discharge is exceeded), their magnitude (how large the peak is) and their distribution (which places flood).
Urbanisation replaces soil and vegetation with an impermeable surface of roofs, roads and car parks. Interception and infiltration fall, so more rain becomes overland flow. Gutters and storm drains then carry that water directly to rivers, much faster than it would flow over or through the ground. Rivers in towns may also be straightened or put in culverts. The result is a hydrograph with a shorter lag time, a steeper rising limb and a higher peak, and floods that happen more often.
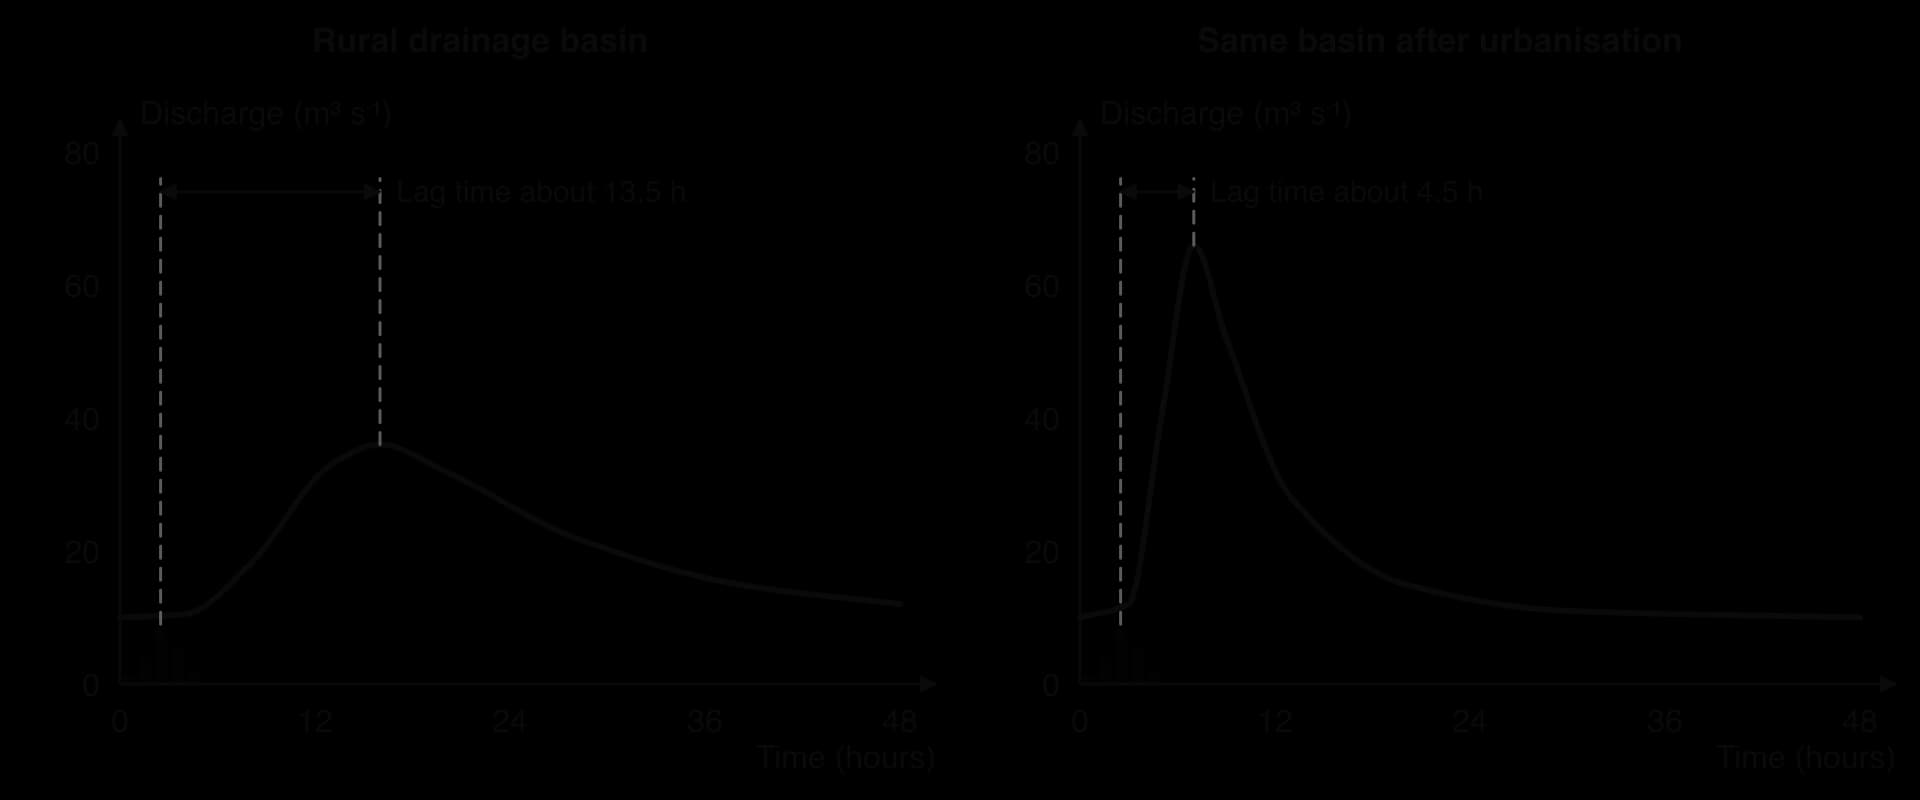
The effect is strongest for short, intense storms over small urban catchments, where drains fill within minutes. On 29 October 2024, rainfall of up to 184.6 mm in one hour at Turís, in the province of Valencia in Spain, sent a peak of about 2,300 m³ s⁻¹ down the normally dry Poyo ravine into suburbs such as Paiporta. The coastal plain had been built over rapidly between 1997 and 2007, and at least 224 people died in the province.
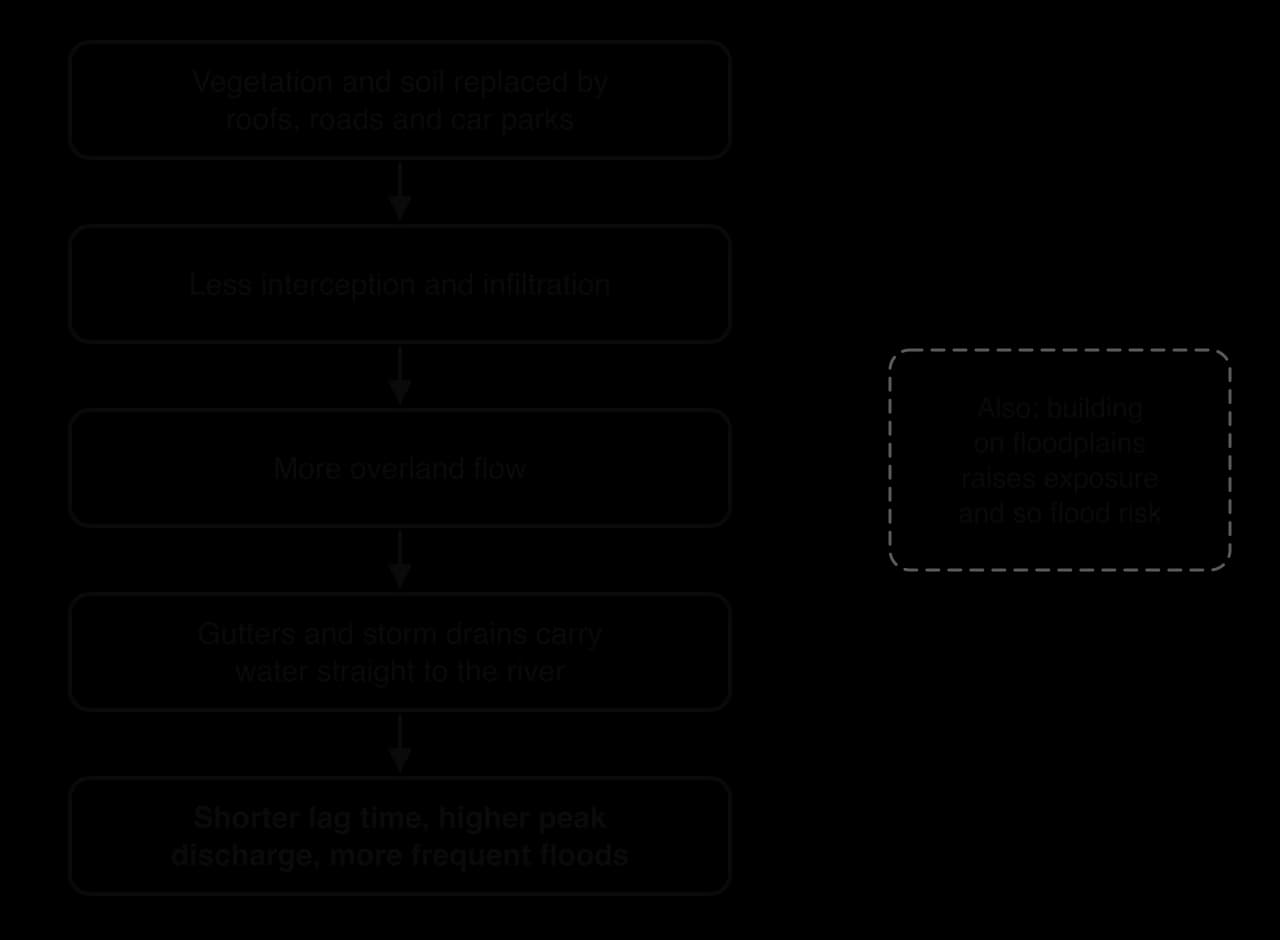
Towns can reduce these effects with sustainable drainage systems (SuDS), such as permeable paving, green roofs, swales and retention ponds, which store water and let it soak in slowly. These are planning choices about how land is developed.
Deforestation removes the canopy that intercepts rain and the roots that take up and transpire soil water. The soil is exposed to raindrop impact and to compaction by machinery and grazing animals, so its infiltration capacity falls and overland flow increases. Eroded soil is washed into rivers, where it settles and raises the channel bed, reducing the river’s capacity so that it overflows at lower discharges.
The scale of these effects is debated. In small basins, studies show clearly that clearing forest raises flood peaks. In very large basins and for the largest floods, the evidence is weaker: when rain falls for weeks, forest soils become saturated too, and the flood is controlled by the amount of rain rather than by land cover.
A long-running example is the claim that deforestation in the Himalaya causes the great floods of the Ganges and Brahmaputra in Bangladesh. A 2005 review by the FAO and the Center for International Forestry Research concluded that, for such large basins, the link is much weaker than often claimed, and that monsoon rainfall and the low-lying delta are the main causes.
Channelisation (channel modification) means straightening, deepening, widening or lining a river channel to carry water away faster. It increases the channel’s capacity and velocity locally and protects the place where it is done. But by speeding water downstream, it can raise flood peaks and shorten lag times for places further down the river. This is a clear example of spatial interaction within a drainage basin: a decision taken upstream changes flood risk downstream.
Artificial levees (embankments, called dykes in the Netherlands) raise the banks so that the channel holds more water. They work well for floods up to their design height, but they confine floodwater that would have spread over the floodplain, so water levels rise higher downstream. If they are overtopped or breached, water escapes suddenly and with great force, and the land behind them, which may have sunk below river level, floods deeply.
Levees also change behaviour. The sense of safety they give encourages more building on the land behind them, so that when an extreme flood does breach them the losses are far greater than if the land had been left open. This is the levee effect. In New Orleans in August 2005, more than 50 breaches in the city’s levees and floodwalls during Hurricane Katrina flooded about 80% of the city; investigators found that the engineering of the system had not been adequate.
Dams regulate flow and store floodwater, but they can encourage settlement downstream in the same way, and dam failure can cause catastrophic floods. Draining wetlands for farming or building removes natural storage that once soaked up floodwater and released it slowly.
Flood risk is unevenly distributed. It is highest on floodplains and deltas, in low-lying coastal cities, in steep small catchments prone to flash floods, and in urban areas where drains are overwhelmed. Within a single town, risk varies street by street with height above the river, and agencies map it as flood zones that guide planning.
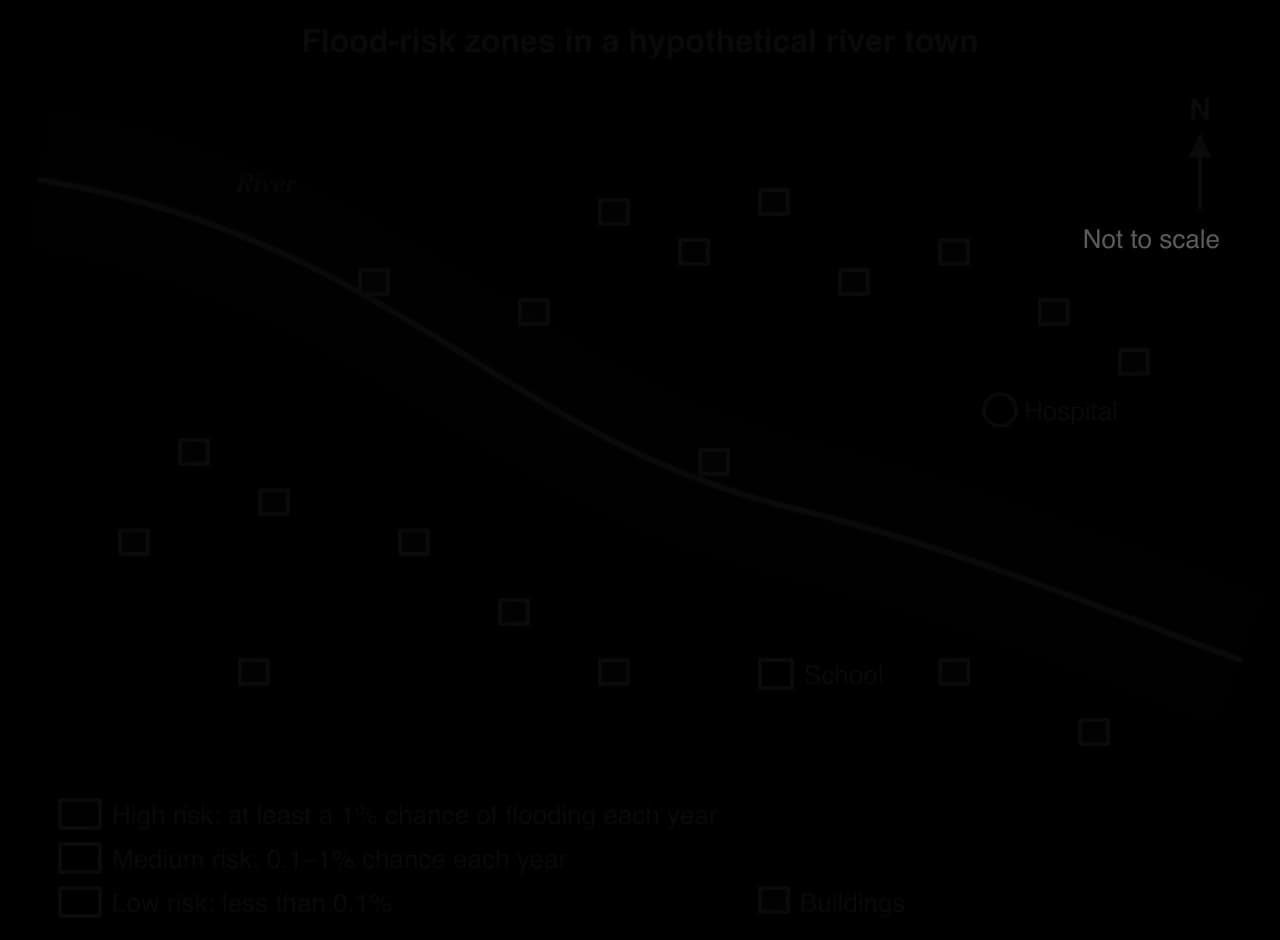
Small floods are common and large floods are rare. This relationship is measured by the recurrence interval (return period), the average number of years between floods of at least a given size. It is calculated from a record of annual peak discharges: the peaks are ranked from largest (rank 1) to smallest, and for each one:
where T is the recurrence interval in years, n the number of years of record and m the rank. Plotting peak discharge against T, usually on a logarithmic axis, gives a flood frequency curve, which can be extended to estimate floods larger than any yet recorded.
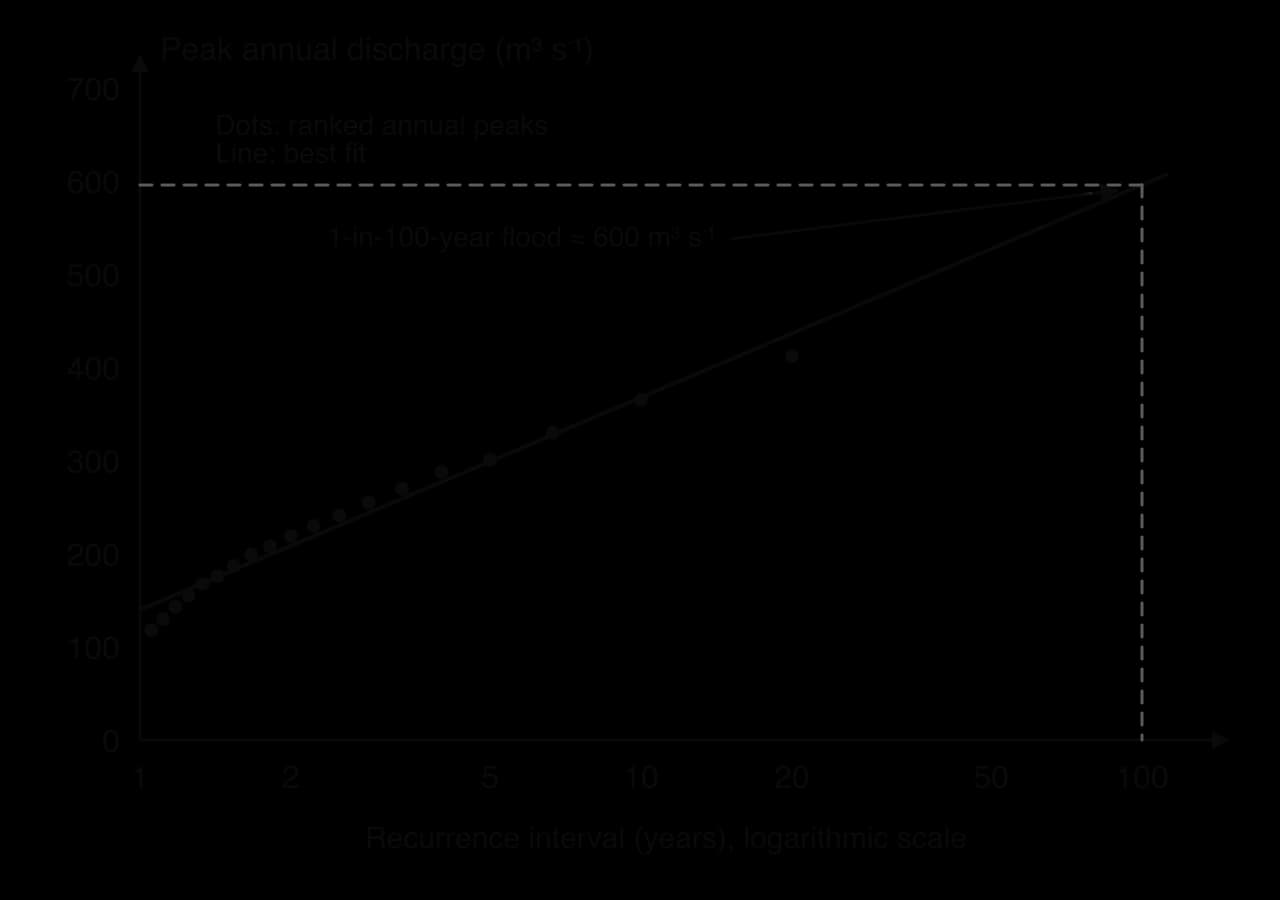
Human activity can shift the whole curve. If urbanisation raises flood peaks, a discharge that was once a 1-in-100-year event may become a 1-in-20-year event, and defences designed on the old record will be overtopped more often. Climate change can shift it in the same way, which is why records from the past are no longer a reliable guide on their own.
A flash flood rises within minutes or a few hours of intense rain, usually in a small, steep or urban basin. In the Ahr valley in western Germany in July 2021, up to 207 mm of rain fell in nine hours at Reifferscheid; the narrow valley funnelled the water through villages, and about 135 people died in the Ahrweiler district alone. Flash floods are the most dangerous type of flood for people, because there is little time to warn and evacuate.
Type | Negative impacts | Positive effects |
|---|---|---|
Social | Deaths and injuries, displacement, loss of homes and schools, water-borne disease from contaminated supplies, mental health effects | Communities may rebuild more safely |
Economic | Damage to property, crops, livestock and infrastructure; business interruption; insurance claims and higher premiums | Reconstruction employment |
Environmental | Erosion, pollution from sewage and chemicals, damage to habitats | Fresh silt fertilises floodplains; groundwater and wetlands are recharged |
Impacts depend on vulnerability as much as on the size of the flood: poorer households with less secure homes, no insurance and no savings suffer most and recover most slowly, which is why the same flood can be a costly inconvenience in one place and a disaster in another. Heavier rainfall extremes are a consequence of global climate change, which increases the frequency of large floods in many regions.
Sources: Wikipedia, “2024 Spanish floods” (AEMET and CHJ data) and “2021 European floods”, accessed 2026; Wikipedia, “2005 levee failures in Greater New Orleans” (National Academy of Sciences review), accessed 2026; FAO and CIFOR, Forests and Floods: Drowning in Fiction or Thriving on Facts?, 2005.
Flood forecasting is the prediction of when and where a flood will happen and how large it will be. It works at two timescales: short-term forecasts of particular floods hours to days ahead, which allow warnings, and long-term projections of how flood risk will change over decades, which guide the design of defences and planning.
Short-term flood forecasts begin with weather forecasts, which have improved greatly. Satellites observe clouds, temperature and moisture over the whole globe; Doppler radar maps rainfall intensity every few minutes; and thousands of weather stations, balloons, ships and aircraft report conditions. These observations feed numerical weather prediction, in which supercomputers solve the equations of atmospheric physics on a grid covering the Earth to calculate how the weather will develop.
Forecast skill at the European Centre for Medium-Range Weather Forecasts (ECMWF) has improved by about a day per decade: a seven-day forecast in 2015 was as accurate as a three-day forecast in 1975. Its global model now runs on a grid about 9 km across, and in 2025 it began running a forecast model based on machine learning alongside it.
Small errors in the starting observations grow over time, so a single forecast can be confidently wrong. An ensemble forecast runs the same model many times from slightly different starting conditions; ECMWF’s ensemble has 51 members. If most members agree, forecasters can be confident; if they spread widely, the outcome is uncertain. The proportion of members that show a flood gives its probability, which lets authorities weigh the cost of acting against the risk of not acting.
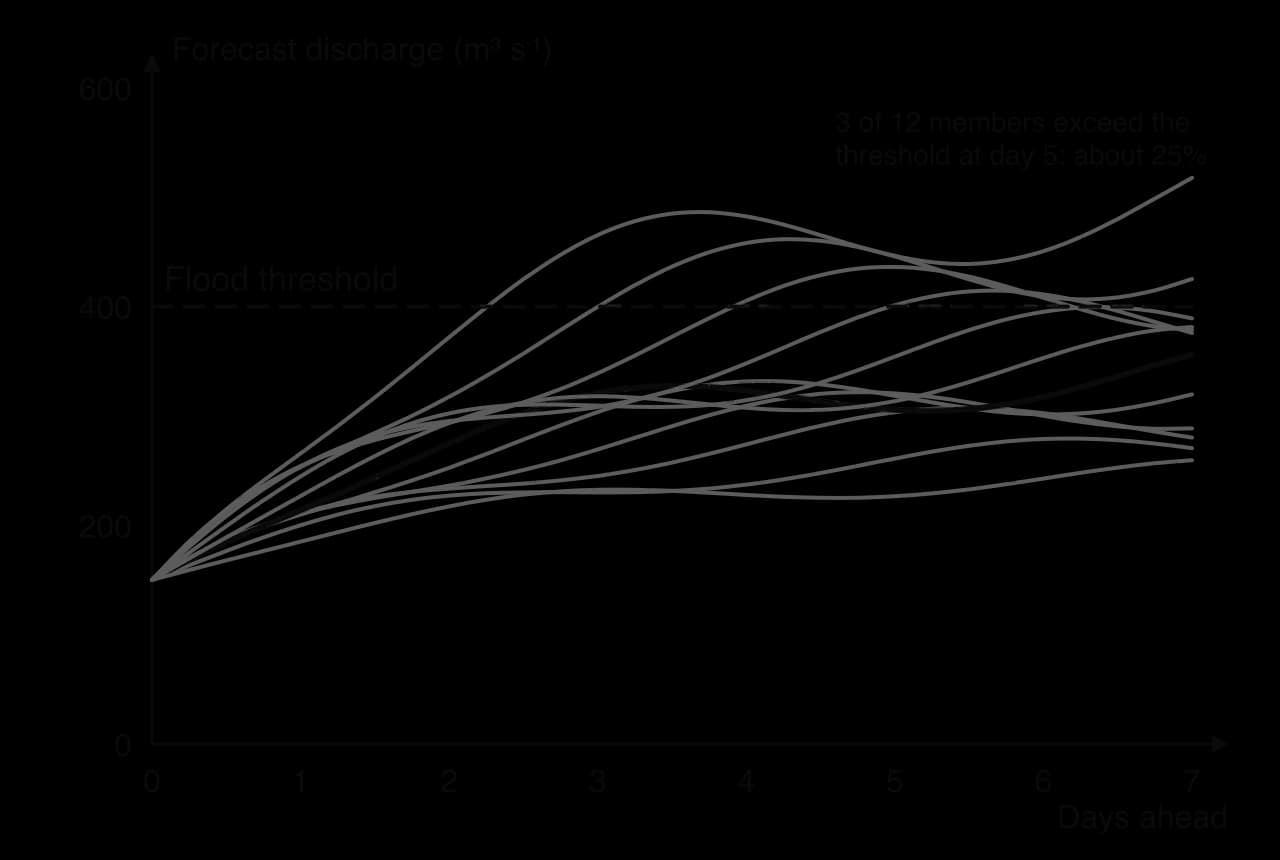
Hydrological models turn forecast rainfall into forecast discharge by representing the drainage basin: its size, slopes, soils, land use and how wet it already is. Real-time river gauges, which send water levels by telemetry every few minutes, are used to check and correct the model as the flood develops. The whole process is a chain, and an error or delay at any link weakens the warning at the end.
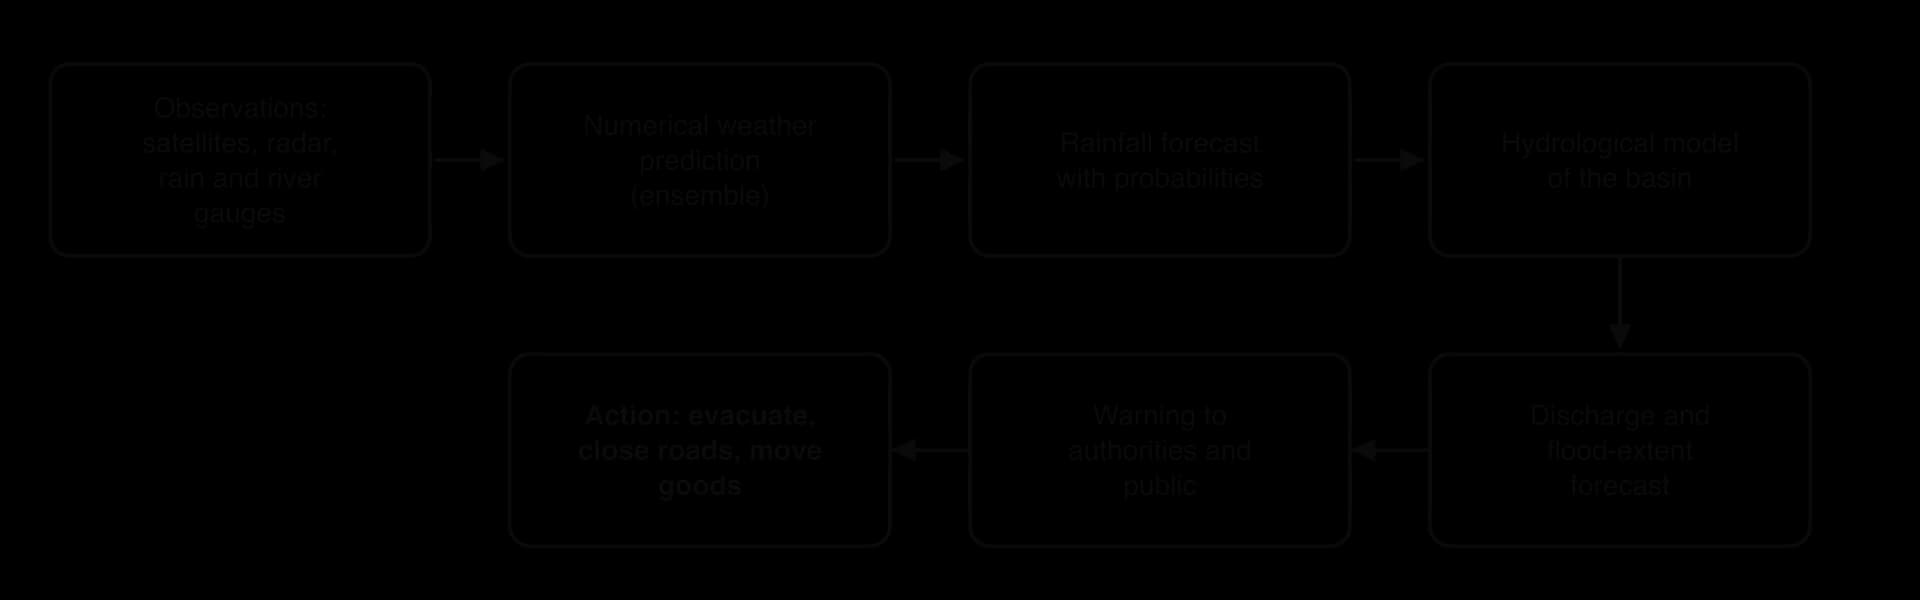
Forecasting systems now operate at every scale. Bangladesh’s Flood Forecasting and Warning Centre issues forecasts for the country’s major rivers. The European Flood Awareness System, part of the EU’s Copernicus Emergency Management Service, sends forecasts of major floods across Europe to national authorities several days ahead. Google’s Flood Hub uses machine-learning models trained on weather data, gauge records and satellite images to forecast river floods up to seven days ahead in more than 150 countries, including many river basins with few gauges.
Flash floods give little time. In small, steep or urban basins the lag time may be less than an hour, so even a perfect forecast leaves little time for action.
Convective storms are hard to place. Models can forecast that thunderstorms are likely over a region, but not exactly which valley a storm will hit; the difference between a near miss and a disaster may be 10 km.
Data gaps. Many basins, especially in low-income countries, have few rain gauges, river gauges or radars, so models are poorly calibrated and real-time checks are impossible.
Communication. A forecast saves lives only if the warning reaches people in time, in a form they understand and trust. Probabilities are often misunderstood, and warnings that turn out to be false alarms can make people ignore the next one.
Two European floods show the last problem. Before the Ahr valley flood of July 2021, the European Flood Awareness System had sent alerts of a severe flood days in advance, but they were described afterwards as “very vague”, and many residents received no clear instruction to leave. In Valencia in October 2024, the state weather agency issued a red warning in the morning, but the regional emergency alert to mobile phones was sent at 20:11, about 100 minutes after the Poyo ravine had burst its banks at Torrent.
Flood defences last for decades, so engineers need to know how floods will change over their lifetime. These projections come from climate models, computer simulations of the atmosphere, oceans, land and ice, run under different scenarios of future greenhouse gas emissions.
The basic physics is clear. A warmer atmosphere can hold about 7% more water vapour for each 1 °C of warming, a relationship known as the Clausius–Clapeyron equation, so the heaviest rainfall events are projected to become more intense as the enhanced greenhouse effect warms the planet. Attribution science now estimates how much warming has already changed particular events. But turning this into a flood forecast for a particular river is far less certain:
Scenario uncertainty: future emissions depend on political and economic choices that cannot be predicted.
Model uncertainty: different models give different regional changes in rainfall, especially for monsoons and convective storms, and some models struggle to simulate extreme rainfall at all.
Resolution: global models use grids tens of kilometres across, too coarse to represent a single small basin or a thunderstorm.
Local factors: future land use, drainage and defences change flood risk as much as the climate does.
The result is that past records are no longer a safe guide to the future (a problem called non-stationarity), but the future cannot be predicted precisely either. Decision-makers respond by building a margin into designs. In England, the Environment Agency publishes peak river flow allowances for each river catchment: designers add a central allowance (the 50th percentile of projected change), a higher central allowance (70th percentile) or an upper-end allowance (95th percentile) to their design flood, depending on how important and long-lived the project is.
Sources: ECMWF via Wikipedia, “European Centre for Medium-Range Weather Forecasts”, accessed 2026; Google Research, Flood Forecasting, accessed 2026; Environment Agency, Flood risk assessments: climate change allowances (gov.uk), accessed 2026.
Flood mitigation is any action that reduces the likelihood of flooding or the harm floods cause. In climate change, mitigation means reducing the causes of warming; in hazard management it means reducing a hazard’s impact, which is the sense used here. Measures fall into two groups. Structural measures change the river or the basin physically: dams, afforestation, channel modification and levees. Planning measures (also called non-structural measures) change how people use, prepare for and respond to flood-prone land: zoning, insurance, preparation and warnings. Many textbooks call these hard and soft engineering.
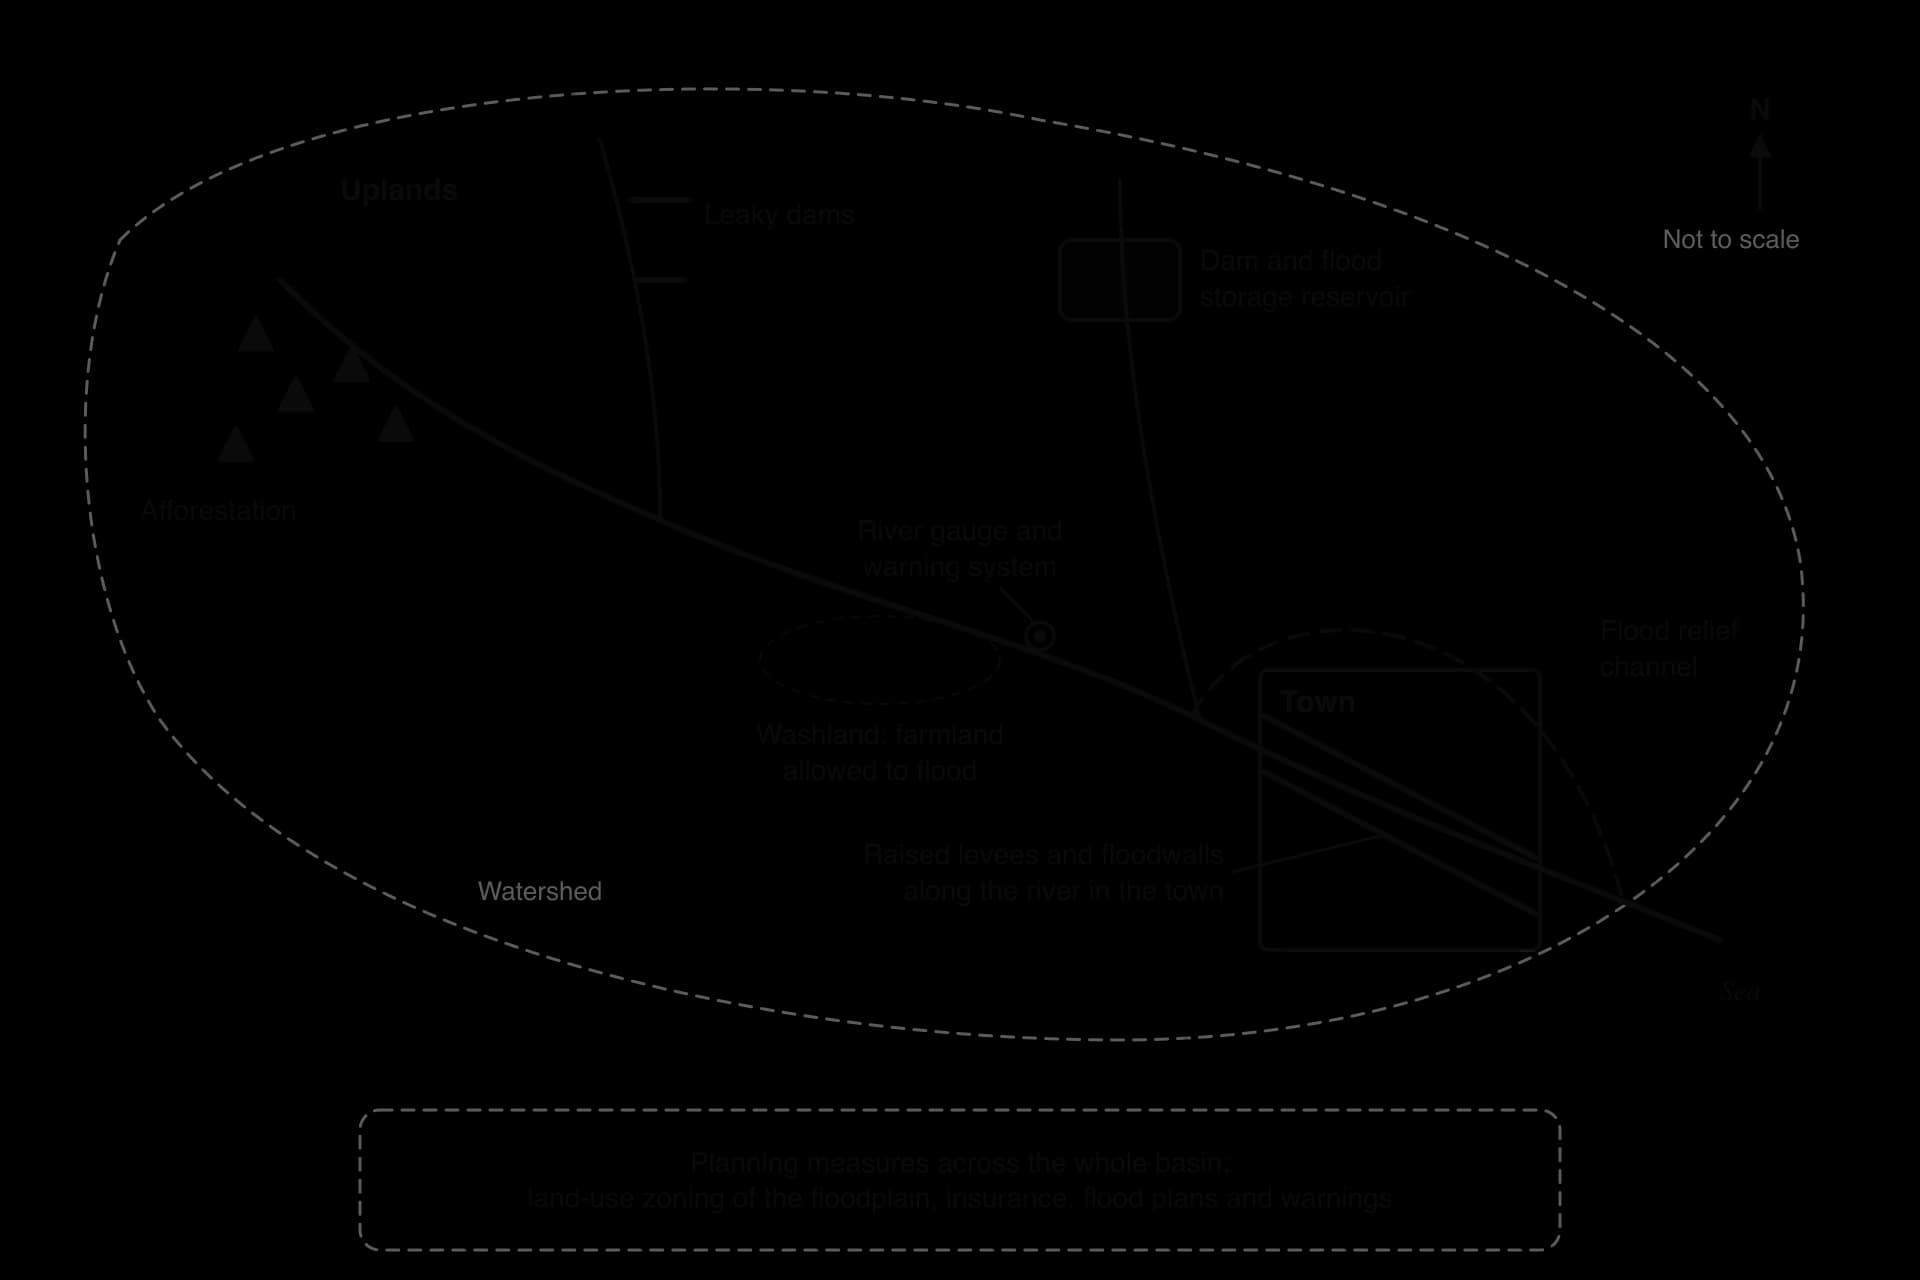
A dam stores floodwater in its reservoir and releases it slowly, cutting the peak downstream. The Three Gorges Dam on the Yangtze in China, completed in 2006, has a flood storage capacity of about 22 km³; the reservoir is drawn down from 175 m to 145 m before the rainy season to make room. Its designers claimed that it would reduce the frequency of major floods downstream from about once in 10 years to about once in 100 years.
Dams have limits. Storage used for floods cannot also be kept full for hydroelectric power or water supply, so operators must balance competing uses. A dam controls only the water above it, not floods from tributaries that join below it. Dams trap sediment, so riverbanks downstream may erode faster, and they encourage settlement downstream that is exposed if the dam fails or is overwhelmed.
Afforestation, planting trees on land that was not recently forested, increases interception, transpiration and infiltration and slows overland flow. It is part of natural flood management, which slows and stores water across a basin using natural processes: planting woodland, blocking moorland drains, building small “leaky” dams of logs in streams, and letting fields and floodplains hold water.
At Pickering in North Yorkshire, England, the Slowing the Flow project built 167 leaky woody dams and 187 heather-bale dams, planted 44 ha of woodland and created a large flood storage area upstream of the town. It reduced the chance of flooding in the town in any year from 25% to less than 4%. In the Boxing Day storm of 2015 it lowered the flood peak by an estimated 15–20%, preventing the flooding of several homes. Natural flood management is cheap and improves habitats, but its effect is greatest in small basins and moderate floods, and trees take years to grow.
Straightening, widening and deepening a channel increases its capacity. Dredging removes sediment from the bed to make it deeper. These measures protect the reach where they are done but speed water downstream, need repeating as sediment returns, and damage river habitats.
A flood relief channel takes part of the flow around a town in high water. The Jubilee River, an 11.6 km channel completed around 2002 at a cost of £110 million, diverts flood water from the River Thames around Maidenhead, Windsor and Eton. In the floods of 2014, however, residents of Wraysbury and Ham Island downstream said that it had raised flood levels there, and an independent assessment found that it carried only about two-thirds of its design capacity.
Raising and strengthening artificial levees and floodwalls is the main defence of many river cities.
After the levee failures of 2005, the US Army Corps of Engineers rebuilt the defences of Greater New Orleans as a system of levees, floodwalls, gates and pumps designed to give protection against a 1-in-100-year event, at a cost of about US$14.5 billion.
Large levee systems can be made safer by spillways that release excess water into planned flood areas: on the lower Mississippi the Morganza Spillway was opened in 2011, and in 2019 the Bonnet Carré Spillway was opened twice in one year for the first time, diverting flood water into Lake Pontchartrain to protect New Orleans.
Land-use zoning (floodplain zoning) uses planning law to keep housing, hospitals and schools out of the highest-risk zones, and to reserve them for uses that can tolerate flooding, such as parks, sports fields and farmland. It is cheap and permanent, but it is hard to apply where land is already built up, where housing is scarce, or where people build informally without permission.
Insurance does not stop floods, but it spreads the cost of recovery so that households and businesses can rebuild. In the United Kingdom, Flood Re, launched in April 2016, is a scheme run by insurers and funded by a levy on them, which caps the flood element of home insurance for high-risk households, with premiums linked to council tax bands. It does not cover homes built since 2009, to avoid encouraging new building in risky places, and is designed to last about 25 years while premiums move towards reflecting real risk. In the USA, the National Flood Insurance Program, run by the federal government, has a similar role.
Insurance raises an important problem: moral hazard, the risk that people take fewer precautions or choose riskier places to live because someone else will pay for their losses. Cheap, subsidised cover can keep people living in places that are too dangerous. In many low- and middle-income countries, few households have any flood insurance, so the poorest bear their losses alone.
Flood preparation reduces harm when a flood arrives: household flood plans, sandbags and flood boards for doors, raising electrical sockets and boilers, raised homes on stilts or earth platforms, community shelters on high ground, stockpiles of food and medicine, and evacuation plans that are practised in advance. These measures cost little and are within the reach of individuals and communities, which makes them especially important where governments have little money for large structures.
An early warning system detects or forecasts a flood and warns people at risk in time to act. It combines monitoring (river gauges with telemetry, rain radar), forecasting, and the warning itself, sent by sirens, radio, text message, mobile phone alerts, apps and door-to-door visits. In England, the Environment Agency issues three levels: a flood alert (flooding is possible, be prepared), a flood warning (flooding is likely, act now) and a severe flood warning (danger to life).
Warnings are among the most cost-effective measures, because a few hours’ notice lets people move themselves, their vehicles and their possessions out of danger. They depend on public trust, on reaching everyone, including people without phones or who do not speak the main language, and on people knowing what to do.
Measure | Effectiveness | Cost | Who benefits and who pays | Side effects and sustainability |
|---|---|---|---|---|
Dams and reservoirs | High for moderate floods below the dam; can be overwhelmed | Very high | Downstream cities benefit; people displaced by the reservoir lose | Trap sediment; encourage settlement downstream; risk of failure |
Afforestation and natural flood management | Good in small basins and moderate floods; limited in extreme ones | Low to moderate | Downstream towns benefit; upland landowners give up land | Improve habitats and water quality; slow to take effect |
Channel modification and relief channels | High locally | High; dredging recurs | Protected town benefits; downstream places may lose | Damage habitats; speed water downstream |
Levees and floodwalls | High up to design height; catastrophic if breached | High, with maintenance | Protected land benefits; places downstream and outside the levees may lose | The levee effect raises long-term risk |
Land-use zoning | High over the long term | Low | Society benefits; landowners may lose development value | Very sustainable; hard to apply in built-up or informal areas |
Insurance | No effect on floods; speeds recovery | Paid by households or levies | Insured households benefit; those without cover do not | Moral hazard if subsidised |
Preparation and warnings | High for saving lives; less for property | Low | Everyone reached by the system | Depend on trust, communication and maintenance |
No single measure is enough. Structural measures protect against frequent, moderate floods and are essential for cities that are already built on floodplains, but they can fail in extreme events and may move the problem elsewhere. Planning measures cost less, work with the river rather than against it, and save lives, but they protect property less well. Over the past few decades, high-income countries such as the Netherlands and the United Kingdom have moved from relying on defences towards integrated approaches that give rivers space and manage the whole basin, often called integrated drainage basin management. Low-income countries often depend on preparation and warnings because they are affordable.
The most effective strategy therefore depends on the size of the basin, the type of flood and the wealth and power of the people at risk. A judgment that combines structural protection for cities, natural storage upstream and strong warnings and planning everywhere is supported by most recent experience, and the two contrasting basins that follow show why.
About a quarter of the Netherlands lies below sea level, and the Rhine and Meuse rivers flow through it to the sea between dykes. For centuries the Dutch responded to floods by raising those dykes. The Meuse flooded in 1993, and in 1995 very high discharges on the Rhine and Meuse led to the evacuation of about 250,000 people and a million animals from the river area, although no dykes broke.
Rather than simply raising the dykes again, the government chose a new approach: Room for the River (Ruimte voor de Rivier), set out in a national plan in 2006, which gives the rivers more space to carry and store floodwater.
The programme carried out 34 projects (five of 39 planned measures were dropped) between 2006 and March 2019, at a cost of €2.3 billion, within budget. It was designed so that the Rhine branches can safely carry 16,000 m³ s⁻¹. Measures included moving dykes inland, lowering floodplains, digging side channels, lowering groynes, removing obstacles and creating a flood bypass at Veessen–Wapenveld. At Nijmegen the dyke on the north bank of the Waal was moved inland and the 4 km Spiegelwaal side channel was dug, creating a new city island, Veur-Lent; several houses were demolished.
Projects were run by the national water agency, Rijkswaterstaat, with provinces, water boards and municipalities, and many also created parks, nature reserves and recreation space.
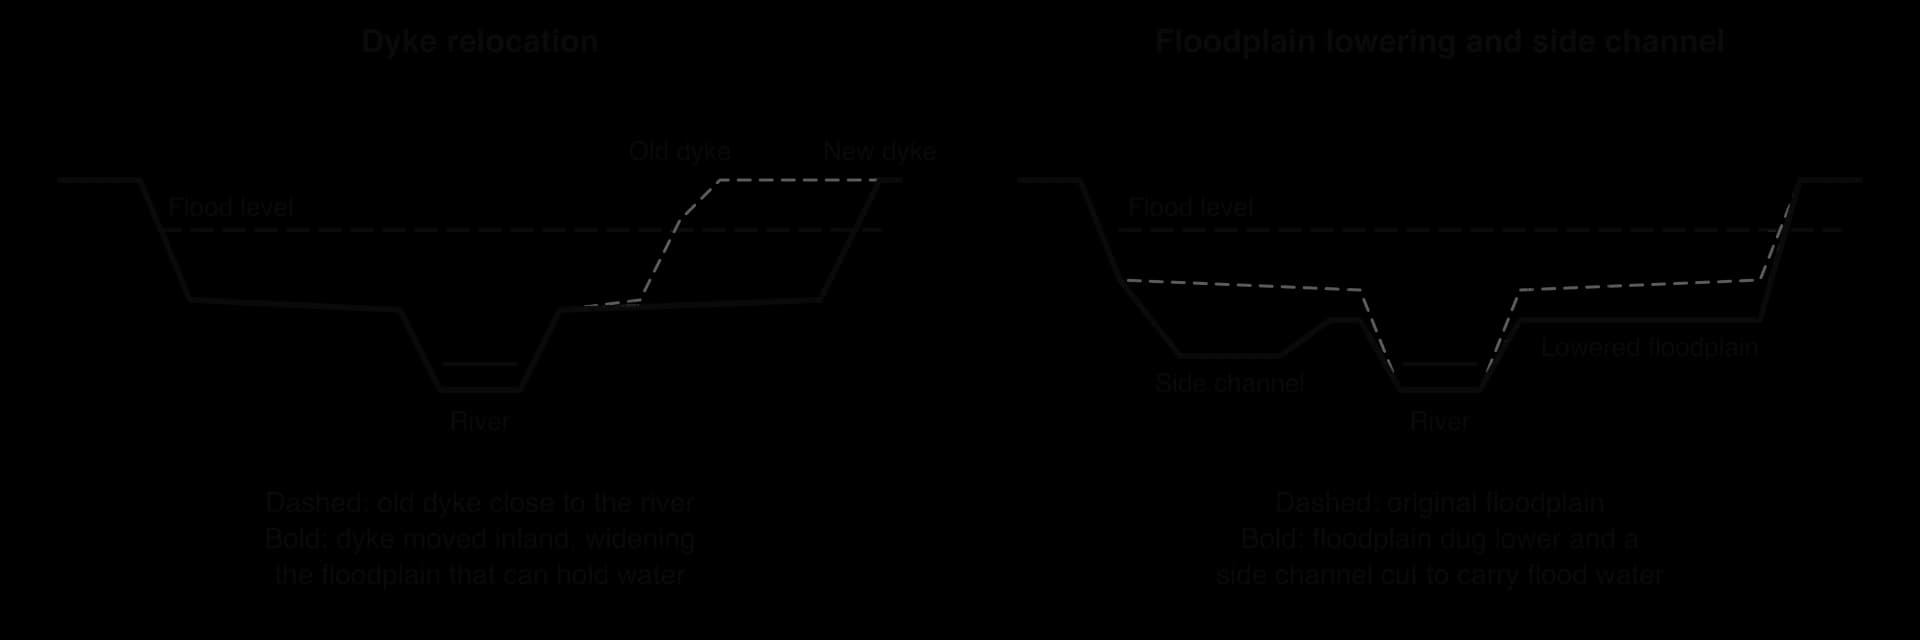
The Spiegelwaal combines both ideas: the dyke was moved back and a new channel was dug across the old floodplain.

The approach was tested in July 2021, when the same rainstorm that killed more than 180 people in Germany and 39 in Belgium reached the Netherlands. No deaths were reported in the Netherlands, although towns on smaller rivers, such as Valkenburg aan de Geul, suffered about €400 million of damage and more than 10,000 people were evacuated near Venlo.
In 2024, experts concluded that the measures work well and were worth their cost. An earlier independent evaluation, in 2013, recorded complaints from local governments that Rijkswaterstaat was bureaucratic and ran the programme from the top down, and noted that some water boards and municipalities lacked experience of this kind of cooperation. The approach also took more than a decade, and it was possible only in a wealthy state with strong institutions and land to spare.
 YouTube
Sources: Wikipedia, “Room for the River (Netherlands)”, “Ruimte voor de Rivier” and “Spiegelwaal” (nl), and “2021 European floods”, accessed 2026; Forest Research, Slowing the Flow at Pickering, accessed 2026; Wikipedia, “Three Gorges Dam”, “Jubilee River”, “Flood Re” and “2005 levee failures in Greater New Orleans”, accessed 2026.
The Indus rises in Tibet and flows through the Himalaya and the Karakoram, then south across the plains of Punjab and Sindh to the Arabian Sea. Its basin supports one of the largest irrigation systems in the world, and most of Pakistan’s farmland and population lie on its floodplain. Pakistan is a lower-middle-income country, and many people in rural Sindh and Balochistan live in mud-brick homes on low ground, with little savings or insurance.
The Indus has a simple regime driven by snow and glacier melt in spring and summer and by the south-west monsoon from July to September. Its main defences are earth embankments along the river and barrages that divert water into canals, built mainly for irrigation. After severe floods in 1973 and 1976 the government created a Federal Flood Commission in 1977, but the 2010 floods, which killed about 1,985 people, showed how much remained to be done: reports found that many funded flood projects had not been completed.
Fact file | 2022 Indus floods |
|---|---|
Location | Indus basin, Pakistan; worst in Sindh and Balochistan, in the lower basin |
Country | Lower-middle-income country |
Duration | Mid-June to October 2022 |
Main causes | Pre-monsoon heatwave and melt; exceptional August monsoon rain; saturated ground; flat, poorly drained plains; settlement on the floodplain |
Deaths | 1,739, including 647 children |
Area flooded | About 75,000 km² (about 9% of the country) |
Damage and losses | US$14.9 billion of damage and US$15.2 billion of economic losses |
The 2022 floods began in mid-June and lasted until October. Their physical causes combined several extremes:
A record heatwave in May and June increased snow and glacier melt in the north, raising river levels before the monsoon.
Monsoon rainfall was exceptional: in August, Sindh received 784% and Balochistan 500% more rain than the August average.
Repeated heavy rain fell on ground that was already saturated, so the hydrographs of rivers and hill torrents became extremely flashy, while the flat plains of Sindh had almost no gradient to drain the water away.
A rapid study by World Weather Attribution in September 2022 found that the five-day maximum rainfall over Sindh and Balochistan was about 75% more intense than it would have been without about 1.2 °C of global warming, and that both this and the 60-day rainfall over the Indus basin were about 1-in-100-year events in today’s climate. The authors stressed, though, that many climate models struggled to simulate the rainfall, so the exact contribution of climate change could not be quantified.
Human factors turned extreme rain into a disaster. The same study pointed to homes, infrastructure and farmland built close to floodplains, an “outdated river management system” and high poverty. Commentators in Pakistan also blamed poor planning, unregulated construction and weak governance. On the flat plains of Sindh, water that left the river had almost nowhere to drain, and in places the Indus spread into a lake about 100 km wide.
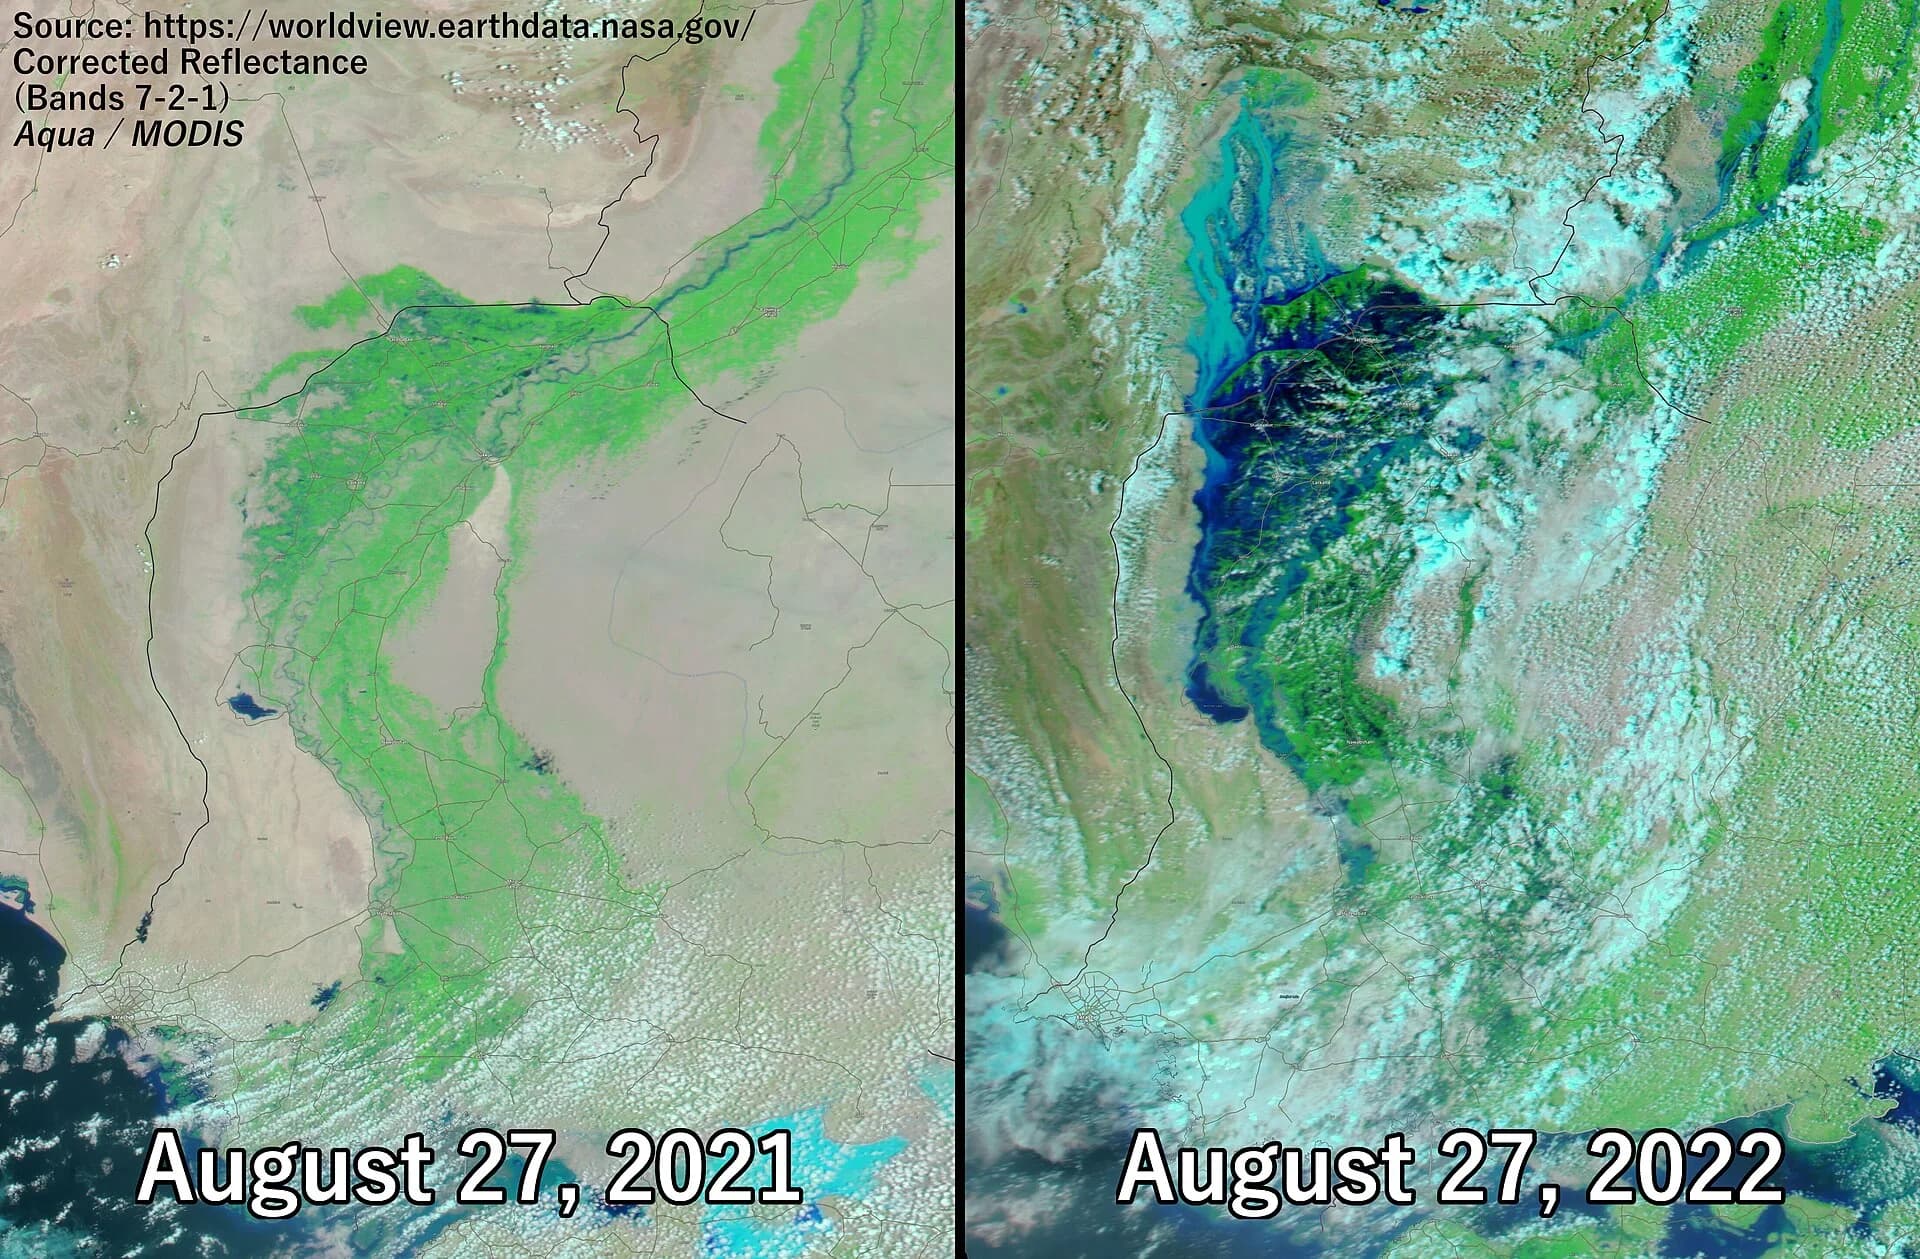
In total 1,739 people died, including 647 children, and about 33 million were affected. About 897,000 houses were destroyed and 1.39 million damaged, 13,115 km of roads and 439 bridges were damaged, and about 1.16 million livestock died. About 75,000 km², about 9% of the country, was flooded. Damage was estimated at US$14.9 billion and economic losses at US$15.2 billion, with recovery needs of US$16.3 billion.
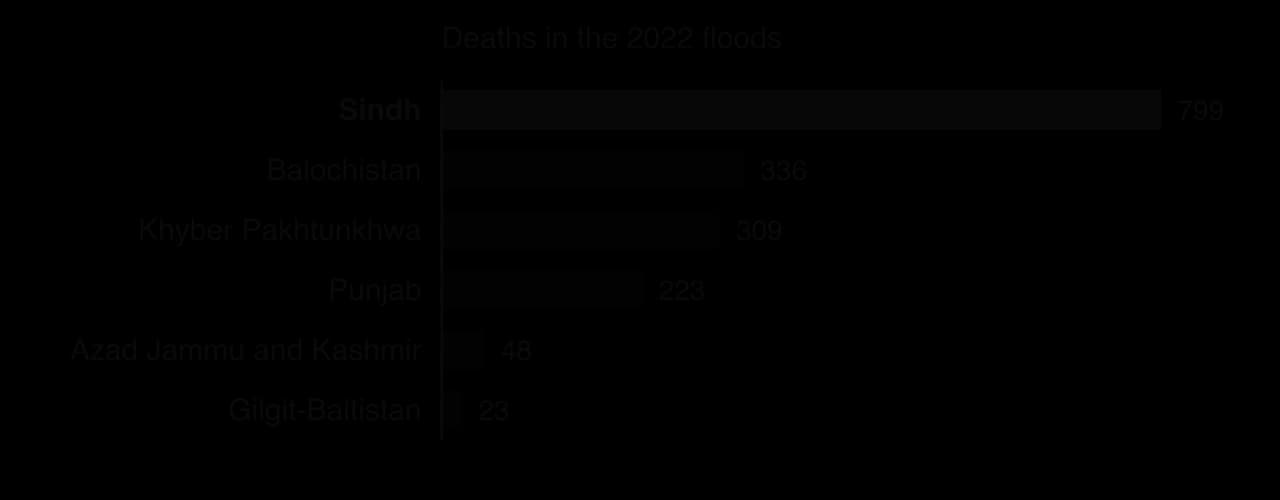
The impacts were spread unequally. The poorest rural households lost homes, harvests and animals together, and women, children and older people were most exposed to disease, food shortages and displacement. Floodwater stood for months on farmland in Sindh, delaying the next planting season. The losses were equal to several per cent of Pakistan’s annual GDP, at a time when the country was already in an economic crisis.
Measure | What happened in 2022 | Assessment |
|---|---|---|
Embankments and barrages | Designed mainly for irrigation; overtopped or breached in many places | Protected some land but trapped water elsewhere; not designed for a flood of this size |
Forecasting and warnings | Forecasting concentrates on the main rivers; flash floods from hill torrents and rain falling directly on the plains were harder to warn for | Forecasts did not translate into evacuation for many rural communities |
Land-use planning | Extensive settlement and building on floodplains | Weak enforcement increased exposure |
Drainage | Lake Manchar, west of the Indus in Sindh, overflowed; in September 2022 work was carried out to help drain it, and standing water stayed on farmland for months | The flat plain had too few outlets for water that had left the river |
Insurance | Very few households insured | Losses fell on the poorest; recovery depended on aid and government cash transfers |
Relief and recovery | Cash transfers to about 1.5 million families through the Benazir Income Support Programme; UN appeal of US$816 million, about 60% funded | Large but slow and incomplete, given the scale of need |
Internationally, Pakistan used the disaster to argue for climate justice, since the country produces a very small share of global emissions. At the COP27 climate conference in November 2022, countries agreed to set up a fund for loss and damage; when it was launched at COP28 in 2023, it received more than US$700 million in initial pledges.
 YouTube
Key concept | How the 2022 floods show it |
|---|---|
Process | Heatwave melt, extreme monsoon rain and saturated ground produced flashy hydrographs upstream and slow, wide flooding on the flat lower plain |
Place | Sindh’s low, flat floodplain and dense rural population made it the worst-affected province |
Power | Decisions on embankments, drainage and land use were taken by governments and landowners; the poorest had least say and lost most; internationally, Pakistan pressed high-emitting countries for loss-and-damage funding |
Possibility | More intense monsoon rain is projected, so future outcomes depend on whether floodplain planning, drainage and warnings are improved |
Set beside Room for the River, the case shows the contrast between a high-income country that can afford to give its rivers room, relocate homes and plan for uncertainty, and a lower-middle-income country where large rural populations live on the floodplain, structures were built for irrigation rather than floods, and recovery depends on outside help. Both basins received extreme rainfall, so most of the difference in outcome came from exposure, vulnerability and the measures in place.
To what extent were the impacts of the 2022 floods caused by human factors rather than by the rainfall itself?
Why did Sindh suffer more deaths than any other province?
Which single planning measure would most reduce the impacts of a similar flood in future, and why?
Sources: National Disaster Management Authority (Pakistan), Ministry of Finance and UNOSAT, via Wikipedia, “2022 Pakistan floods”, accessed 2026; World Weather Attribution, Climate change likely increased extreme monsoon rainfall, flooding highly vulnerable communities in Pakistan, 14 September 2022; Wikipedia, “2010 Pakistan floods”, accessed 2026.
Paper 1 questions on flooding usually give a hydrograph, a flood-risk map or a table of river data as the stimulus, and the extended questions ask for an explanation of how physical and human factors cause floods or an evaluation of mitigation in named basins.
The table shows hourly rainfall and discharge for a small river after a storm (hypothetical data).
Time (hours from start) | 0 | 2 | 4 | 6 | 8 | 10 | 12 | 16 | 20 | 24 |
|---|---|---|---|---|---|---|---|---|---|---|
Rainfall (mm h⁻¹) | 3 | 12 | 5 | 1 | 0 | 0 | 0 | 0 | 0 | 0 |
Discharge (m³ s⁻¹) | 8 | 9 | 15 | 34 | 52 | 47 | 36 | 22 | 14 | 10 |
The other common type of essay asks about causes rather than responses.
A storm hydrograph shows a river’s response to rain: lag time runs from peak rainfall to peak discharge, and a flood occurs when discharge exceeds bankfull.
Small, circular, steep basins on impermeable rock with thin soils, sparse vegetation and wet antecedent conditions produce flashy hydrographs; large, elongated, forested, permeable basins produce subdued ones.
River regimes are simple (one seasonal peak, such as snowmelt or monsoon) or complex (several sources and peaks).
Urbanisation, deforestation and channel modification change the hydrograph; building on floodplains and the levee effect increase exposure; both raise flood risk.
Recurrence intervals (T = (n + 1) ÷ m) and flood frequency curves estimate how often floods of a given size occur; a 1-in-100-year flood has a 1% chance each year.
Ensemble weather forecasts, hydrological models and gauges have greatly improved short-term flood forecasting, but flash floods, data gaps and poor communication limit warnings.
Climate models project heavier rainfall extremes but with large regional uncertainty, so designers add climate allowances to design floods.
Structural measures reduce the hazard but can fail and move risk elsewhere; planning measures reduce exposure and vulnerability cheaply but depend on governance.
Room for the River shows a wealthy country giving its rivers space; the 2022 Indus floods show how poverty, floodplain settlement and weak planning turned extreme rain into a disaster.
I can label a storm hydrograph and determine lag time, peak discharge and percentage increase in discharge, with units.
I can explain how at least six natural factors make a hydrograph flashier or more subdued.
I can distinguish simple and complex river regimes using annual hydrographs.
I can explain how urbanisation, deforestation and channel modification change flood frequency, magnitude and distribution, with named examples.
I can determine recurrence intervals and read a flood frequency curve, and explain what a 1-in-100-year flood means.
I can examine how flood forecasting has improved and why uncertainty remains.
I can evaluate structural and planning measures, including who benefits and who loses.
I can compare flood mitigation in the Netherlands and Pakistan with specific figures.
Good answers may be well structured (AO4) and may additionally offer a critical evaluation (AO3) which recognizes that the volume of water supplied over a whole year may come mostly from base flow even in basins where overland flow produces the most visible peaks. Another approach might be to consider how importance differs between places (geology, climate, vegetation) and is altered by human activity (urbanization increases overland flow while reducing groundwater recharge; groundwater abstraction reduces base flow). Annotated hydrographs or regime graphs may be credited.
For 5–6 marks, expect some weakly-evidenced outlining of overland flow and/or base flow as sources of discharge.
For 7–8 marks, expect a structured account which includes:
either well-evidenced explanation of how the contribution of both flows changes during the year
or a discursive conclusion (or ongoing evaluation) grounded in geographical concepts and/or perspectives.
For 9–10 marks, expect both of these traits.
NB. Maximum [6] if there is no consideration of different times of the year.
Marks | Level descriptor |
|---|---|
0 | The response does not reach a standard described by the descriptors below. |
1–2 | Too brief, lists unconnected information, not focused on the question and lacks structure. Knowledge is very general, with large gaps or errors; examples or case studies are missing or only listed. No analysis; terminology is missing or used incorrectly. |
3–4 | Too general, lacks detail, not focused on the question and largely unstructured. Outlines examples, statistics and facts, both relevant and irrelevant, with links to the question only listed. Basic terminology is used, with errors or inconsistently. No critical evaluation of evidence; any conclusion is irrelevant. |
5–6 | Partially addresses the question, with a narrow argument, an unsubstantiated conclusion and limited evaluation. Describes relevant supporting evidence (examples, case studies) and outlines links to the question. The argument repeats one point or covers only part of the question. Other perspectives, or strengths and weaknesses of evidence, are listed. |
7–8 | Addresses the whole question; the analysis is evaluated and the conclusion is relevant but lacks balance. Relevant evidence is described correctly and covers all the main points. The argument is clear but one-sided or unbalanced. Complex terminology is used correctly but not consistently. Other perspectives, or strengths and weaknesses of evidence, are described. |
9–10 | In-depth and specific to the question (topic and command term). Correct, relevant examples, statistics and detail are integrated and their link to the question explained. The argument is balanced, explaining complexity, exceptions and comparisons. Evaluation of evidence and perspectives is well developed, and the conclusion is balanced and aligned with the evidence. Logically structured and easy to follow. |
Examine the relative importance of geology and seasonality in influencing the shape of storm hydrographs.
10 marks
Examine why the same amount of rainfall can produce very different flood responses in different drainage basins.
10 marks