Use a systems approach to compare the energy efficiency, water footprints and sustainability of food production, explain variations in food consumption, and analyse the diffusion of innovations and vector-borne and water-borne diseases.
Each is in the Geography glossary, with every other term in the subject.
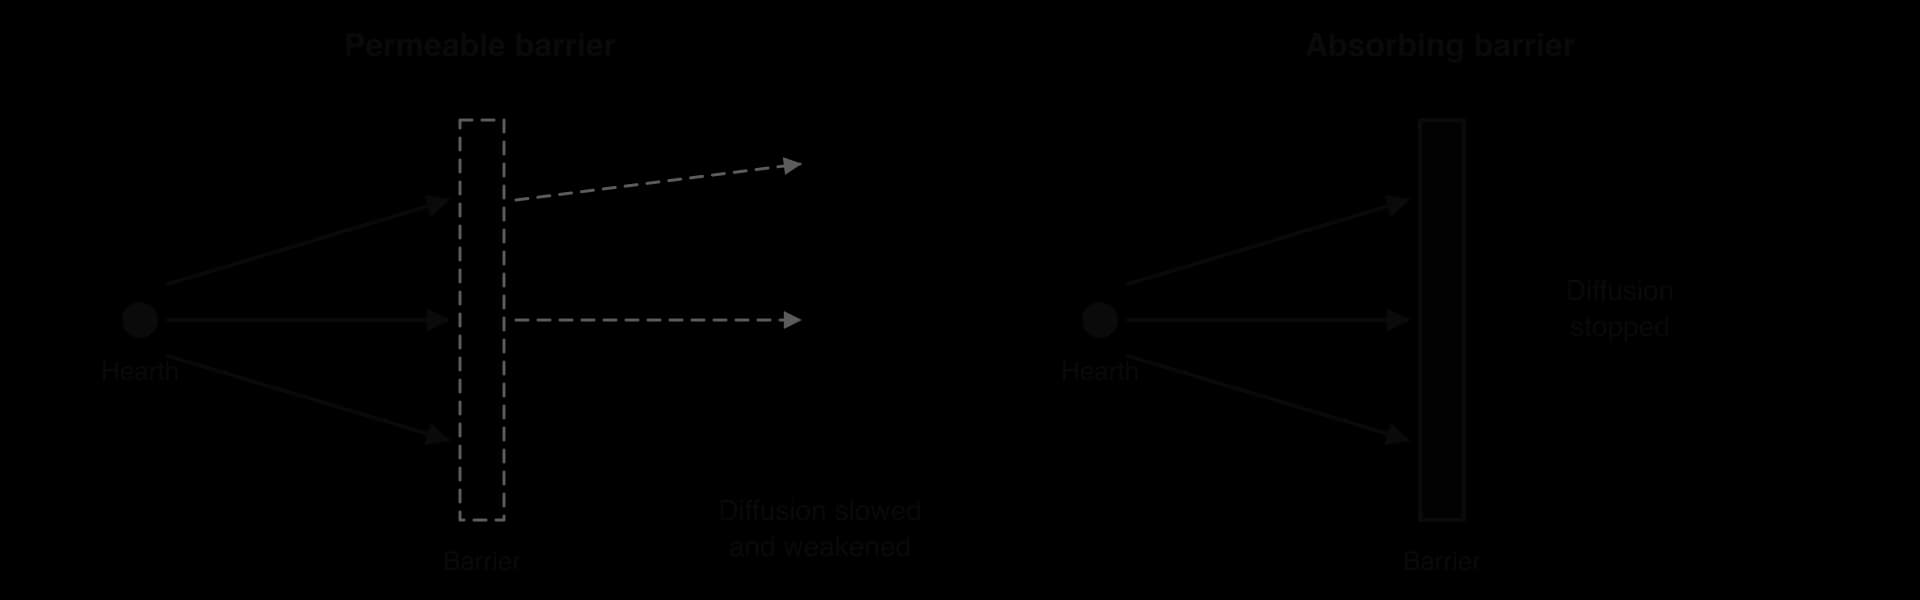
A barrier that halts diffusion completely, so that the phenomenon cannot pass beyond it.
The stage in diffusion at which a person, household or place takes up an innovation or, for a disease, becomes infected (acquisition).
An S-shaped graph of the cumulative percentage of adopters of an innovation over time, rising slowly, then rapidly, then levelling off at saturation.
Any physical, economic, political, cultural or informational obstacle that slows or prevents the spread of an innovation, idea or disease.
The part of a water footprint made up of surface water or groundwater withdrawn, for example for irrigation, and not returned to the source it came from.
An acute diarrhoeal disease caused by the bacterium Vibrio cholerae, spread through food or water contaminated with faeces, which can kill through dehydration within hours.
Farming in which crops or livestock are produced mainly for sale, with the aim of making a profit.
Expansion diffusion through direct contact between people or neighbouring places, so that spread is strongly affected by distance from the hearth.
Describe a farm or food chain as an open system of inputs, stores, transfers and outputs, and classify farming systems.
Compare the energy efficiency and water footprints of contrasting food production systems, using real data.
Evaluate the merits and limitations of a systems approach for judging the relative sustainability of food production in different places.
Explain the physical and human processes that lead to variations in food consumption.
Distinguish between expansion (contagious and hierarchical) and relocation diffusion, and explain adoption and Hägerstrand’s model.
Examine how physical, economic and political barriers affect the rate of diffusion of agricultural innovations and diseases.
Explain the geographic factors that contribute to the incidence, diffusion and impacts of vector-borne and water-borne diseases.
Analyse a detailed example of a vector-borne disease (dengue in Bangladesh) and of a water-borne disease (cholera in Yemen).
What people eat, and which diseases they catch, both depend on processes that move energy, water, ideas and pathogens through space. A rice paddy in the Philippines and a vegetable greenhouse in Türkiye turn energy and water into food at very different rates, and a new crop variety or a new virus spreads from one place to another along roads, rivers, trade routes and flight paths.
The topic is centred on process: physical and human processes change food production and consumption, and the same process of diffusion carries both agricultural innovations and diseases. Place shapes the outcome, because climate, poverty, housing, water supply and government shape whether an innovation is adopted or a disease takes hold. Questions of
83 exam-style questions on this subtopic, written in the style of the IB papers. The first has its markscheme open. Counted on
To what extent can aquaculture meet the growing global demand for fish without creating new environmental problems?
10 marks
Marks should be allocated according to the markbands.
Aquaculture is the farming of aquatic animals and plants (fish, shrimp, shellfish, seaweed) in freshwater ponds, coastal enclosures or open-water cages. Since wild capture fisheries plateaued at around 90 million tonnes a year from the late 1980s, aquaculture has supplied almost all of the growth in fish production, and by 2022 it produced just over half of aquatic animals. The question has two elements: the ability to meet demand and the environmental impact. Do not expect perfect balance between them.
Possible applied themes (AO2) demonstrating knowledge and understanding (AO1):
Production growth: China produces more than half of the world's aquaculture output; Indonesia, India, Vietnam, Bangladesh and Norway are also major producers; aquaculture provides food security and jobs in rural and coastal areas.
Mangrove loss: large areas of mangrove were cleared for shrimp ponds in Thailand, Ecuador, Indonesia and Bangladesh, removing nursery habitat for wild fish and natural coastal protection.
Pollution: waste feed, faeces, antibiotics and chemicals cause eutrophication and algal blooms near cages and ponds.
Disease and parasites: sea lice from Norwegian and Scottish salmon farms infect wild salmon; an outbreak of infectious salmon anaemia in Chile from 2007 caused a collapse in output and job losses.
Escapes of farmed fish interbreed with or compete with wild stocks.
Feed: carnivorous species (salmon, shrimp) depend on fishmeal and fish oil from wild species such as Peruvian anchoveta, so aquaculture can increase pressure on wild stocks; plant-based and insect-based feeds reduce this.
With a free account, Augment remembers where you stopped and what you have practiced.
The spread of a phenomenon, such as an innovation, an idea or a disease, from its place of origin across space and over time.
Describing a disease that is constantly present in a particular population or region at a fairly stable, expected level.
The food energy produced by a farming system divided by the energy put into it from labour, animals and fossil fuels; a value above 1 means more energy is produced than used.
A sudden increase in the number of cases of a disease well above the level normally expected in a population or area.
Diffusion in which a phenomenon spreads to new areas while remaining present in its place of origin, so that the total area or number affected grows.
Farming that uses low inputs of labour and capital per unit of land over large areas, producing low yields per hectare.
A type of agriculture defined by its combination of inputs, processes and outputs, such as subsistence or commercial, intensive or extensive, and arable, pastoral or mixed farming.
The distance food travels from where it is produced to where it is consumed, used as a rough indicator of the environmental impact of transporting food.
The part of a water footprint made up of rainwater stored in the soil and used by plants, then lost through evapotranspiration.
The part of a water footprint equal to the volume of freshwater needed to dilute the pollutants released in making a product to an agreed water quality standard.
A model (1953) in which an innovation spreads outward from an innovation centre through primary, diffusion, condensing and saturation stages, mainly by personal contact, declining with distance.
The place where a phenomenon, such as an innovation or a disease, originates and from which it diffuses; the source of diffusion.
Expansion diffusion through an ordered sequence of places or people, typically from large, well-connected cities or influential groups down to smaller places.
A crop variety bred to give much larger yields per hectare than traditional varieties, usually when supplied with enough water, fertiliser and pesticide.
The number of new cases of a disease in a population during a given period, often expressed per 1,000 or per 100,000 people per year.
Farming that uses high inputs of labour, capital, fertiliser or technology per unit of land to obtain high yields from a relatively small area.
A vector-borne disease caused by Plasmodium parasites and spread to humans by the bites of infected female Anopheles mosquitoes, causing fever, anaemia and, if untreated, death.
The tendency for people to adopt an innovation, or acquire a disease, after contact with nearby people who already have it, so that diffusion reaches nearby places first.
A microorganism, such as a virus, bacterium, protozoan or fungus, that causes disease in the organism it infects.
A barrier that slows or weakens diffusion but allows part of the phenomenon to pass through.
The total number or proportion of people in a population who have a disease at a particular time, including both new and existing cases.
Diffusion in which a phenomenon is carried to a new area by people who migrate or travel, so that it may leave or weaken in its place of origin.
Farming in which most of the food produced is eaten by the farmer’s household, with little or no surplus left for sale.
A method of studying a farm or food chain as an open system of inputs, stores, transfers and outputs, so that flows of energy, water and materials can be measured and compared between places.
A living organism, usually an insect such as a mosquito or tick, that carries a pathogen from one host to another.
A disease caused by pathogens transmitted through water contaminated with human or animal faeces, usually by drinking it or preparing food with it, such as cholera and typhoid.
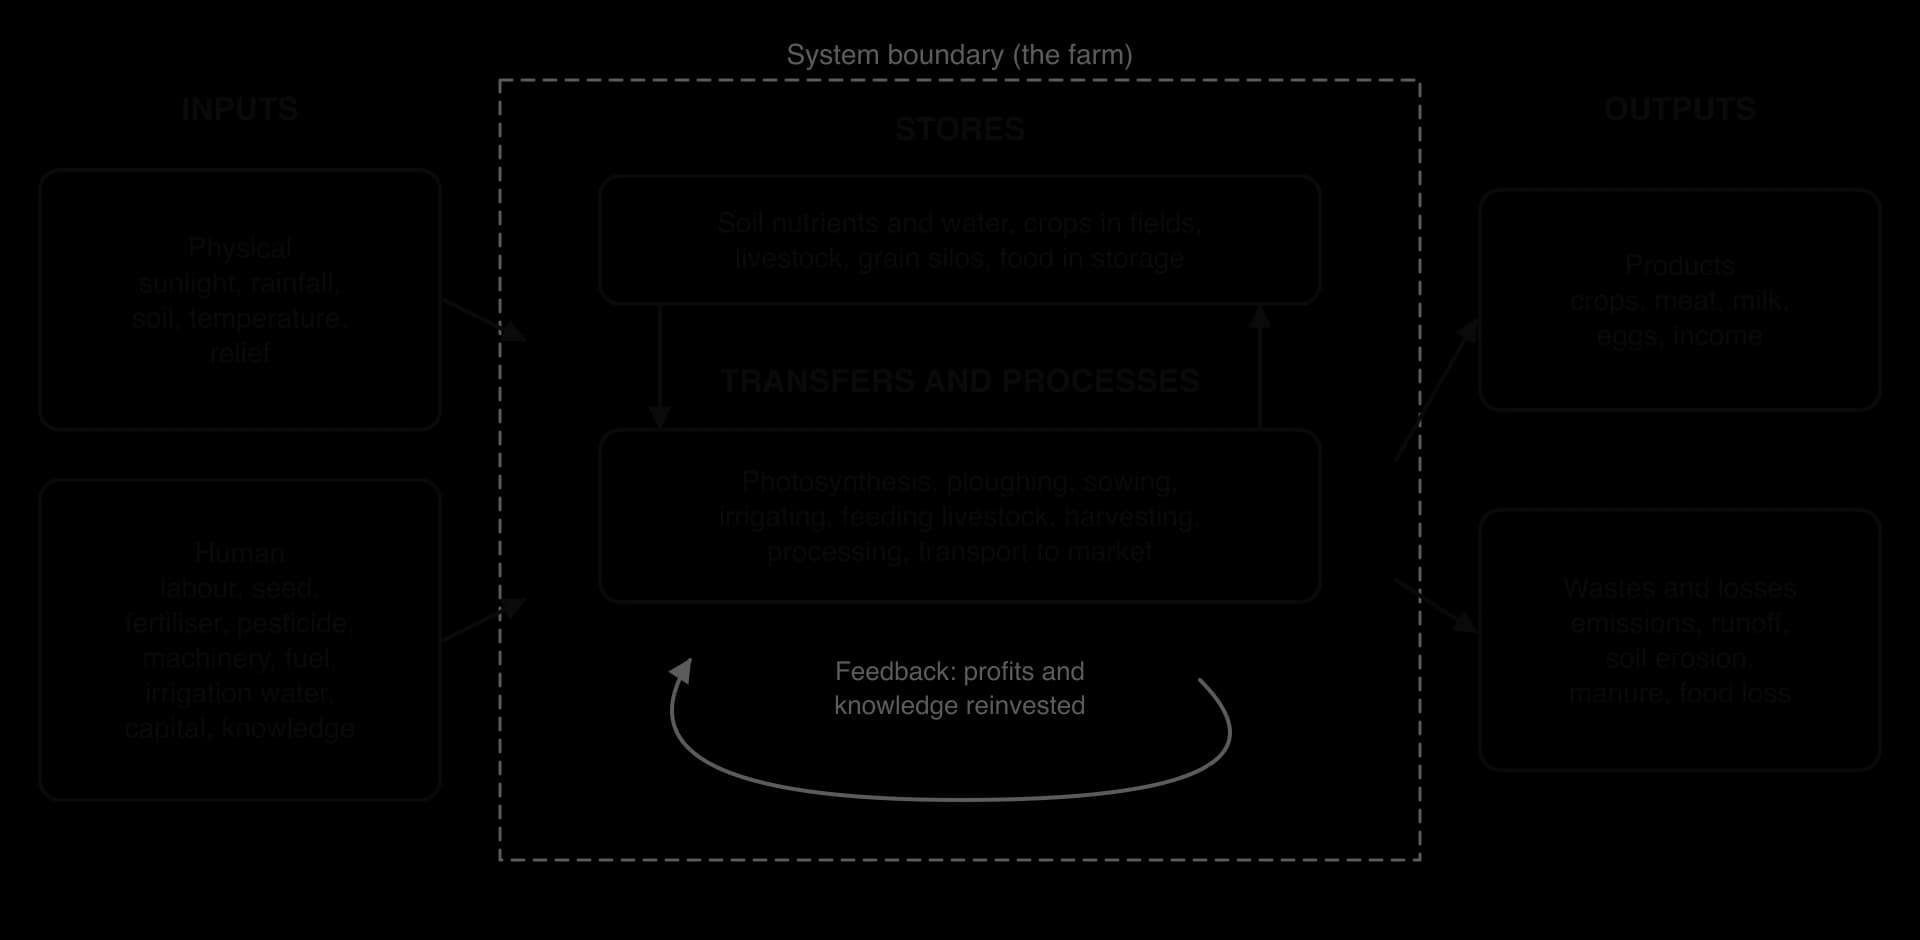
A systems approach studies a farm, or a whole food chain, as a set of linked parts through which energy, water, materials and money flow. A farm is an open system: it receives inputs from outside and sends outputs beyond its boundary. Thinking of it this way allows very different farms to be compared using the same measures, such as how much energy or water goes in for each unit of food that comes out.
Inputs are physical (sunlight, rainfall, soil, temperature, relief) and human (labour, seed, fertiliser, pesticides, machinery, fuel, irrigation water, capital and knowledge).
Stores hold energy, water and materials within the system: soil nutrients and soil water, crops growing in fields, livestock, grain in silos, and food in storage or transit.
Transfers and processes move or change them: photosynthesis, ploughing, sowing, irrigating, feeding livestock, harvesting, processing and transport.
Outputs leave the system: crops, meat, milk and income, but also greenhouse gas emissions, fertiliser runoff, eroded soil, manure and food lost after harvest.
The system also has feedback. Profits can be reinvested in machinery or irrigation, raising future inputs; soil erosion lowers future yields, reducing output. Feedback is why a farm that looks productive in one year may not be sustainable over decades.
A farming system is a distinctive combination of inputs, processes and outputs used to produce food in a particular place. Farming systems are classified by three main contrasts:
Subsistence farming produces food mainly for the farming household itself, with little left to sell. Commercial farming produces crops or livestock to sell for profit, often specialising in one product. Many smallholders sit between the two, selling a surplus in good years.
Commercial farms range from family-run holdings to the plantations and feedlots of large companies.
Intensive farming uses large inputs of labour or capital per hectare to obtain high outputs from a small area. Extensive farming uses small inputs per hectare over a large area, so output per hectare is low even if output per worker is high.
Extensive farming suits places where land is cheap or poor, such as semi-arid rangeland or the margins of tropical forest.
A third contrast is between arable farming (crops), pastoral farming (livestock) and mixed farming (both). Combining the three contrasts describes most systems in the world:
Farming system | Classification | Main inputs | Example |
|---|---|---|---|
Wet-rice farming | Subsistence or commercial; labour-intensive; arable | Monsoon rain and river water, family labour, buffalo or small tractors | Mekong delta, Viet Nam; Luzon, Philippines |
Shifting cultivation | Subsistence; extensive; arable | Forest cleared by hand and burnt; no fertiliser; land rested for years | Indigenous communities in the Amazon basin |
Cereal farming | Commercial; capital-intensive per worker but extensive per hectare; arable | Large machinery, fertiliser, pesticides, genetically modified seed | Corn Belt of the Midwest, USA |
Feedlot beef | Commercial; intensive; pastoral | Grain and soy feed grown elsewhere, water, veterinary drugs, energy | Great Plains, USA |
Glasshouse horticulture | Commercial; very capital-intensive; arable | Heating, artificial light, hydroponic nutrients, CO₂ enrichment | Westland, Netherlands; Almería, Spain (unheated plastic greenhouses) |
Pastoral nomadism | Subsistence; extensive; pastoral | Natural grazing and water holes, herders’ knowledge | Maasai herders, Kenya and Tanzania |
Food is a store of energy. A systems approach can compare farming systems by asking how much food energy comes out for each unit of energy put in. The energy efficiency ratio divides the energy content of the food produced by all the energy used to produce it: human and animal labour, and the fossil fuel energy used to make fertiliser, run machinery, pump water, heat glasshouses and transport inputs.
A ratio above 1 means the system produces more food energy than it consumes. Traditional, low-input systems often have high ratios, because sunlight, rain and human labour are almost their only inputs. Industrial systems add large amounts of fossil-fuel energy, so their ratios can fall close to or below 1, even though their output per hectare and per worker is far higher.
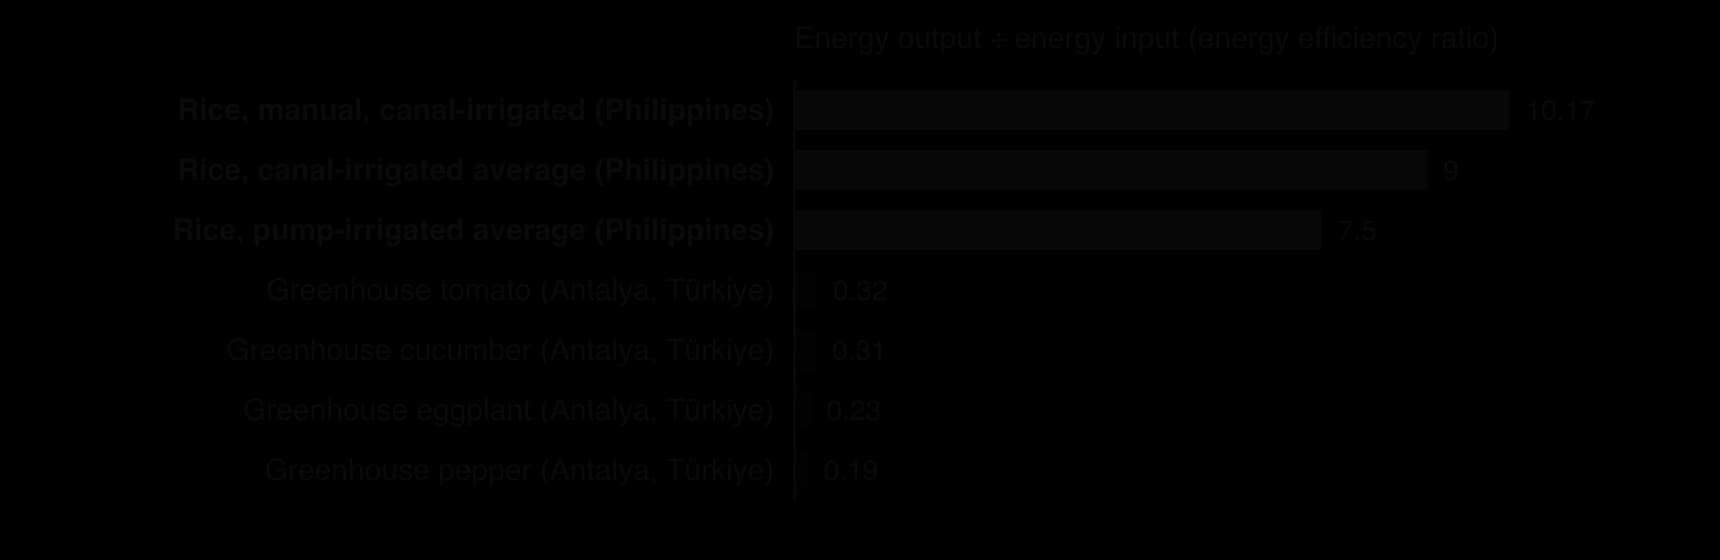
The chart shows two real studies. On irrigated rice farms in the Philippines the average ratio was 9.0 on canal-irrigated farms and 7.5 on farms that used diesel pumps; farms where work was done mainly by hand had the highest ratio, 10.17. Greenhouse vegetables in Antalya, Türkiye, had ratios between 0.19 (pepper) and 0.32 (tomato): fuel, fertiliser, electricity and plastic used more energy than the vegetables contained. Feedlot livestock systems have even lower ratios, because animals turn most of the energy in their feed into heat and movement rather than meat.
Sources: Bautista, E.G. and Minowa, T., Philippine Agricultural Scientist 93(3), 2010; Canakci, M. and Akinci, I., Energy 31(8), 2006.
The water footprint of a product, a measure from the core unit on resource consumption, is the total volume of freshwater used to produce it, measured along its whole supply chain, usually in litres per kilogram. The Water Footprint Network divides it into three components:
Green water: rainwater stored in the soil and used by plants, then lost through evapotranspiration.
Blue water: surface water and groundwater taken from rivers, lakes and aquifers, for example for irrigation, that is not returned to the same source.
Grey water: the volume of freshwater needed to dilute the pollutants a product releases, such as fertiliser and pesticide runoff, to meet water quality standards.
The blue component matters most for water scarcity, because it competes with drinking water, industry and ecosystems.
The grey component turns pollution into a volume of water, so that it can be added to the other two.
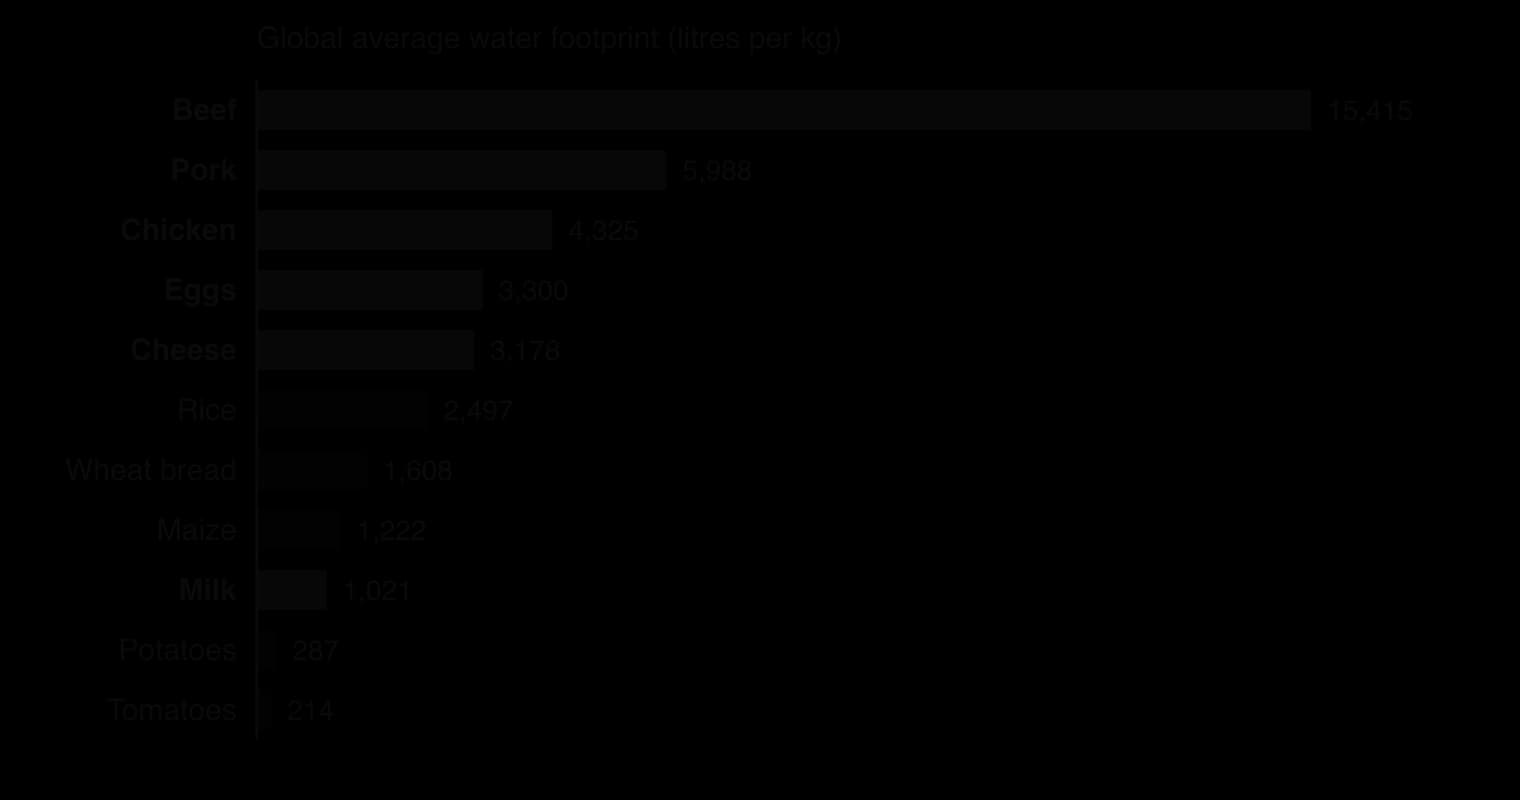
The global averages hide large differences between places. A kilogram of rice grown with monsoon rain in Bangladesh has a mostly green footprint, while rice irrigated from rivers or groundwater in a dry region has a large blue footprint. Beef from cattle grazing rain-fed pasture uses mainly green water; beef from feedlots fed with irrigated maize uses more blue and grey water. Water is also traded inside food: a country that imports wheat imports the embedded water used to grow it, which is how water-scarce countries such as Egypt and Saudi Arabia save their own water.
A food system is sustainable if it can keep producing food without degrading the soil, water, climate and communities it depends on. A systems approach compares places on several measures at once: energy ratio, water footprint (especially blue water), greenhouse gas emissions per kilogram, effects on soil and biodiversity, food miles and resilience to drought or price shocks.
Food miles alone can mislead. Tomatoes grown in the plastic greenhouses of Almería in southern Spain travel more than 2,000 km by lorry to the UK.
Yet a case study for the UK government (DEFRA) suggested that they may have a lower energy-based carbon footprint than tomatoes grown in heated UK glasshouses, because Spanish sunshine replaces gas heating. A similar 2006 study at Lincoln University found that New Zealand lamb, shipped across the world, used about a quarter of the energy per kilogram of UK lamb, because New Zealand’s animals graze outdoors all year. The Almería system has its own sustainability problems, however: it depends heavily on blue water from aquifers in one of Europe’s driest regions, and on low-paid migrant labour.
Sources: Wikipedia, "Food miles", citing DEFRA (2005) and Saunders et al., Lincoln University (2006); Weber and Matthews, Environmental Science & Technology (2008).
Studies of whole food chains generally find that transport is a small part of food’s emissions: one widely cited US study estimated that transport from producer to retailer made up only about 4% of food-related greenhouse gas emissions, and concluded that eating less red meat and dairy cuts emissions more than buying local food, because most emissions come from production rather than transport.
Growing water-hungry crops in arid regions shows how a system can be productive but unsustainable. Irrigated cotton and rice in the drylands of Central Asia drew so much blue water from the Amu Darya and Syr Darya that the Aral Sea shrank to a fraction of its former size. Rain-fed wheat on the plains of Canada or Ukraine has a much smaller blue water footprint per kilogram, though it may have high fertiliser and fuel inputs. Each system is more sustainable on some measures and less on others.
Merits | Limitations |
|---|---|
Makes very different systems comparable using common units (kcal, litres per kg) | Simplifies complex, changing systems into a few flows; values are often estimates |
Shows where energy and water are lost, and where efficiency could be improved (for example drip irrigation, less fertiliser) | Results depend on where the boundary is drawn: farm gate, or the whole chain including processing, transport and waste |
Shows hidden flows, such as embedded water in trade and fossil fuel in fertiliser | Ignores social sustainability: labour conditions, farmers’ incomes, land rights, food culture |
Supports policy and consumer choice with evidence (labels, water pricing) | Global averages hide differences between places, seasons and farms; green and blue water are not equally scarce |
The systems approach is therefore most useful as a framework for asking the right questions about sustainability, rather than as a single answer. It works best when several measures are used together and when the results are interpreted for a particular place: a litre of blue water used in Almería matters far more than a litre of green water in Ireland.
How much food people eat, and what kind, varies between places and over time because of processes that affect both the supply of food and people’s ability to obtain it. Some are physical, such as the climate and natural hazards; most are human, such as income, prices, trade, culture and conflict. The nutrition transition describes the long-term change these processes produce as societies develop; the processes themselves also cause short-term changes, from one harvest or price shock to the next.
Climate and the growing season. Temperature, rainfall and the length of the growing season determine which crops can be grown locally and how many harvests a year are possible: two or three rice crops a year in the irrigated Mekong delta, one short season of millet and sorghum in the Sahel.
Soils and relief. Fertile alluvial and volcanic soils support dense farming populations, such as those of the Ganges plain and Java; thin, steep or salty soils limit output.
Water availability. Rain-fed farming is vulnerable to irregular rainfall; irrigation raises and stabilises yields but depends on rivers and aquifers that may be over-used.
Natural hazards and pests. Droughts, floods and tropical cyclones destroy crops and food stores. Between 2019 and 2021 desert locust swarms, which bred in desert areas of the Arabian Peninsula after unusually heavy cyclone rains, spread across East Africa and South Asia: Kenya suffered its worst outbreak in over 70 years and Ethiopia its worst in 25 years.
Climate change. Rising temperatures, changing rainfall and more frequent extreme events are reducing yields of some crops in hot regions, while lengthening growing seasons at higher latitudes; these are consequences of global climate change.
Sources: Wikipedia, "2019–2021 locust infestation", citing FAO, 2026.
Income and food prices. Poor households spend a large share of their income on food, so price rises force them to eat less or to switch to cheaper staples. The global food price crises of 2007–08 and of 2022, after the war in Ukraine disrupted grain and fertiliser exports, pushed millions of people into food insecurity.
Trade and globalisation. Imports allow diets far beyond what a country can grow. Japan, with little farmland, depends heavily on imported grain and soybeans; Gulf states import most of their food. Trade also exposes importers to price shocks and export bans.
Culture and religion. Religious rules, festivals and fasting, and ideas about which foods are acceptable, shape consumption (halal and kosher food, Hindu vegetarianism, fasting in Ramadan and Lent).
Urbanisation and retailing. City dwellers buy more of their food, and more processed food, from supermarkets and street vendors.
Technology and storage. Refrigeration, canning and cold chains allow perishable foods to be eaten far from where they are produced and out of season.
Conflict. War destroys farms, markets, roads and water systems, displaces farmers and can be used deliberately to cut off food supplies, as in Yemen and Sudan.
Government policy. Subsidies (bread in Egypt), rationing and public distribution systems (India), school meals and food taxes all change what people buy and eat.
Education, gender and advertising. Knowledge of nutrition, who controls household spending, and marketing by food companies all influence choices; the power of companies and gender roles are questions of stakeholder power.
Food waste. In high-income countries much food is bought but never eaten, so consumption is lower than supply.
Process | Short-term effect on consumption | Long-term effect on consumption | Example |
|---|---|---|---|
Drought or locust plague | Harvest fails; prices rise; households eat less and sell assets | Repeated shocks reduce savings and herds, deepening vulnerability | East Africa, 2019–2021 |
Food price spike | Poor urban households cut meals and diet quality | Governments expand subsidies or reserves | Global, 2007–08 and 2022 |
Rising income and urbanisation | More food bought, more meals eaten out | Nutrition transition: more meat, oils, sugar, processed food | China, Mexico |
Conflict | Markets close; food aid becomes essential | Farming systems collapse; famine risk | Yemen from 2015; Sudan from 2023 |
These processes interact. A drought raises prices most where incomes are low, markets are poorly connected and governments are weak, so the same rainfall shortage can cause a small price rise in one country and a food crisis in its neighbour. Variations in consumption are therefore explained best by combining physical triggers with the human conditions that turn them into shortages.
Diffusion is the spread of a phenomenon, such as an idea, a technology, a crop or a disease, over space and through time from a place of origin. The place where it begins is its hearth. The same spatial processes explain why a new rice variety spreads quickly through Punjab and slowly through the Sahel, and why a virus reaches distant capital cities before villages close to its source.
Geographers map diffusion with time-sequence maps (one map per date), isoline maps joining places that adopted at the same date, and choropleth maps of the date of first adoption or first case.
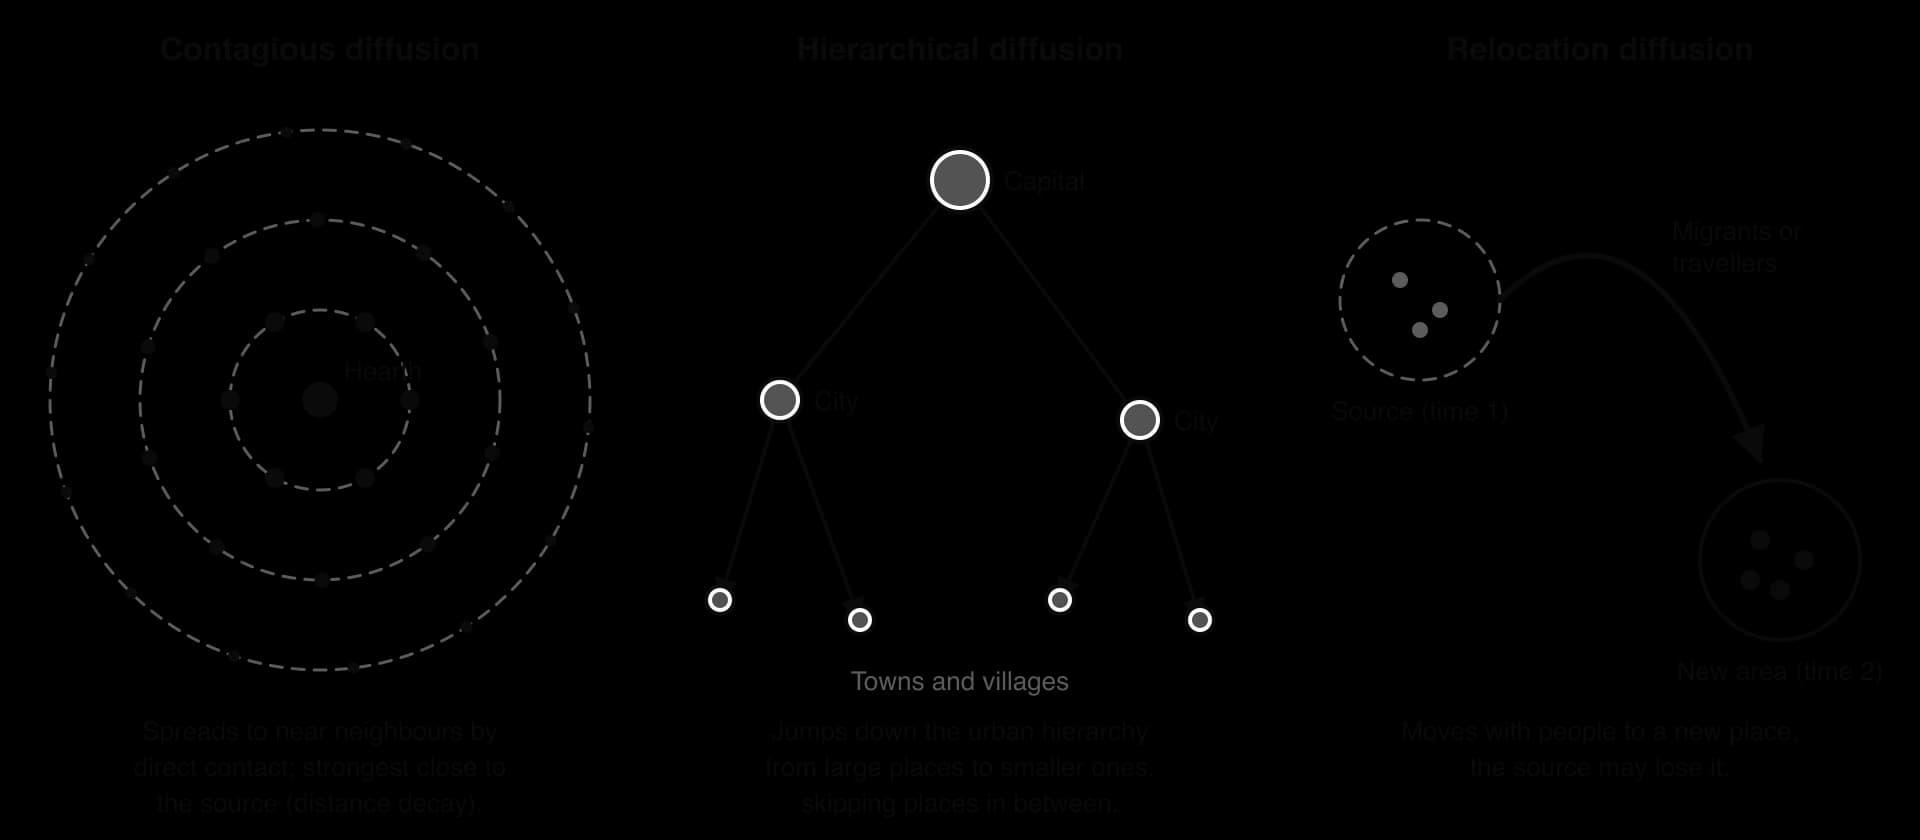
In expansion diffusion, a phenomenon spreads outwards to new places while remaining, and often strengthening, in the place where it started. The number of people or places affected grows. It takes two forms.
Contagious diffusion spreads through direct contact from one person or place to its neighbours, so it is strongly affected by distance: places close to the hearth are reached first, and the chance of contact falls with distance (distance decay). Ebola in West Africa spread in this way: the epidemic is believed to have begun with a young child in Méliandou, Guinea, in December 2013, and spread through close contact with sick people and with bodies during funerals, across porous borders into Liberia and Sierra Leone. By 2016, 28,616 people had been infected and 11,310 had died.
Hierarchical diffusion spreads through an ordered sequence of places or people, usually from large cities to smaller ones, or from more powerful or connected groups to others, skipping places in between. COVID-19 spread hierarchically in early 2020: from Wuhan it moved first along air routes to major international hubs such as Seoul, Milan, London and New York, and only later down the urban hierarchy to smaller towns and rural areas. Agricultural innovations often spread the same way, from large commercial farmers with capital and contacts to smaller farmers.
In relocation diffusion, a phenomenon moves to a new place with people who migrate or travel, and may leave its place of origin behind. Cholera reached Haiti in this way in October 2010: it had not been confirmed there for over a century, and investigators traced it to infected UN peacekeepers from Nepal whose camp drained into a tributary of the Artibonite River. Within ten weeks it had reached all ten of Haiti’s departments, and by 2018 there had been more than 800,000 cases and about 9,600 deaths. Crops spread by relocation too: maize, potatoes and cassava were carried from the Americas to Africa, Asia and Europe after 1492.
Sources: Wikipedia, "Western African Ebola epidemic" and "2010s Haiti cholera outbreak", citing WHO and the UN, 2026.
Diffusion happens one person, farm or place at a time. Adoption (for diseases, acquisition) is the stage at which a person or place takes up an innovation or becomes infected. The rate of adoption over time usually follows an S-shaped adoption curve: a slow start while only a few people know about the innovation, a rapid take-off as it becomes familiar and its benefits visible, and a slowdown as almost everyone who will adopt has done so.
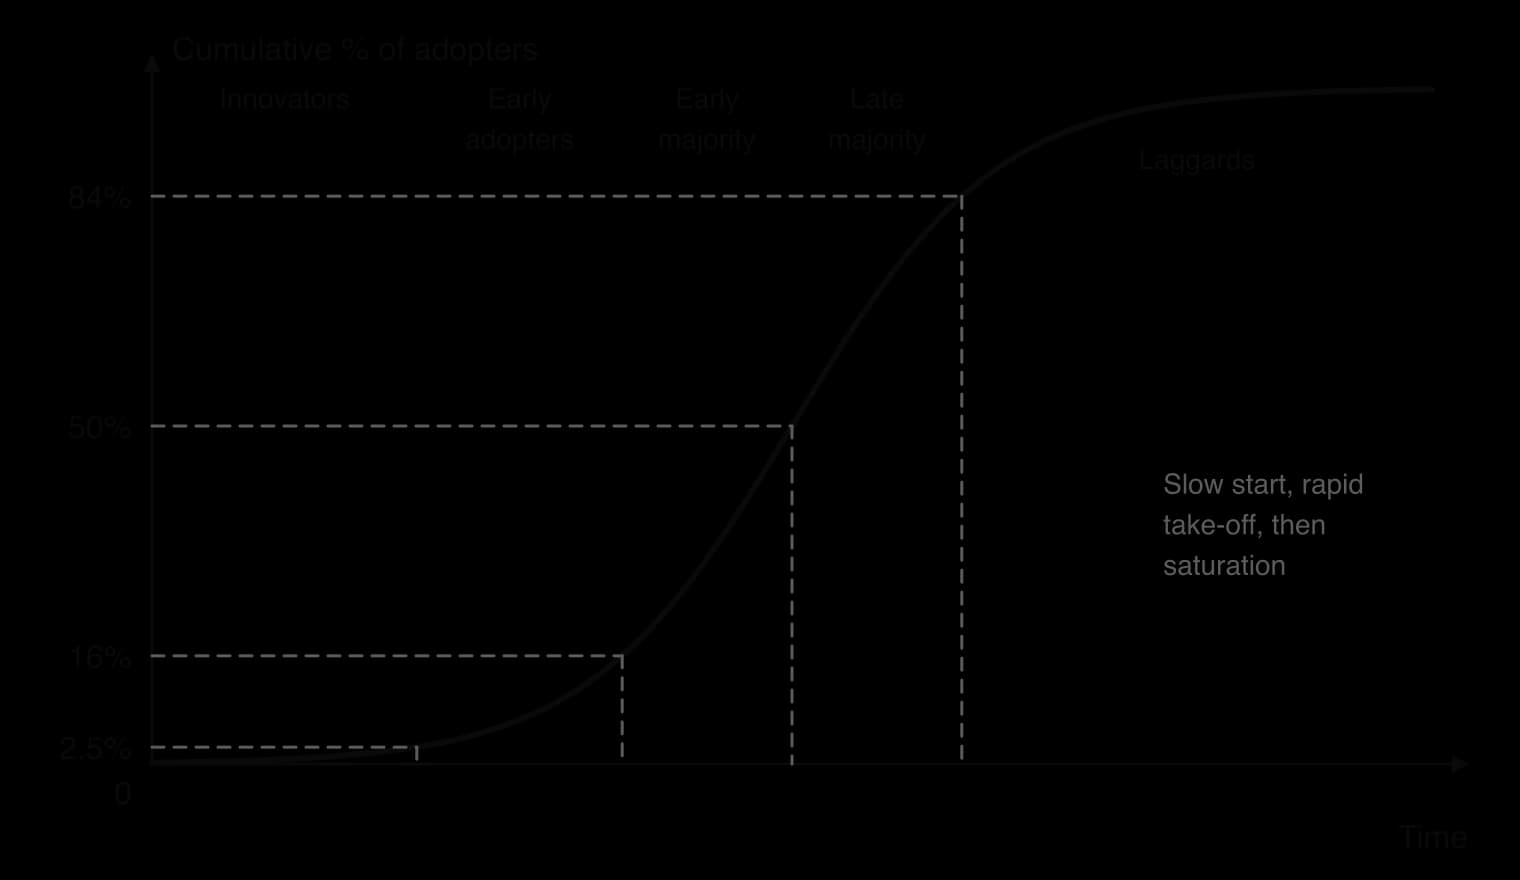
Rogers’ adopter categories describe who adopts when. Innovators (the first 2.5%) are willing to take risks and usually have money and outside contacts; early adopters (13.5%) are respected local leaders; the early majority (34%) and late majority (34%) follow once an innovation is proven; laggards (16%) are slowest, often because they are poorest, oldest or most isolated. In farming, the first adopters of a new seed are typically farmers with irrigation, credit and good roads.
The Swedish geographer Torsten Hägerstrand studied the spread of farming innovations in his doctoral thesis of 1953 (published in English in 1967 as Innovation Diffusion as a Spatial Process), and used computer simulation (Monte Carlo methods) to model it. Hägerstrand’s diffusion model describes diffusion as waves spreading from an innovation centre through four stages:
Primary stage: adoption begins at the innovation centre, with a sharp contrast between the centre and remote areas.
Diffusion stage: rapid spread outward as new centres of adoption form, reducing the contrasts between places.
Condensing stage: adoption becomes even across the area; growth slows in the centre but continues further out.
Saturation stage: almost everyone who will adopt has done so, and spread stops.
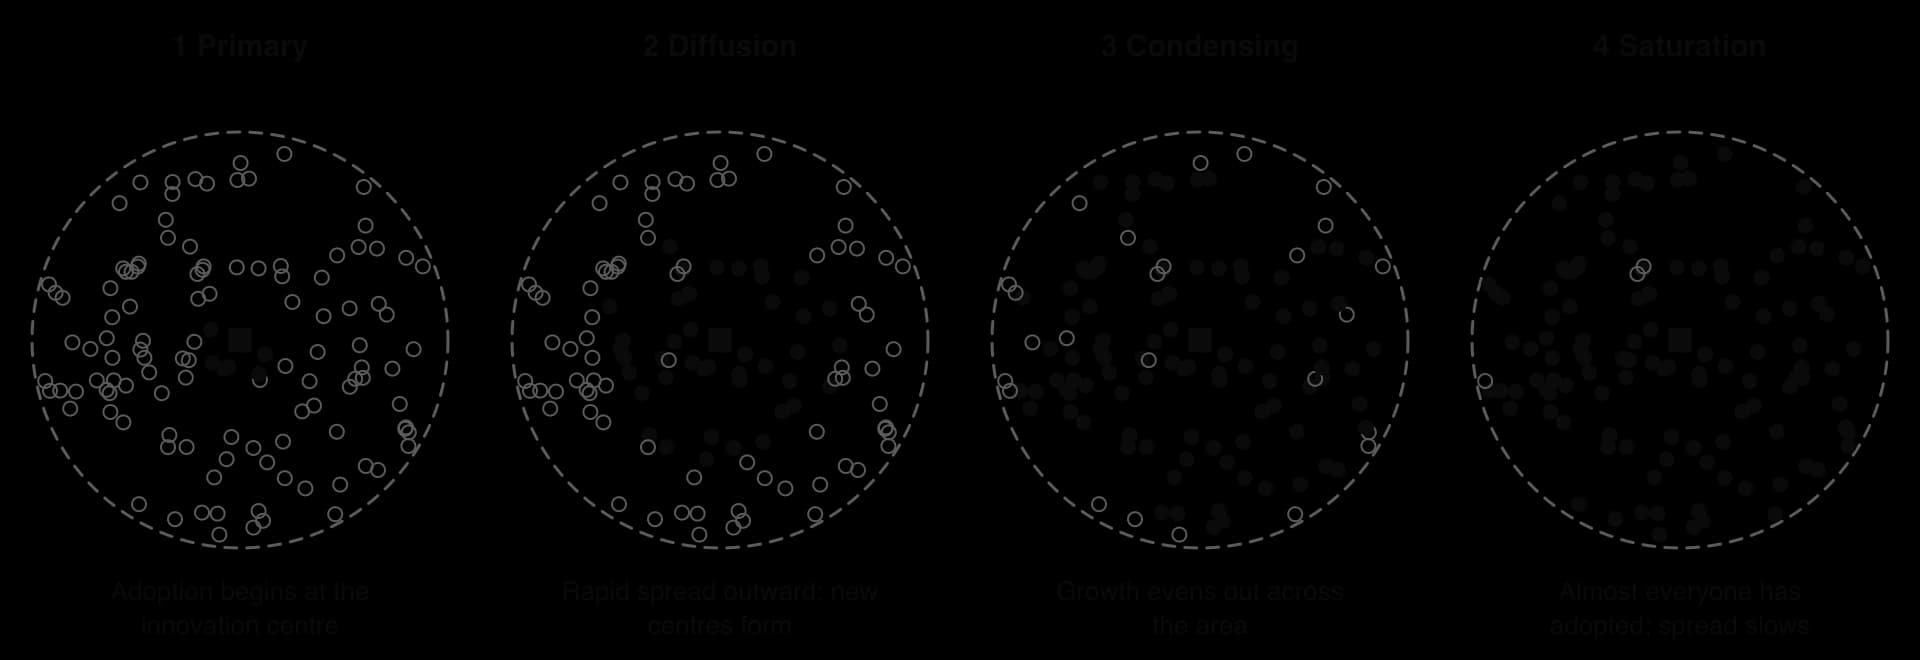
The key mechanism is the neighbourhood effect: people are most likely to learn about and copy an innovation from people who live near them, so adoption spreads first to neighbours of earlier adopters. Because personal contact falls with distance, adoption also shows distance decay.
Strengths | Limitations |
|---|---|
Explains contagious diffusion well, with clear, testable stages and the neighbourhood effect | Assumes that space is uniform; in reality mountains, rivers, borders and roads channel diffusion |
Its simulation methods allowed geographers to model diffusion mathematically | Underplays hierarchical diffusion through cities, networks and air travel |
Fits many agricultural innovations and contagious diseases in rural areas | Developed before mass media and the internet, which spread information instantly to distant places |
Highlights the role of information and personal contact in adoption | Ignores the role of government policy, prices and companies, which can force or block adoption |
The rate of diffusion depends on what lies between the hearth and the places it might reach. A barrier to diffusion is any physical, economic, political, cultural or informational factor that slows or stops the spread of a phenomenon.
Barriers differ in strength. An absorbing barrier stops diffusion completely, as a strict quarantine or an ocean without transport links can stop a disease.
A permeable barrier lets some of the phenomenon through but slows and weakens it, as a mountain range or a high price slows the adoption of a new seed. Most real barriers are permeable.
Type of barrier | Effect on agricultural innovations | Effect on diseases |
|---|---|---|
Physical | Climate, soils and water limit where a crop or variety can grow; mountains and deserts isolate farmers | Temperature, rainfall and altitude limit vectors such as mosquitoes; oceans slowed diseases before air travel |
Economic | Cost of seed, fertiliser and irrigation; lack of credit; poor roads and markets | Poverty slows diffusion where people travel little, but speeds it where poor housing and sanitation help pathogens spread |
Political | Bans or approval rules for new crops (the EU’s restrictions on GM crops); subsidies; land tenure | Quarantines, border closures and travel bans (West Africa, 2014; COVID-19, 2020); conflict that blocks vaccination |
Cultural and informational | Distrust of new methods; language; low literacy; no extension advisers | Burial customs, stigma and misinformation can speed spread or hinder control |
The Green Revolution, examined in the core unit on resource stewardship, is the spread of a package of high-yielding varieties (HYVs) of wheat and rice, together with irrigation, chemical fertiliser and pesticides, from the 1960s. IR8, a semi-dwarf rice released by the International Rice Research Institute in the Philippines in 1966, could double yields where it had enough water and fertiliser. In India the new varieties were introduced first in Punjab in 1966–67, then spread to Haryana and western Uttar Pradesh.
The pattern of diffusion shows clear barriers. Punjab was the hearth because it had irrigation canals and tubewells, flat land, larger farms and a strong agricultural university; within India, adoption was faster among richer farmers who could afford the package and borrow money, which is hierarchical diffusion within rural society. Eastern India, with more small farms and less irrigation, followed later.
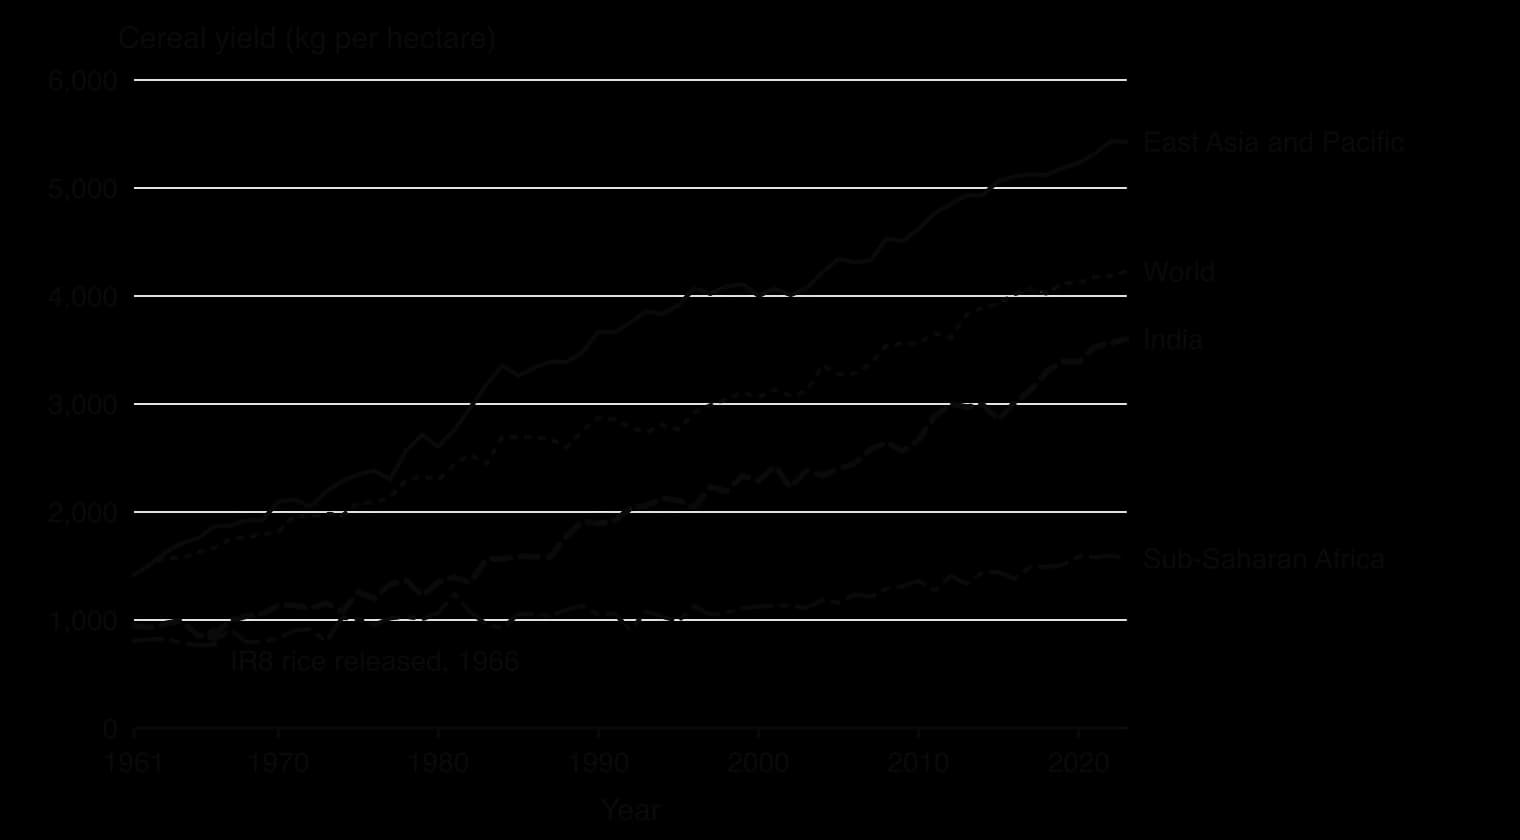
The chart shows how unevenly the innovation diffused. India’s cereal yield rose from about 860 kg per hectare in 1966 to about 3,600 in 2023, while sub-Saharan Africa’s rose only from about 770 to 1,570. The barriers in Africa were physical (most farming is rain-fed, and the first HYVs were wheat and rice, not the region’s main staples of maize, sorghum, millet and cassava), economic (poor roads, little credit and costly fertiliser: sub-Saharan Africa used about 18 kg of fertiliser per hectare of arable land in 2022, against about 190 kg in India) and political (weak extension services and agricultural research).
Sources: World Bank, World Development Indicators, 2026 (AG.YLD.CREL.KG; AG.CON.FERT.ZS); Wikipedia, "Green Revolution in India", 2026.
Bt cotton, genetically modified to produce a toxin that kills the bollworm, a major pest, shows how quickly an innovation can diffuse when farmers see its benefits. It was officially approved in India in 2002, although unapproved Bt seed had already been sold to farmers in Gujarat in 2001, an example of diffusion running ahead of a political barrier. Adoption accelerated between 2005 and 2008, and by 2014 about 95% of India’s cotton area was planted with GM varieties: a classic S-curve completed in about a decade.
Sources: Wikipedia, "Bt cotton", 2026.
Newer innovations spread through different channels. Advice by mobile phone, such as text messages with weather forecasts and market prices, can reach farmers without an extension officer visiting, weakening the distance decay that Hägerstrand’s model assumed. Conservation agriculture (minimum tillage, mulching and crop rotation) spreads more slowly, because its benefits appear only after several seasons.
Every communicable disease is caused by a pathogen, a microorganism such as a virus, bacterium, protozoan parasite or fungus that causes disease in its host. How a disease spreads depends on how its pathogen moves between hosts: directly from person to person, through water and food, or through another living organism.
Two measures describe how common a disease is. Incidence counts new cases in a period, so it shows how fast a disease is spreading; prevalence counts all existing cases at a point in time, so it shows how widespread it is. A disease that people live with for many years, such as HIV, can have low incidence but high prevalence.
Prevalence rises when people survive longer with a disease, so better treatment can raise prevalence even while incidence falls.
A disease that is constantly present in a population or region at a fairly stable level is endemic: malaria is endemic across much of tropical Africa. An epidemic is a sudden rise in cases well above the level normally expected in a population or area, such as dengue in Bangladesh in 2023. An epidemic that spreads across several continents is a pandemic.
Epidemics are usually shown on an epidemic curve, a graph of new cases against time.

A vector-borne disease, a term from the core unit on the consequences of climate change, is one passed between hosts by a vector: a living organism, usually a blood-feeding insect such as a mosquito, tsetse fly, sandfly or tick, that carries a pathogen from one host to another. Malaria, dengue, Zika, yellow fever, sleeping sickness and Lyme disease are vector-borne. Because the vector must survive and breed, these diseases are tied closely to the physical environment, and their geography changes when climate and land use change.
Malaria is caused by Plasmodium parasites and spread to people by the bites of infected female Anopheles mosquitoes. Five Plasmodium species infect humans; P. falciparum is the deadliest and most common in Africa, while P. vivax dominates in most countries outside sub-Saharan Africa. Malaria does not spread directly from person to person. In 2024 there were an estimated 282 million cases and 610,000 deaths in 80 countries.
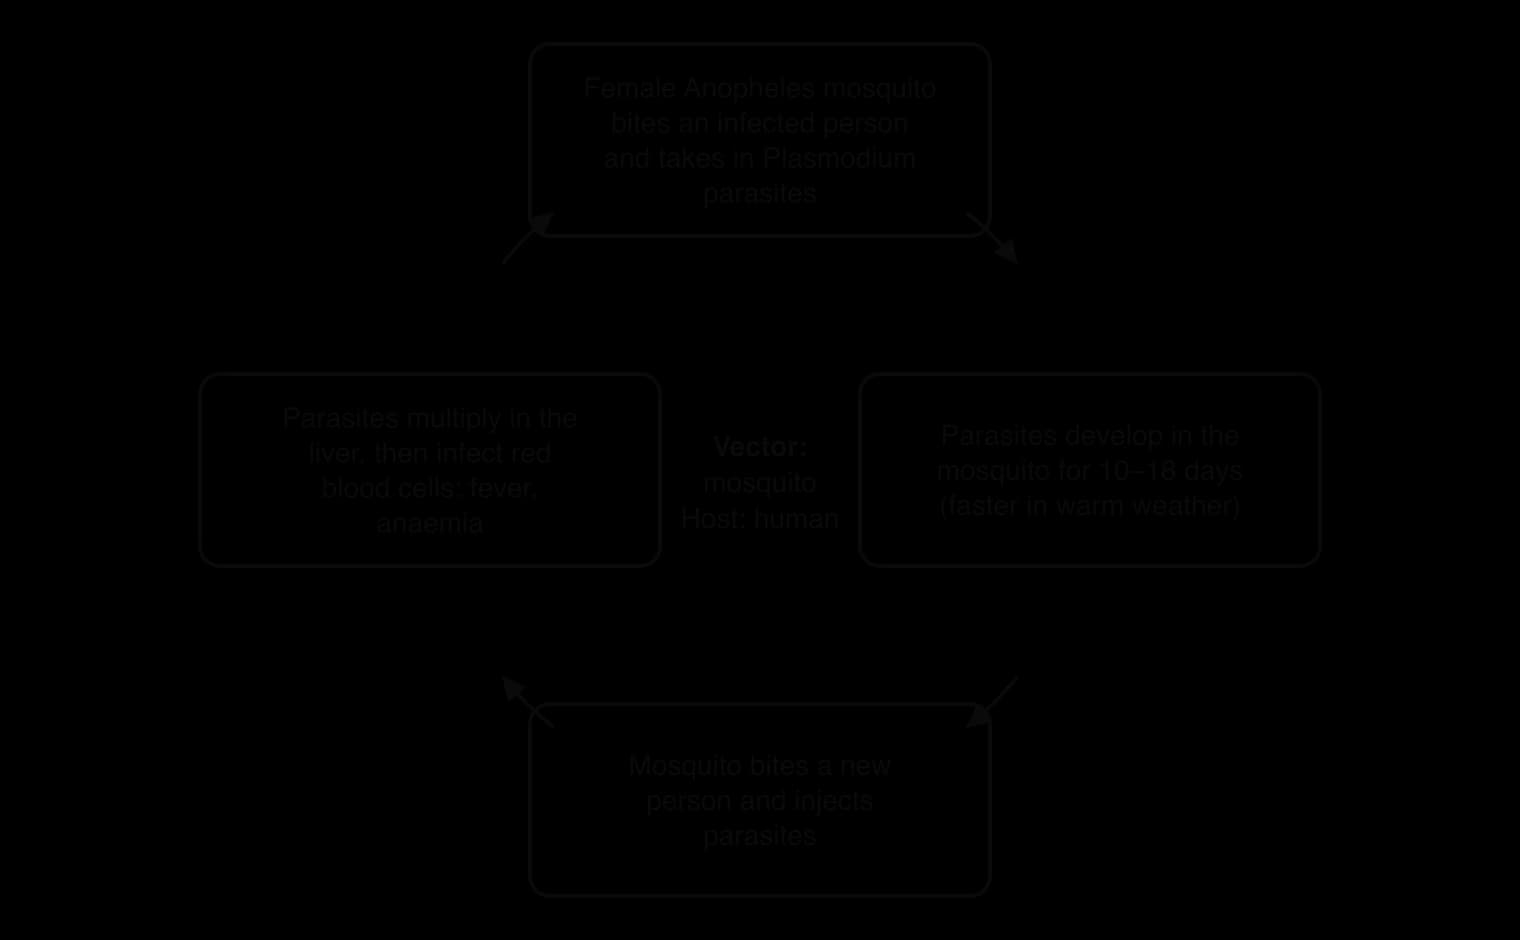
The WHO African Region had about 95% of malaria cases (265 million) and deaths (579,000) in 2024, and children under 5 accounted for about three-quarters of deaths there. Almost half of the region’s deaths were in three countries: Nigeria (31.9%), the Democratic Republic of the Congo (11.7%) and Niger (6.1%).
Sources: WHO, Malaria fact sheet, citing the World malaria report 2025.

Temperature. The parasite develops inside the mosquito only when temperatures are warm enough, roughly between 16 °C and 35 °C; development is fastest at around 25–30 °C, so transmission is most intense in the humid tropics and limited at high altitude and latitude.
Rainfall and standing water. Anopheles mosquitoes lay their eggs in still water such as puddles, rice paddies and ponds, so cases rise in and after the rainy season.
Humidity. Mosquitoes live longer in humid air, giving the parasite time to complete its development.
Altitude. Cooler highlands, such as parts of the Ethiopian and Kenyan highlands, have less malaria than lowlands at the same latitude, although warming is allowing transmission to move uphill.
Poverty and housing. Houses with open eaves, no screens and no bednets let mosquitoes bite at night; poor families also delay treatment because of cost and distance.
Access to prevention and treatment. Insecticide-treated bednets and indoor residual spraying are the two core forms of vector control; rapid tests and artemisinin-based drugs cure most cases if given early.
Land use change. Irrigation schemes, dams and rice paddies create breeding sites; deforestation and mining can expose people to new vectors.
Urbanisation. Cities generally have less malaria than rural areas, but Anopheles stephensi, an invasive mosquito from South Asia that thrives in cities and resists many insecticides, has been detected in eight African countries.
Migration and conflict. Displaced people may move from low-risk to high-risk areas without immunity, and war destroys health services.
Climate change is projected to shift the range of malaria towards higher altitudes and latitudes.
Sri Lanka shows that these factors can be overcome. Once one of the worst-affected countries in Asia, it was certified malaria-free by the WHO in 2016 after a programme of mobile clinics, surveillance of every case, treatment and vector control, sustained even during its civil war.
Dengue is a viral disease spread mainly by Aedes aegypti mosquitoes, which bite during the day and breed in small containers of clean water: buckets, tyres, flowerpots, water tanks and blocked drains. Unlike Anopheles, Aedes is an urban mosquito, so dengue is a disease of growing cities in the tropics and subtropics. Cases reported to the WHO rose from about 505,000 in 2000 to a record 14.6 million in 2024, and the disease is now endemic in more than 100 countries.
Sources: WHO, Dengue and severe dengue fact sheet, 2025.
Aedes mosquitoes also carry Zika. In 2015–16 Zika spread rapidly through Brazil and the rest of the Americas by expansion diffusion: about 1.5 million people were infected in Brazil, more than 3,500 cases of microcephaly (abnormally small heads) in newborn babies were reported between October 2015 and January 2016, and the WHO declared a public health emergency in February 2016.
A new form of scientific intervention targets the vector itself. Mosquitoes infected with Wolbachia bacteria are much less able to transmit dengue, and when they are released they spread Wolbachia through the local mosquito population. In a cluster-randomised trial in Yogyakarta, Indonesia, releases cut the incidence of dengue by 77.1%.
 YouTube
Sources: Utarini, A. et al., New England Journal of Medicine, 2021; Wikipedia, "2015–2016 Zika virus epidemic", 2026.
Diseases also spread along transport routes. In East and Central Africa in the 1980s and 1990s, HIV spread along the main highways used by long-distance lorry drivers, a combination of relocation and hierarchical diffusion through truck stops and border towns.
A water-borne disease is caused by pathogens that are transmitted in water contaminated with human or animal faeces, usually when people drink it or use it to prepare food. Cholera, typhoid, dysentery and rotavirus diarrhoea are water-borne. Most follow the faecal–oral route: pathogens leave an infected person in faeces and enter a new host through the mouth. Schistosomiasis is a related water-associated disease, caught from parasites in fresh water that enter through the skin.
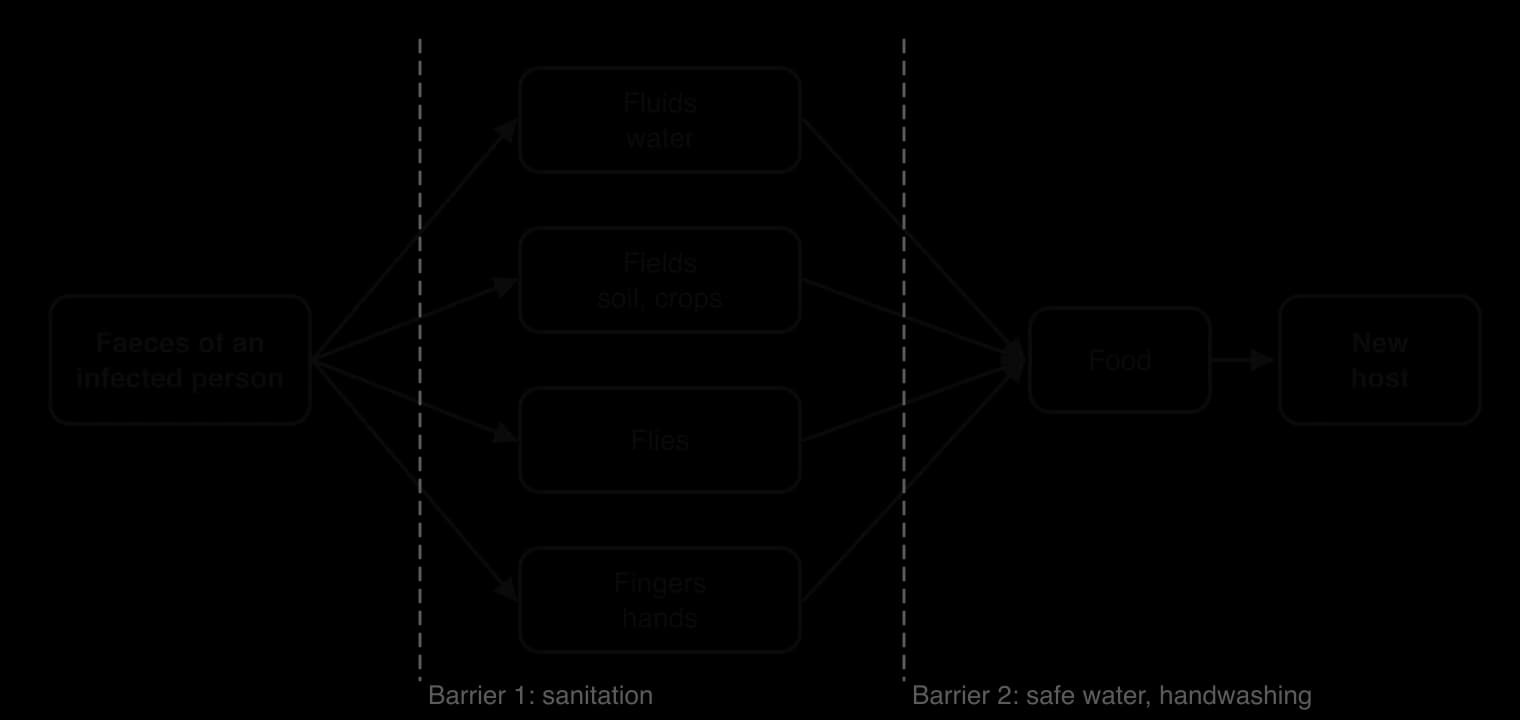
Cholera is an acute diarrhoeal infection caused by eating or drinking food or water contaminated with the bacterium Vibrio cholerae. Most infected people have no or mild symptoms, but a minority develop severe watery diarrhoea that can kill through dehydration within hours if untreated; oral rehydration solution cures most cases. Researchers estimate 1.3 to 4.0 million cases and 21,000 to 143,000 deaths a year worldwide. In 2025, 47 countries reported 451,499 cases and 7,870 deaths to the WHO, the highest number of reported deaths since 1999, and far below the estimated true burden.
Sources: WHO, Cholera fact sheet, 2026.
Lack of safe water and sanitation. Where faeces are not separated from water supplies, as in many informal settlements and rural areas, pathogens circulate continuously.
Floods and cyclones. Flood water mixes sewage with drinking water, and storms damage water and sewage systems.
Conflict and displacement. War destroys pipes, pumps and treatment plants and stops the electricity they need; crowded camps for refugees and internally displaced people have little sanitation.
Seasonality and temperature. Cholera bacteria multiply faster in warm water, and outbreaks often follow the start of the rainy season.
Weak health systems and surveillance, which delay detection and treatment.
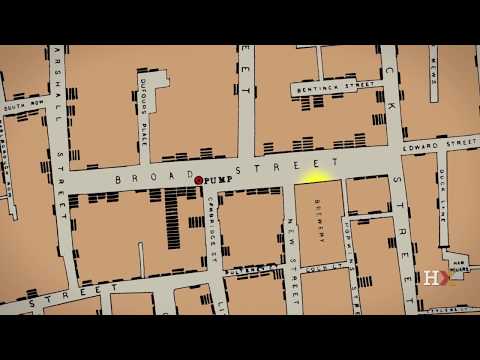
The link between water and disease was first shown spatially. During the cholera outbreak of 1854 in Soho, London, the physician John Snow mapped the homes of people who had died and found that they clustered around a public water pump on Broad Street. When the pump’s handle was removed, cases in the area fell. Snow’s dot map is often described as the founding example of spatial epidemiology: a map used to find the cause of a disease.
 YouTube
Type of impact | Examples |
|---|---|
Demographic | Deaths, concentrated among children under 5 (about three-quarters of malaria deaths in Africa); higher infant and child mortality; lower life expectancy; anaemia in pregnancy causing low birth weight; higher fertility where parents expect children to die |
Social | Children miss school and learn less (malaria and diarrhoea also impair development); carers, mostly women, lose time; stigma; health workers diverted from other care |
Economic (household) | Cost of treatment and transport; lost working days at harvest time; families sell livestock or borrow, falling into debt |
Economic (national) | Health system costs; lower productivity; reduced tourism and investment; trade restrictions after outbreaks |
Diseases of this kind and poverty reinforce each other in a cycle of poverty and disease. Poor households live in housing and areas that expose them to mosquitoes and contaminated water, and cannot afford prevention; illness then reduces their income and their children’s education, keeping them poor.
One widely quoted estimate put the cost of malaria to Africa at about US$12 billion a year, and countries where malaria was common had much slower growth in GDP per capita between 1965 and 1990 than countries without it. Such figures depend heavily on assumptions about lost working days and productivity, and on whether slow growth is caused by malaria or simply found alongside it, so they should be treated as estimates.
Sources: Greenwood, B.M. et al., The Lancet, 2005; Sachs, J. and Malaney, P., Nature, 2002; via Wikipedia, "Malaria", 2026.
Yemen’s cholera outbreak was one of the largest ever recorded. It was announced in October 2016, eighteen months into a war between the Houthi movement and the internationally recognised government, supported by a Saudi-led coalition from March 2015. By November 2021 there had been more than 2.5 million suspected cases and over 4,000 deaths, with more than 2,000 deaths in 2017 alone. In 2017 Yemen accounted for 84% of the world’s reported cholera cases, and children made up the majority of cases.
The geographic factors were mainly human. Before the war only about half the population had good access to water and sanitation; airstrikes, fighting and fuel blockades then damaged water, sewage and electricity systems, cutting about 14.5 million people off from regular access to clean water and sanitation. Public health funding stopped in 2016, and about 30,000 health workers went unpaid for nearly ten months, while strikes by sanitation workers left rubbish to accumulate around water supplies. The resurgence in April 2017 coincided with heavy rain, which washed contamination into water sources. By mid-2017, 77.7% of cases were in Houthi-controlled governorates, where damage and the collapse of services were greatest.
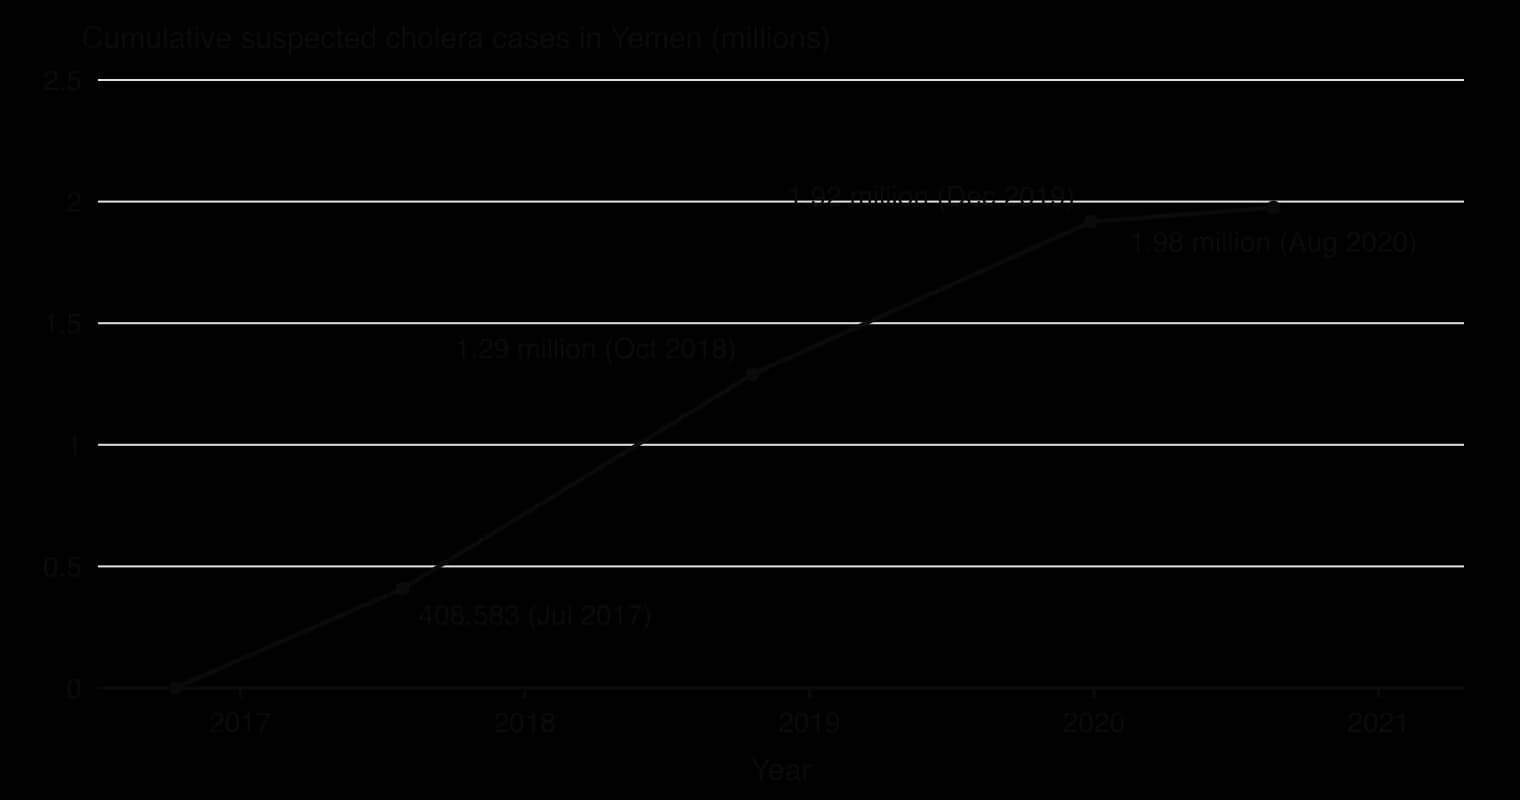
Feature | Cholera in Yemen |
|---|---|
Pathogen and route | Vibrio cholerae; faecal–oral, through contaminated water and food |
Scale | More than 2.5 million suspected cases and over 4,000 deaths (October 2016 to November 2021) |
Main factors | War damage to water, sewage and power systems; unpaid health and sanitation workers; displacement; heavy rain in 2017; child malnutrition |
Response | Cholera treatment centres and oral rehydration points; water supply to more than a million people by UNICEF; first oral vaccine campaign in May 2018, 16 months after the outbreak began |
Outcome | Only 5,676 suspected cases and two deaths in January–March 2021 |
The case shows that the incidence of a water-borne disease depends less on the physical environment than on whether the infrastructure that separates faeces from drinking water is working. It also shows power at work: the parties to the conflict controlled access to fuel, water systems and aid, and the delay in vaccination reflected the difficulty of operating in a war zone as much as a lack of vaccine.
Sources: Wikipedia, "2016–2021 Yemen cholera outbreak", citing WHO, UNICEF, OCHA and Qadri et al., New England Journal of Medicine (2017), 2026.
Bangladesh is a lower-middle-income country of about 174 million people on the delta of the Ganges, Brahmaputra and Meghna rivers, with a hot, humid monsoon climate. Its capital, Dhaka, is a megacity whose urban agglomeration had about 36.6 million people in 2025, and the urban share of the country’s population rose from 23% in 2000 to 33% in 2024. Dengue has been present since the first major outbreak in 2000, when 5,551 people were infected and 93 died. In 2023 the country suffered its worst dengue epidemic: 321,179 people were admitted to hospital and 1,705 died, both records.
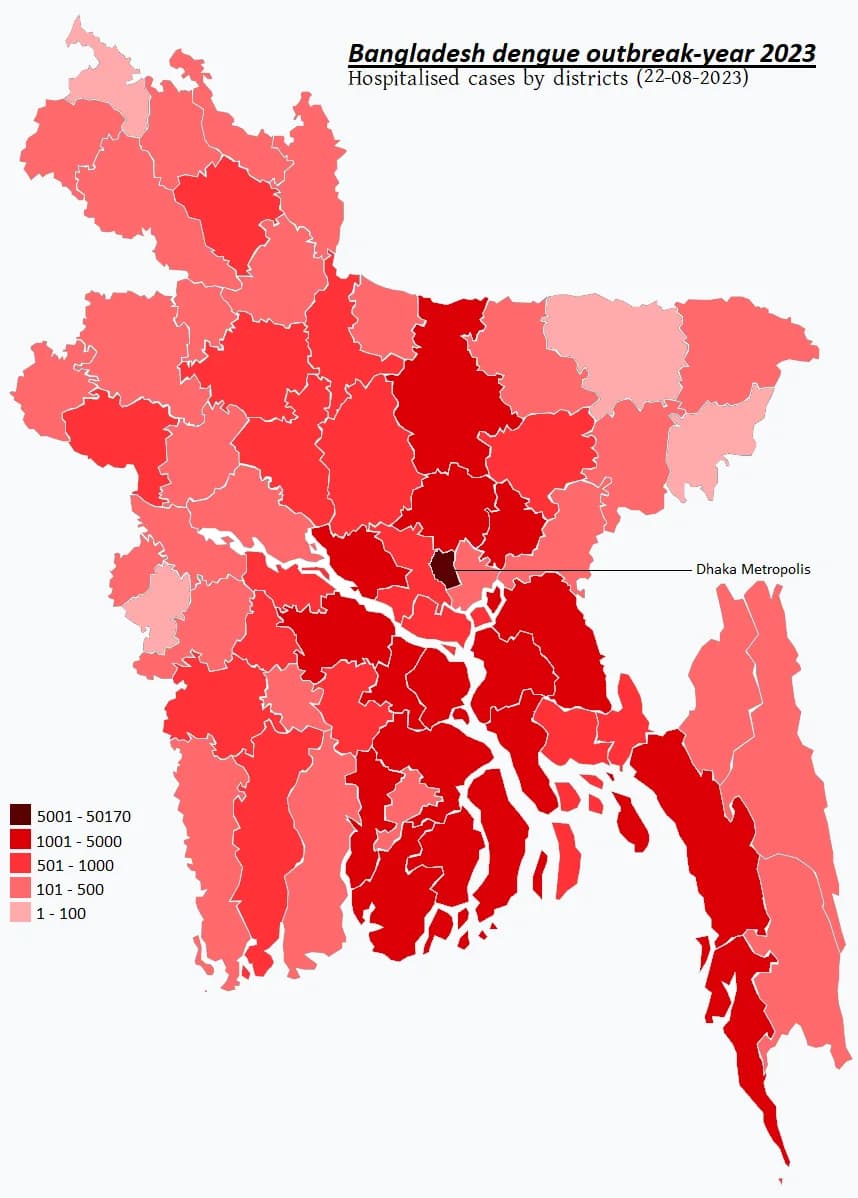
Physical factors. The WHO reported unusual episodes of heavy rainfall in 2023, together with high temperatures and humidity, ideal for Aedes mosquitoes, which breed in small pools of water and develop faster in warm weather. A survey of Aedes larvae before the monsoon found the highest mosquito density and number of potential hotspots for five years. The season also started early: cases began rising in May, and the usual surge of late June and July came on top of an already high level.
Human factors. Dhaka’s rapid, often unplanned growth creates countless breeding sites: water stored in containers because piped supply is unreliable, blocked drains, construction sites, discarded plastic and tyres. Dense housing means that each infected mosquito can bite many people. A change in the dominant virus type added a biological factor: DENV-2 replaced DENV-3, which had dominated since 2019, so many people who had already had dengue were infected by a different serotype, which raises the risk of severe dengue.
Diffusion. The epidemic spread by expansion diffusion. Dhaka was the hearth: by 7 August 2023 Dhaka city corporations had 52.8% of all confirmed cases and 78.9% of deaths. Cases then spread down the urban hierarchy and along transport routes to every one of the country’s 64 districts, and by 14 August hospital admissions outside Dhaka had overtaken those in the capital. The higher share of deaths in Dhaka partly reflects the transfer of severe cases from other districts to the capital’s hospitals.
Measure | Value | Date |
|---|---|---|
Confirmed cases | 69,483 | 1 January–7 August 2023 |
Share of those cases in July alone | 63% (43,854 cases) | July 2023 |
Case fatality rate | 0.47%, higher than in previous years | to 7 August 2023 |
Dhaka city share of cases and deaths | 52.8% of cases; 78.9% of deaths | to 7 August 2023 |
Hospitalisations and deaths for the year | 321,179 and 1,705 (CFR 0.53%) | 31 December 2023 |
Sources: WHO, Disease Outbreak News: Dengue – Bangladesh (DON481), 11 August 2023; Directorate General of Health Services (DGHS), via Wikipedia, 2026.
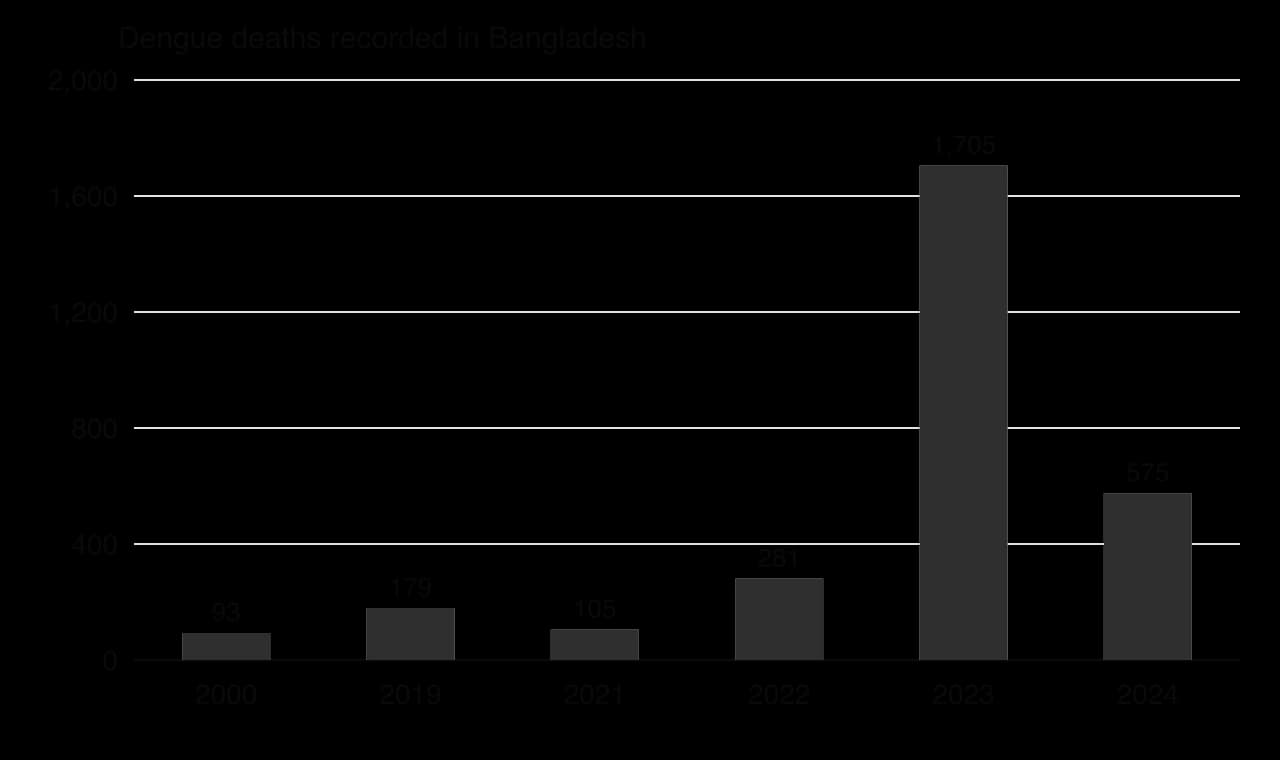
The demographic impacts fell unequally. Women had a higher case fatality rate than men (0.72% against 0.32% to 7 August 2023), and among people aged 21–40 the gap was larger still (0.71% against 0.18%). The risk of death rose sharply with age: 1.87% among people over 60.
The socio-economic impacts were felt by households and by the health system. Families paid for tests, medicines and travel and lost days of work while caring for patients; poorer households in informal settlements, with the most breeding sites around them, were most exposed and least able to pay. Hospitals in Dhaka were overwhelmed as severe cases were referred to the capital, and six hospitals that had been set up for COVID-19 were turned over to dengue patients.
Health care: a central Dengue Control Room, dedicated dengue wards, an updated national clinical guideline, training for doctors and nurses, and 184,000 rapid diagnostic (NS1) kits sent to health facilities.
Vector control: spraying of larvicides and adult insecticides, led by the Local Government Engineering Department; city corporations fined owners of buildings where Aedes larvae were found.
Awareness: campaigns on television, digital media and in print urging people to remove standing water and seek early care.
The responses reduced deaths among those treated and spread knowledge, but they could not prevent the epidemic. Spraying kills adult mosquitoes for a short time, while breeding sites in millions of containers are hard to remove without reliable piped water, waste collection and drainage. Rapid unplanned urbanisation, a warming and wetter climate and the movement of new serotypes mean that dengue is likely to remain a growing threat. Longer-term options include the Wolbachia method tested in Yogyakarta and better urban water and waste services.
Key concept | How the case shows it |
|---|---|
Process | Expansion diffusion from Dhaka down the urban hierarchy; a serotype shift raising severe cases |
Place | Dhaka’s density, water storage and drainage made it the hearth; a hot, wet monsoon season |
Power | City corporations and national agencies controlled spraying, fines and hospital capacity; the poorest had least power to protect themselves |
Possibility | Future risk depends on climate, urban planning and new tools such as Wolbachia |
Sources: WHO DON481 (2023); DGHS via Wikipedia and The Financial Express (2025); World Bank, World Development Indicators, 2026; UN DESA, World Urbanization Prospects 2025.
Explain why the share of deaths in Dhaka was much higher than its share of cases.
To what extent were human factors more important than physical factors in causing the 2023 epidemic?
Suggest why spraying insecticide is less effective against Aedes mosquitoes in a megacity than bednets are against Anopheles in rural areas.
Food systems and disease appear in Paper 1 in structured questions built on a stimulus, such as a diffusion map, an epidemic curve, a systems diagram, a bar chart of water footprints or a table of disease data, and in 10-mark essays on diffusion, barriers or the factors behind a vector-borne or water-borne disease.
Diffusion questions reward the correct name for each type, used precisely.
The table shows the global average water footprints of selected foods (real data).
Food | Water footprint (litres per kg) |
|---|---|
Beef | 15,415 |
Pork | 5,988 |
Chicken | 4,325 |
Rice | 2,497 |
Maize | 1,222 |
Potatoes | 287 |
Sources: Mekonnen and Hoekstra (2010, 2012), Water Footprint Network.
Parts (b) and (c) move from the stimulus to explanation.
Part (c) is about diffusion and barriers, a different part of the topic, as structured questions often are.
A farm is an open system of inputs, stores, transfers and outputs; farming systems are classified as subsistence or commercial, intensive or extensive, and arable, pastoral or mixed.
The energy efficiency ratio (energy out ÷ energy in) is high in low-input systems such as Philippine rice (7.5–10) and below 1 in greenhouse vegetables and feedlots.
Water footprints have green, blue and grey components; animal products have the largest (beef about 15,400 L per kg).
A systems approach makes food systems comparable, but simplifies them, depends on its boundaries and ignores social sustainability; food miles alone can mislead.
Food consumption varies because of physical processes (climate, soils, hazards such as locusts) and human ones (income, prices, trade, culture, conflict, policy).
Diffusion is expansion (contagious, hierarchical) or relocation; adoption follows an S-curve; Hägerstrand’s model explains contagious spread through the neighbourhood effect.
Physical, economic and political barriers, absorbing or permeable, slow diffusion, as in the slow spread of HYVs in sub-Saharan Africa.
Vector-borne diseases such as malaria and dengue depend on the vector’s environment and on housing, prevention and urbanisation; water-borne diseases such as cholera depend on water, sanitation and the infrastructure that conflict destroys.
I can draw and label a farm as a system of inputs, stores, transfers and outputs.
I can classify farming systems and give a located example of each type.
I can work out an energy efficiency ratio and compare the energy efficiency and water footprints of contrasting systems.
I can evaluate a systems approach and food miles as ways of judging sustainability.
I can explain the physical and human processes that cause variations in food consumption.
I can distinguish contagious, hierarchical and relocation diffusion, and explain the adoption curve and Hägerstrand’s model.
I can explain how absorbing and permeable barriers affect the diffusion of agricultural innovations and diseases.
I can explain the geographic factors and the impacts of malaria and dengue, using dengue in Bangladesh as a case study.
I can explain the factors behind a water-borne disease, using cholera in Yemen as a detailed example.
Good answers may be well structured (AO4) and may additionally offer a critical evaluation (AO3) which distinguishes between types of aquaculture (shrimp and salmon versus carp and shellfish) and between places with strong and weak regulation (places, power). Another approach might be to consider time: early unregulated growth caused severe damage, while newer systems are cleaner but more expensive (possibilities). Some responses may question whether the demand itself, for example for high-value carnivorous species in high-income countries, is the real problem (perspectives).
For 5–6 marks, expect some weakly-evidenced outlining of the benefits and/or environmental problems of aquaculture.
For 7–8 marks, expect a structured account which includes:
either well-evidenced explanation of aquaculture's capacity to meet demand and its environmental impacts, with located examples
or a discursive conclusion (or on-going evaluation) grounded in geographical concepts and/or perspectives.
For 9–10 marks, expect both of these traits.
Marks | Level descriptor |
|---|---|
0 | The response does not reach a standard described by the descriptors below. |
1–2 | Too brief, lists unconnected information, not focused on the question and lacks structure. Knowledge is very general, with large gaps or errors; examples or case studies are missing or only listed. No analysis; terminology is missing or used incorrectly. |
3–4 | Too general, lacks detail, not focused on the question and largely unstructured. Outlines examples, statistics and facts, both relevant and irrelevant, with links to the question only listed. Basic terminology is used, with errors or inconsistently. No critical evaluation of evidence; any conclusion is irrelevant. |
5–6 | Partially addresses the question, with a narrow argument, an unsubstantiated conclusion and limited evaluation. Describes relevant supporting evidence (examples, case studies) and outlines links to the question. The argument repeats one point or covers only part of the question. Other perspectives, or strengths and weaknesses of evidence, are listed. |
7–8 | Addresses the whole question; the analysis is evaluated and the conclusion is relevant but lacks balance. Relevant evidence is described correctly and covers all the main points. The argument is clear but one-sided or unbalanced. Complex terminology is used correctly but not consistently. Other perspectives, or strengths and weaknesses of evidence, are described. |
9–10 | In-depth and specific to the question (topic and command term). Correct, relevant examples, statistics and detail are integrated and their link to the question explained. The argument is balanced, explaining complexity, exceptions and comparisons. Evaluation of evidence and perspectives is well developed, and the conclusion is balanced and aligned with the evidence. Logically structured and easy to follow. |
Examine the extent to which calories per capita is a reliable indicator of food security at different scales.
10 marks
Examine the relative importance of food availability and food access in explaining global patterns of food insecurity.
10 marks