
Explain what makes a society water-secure, distinguish physical and economic scarcity, evaluate ways to increase supply and conserve water, and (HL) analyse water stress, governance, disputes and inequitable access.
Each is in the ESS glossary, with every other term in the subject.
A food production system that combines raising fish with growing plants in water, in which fish waste supplies nutrients to the plants and the plants clean the water returned to the fish.
The injection of surplus water, such as treated river water or wastewater, into an aquifer through wells for storage, and its pumping back out through the same wells when it is needed.
The deliberate addition of water to an aquifer at a rate faster than natural recharge, for example from infiltration basins or injection wells, to replenish groundwater.
A low dam or barrier with gates built across a river mouth or estuary, used to keep out seawater, store freshwater behind it or control flooding.
A highly concentrated salt solution, such as the waste water discharged by desalination plants, which is much saltier and denser than seawater.
A weather modification technique in which particles such as silver iodide or salt are released into clouds to encourage water droplets or ice crystals to form and fall as precipitation.
A barrier built across a river to hold back water, creating a reservoir used for water supply, irrigation, flood control or hydroelectric power.
Define water security and outline why it is a component of a sustainable society.
Describe how social, cultural, economic and political factors affect the availability of, and equitable access to, freshwater.
Outline the main uses of freshwater and explain why population growth and economic development increase demand.
Evaluate ways of increasing freshwater supply: dams and reservoirs, rainwater catchment, desalination and the enhancement of wetlands.
Distinguish between physical and economic water scarcity.
Evaluate domestic and food-production water conservation techniques.
Evaluate the strategies a named country uses to address water scarcity.
Explain why freshwater change is a planetary boundary and how governance at local and international scales manages freshwater use. (HL)
Distinguish between water scarcity and water stress, and explain the causes of water stress in contrasting societies. (HL)
Discuss transboundary water disputes, water footprints and citizen science as influences on water security. (HL)
Evaluate industrial methods of freshwater production and their negative impacts. (HL)
Examine how inequitable access to drinking water and sanitation affects a named marginalised group. (HL)
Every person needs a few litres of clean water a day to drink and many more to cook, wash and grow food. Yet in 2024 about 2.1 billion people, one in four of the world’s population, still did not have safely managed drinking water at home. How water is shared, used, stored and protected is therefore one of the central questions of
The official deck for this part of the syllabus.
What is water security?
State the three components of water security.
With a free account, Augment remembers where you stopped and what you have practiced.
The removal of salt and other dissolved minerals from seawater or brackish water to produce freshwater, mainly by reverse osmosis or by distillation.
A method of irrigation that delivers small amounts of water slowly through pipes and emitters directly to the roots of each plant, reducing losses by evaporation and run-off.
A prolonged period of below-average precipitation that leads to a shortage of water for ecosystems, agriculture or human supply.
A crop variety that can grow and produce a yield with less water than usual, through traits such as deep roots or reduced water loss, whether bred conventionally or genetically modified.
A shortage of water caused by a lack of investment in storage, treatment and distribution, or by a lack of human capacity, even though enough freshwater exists naturally.
The quantity, timing and quality of water flow that must be left in a river, wetland or estuary to sustain its ecosystems and the people who depend on them.
A measure of water availability based on renewable freshwater per person per year: below 1,700 m³ indicates water stress, below 1,000 m³ scarcity and below 500 m³ absolute scarcity.
Water with a low concentration of dissolved salts, usually below about 1 g per litre, found in rivers, lakes, groundwater, ice and the atmosphere, and usable for drinking and irrigation.
Lightly used wastewater from showers, baths, washbasins and washing machines, which can be filtered and reused for flushing toilets or watering gardens.
The artificial supply of water to farmland from rivers, reservoirs or groundwater to grow crops where or when rainfall alone is not enough.
A shortage of water caused by the actual amount of freshwater available being too small to meet the demands of a population, typical of arid regions.
The collection and storage of rain that falls on roofs or other surfaces, so that it can be used for gardens, toilets, livestock, crops or, after treatment, drinking.
A natural or artificial lake used to store water, usually behind a dam, so that it can be supplied to people, farms and industry when needed.
A desalination process in which seawater or brackish water is pushed at high pressure through a semi-permeable membrane that lets water molecules through but holds back dissolved salts.
Drinking water from an improved source that is located on the premises, available when needed and free from faecal and priority chemical contamination; the standard used to monitor SDG 6.
The movement of seawater into a coastal freshwater aquifer, usually because groundwater is pumped out faster than it is recharged, making the water too salty to use.
The provision of facilities and services for the safe collection, removal, treatment and disposal of human urine and faeces, which protects health and the environment.
A method of producing freshwater in which the sun's energy evaporates salty or dirty water and the vapour is condensed on a cool surface, leaving salts and impurities behind.
A conflict between countries or regions over the use, allocation or control of a river, lake or aquifer that crosses the boundaries between them.
The volume of freshwater used to produce a good or service, which is effectively traded between countries when that good is exported or imported.
The use of practices, technologies and regulations that reduce the amount of water used or wasted, so that existing supplies last longer and meet more needs.
The measurement of the volume of water each household or business uses with a meter, so that it pays for what it uses and has an incentive to use less.
A limit set by an authority on how much water each person, household or sector may use in a given period, usually during a drought or supply crisis.
The limited availability of freshwater to human societies, either because there is too little water (physical scarcity) or because storage and transport systems are inadequate (economic scarcity).
The condition in which a population has reliable access to sufficient quantities of safe drinking water for health, livelihoods and well-being; a key component of a sustainable society.
A condition in which the demand for clean, accessible water exceeds supply, taking account of water quality, environmental flows and access; defined as less than 1,700 m³ per person per year.
The movement of large volumes of water by canals, tunnels or pipelines from a river basin with a surplus to one with a deficit.
The removal of freshwater from a river, lake or aquifer for human use, whether or not it is later returned to the environment.
An area of land that is saturated or covered with shallow water for all or part of the year, such as a marsh, swamp or floodplain, which stores and filters water.
Water access can be studied as a socio-ecological system: the hydrological cycle supplies a renewable flow of freshwater, and human societies divert part of that flow through wells, pipes, canals and treatment plants to homes, farms and factories. Whether the system is sustainable depends on how fast water is taken compared with how fast it is replaced, on who gets it, and on the perspectives of those who decide. The same drought can cause minor restrictions in a wealthy city with several sources of water and a humanitarian crisis in a poor city that depends on one.
Only a small part of the Earth’s water is fresh and within reach. Most of it is salt water in the oceans, and most of the freshwater is locked in ice caps, glaciers and deep groundwater. The water that people actually use comes from rivers, lakes, shallow aquifers and rain, and it is renewed each year by the water cycle. A society is secure in its water when this renewable supply, plus any water it can make or import, reliably meets its needs.
The definition has three parts that are easy to separate. Quantity: there must be enough water. Quality: the water must be safe, free from pathogens and harmful chemicals. Access: people must be able to reach and afford it, every day and in every season. A city with large reservoirs is not water-secure if its pipes leak, if poor districts are not connected, or if the reservoirs are polluted.
Water security connects all three pillars of sustainability. Socially, unsafe water spreads diarrhoeal diseases such as cholera, and the time spent collecting water keeps many women and girls out of school or paid work. Economically, farms, factories and power stations stop when water runs out. Environmentally, taking too much water from rivers and aquifers dries up wetlands and lowers water tables, damaging the ecosystems that provide the water in the first place.
Clean water and sanitation for all is Sustainable Development Goal 6. Water security also underpins SDG 2 (zero hunger), because most freshwater is used to grow food, and SDG 3 (good health). Water is one example of the wider idea of resource security: a society is secure when it can obtain the resources it needs reliably and affordably.
Freshwater use is usually measured as water withdrawal: the volume taken from rivers, lakes and aquifers. It is divided into three sectors. Agriculture uses water for irrigation of crops and for livestock. Industry uses it for cooling power stations, processing raw materials and manufacturing. Domestic (or municipal) use covers drinking, cooking, washing, toilets and gardens in homes, schools and offices.
The pattern reflects each country’s economy and climate. In low-income and monsoon countries such as India, most people work in farming and dry seasons make irrigation essential, so agriculture dominates. In industrialised countries such as Germany and the USA, large volumes are withdrawn to cool thermal power stations, although much of that water is returned to rivers, warmer, a short distance downstream. Domestic use is the smallest sector worldwide, yet it is the one that matters most for human health.
Sector | Main uses | Share of world withdrawals (2022) | Typical ways to save water |
|---|---|---|---|
Agriculture | Irrigation of crops; drinking water for livestock; aquaculture | About 71% | Drip irrigation, drought-resistant crops, scheduling irrigation at night, less water-intensive diets |
Industry | Cooling power stations; mining; making steel, paper, chemicals, textiles and food | About 16% | Recycling cooling water, dry cooling, water pricing, treating and reusing wastewater |
Domestic (municipal) | Drinking, cooking, washing, toilets, gardens, public buildings | About 13% | Metering, low-flush toilets, grey-water recycling, rainwater harvesting, fixing leaks |
Sources: World Bank, World Development Indicators, annual freshwater withdrawals by sector (2022).
Societies with growing populations or growing economies must either increase their water supply or use their existing water more efficiently. Population growth adds more people who need water to drink, wash and eat. Economic development usually raises water use per person, because diets shift towards meat and dairy, which take far more water to produce than cereals, and because households gain flush toilets, washing machines and gardens. Industrialisation and urbanisation add factories and power stations that need cooling water.
Rising demand puts pressure on a fixed renewable supply. The annual flow of a river or the recharge of an aquifer is set mainly by climate, so when withdrawals grow faster than that flow, the gap is filled by drawing down stored water: reservoirs empty and groundwater levels fall. This is unsustainable in the same way as spending savings rather than income, and it links water to natural capital: the stored water is the capital, the annual recharge the income.
Whether a person has safe water depends only partly on how much rain falls. Human factors decide how the available water is stored, shared, priced and protected. These factors are usually grouped as social, cultural, economic and political, and in any real case they interact.
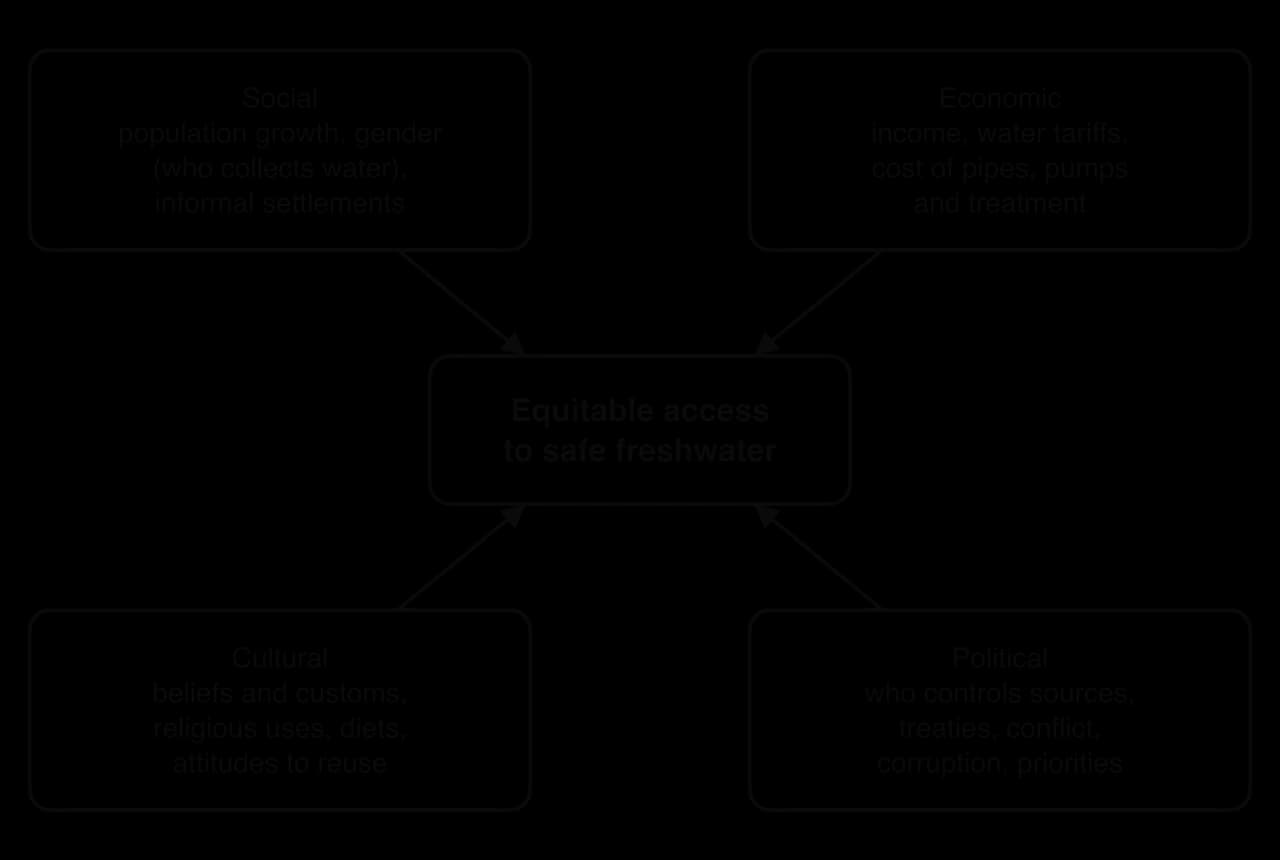
Rapid population growth, especially in fast-growing cities, can outpace the construction of pipes and treatment works. Many new arrivals live in informal settlements that are not connected to mains water and rely on shared standpipes, wells or water sold by vendors and tankers at a higher price per litre than piped water. Gender is also a social factor: in most countries where water must be carried home, women and girls do most of the collecting, and in parts of sub-Saharan Africa and Central and Southern Asia many spend more than 30 minutes a day on it.
Cultural beliefs shape how water is valued and used. Water has religious significance in many faiths, for example in ritual washing before prayer in Islam or bathing in the Ganges in Hinduism, which can create demand at particular places and times. Attitudes to reusing treated wastewater vary: some communities reject recycled water for drinking because of a “yuck factor”, even when it meets drinking-water standards. Diets are cultural too, and a diet rich in beef uses far more water than one based on cereals and pulses.
Building dams, wells, treatment plants and pipe networks is expensive, so wealthier countries and wealthier districts are usually better supplied. Water tariffs affect who can afford water: a flat low price encourages waste, while a high price can exclude poor households unless the first litres are cheap or free. Economic priorities matter as well, because a government may allocate scarce water to export crops or industry rather than to households.
Governments decide who controls water sources, how water is allocated between users, and how much is spent on infrastructure. Weak governance, corruption and conflict can leave infrastructure unmaintained or destroyed; in Yemen the long civil war damaged water systems and more than 2,000 people died of cholera between April and August 2017. Where rivers cross borders, treaties decide how much water each country may take, and political tension between countries can threaten supply.
The Aral Sea in Central Asia shows political and economic factors acting together. From the 1960s, Soviet central planners diverted the Amu Darya and Syr Darya rivers to irrigate cotton grown for export, a decision taken far from the communities that depended on the sea. The economic priority given to cotton left fishing towns without a livelihood and without safe local water.
Sources: WHO and UNICEF Joint Monitoring Programme (2025); Wikipedia, Water supply and sanitation in Yemen (2026).
 YouTube
When demand exceeds the renewable supply, a society can respond in two broad ways. It can increase supply, by storing more water, capturing water that was not used before or making new freshwater. Or it can manage demand, by using water more efficiently and more fairly. Supply-side responses are often favoured by engineers and governments because they promise more water without asking people to change their behaviour, but each has costs and side effects.
A dam built across a river holds back water to form a reservoir. The reservoir stores water from the wet season or wet years and releases it in dry periods, smoothing out the natural variation in river flow. Large dams also generate hydroelectric power and control floods, so they are often multi-purpose projects.
The costs are large and long-lasting. Reservoirs flood farmland, forests and settlements, displacing people; they trap sediment that would otherwise fertilise floodplains and build deltas; they block fish migration; and in hot climates they lose a great deal of water by evaporation. Downstream users, including other countries, receive less water and at different times. On the North Aral Sea, the Kok-Aral dam, completed in 2005 with a World Bank loan, raised the water level of the northern basin, lowered its salinity and allowed commercial fishing to revive, but only by cutting off the water that would have flowed into the much larger South Aral.
Rainwater harvesting collects rain from roofs, paved areas or specially shaped ground and stores it in tanks, ponds or underground cisterns. At household scale it supplies water for gardens and toilets, and for drinking if it is filtered and disinfected. At larger scale, whole urban catchments can be designed so that rain falling on streets and drains flows into reservoirs rather than to the sea, as in Singapore.
Rainwater catchment is cheap and local, reduces surface run-off and flooding, and needs little energy. Its weakness is that it depends on rain: it supplies most water when water is least scarce, and storage tanks run dry in long droughts. Roof water can also be contaminated by bird droppings, dust or roofing materials.
Desalination produces freshwater from seawater or salty (brackish) groundwater. It is the only supply method that does not depend on rain, which makes it attractive to dry coastal countries. The most common method today is reverse osmosis.
In ordinary osmosis, water moves through a semi-permeable membrane from a dilute solution to a concentrated one. Reverse osmosis applies a pressure greater than the osmotic pressure to the seawater side, so that water molecules are forced the other way, from the salty side to the fresh side, while the dissolved salts are held back. The process needs pumps that push water at high pressure, so its main input is energy, and its waste output is a concentrated salty solution called brine.

Desalination has become far more efficient. The average energy used to desalinate a cubic metre of water fell from about 20–30 kWh in 1970 to about 3 kWh in 2018, because membranes improved and energy-recovery devices now capture pressure from the brine. Israel shows how far a dry country can go: in 2022 about 86% of its drinking water came from desalination, including the Sorek plant on the Mediterranean coast, opened in 2013 with a capacity of 150 million m³ a year.
Sources: Wikipedia, Desalination (2026) and Water supply and sanitation in Israel (2026).
 YouTube
Wetlands such as marshes, swamps and floodplains act like natural sponges. They slow down run-off, store floodwater, let water soak into the ground to recharge aquifers, and filter sediment and nutrients out of the water. Protecting and restoring wetlands therefore increases the amount and quality of water available downstream, without concrete or energy.
Wetland enhancement is a nature-based solution: it works with the hydrological cycle rather than against it, and it also provides habitat and stores carbon. Its limitations are that it takes land that could be farmed or built on, that its benefits are spread out and hard to measure, and that it cannot produce water in a place where there is none.
Method | How it adds supply | Advantages | Disadvantages |
|---|---|---|---|
Dams and reservoirs | Store river water from wet periods for use in dry periods | Large, reliable storage; also flood control and hydroelectric power | Displace people; trap sediment; block fish; evaporation losses; reduce flow to downstream users |
Rainwater catchment | Collects rain from roofs and paved surfaces into tanks or reservoirs | Cheap, local, low-energy; reduces flooding | Depends on rainfall; small storage; possible contamination |
Desalination | Makes freshwater from seawater or brackish water | Independent of rainfall; unlimited raw water for coastal sites | High energy use and cost; brine waste; marine organisms drawn in at the intake |
Enhancing wetlands | Restores natural storage, recharge and filtering | Low cost; improves water quality; habitat and carbon storage | Takes land; slow; benefits hard to quantify; limited in very dry regions |
Water scarcity describes a situation in which people cannot obtain all the water they need. It can arise for two quite different reasons, and the difference matters because each needs a different solution.
Physical water scarcity occurs when there is simply not enough water in the region to meet all demands, including the needs of ecosystems. It is typical of arid regions such as North Africa, West Asia, Central Asia and much of Australia, and of places where so much water is already withdrawn that rivers no longer reach the sea. Economic water scarcity occurs when water exists in rivers, lakes or aquifers but there is not enough investment in wells, dams, pipes and treatment, or not enough human and institutional capacity, to deliver it to people. It is a feature of much of sub-Saharan Africa.
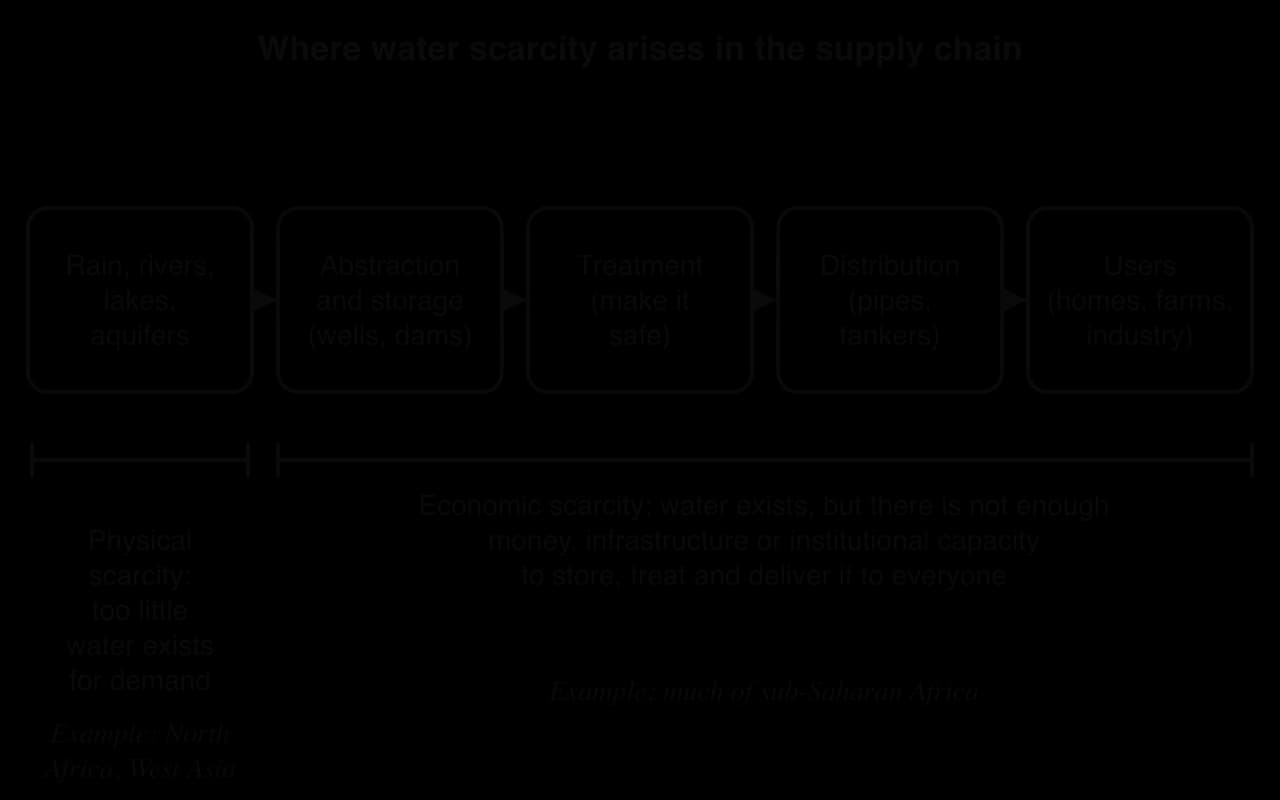
The two types of scarcity call for different responses. Physical scarcity requires reducing demand, reallocating water between sectors, importing water or food, recycling wastewater or desalination. Economic scarcity requires money, technology and good governance: drilling boreholes, building pipe networks and treatment works, and training people to run and maintain them.
Water conservation reduces the amount of water used or wasted, so that existing supplies go further. It is usually cheaper and quicker than building new supply, and it reduces the energy needed to pump and treat water. At household level, five techniques are widely used.
Water metering measures how much water each household uses, so that it pays for what it uses rather than a flat fee. Metering gives an incentive to fix leaks and avoid waste, and it lets water companies detect leaks in their own network. It can be combined with rising block tariffs, in which the first litres are cheap and each further block costs more. The main criticism is that metering can make water unaffordable for large, poor households unless a basic allowance is cheap or free.
Water rationing sets a legal limit on how much each person or household may use, or restricts particular uses such as filling swimming pools or watering gardens. It is usually a short-term emergency measure during a drought. Rationing works quickly and spreads the burden, but it depends on enforcement and public trust, and it falls hardest on those who cannot afford alternatives such as private boreholes or bottled water.
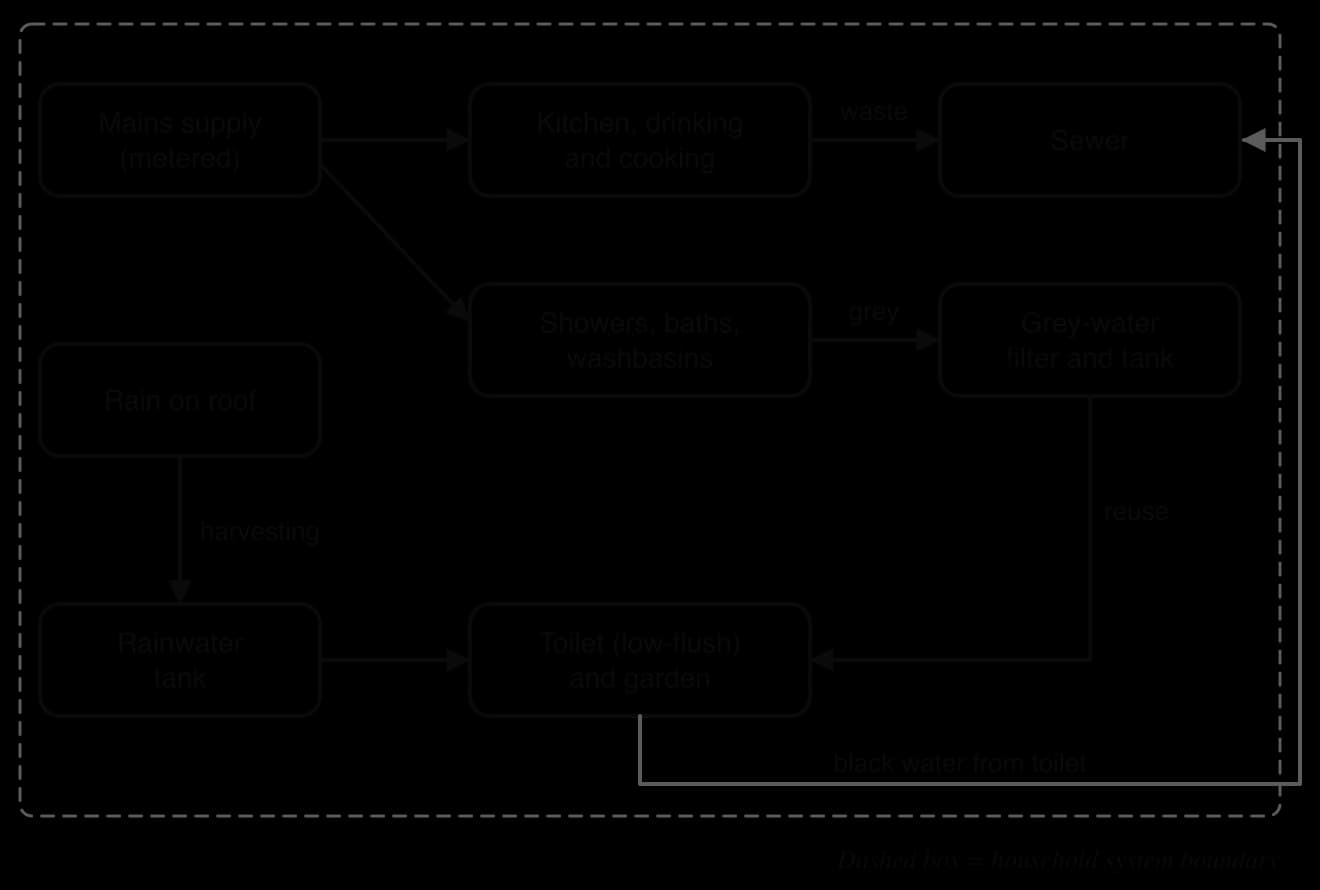
Grey water is the lightly used water from showers, baths, washbasins and washing machines. It contains soap and some dirt but little faecal matter, so after simple filtering it can be reused to flush toilets or water gardens. Grey-water systems reduce mains demand by replacing drinking-quality water in uses that do not need it. Black water, from toilets and often kitchen sinks, contains far more organic matter and pathogens and must go to the sewer.
Toilet flushing is one of the largest domestic uses of water in high-income countries. Low-flush and dual-flush toilets use much smaller volumes per flush than older models, and composting toilets use none at all. Replacing toilets is a one-off cost that gives savings for decades with no change in behaviour.
Household rainwater tanks collect roof water for gardens, toilets and washing machines, reducing the demand on mains supply. In many rural areas without piped water, rainwater tanks are the main source of domestic water.
Because agriculture uses about 71% of all freshwater withdrawals, saving water on farms has the greatest effect on total demand. Several techniques reduce the water needed per tonne of food.
Traditional flood or furrow irrigation lets water flow across a whole field, and much of it evaporates, runs off or soaks below the roots. Drip irrigation delivers small amounts of water slowly through pipes and emitters directly to the base of each plant, so far less is lost. Fertiliser can be added to the water, and computer control can match water to the crop’s needs. Modern drip irrigation was developed in Israel: the company Netafim was founded at Kibbutz Hatzerim in 1965 to make the first commercial drippers.

The drawbacks are cost and maintenance. Pipes and emitters are expensive for smallholders, emitters clog with sediment or salts, and in some regions farmers who save water by drip irrigation simply irrigate a larger area, so total water use does not fall.
Greenhouses reduce evaporation by enclosing crops, and many collect rain from their large roofs into tanks. In closed hydroponic systems, the nutrient solution that drains from the plants is collected, filtered and reused rather than lost to the soil. Greenhouse crops can therefore use much less water per kilogram than the same crops in open fields, at the cost of energy for heating, lighting and pumping.
Aquaponics combines fish farming with growing vegetables in the same recirculating system. Fish waste supplies ammonia, which bacteria convert into nitrates that the plants absorb; the plants clean the water, which returns to the fish tanks. Because the water is recycled, only the small amount lost by evaporation and transpiration has to be replaced. Aquaponics produces both protein and vegetables, but it needs electricity for pumps, technical skill to keep fish, bacteria and plants in balance, and investment.
Drought-resistant crops grow with less water, through deep roots, small or waxy leaves, or a short growing season. Traditional crops such as sorghum and millet are naturally drought-tolerant, and plant breeders have developed drought-tolerant varieties of maize and other staples by conventional breeding and by genetic modification. They reduce irrigation needs and protect farmers’ yields in dry years, but some are less productive in good years, and genetically modified varieties raise concerns about seed costs and corporate control.
Animal products need far more water than plant foods because the animals eat crops that themselves need water. Globally, producing 1 kg of beef takes about 15,400 L of water on average, compared with about 1,600 L for 1 kg of wheat bread. A shift in diets from meat towards cereals, pulses and vegetables therefore reduces the water needed to feed a population. Its success depends on cultural acceptance, since diets are tied to identity and tradition.
Sources: Mekonnen and Hoekstra (2010), via Wikipedia, Water footprint (2026); Wikipedia, Netafim (2026).
Singapore is a small, densely populated island state with high rainfall but very little land to collect and store it, and no large rivers or aquifers. In terms of internal renewable water it has only about 106 m³ per person per year, among the lowest in the world. For decades it depended on water piped from the Malaysian state of Johor. Its government has built a strategy known as the Four National Taps to make the country more self-sufficient.
Local catchment water. About two-thirds of Singapore’s land area is now partly protected water catchment, draining through canals into 17 reservoirs (2012). The Marina Barrage, opened in 2008, dammed the mouth of the Marina Channel and turned a salty bay into a freshwater reservoir with a catchment of 10,000 ha in the city centre.
Imported water. Under a 1962 agreement that runs until 2061, Singapore may draw water from Johor in Malaysia at a price of 3 Malaysian sen per 1,000 imperial gallons. An earlier agreement expired in 2011, and the price has been a source of political disagreement between the two countries.
NEWater. Since 2003, treated wastewater has been purified further by microfiltration, reverse osmosis and ultraviolet disinfection to produce high-grade reclaimed water. It is used mainly by industry and for air-conditioning cooling, and can meet up to 40% of current demand, with plans to reach up to 55% by 2060.
Desalinated water. Five desalination plants now operate, the first opened in 2005, and desalination is planned to meet up to 30% of demand by 2060.
On the demand side, Singapore uses pricing and education. Household water bills include a water conservation tax of 50% of the tariff for the first 40 m³ a month and 65% above it, and domestic use per person fell from 165 L a day in 2003 to 148 L in 2016, with further cuts targeted by 2030.
Sources: Wikipedia, Water supply and sanitation in Singapore (2026), NEWater (2026) and Marina Barrage (2026); World Bank, World Development Indicators (2022).
Singapore’s strategy has strengths. Diversifying sources reduces the risk from any single failure, including a political dispute with Malaysia or a drought. Recycling and desalination are independent of rainfall. Pricing and education have lowered use per person.
It also has limitations. NEWater and desalination use far more energy per cubic metre than reservoir water, mostly from natural gas, which links water security to energy security and greenhouse gas emissions. The approach depends on wealth and strong central government, so it cannot easily be copied by low-income countries with economic water scarcity. Total demand is still projected to rise as the economy grows. From an ecocentric perspective, turning almost every stream and bay into a managed catchment leaves little room for natural freshwater ecosystems.
How a society responds to water scarcity depends on its environmental value systems. A technocentric perspective expects technology to solve the problem by producing more water: larger dams, desalination plants and water transfers. An ecocentric perspective sees the river or aquifer as having value of its own and emphasises living within the natural water budget by reducing demand, leaving water for ecosystems and restoring wetlands. An anthropocentric perspective focuses on managing water for human well-being through a mix of supply and demand measures, regulation and fair allocation.
Perspective | How it sees the problem | Preferred responses | Main criticism |
|---|---|---|---|
Technocentric | A shortage of supply that engineering can fix | Dams, desalination, water transfers, recycling technology | High energy use and cost; ignores ecosystems and the causes of high demand |
Anthropocentric | A management problem: water must be allocated well for people | Pricing, metering, regulation, planning, efficient irrigation, some new supply | May still put human use ahead of the needs of rivers and wetlands |
Ecocentric | Demand has outgrown what the ecosystem can supply | Reduce use, protect environmental flows, restore wetlands, change diets and lifestyles | Slow; can conflict with development and food production in poor countries |
In practice most successful strategies combine all three. Singapore uses technocentric supply alongside demand management. The most sustainable responses are usually those that reduce demand first, because every litre not used is a litre that does not need to be stored, pumped, treated or desalinated.
Cape Town is South Africa’s second-largest city, in the Western Cape province, with a Mediterranean climate of dry summers and wet winters. Its water comes mainly from six large surface reservoirs in the mountains east of the city, which fill during the winter rains (May to August) and are drawn down through the summer. The system is therefore a classic store with a seasonal input and a year-round output.
The city’s population grew from about 2.4 million in 1995 to an estimated 4.1 million in 2015, an increase of 71%, while dam storage capacity rose by only 17% over the same period, mainly through the Berg River Dam completed in 2009. About one-fifth of residents live in informal settlements, many of which depend on shared communal taps rather than household connections. Before the drought the city was regarded as a leader in water management: in 2015 it won a C40 award for conservation, and it lost about 14% of its water through leaks, against a national average of about 35%.
Three consecutive winters, from 2015 to 2017, brought far less rain than usual. The rainfall of 2017 was the lowest since records began in 1933. Because the reservoirs depend on winter inflow, each dry winter left them lower at the start of summer, and storage fell year after year.
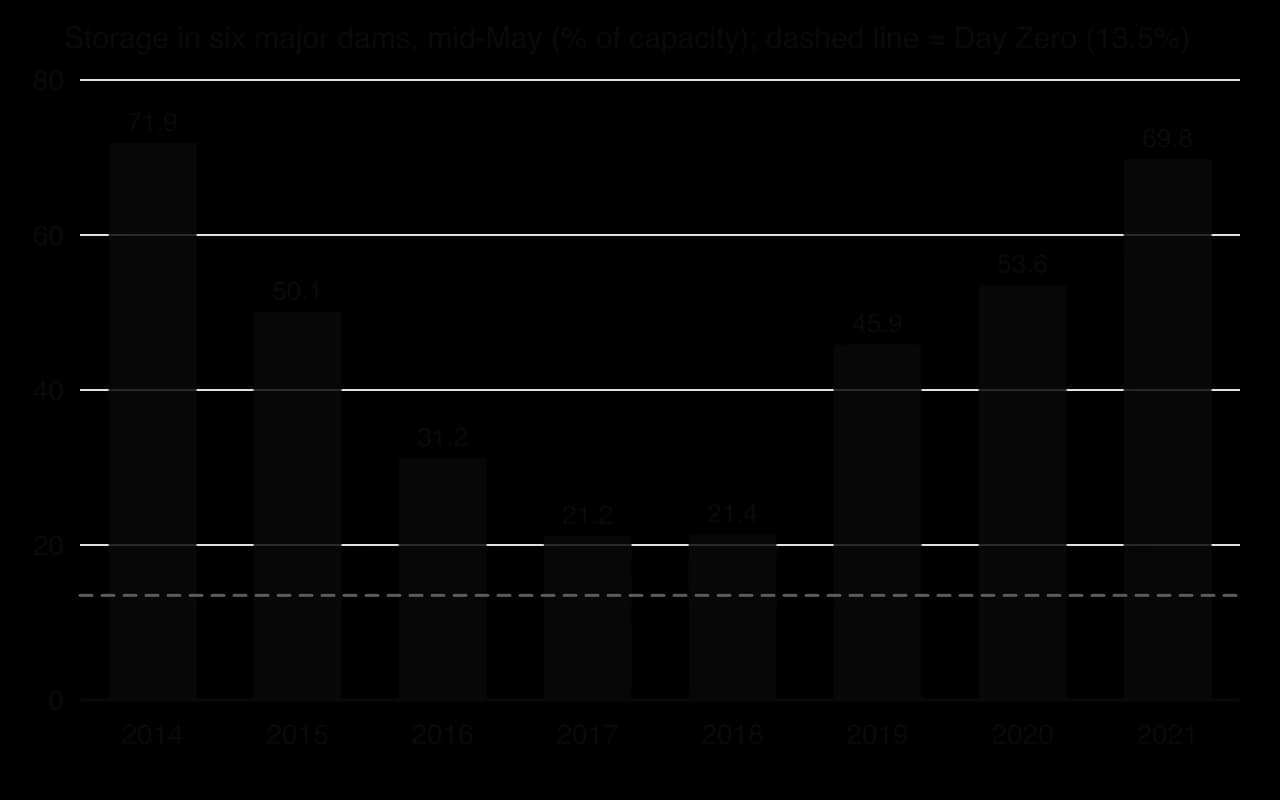
By late 2017 the city calculated that, at the current rate of use, the dams would fall to 13.5% of capacity in April 2018. At that level, called “Day Zero”, the city planned to turn off most household taps and supply residents with 25 L per person per day from 149 collection points. The projected date was moved several times, between 12 April and 11 May 2018, as rainfall and consumption changed.
The city responded with a series of increasingly strict restriction levels, which acted as legal limits on household use. The limits per person per day are summarised in the table.
Date in force | Restriction level | Limit per person per day | Notes |
|---|---|---|---|
1 June 2017 | Level 4 | 100 L | First limit expressed per person |
3 September 2017 | Level 5 | 87 L (city target 500 million L a day) | City-wide use target of 500 million L a day |
1 February 2018 | Level 6B | 50 L | Strictest level; urban users expected to cut use by 45% |
November 2018 | Level 3 (relaxed) | 105 L | Restrictions eased after good winter rains |
Total use fell by more than half between 2015 and 2018, to about 500 million L a day in March 2018, with a lowest recorded daily total of 481 million L on 2 July 2018. The 50 L limit was about a third of typical household use per person in the United Kingdom. Agriculture in the Western Cape cut its water use by about 60% between 2017 and 2018.
Demand management carried most of the effort. Restrictions were combined with rising block tariffs: water above 35,000 L a month cost R768.64 per 1,000 L, many times the basic rate. Households that repeatedly exceeded limits had water management devices fitted that cut off supply after 350 L a day, and fines of R500–3,000 could be imposed. The city also lowered water pressure across the network, which reduces leakage.
Communication made the crisis visible. Announcing a specific Day Zero date turned an abstract shortage into a deadline, and newspapers, schools and businesses ran water-saving campaigns: one campaign reached 358 schools and cut their night-time water flow by 28% through maintenance alone.
Supply augmentation played a smaller part. The city pumped extra water from the Atlantis aquifer (about 5 million L a day), brought the Molteno reservoir back into use and contracted three small temporary desalination plants (two of 7 million L a day and one of 2 million L a day). Plans for a large permanent desalination plant were dropped because of its high cost per unit of water. A private water users’ association released 10 million L from its dam to the city in February 2018.
Day Zero never arrived. Above-average winter rain in 2018 raised the dams to a peak of 76%, Day Zero was postponed indefinitely on 28 June 2018, and good rains in 2020 refilled the dams to 95%. The crisis showed that a large city can cut its water use by half in a short time when the threat is clear and the measures are enforced.
The costs were uneven. About 37,000 jobs were lost in the Western Cape, mainly in agriculture, and tourism bookings fell. The city lost revenue from water sales, nearly R2 billion, because people used less water, which made it harder to pay for new supply. Wealthier households could drill private boreholes or install rainwater tanks, while residents of informal settlements, who already used very little water from communal taps, had no way to cut further. In 2016/2017, informal settlements received only 3.6% of the province’s water supply even though they housed about a fifth of Cape Town’s people.
Governance was contested. Under the National Water Act of 1998 the national government is responsible for bulk water resources, while the city distributes water to users. The city and the province were governed by the Democratic Alliance and the national government by the African National Congress, and each blamed the other for delays in investment. A climate attribution study found that climate change had made a drought as severe as 2015–2017 about three times more likely (a factor of 3.3, range 1.4–6.4), and that the risk will continue to grow with further warming.
Stakeholder | Perspective and interests | Response or experience |
|---|---|---|
City government | Anthropocentric manager: keep the taps running at least cost | Restrictions, tariffs, pressure reduction, the Day Zero campaign |
National government | Responsible for bulk water; competing national priorities | Accused of slow funding; maintained bulk restrictions until dams reached 85% |
Wealthy households | Individual security; able to pay for alternatives | Drilled private boreholes and installed rainwater tanks |
Informal settlements | Already very low use; equity | Little change possible; most exposed if taps had been turned off |
Farmers | Livelihoods and exports depend on irrigation | Restrictions of 50% (Breede Valley) to 87% (Lower Olifants River Valley); most of the 37,000 lost jobs |
Climate scientists | Long-term risk is rising | Attributed part of the drought to climate change; argued for permanent diversification |
Cape Town shows that water security depends on human systems as much as on rainfall. A middle-income city with good infrastructure became water-insecure because its population grew faster than its storage, because it relied on a single type of source (rain-fed surface reservoirs), and because the storage had no buffer for several dry years in a row.
The response confirms that demand management (rationing, metering, tariffs and public communication) can be faster and cheaper than new supply, and that the burden of conservation falls unequally between social groups. Since the crisis, Cape Town’s Water Strategy (2020) has committed the city to diversify its supply, adding more than 300 million litres a day from groundwater, water reuse and desalination, which follows the same logic as Singapore’s Four National Taps.
Sources: Wikipedia, Cape Town water crisis (2026), using City of Cape Town dam level data; World Weather Attribution, The role of climate change in the 2015–2017 drought in the Western Cape of South Africa (2018); City of Cape Town, Cape Town Water Strategy (2020).
Water scarcity describes a shortage of water quantity. Water stress is a broader idea: like scarcity, it measures the limitation of supply, but it also takes account of whether the water is clean enough to use, whether enough is left in rivers for ecosystems, and whether people can actually reach it. A region can therefore have plenty of water, and so no scarcity, yet be water-stressed because its rivers are too polluted to drink from.
The water that must stay in a river to keep it healthy is called its environmental flow. Fish, wetlands, estuaries and the people who fish or farm along the river all depend on a certain volume and timing of flow. If water stress is measured only by comparing withdrawals with total river flow, it ignores the fact that much of that flow is not really available without damaging the river.
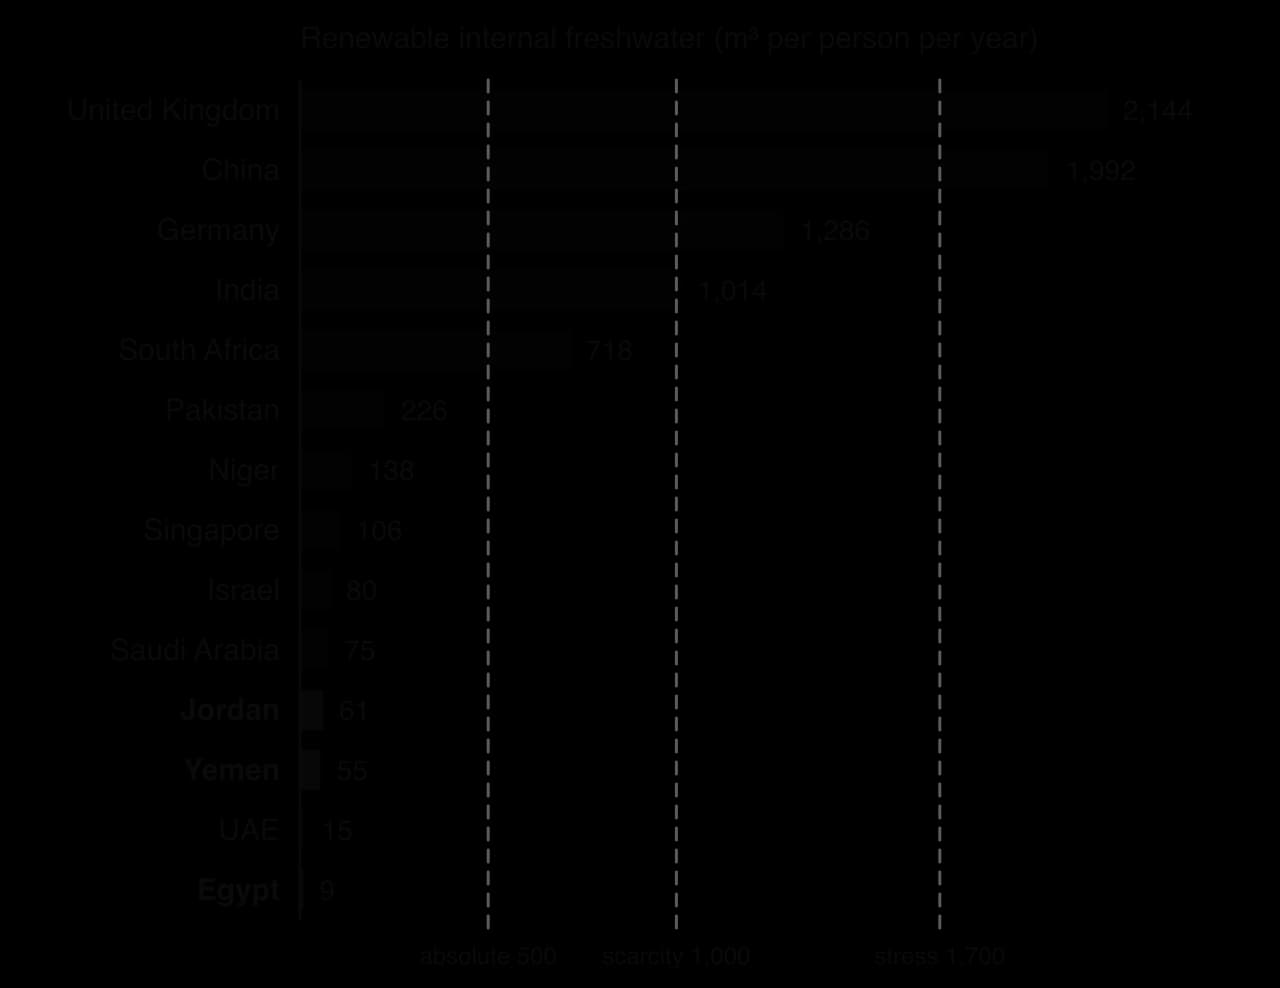
Two measures are widely used. The Falkenmark indicator divides a country’s renewable freshwater resources by its population. Below 1,700 m³ per person per year a society is water-stressed; below 1,000 m³ it faces water scarcity; below 500 m³ it faces absolute scarcity. The threshold is based on an estimate of the water needed per person for domestic use, food production, industry and the environment.
The second measure, used to monitor SDG target 6.4, is the level of water stress: total freshwater withdrawn by all sectors as a percentage of renewable freshwater resources, after subtracting environmental flow requirements. Values above 100% mean a country withdraws more than its renewable supply, which is only possible by mining fossil groundwater, desalinating seawater or reusing wastewater.
Country | Level of water stress, 2022 (withdrawals as % of available renewable freshwater) |
|---|---|
United Arab Emirates | 1,510% |
Saudi Arabia | 974% |
Yemen | 170% |
Egypt | 141% |
Pakistan | 110% |
Jordan | 105% |
South Africa | 68% |
India | 66% |
China | 42% |
United States | 28% |
United Kingdom | 14% |
Brazil | 1.5% |
Sources: World Bank, World Development Indicators, SDG indicator 6.4.2 (2022).
Jordan has only about 61 m³ of internal renewable freshwater per person per year, far below even the 500 m³ absolute scarcity line, and withdraws about 105% of its available renewable water. The reasons are both physical and human. Most of the country is desert with low, unreliable rainfall; its main river, the Jordan, is shared with upstream countries that take much of its flow; and its population has grown rapidly, including large numbers of refugees from neighbouring conflicts. Groundwater is pumped faster than it is recharged, so water tables fall and the country increasingly depends on treated wastewater for irrigation and on plans for desalination.
Sources: World Bank, World Development Indicators (2022).
The causes of rising water stress depend on a society’s socio-economic context, and people in different situations see the problem differently. Two contrasting perspectives illustrate this.
China has about 18% of the world’s population but only about 6% of its freshwater, and about 80% of that water is in the south, while the drier north depends heavily on groundwater. Rapid industrialisation since the 1980s has increased industrial withdrawals, which reached about 97 km³ in 2022, including power-station cooling, and has polluted many rivers with industrial waste.
In 2006 the national environmental agency reported that 60% of the country’s rivers suffered from pollution. Here water stress comes as much from quality as from quantity, and from the perspective of a growing industrial economy it is a constraint on development to be solved by engineering, such as the South–North Water Transfer Project, and by pollution control.
Yemen is one of the most water-stressed countries in the world, with about 55 m³ of internal renewable water per person per year. Its rapidly growing population depends on groundwater, which is pumped far faster than it is recharged: in the Sana’a basin, water tables have been falling by several metres a year.
Most of the water is used for irrigation, and a large share of that irrigates qat, a mildly narcotic plant grown as a cash crop. Long civil conflict has also damaged water infrastructure. From the perspective of a poor farming household, pumping more groundwater for a profitable crop is rational in the short term, even though collectively it is draining the aquifer, a form of the tragedy of the commons.
Sources: Wikipedia, Water resources of China (2026) and Water supply and sanitation in Yemen (2026); World Bank, World Development Indicators (2022).
China (emerging economy) | Yemen (low-income country) | |
|---|---|---|
Main driver | Industrialisation, urbanisation, uneven distribution of water | Population growth, over-abstraction of groundwater for irrigation |
Quantity or quality? | Both: large withdrawals and severe pollution | Mainly quantity: aquifers being depleted |
Economic context | Rapid growth; capital available for large projects | Poverty; conflict; little investment |
Typical response | Water transfers, pollution regulation, efficiency targets | Humanitarian supply, wells, tankers; few long-term options |
The planetary boundaries model identifies nine Earth-system processes that keep the planet in the stable state of the Holocene, the last 11,700 years in which human civilisation developed. One of them is freshwater change. Rising human demand on a limited freshwater supply increases water stress and raises the risk of abrupt and irreversible changes to the hydrological system, such as rivers that no longer reach the sea, wetlands that dry out permanently, or forests that lose the rainfall they generate themselves.
When the model was first published in 2009, the freshwater boundary was set as consumptive use of run-off of less than 4,000 km³ per year, a figure some scientists argued was too generous. In the 2023 update the boundary was redefined in two parts. Blue water is liquid water in rivers, lakes and groundwater; its control variable is the percentage of the global land area where river flow deviates from its natural Holocene range. Green water is the water held in soil and used by plants; its control variable is the percentage of land area where root-zone soil moisture deviates from its Holocene range.
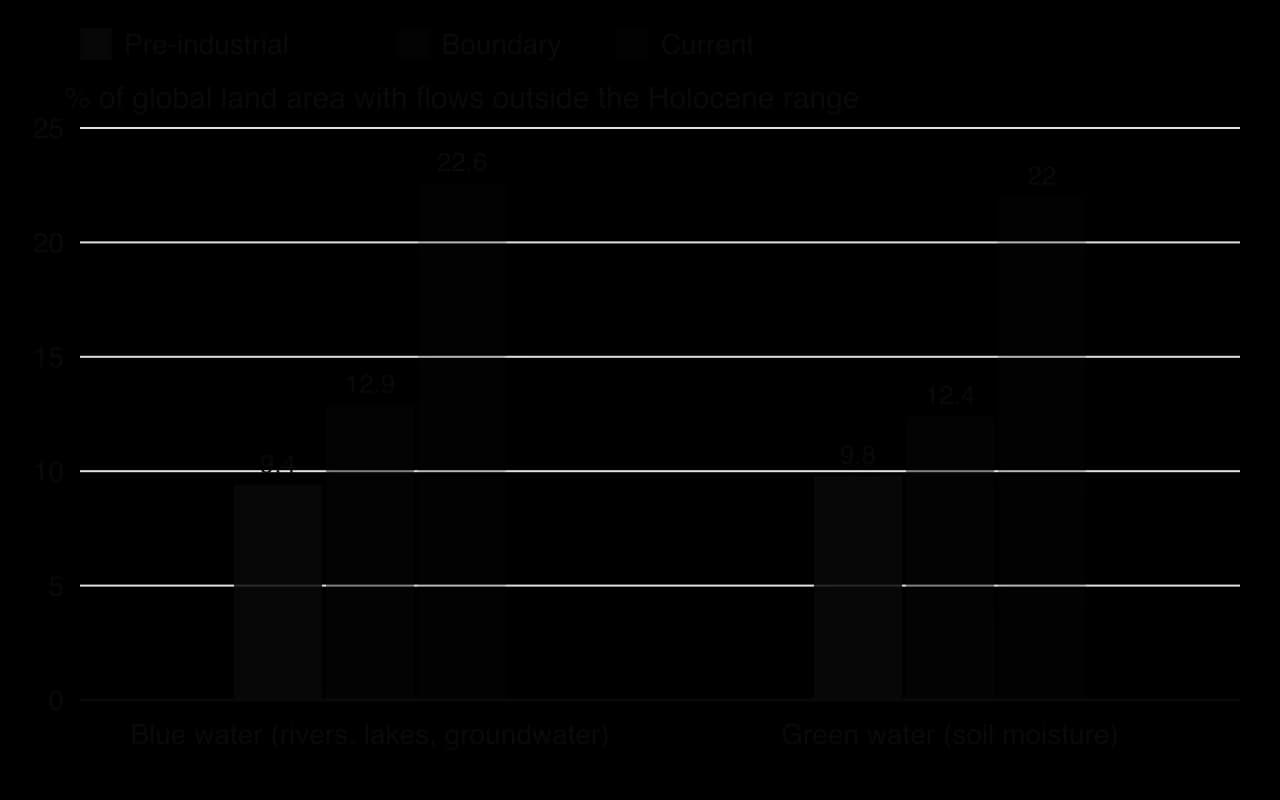
Both components were found to be beyond their boundaries, and freshwater change became in 2023 the sixth of the nine boundaries judged to have been crossed. In the 2025 and 2026 Planetary Health Checks, blue water deviations covered 22.6% of land area against a boundary of 12.9%, and green water deviations 22.0% against 12.4%. The green water component is a reminder that land use matters as well as withdrawals: deforestation, drainage and irrigation all change soil moisture and the water vapour that plants return to the atmosphere.
Reduce withdrawals, especially for irrigation, through efficient irrigation combined with caps on total use.
Protect environmental flows in rivers by law, so that some water always reaches wetlands and the sea.
Protect forests and wetlands that recycle moisture and store water, which keeps green water flows near their natural range.
Reduce the water footprint of diets and products, which shifts demand away from the most water-intensive goods.
Govern shared rivers and aquifers cooperatively, so that no user can deplete a resource that others depend on.
The model has limitations as a guide to action. Freshwater problems are regional, so a single global percentage can hide severe local crises and areas with plenty of water. The choice of Holocene variability as the baseline is a scientific judgement, and green water in particular is hard to measure. Nevertheless, the boundary turns many local water crises into a measurable global trend.
Sources: Wikipedia, Planetary boundaries (2026), citing Richardson et al. (2023).
Water flows across property lines, city boundaries and national borders, so no single user can manage it alone. If each user takes as much as it can, a river or aquifer may be depleted even though no one intended it. Governance means the rules, institutions and agreements that decide who may take how much water, when and at what price, and how disputes are settled. It operates at every scale, from a household to a river basin shared by several countries.
A common local regulation during drought is a ban on using a hosepipe to water gardens or wash cars. In England, water companies can impose these temporary use bans under the Water Industry Act 1991, whose powers were widened by the Flood and Water Management Act 2010; bans were introduced during the droughts of 2022 and 2025, for example by Yorkshire Water, Thames Water, Southern Water and South East Water in 2025. Cape Town’s restriction levels were a stricter version of the same tool, with per-person limits backed by tariffs, fines and flow-limiting devices.
Local regulations act quickly and are easy to understand. They depend on enforcement, which is difficult when millions of households are involved, and on public cooperation, which is easier when people trust that the burden is shared fairly.
The Murray–Darling Basin covers about one-seventh of Australia’s land area and provides about one-third of the country’s food supply, and irrigation accounts for about 95% of the water taken from its rivers. By the 1990s, withdrawals were so high that the river system was degraded, and the states sharing the basin introduced a cap on diversions.
During the severe drought of the 2000s parts of the river system stopped flowing. The Water Act 2007 created the Murray–Darling Basin Authority, and its Basin Plan, adopted in November 2012, set sustainable diversion limits and aimed to return about 2,750 billion litres (2,750 GL) a year to the rivers as environmental flows, partly by buying water entitlements from farmers.
A key feature is that water entitlements can be traded: a farmer who saves water can sell it to another user, which moves water to its most valuable uses within the cap. The Plan has been criticised, however. A South Australian Royal Commission in 2019 called the process for setting the limits a “major failure”, and large fish kills in the river system in the summer of 2018–2019 suggested that the environment was still not receiving enough water.
When rivers cross borders, international agreements become necessary. The Indus river system rises in the Himalaya, in Tibet, India and Indian-administered Kashmir, and flows into Pakistan, where they irrigate most of the country’s farmland. After the partition of British India in 1947 created two independent and hostile states on the same river system, the Indus Waters Treaty was signed in 1960 by India and Pakistan, with the World Bank as mediator. It gave the three eastern rivers (Ravi, Beas and Sutlej) to India and the three western rivers (Indus, Jhelum and Chenab) to Pakistan, with India allowed limited uses such as run-of-river hydroelectric power on the western rivers.
The treaty survived several wars and was often cited as an example of successful water diplomacy, with a Permanent Indus Commission and procedures for neutral experts and courts of arbitration to settle disputes over dams such as Kishanganga and Ratle. On 23 April 2025, after a militant attack in Pahalgam in Indian-administered Kashmir, India suspended the treaty, and Pakistani leaders warned that stopping the flow of its rivers would be treated as an act of war. The case shows both the value of a binding agreement and its vulnerability to wider political conflict.
Sources: Wikipedia, Hosepipe ban (2026), Murray–Darling basin (2026), Murray–Darling Basin Authority (2026) and Indus Waters Treaty (2026).
Many of the world’s largest rivers, lakes and aquifers are shared by two or more countries. When a river crosses a border, the upstream country can change the quantity, timing and quality of the water that reaches its downstream neighbours, for example by building dams, diverting water for irrigation or discharging pollution. A transboundary water dispute arises when countries disagree about these uses, and it can increase water stress for whichever country loses access.
The Nile is formed by two main branches. The White Nile flows from the Lake Victoria region through Uganda and South Sudan, and the Blue Nile flows from the Ethiopian Highlands. Rivers rising in Ethiopia supply most of the Nile’s water, estimated at 80–86% of its total flow. The two branches join at Khartoum in Sudan and flow north to Egypt, which depends on the Nile for about 90% of its water.
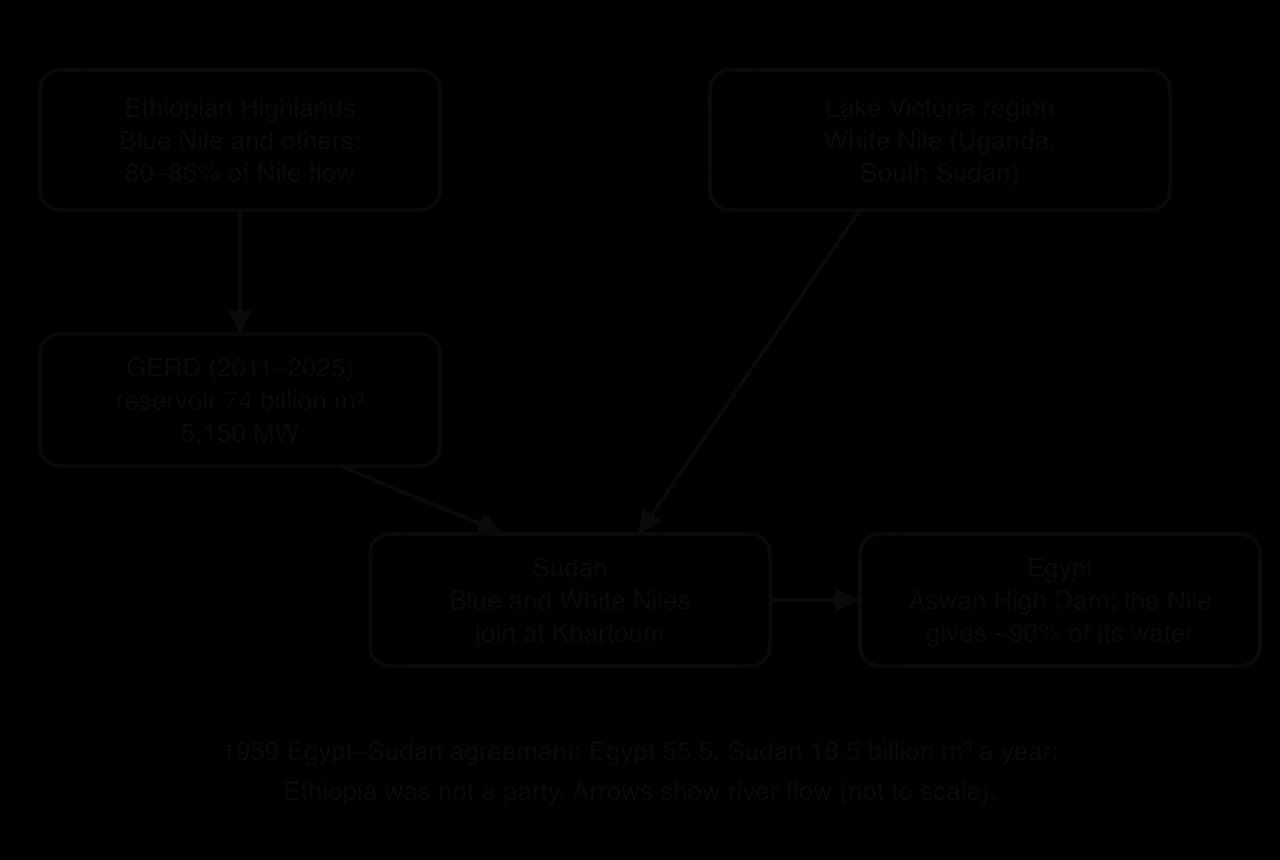
In 1929 an agreement between Egypt and Anglo-Egyptian Sudan, then under British control, allocated 48 billion m³ a year to Egypt and 4 billion m³ to Sudan, reserved the dry-season flow for Egypt and gave Egypt the right to veto upstream projects that would harm its interests. In 1959 Egypt and an independent Sudan divided the average annual flow measured at Aswan, about 84 billion m³, between themselves: 55.5 billion m³ for Egypt and 18.5 billion m³ for Sudan, with about 10 billion m³ lost to evaporation. Ethiopia and the other upstream countries were not parties to either agreement and do not accept them as binding.
Upstream countries began signing a Cooperative Framework Agreement, negotiated through the Nile Basin Initiative, in 2010. Egypt and Sudan refused to sign it, arguing that it threatened their historic shares. After ratification by six upstream states, it entered into force on 13 October 2024.
Ethiopia began building the Grand Ethiopian Renaissance Dam (GERD) on the Blue Nile, about 14 km from the border with Sudan, in April 2011. It is 145 m high, has a reservoir capacity of 74 billion m³ and an installed capacity of 5,150 MW. Filling began in July 2020 and was completed in five stages by October 2024, and the dam was inaugurated on 9 September 2025.
Egypt feared that rapid filling of a reservoir almost as large as the Nile’s annual flow would cut the water reaching Aswan, especially in a drought. In negotiations hosted by the United States in 2019–2020, Egypt asked for at least 40 billion m³ a year to be released and for filling to take seven years, while Ethiopia offered 35 billion m³. No binding agreement was reached, and talks moved to the African Union. Sudan’s position shifted over time: the dam could regulate floods and supply cheap electricity, but Sudan also wanted guarantees about dam safety and releases.
Country | Interests and arguments |
|---|---|
Ethiopia | Supplies most of the water; needs electricity for development; colonial-era treaties excluded it; the dam is for power, not consumption, so water still flows downstream |
Egypt | Almost entirely dependent on the Nile; rapidly growing population; claims historic rights under the 1929 and 1959 agreements; fears reduced flow in drought years |
Sudan | Could gain flood control and cheap electricity; concerned about dam safety and coordination with its own dams; caught between its neighbours |
Sources: Wikipedia, Grand Ethiopian Renaissance Dam (2026), Water politics in the Nile Basin (2026) and Nile Basin Initiative (2026).
The GERD dispute shows several general features of transboundary disputes: an imbalance between where water originates and where it is used; agreements from a colonial era that newer states reject; disagreement about whether a dam that only stores water, rather than consuming it, harms downstream users; and the absence of a basin-wide treaty that all parties accept. Cooperation, for example agreed rules for filling and drought releases, could benefit all three countries; the obstacle is political trust rather than hydrology.
The water footprint of a product, person or nation is the total volume of freshwater used to produce the goods and services consumed, measured in volume per unit of time or per unit of product. The concept was introduced in 2002 by Arjen Hoekstra. It counts not only the water used directly, such as drinking and washing, but also the hidden water used to grow food, make clothes and manufacture goods.
A water footprint has three components. The green water footprint is rainwater stored in the soil and used by crops. The blue water footprint is surface water or groundwater that is evaporated or incorporated into a product, mainly through irrigation. The grey water footprint is the volume of freshwater needed to dilute the pollution produced to meet water-quality standards. Separating the components matters: a kilogram of wheat grown with rain in a wet country has a large green footprint but puts little pressure on rivers, while the same wheat irrigated from a depleting aquifer has a large blue footprint.
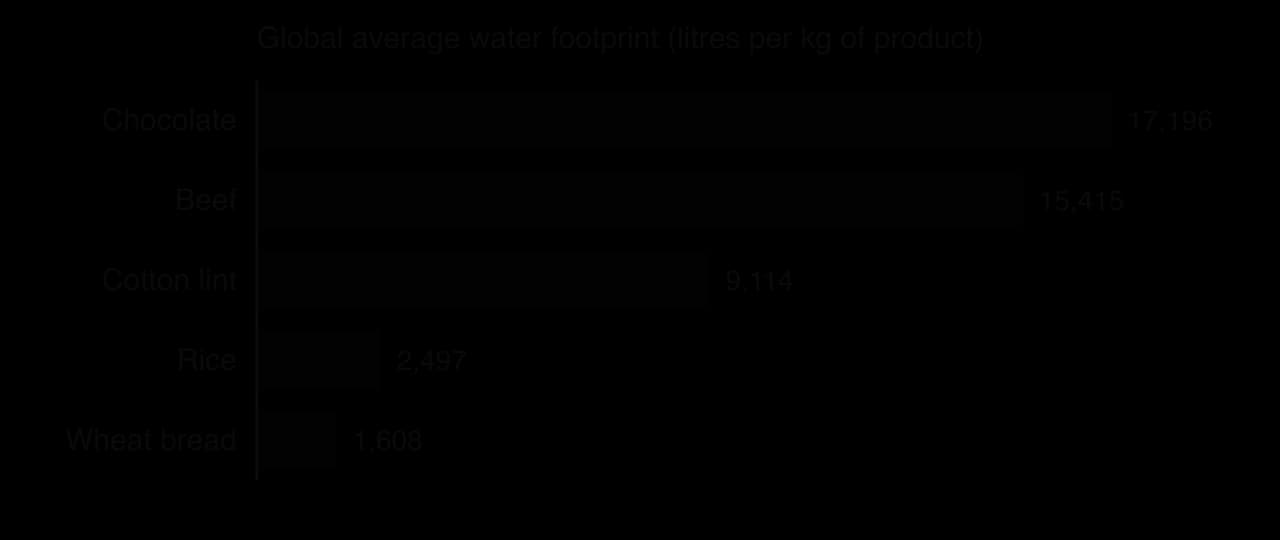
Nations have water footprints too. Between 1996 and 2005 the global average footprint was about 1,385 m³ per person per year, and the average in the United States (about 2,842 m³) was more than double that of China (about 1,071 m³) or India (about 1,089 m³). Much of a nation’s footprint can lie in other countries, because the water used to grow imported food and fibre stays where it was used. This hidden trade in water is called virtual water: crops and crop products account for about 76% of virtual water flows between countries.
A water-scarce country can save its own water by importing water-intensive goods, such as cereals, rather than growing them, and by exporting goods that need little water.
Companies can identify where in their supply chain water is used and polluted, and choose suppliers in less stressed basins.
Consumers can compare products and diets, for example the much smaller footprint of plant-based foods.
Comparing a footprint with the renewable water available in the place where it occurs shows whether that use is sustainable.
A single volume can mislead. A litre of rainwater used by a crop in a wet region is not equivalent to a litre pumped from a depleting aquifer in a desert, yet both are added together in a total footprint. Figures are global averages that vary greatly between farms and countries, and the grey water component depends on the quality standard chosen. Importing virtual water can make a country dependent on world food markets, and exporting it can deplete the water of poorer producing countries, an issue of environmental justice.
Citizen science, also called community or crowdsourced science, is scientific research in which members of the public collect or analyse data. Anyone can take part, everyone follows the same protocol so that their data can be combined, and the data are usually open access. Water is well suited to citizen science because rivers, ponds and lakes are everywhere, change quickly, and are far too numerous for official agencies to sample often.
FreshWater Watch, run by the charity Earthwatch Europe since 2012, trains volunteer groups to measure nitrate and phosphate concentrations with simple colour-change test tubes, and water clarity (turbidity), and to upload their results with photographs to a shared global database. Tens of thousands of datasets have been collected, and pilot projects in Zambia, Tanzania, Malawi and Sierra Leone are testing whether such data can help countries report progress on SDG indicator 6.3.2 (the proportion of water bodies with good ambient water quality).
Sources: Earthwatch Europe, FreshWater Watch (2025).
Benefits | Limitations |
|---|---|
Many more sites and dates sampled than an agency could afford | Simple kits are less precise than laboratory analysis; readings fall in ranges, not exact values |
Detects pollution events quickly and locally | Volunteers vary in skill; errors and bias if training is poor |
Data are open and free, so communities and researchers can use them | Sampling is uneven: more data near towns and active groups, less in remote areas |
Raises awareness and gives people a sense of ownership of their local water | Agencies and courts may not accept the data as evidence without validation |
Low cost; builds local scientific capacity | Projects depend on funding and volunteer enthusiasm, so long-term records may stop |
Whether accurate water-quality data can be crowdsourced depends on the variable and the protocol. Simple measurements such as temperature, clarity or the presence of indicator invertebrates can be very reliable after training, and studies of citizen science in general find that well-designed projects can produce data of comparable quality to professional surveys. Precise concentrations of nutrients or toxic metals still need calibrated instruments and laboratory checks. Citizen data are therefore most useful as a screening tool that shows where official monitoring should focus.
When conservation is not enough, societies turn to industrial-scale supply. These methods produce, store or move large volumes of water using engineering, capital and energy. They differ in how much energy they need, what they cost, and what they do to ecosystems and to other users.
Method | How it works | Example or note |
|---|---|---|
Dams and reservoirs | Store river flow from wet periods | Most large cities rely on them; see the costs listed for dams |
Water transfer | Canals, tunnels or pipelines move water between river basins | China’s South–North Water Transfer Project: planned 44.8 km³ a year; about 330,000 people resettled |
Pipelines and tankers | Carry water to places without local supply | Islands and conflict zones; tankers are expensive per litre |
Estuary storage with barrages | A barrier across a river mouth keeps out seawater and stores river water | Singapore’s Marina Barrage (2008) |
Rainmaking (cloud seeding) | Particles released into clouds encourage droplets to form and fall | UAE programme since the late 1990s; benefits uncertain |
Desalination | Reverse osmosis or distillation of seawater | Middle East and North Africa produce 48% of the world’s desalinated water |
Solar distillation | Sunlight evaporates salty water; vapour condenses on a cool surface | Low-tech, small scale, no fuel; low output per square metre |
Dew harvesting | Surfaces that cool at night condense water vapour from the air | Small volumes; useful in arid coastal or highland areas with humid nights |
Water treatment plants | Make polluted river water or wastewater safe to use | Singapore’s NEWater; turns water stress caused by quality into usable supply |
Aquifer storage and recovery (ASR) | Surplus water injected into an aquifer through wells and pumped back out when needed | Salisbury, South Australia, since 1994 |
Artificial recharge (AR) | Water spread in basins or injected to raise groundwater levels faster than natural recharge | Used to restore depleted or saline aquifers |
Sources: Wikipedia, South–North Water Transfer Project (2026), Cloud seeding in the United Arab Emirates (2026) and Aquifer storage and recovery (2026); Jones et al. (2019).
Aquifers are natural reservoirs that do not lose water to evaporation, take up no land at the surface and filter water as it moves through rock. Aquifer storage and recovery uses this: in wet seasons, surplus treated water, river water or recycled water is injected into an aquifer through wells, and in dry seasons it is pumped back out through the same wells. Artificial recharge adds water to an aquifer faster than natural recharge would, often by spreading it in infiltration basins where it percolates down, to raise a falling water table or push back salt water.
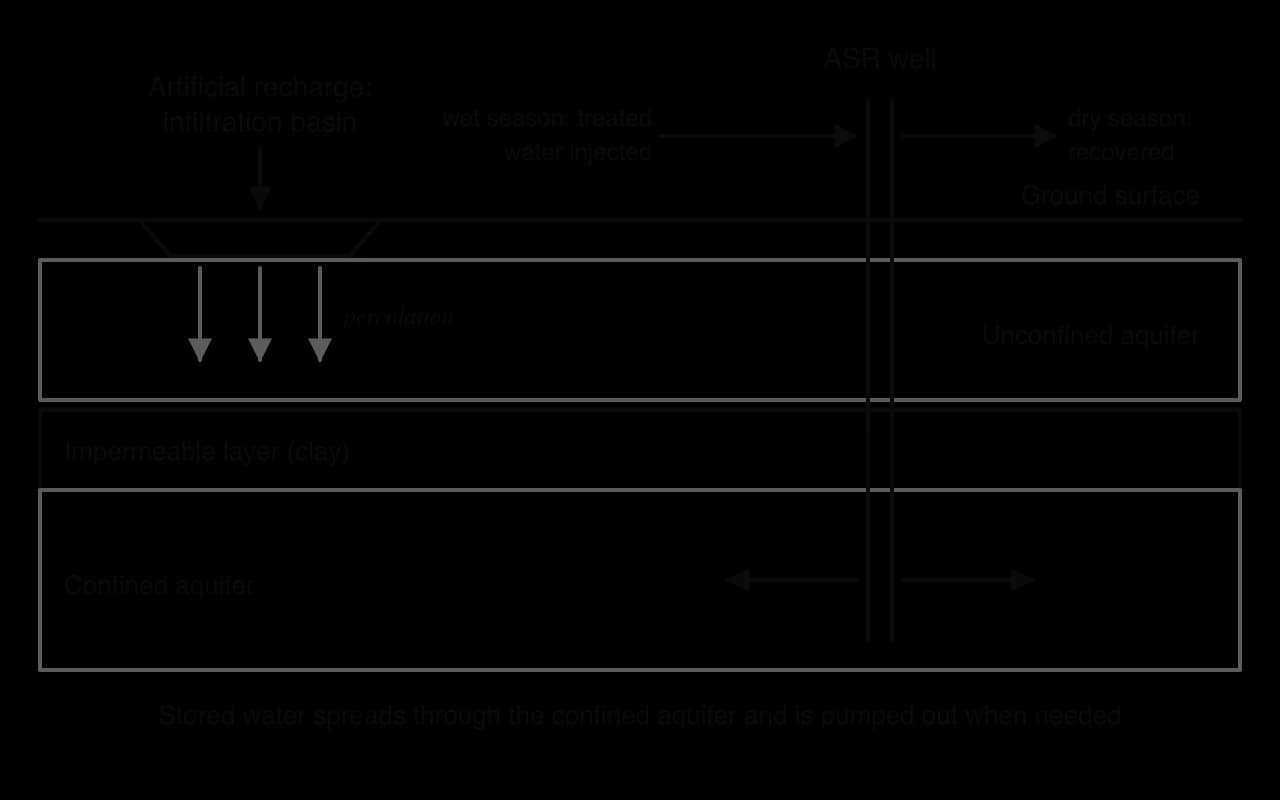
Underground storage is cheaper than building new surface reservoirs and avoids flooding land. Its limitations are that some injected water mixes with poorer-quality groundwater or is lost, wells can clog, and injected water can react with minerals in the rock. Careful monitoring is needed to make sure the recovered water is safe to use.
Cloud seeding releases particles such as silver iodide or salt crystals into clouds from aircraft, drones or flares, to provide surfaces on which water droplets or ice crystals can form and grow heavy enough to fall. The United Arab Emirates has run a programme since the late 1990s, with 247 seeding missions in 2019. Estimates of the increase in rainfall vary widely, and because each cloud is different, it is very hard to prove how much extra rain any seeding produced. Cloud seeding cannot create rain from clear skies and only works when suitable clouds are already present.
Investigating the causes of water stress in a society with secondary data is a useful skill. Databases such as the World Bank’s World Development Indicators and FAO AQUASTAT give, for each country, renewable water per person, withdrawals by sector and the SDG 6.4.2 level of water stress. Comparing these with population growth or GDP over time shows whether stress is driven mainly by population, by agriculture, by industry or by a falling supply.
Every industrial method of producing freshwater has environmental costs. Good design can make them smaller, but the laws of physics and chemistry mean that removing salt, pumping water uphill or moving it long distances always needs energy and always leaves wastes.
Desalination separates seawater into freshwater and brine, a concentrated salt solution. A global review published in 2019 estimated that about 15,900 desalination plants were producing around 95 million m³ of freshwater a day, and around 142 million m³ of brine, more brine than freshwater. Saudi Arabia, the United Arab Emirates, Kuwait and Qatar together produced 55% of the world’s brine.
Brine is denser than seawater, so it sinks and spreads across the seabed, where it can raise salinity and lower dissolved oxygen around the outfall, harming seagrass, corals and bottom-living animals. It may also be warmer than the surrounding sea and can contain chemicals used to clean the membranes and prevent scaling, and metals from corrosion. In an almost enclosed, shallow and already salty sea such as the Persian Gulf, where many plants discharge, these effects accumulate. The intakes also draw in fish eggs, larvae and plankton, which are killed.
Most desalination in the Gulf is powered by burning fossil fuels, so each cubic metre of water adds to carbon dioxide emissions and to air pollutants such as nitrogen oxides. The United Arab Emirates, with only about 15 m³ of internal renewable water per person and a level of water stress of about 1,510%, depends heavily on desalinated water. Its water security is therefore tied to its energy supply and to climate change, which is projected to make droughts more frequent in many dry regions. Pumps, turbines and large plants also produce noise that affects nearby residents and wildlife.
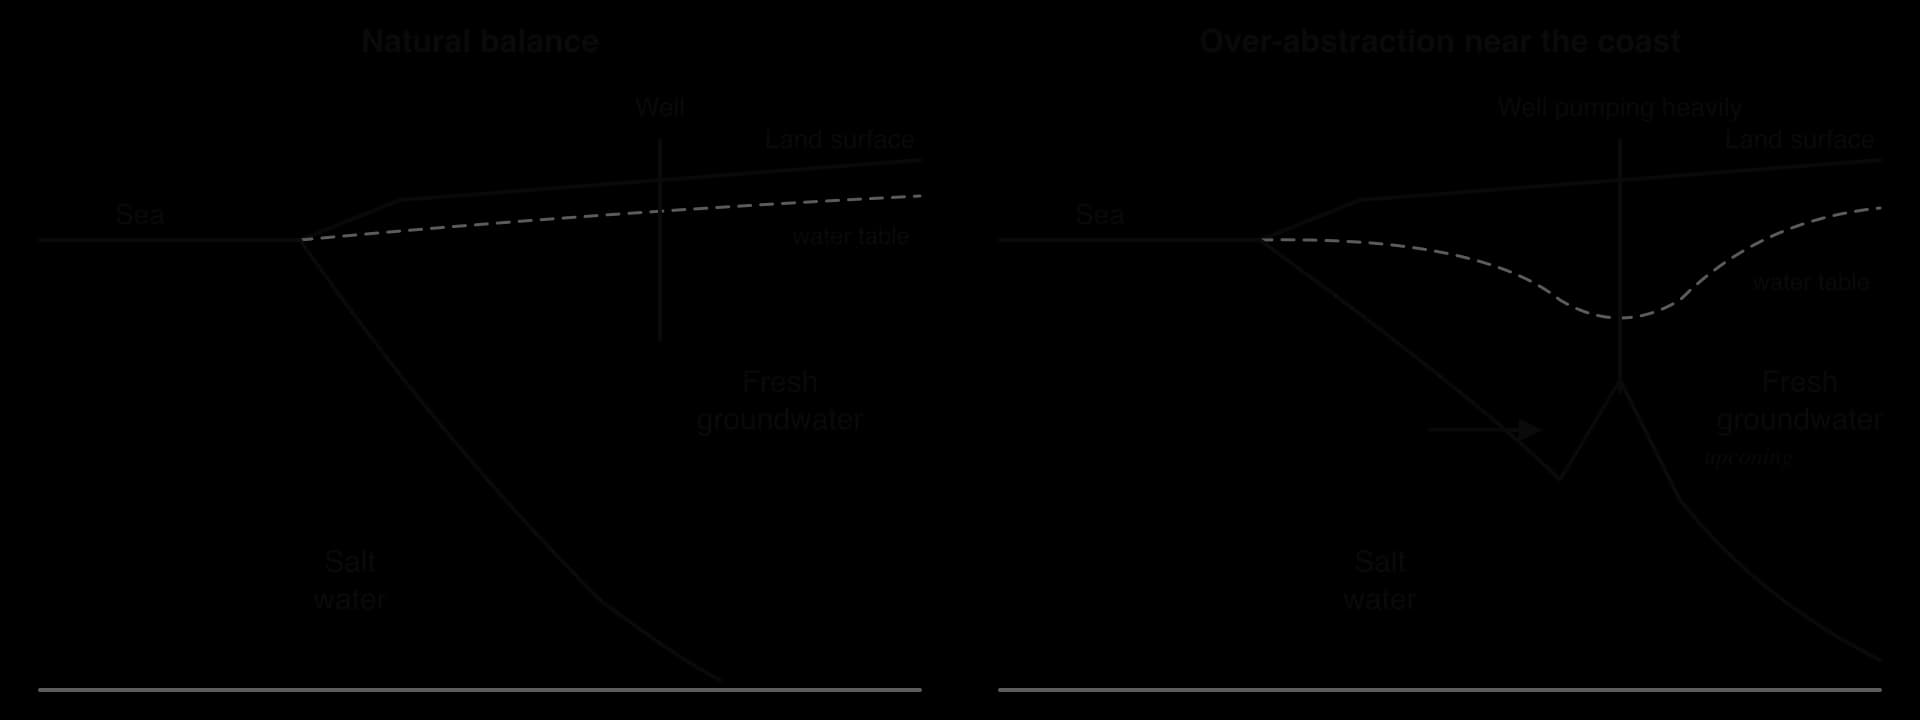
Over-pumping groundwater near the coast can cause saline intrusion. Fresh groundwater normally floats above denser salt water in coastal aquifers, and its pressure holds the salt water back. When pumping lowers the water table, salt water moves inland and rises towards the wells, a process called upconing. In Cape May, New Jersey, groundwater levels fell by up to 30 m and more than 120 supply wells had to be closed. Once an aquifer is salty, it can take decades to recover.
Impact | Ways to reduce it | Why it cannot be removed completely |
|---|---|---|
Brine discharge | Diffusers to mix brine quickly; discharging far offshore in currents; diluting with power-station cooling water; recovering salts and minerals | Every litre of freshwater leaves salt behind somewhere |
Energy and emissions | Energy-recovery devices; better membranes; solar or wind power; locating plants near renewable sources | Separating salt from water has a minimum energy requirement of about 1 kWh per m³ |
Intake of marine life | Screens, slow intake speeds, subsurface (beach-well) intakes | Some plankton and larvae are still drawn in |
Saline intrusion | Limiting pumping near the coast; artificial recharge; monitoring wells | Coastal aquifers remain vulnerable while demand is high and sea level rises |
Noise and air pollution | Insulated buildings; buffer zones; cleaner fuels | Large plants and pumps always produce some noise and need energy |
Sources: Jones et al. (2019), Science of the Total Environment; Wikipedia, Desalination (2026) and Saltwater intrusion (2026); World Bank, World Development Indicators (2022).
From a technocentric perspective, cheaper renewable energy and better brine management may make desalination close to sustainable. From an ecocentric perspective, it encourages ever-rising demand in places that have outgrown their natural water supply and shifts the damage to marine ecosystems. An anthropocentric view would accept desalination for drinking water in genuinely dry regions, alongside strict demand management, but question its use for low-value purposes such as watering golf courses or growing thirsty crops in deserts.
Sanitation is the safe collection, removal and treatment of human waste. Safe water and sanitation go together: without sanitation, faeces contaminate rivers and wells, and diarrhoeal diseases such as cholera spread. Progress is measured by the WHO/UNICEF Joint Monitoring Programme, which defines safely managed drinking water as water from an improved source that is on the premises, available when needed and free from contamination.
In 2024, 2.1 billion people (one in four) lacked safely managed drinking water, including 106 million who drank untreated surface water from rivers, lakes or ponds. 3.4 billion people lacked safely managed sanitation, including 354 million who still practised open defecation. People in the least developed countries were more than twice as likely as others to lack basic drinking water and sanitation, and rural coverage of safely managed drinking water, although rising from 50% in 2015 to 60% in 2024, remained well below that of cities. These inequalities are a clear case of environmental justice: those with the least power carry most of the health burden.
Sources: WHO and UNICEF Joint Monitoring Programme, Progress on household drinking water, sanitation and hygiene 2000–2024 (2025).
Canada has some of the largest freshwater resources in the world, yet many First Nations communities living on reserves have gone years without safe tap water. When a water system cannot be trusted, a drinking water advisory tells residents to boil water or not to drink it; an advisory in place for more than a year is called long-term. Water services on reserves are funded by the federal government, while most Canadians receive water from provincial and municipal systems with stronger standards and funding.
Since November 2015, when the federal government committed to ending long-term advisories on reserves, 158 have been lifted. As of 10 September 2026, 38 long-term advisories were still in effect in 36 communities. Neskantaga First Nation, a remote fly-in community in northern Ontario, has had a boil-water advisory since 1995, the longest in Canada, after its treatment plant was found not to disinfect water properly; in October 2020 the whole community was evacuated after hydrocarbons were found in its water.
Sources: Indigenous Services Canada, Ending long-term drinking water advisories (data as of 10 September 2026); Wikipedia, Neskantaga First Nation (2026).
The causes are not a lack of water but a mix of economic and political factors: remote locations that make construction and maintenance expensive, underfunding, a shortage of trained operators, and a history of colonial policies that left Indigenous communities with less say over their own services. The consequences include skin infections and gastrointestinal illness, the cost and plastic waste of bottled water, and the loss of trust in public institutions. The case shows that water security is not guaranteed by national wealth or abundant rainfall: it depends on who is included in investment and decision-making.
Water access, use and security appears in Paper 1, where an unseen case study often includes data on rainfall, water use or supply in a named place, and in both sections of Paper 2. Short-answer questions ask for definitions, distinctions (physical versus economic scarcity, scarcity versus stress), techniques with their advantages and disadvantages, and simple calculations. Essays usually ask candidates to evaluate strategies for water security or to discuss whether technology or behaviour change is the better response.
The next question asks for evaluation in a short space. Each technique needs an advantage and a disadvantage, and a judgement.
The resource is hypothetical data for a city called Riverside, which draws water from one reservoir.
Year | Population (millions) | Winter rainfall (mm) | Reservoir storage on 1 June (% of capacity) | Water use (L per person per day) |
|---|---|---|---|---|
2019 | 1.80 | 520 | 82 | 210 |
2020 | 1.85 | 380 | 64 | 205 |
2021 | 1.90 | 310 | 41 | 190 |
2022 | 1.96 | 290 | 27 | 120 |
2023 | 2.02 | 505 | 58 | 135 |
Water security is reliable access to sufficient safe drinking water; it depends on quantity, quality and access, and is a key part of a sustainable society.
Social, cultural, economic and political factors decide who has access to freshwater, often more than rainfall does.
Agriculture uses about 71% of world freshwater withdrawals; population growth and economic development increase demand.
Supply can be increased by dams and reservoirs, rainwater catchment, desalination (mostly reverse osmosis) and the enhancement of wetlands, each with costs.
Physical water scarcity means too little water exists; economic water scarcity means water exists but cannot be delivered.
Domestic conservation (metering, rationing, grey water, low-flush toilets, rainwater harvesting) and food-production conservation (drip irrigation, greenhouses, aquaponics, drought-resistant crops, less meat) reduce demand.
Singapore’s Four National Taps and Cape Town’s Day Zero response show supply diversification and demand management working together.
Water stress includes quality, environmental flows and access; below 1,700 m³ per person per year a society is water-stressed. (HL)
Freshwater change is a planetary boundary that has been crossed for both blue and green water; governance from local bans to treaties manages use. (HL)
Transboundary disputes such as the GERD on the Nile, water footprints and citizen science all shape water security. (HL)
Industrial freshwater production causes brine, emissions, noise and saline intrusion that can be reduced but not eliminated. (HL)
Billions of people lack safe water and sanitation, and marginalised groups such as First Nations in Canada are disproportionately affected. (HL)
I can define water security and explain its three components.
I can describe social, cultural, economic and political factors affecting access to freshwater, with examples.
I can explain why population growth and development increase water demand, and calculate changes in demand.
I can evaluate dams, rainwater catchment, desalination and wetland enhancement as ways of increasing supply.
I can distinguish physical from economic water scarcity.
I can evaluate domestic and food-production water conservation techniques.
I can evaluate Singapore’s strategy for water security and use Cape Town as a case study.
I can distinguish water stress from water scarcity and apply the 1,700 m³ threshold. (HL)
I can explain freshwater change as a planetary boundary and give examples of water governance at local and international scales. (HL)
I can discuss a transboundary water dispute, water footprints and citizen science. (HL)
I can evaluate industrial freshwater production and its impacts. (HL)
I can examine unequal access to water and sanitation for a named marginalised group, with statistics. (HL)