Model the hydrological cycle as a system of stores, transfers and transformations, explain how human activities change it, calculate water budgets and, at HL, explain stratification, upwelling and thermohaline circulation.
Each is in the ESS glossary, with every other term in the subject.
The removal of water from a river, lake, reservoir or aquifer by humans, for drinking water, irrigation, industry or energy.
The attraction of water molecules to the molecules of other substances, such as the walls of plant xylem or soil particles.
The horizontal transfer of water vapour, or of the droplets and ice crystals in clouds, by the wind from one place to another.
A body of permeable rock or sediment that holds groundwater and lets it flow, so that water can be stored in it and abstracted from wells and boreholes.
The Atlantic part of the thermohaline circulation: warm, salty surface water flows north, cools and sinks in the North Atlantic, and returns south as cold deep water.
The attraction of water molecules to each other through hydrogen bonds, which gives water its high surface tension and lets it be pulled up through plants in columns.
The transformation of water vapour into liquid water droplets when air cools, which releases latent heat and forms clouds, fog and dew.
Explain how solar radiation and gravity drive the movement of water through the hydrosphere.
Outline the main stores of water on Earth and their relative sizes.
Distinguish between the transfers and transformations of the hydrological cycle.
Construct and annotate a systems diagram of the hydrological cycle.
Explain how agriculture, deforestation and urbanisation alter flows and stores of water, including the causes of flash floods.
Calculate a water budget for a lake or aquifer and use it to judge a sustainable rate of abstraction.
Evaluate the human alteration of a water system, using the Aral Sea as a case study.
Explain how the physical and chemical properties of water support life. (HL)
Explain how the oceans act as a carbon sink, in the short term and the long term. (HL)
Describe stratification, the thermocline and upwelling in lakes and oceans, and their effects on oxygen and nutrients. (HL)
Explain how thermohaline circulation drives the ocean conveyor belt and distributes heat around the planet. (HL)
Water moves continuously between the oceans, the atmosphere, the land and living things. This movement, the hydrological cycle, supplies the fresh water that every land ecosystem and every human society depends on, and it shapes weather, climate and landforms.
Viewing the cycle as a system of stores and flows makes it possible to measure how much water is held in each part, how fast it moves and what happens when people change one part of it. A dam, an irrigation scheme or a new city changes the flows, and the effects are felt downstream and sometimes across a whole region. How societies decide which changes are acceptable depends on their
The official deck for this part of the syllabus.
What is the hydrosphere?
What is the hydrological cycle?
With a free account, Augment remembers where you stopped and what you have practiced.
A lake in a basin with no outlet to the sea, which loses water only by evaporation and seepage, so dissolved salts build up in it.
The transformation of liquid water into water vapour, using heat energy mainly from solar radiation; the main flow from the oceans to the atmosphere.
The combined flow of water vapour to the atmosphere by evaporation from soil and water surfaces and by transpiration from plants.
A sudden flood that rises within minutes to a few hours of intense rainfall, usually because surface run-off reaches rivers or drains faster than they can carry it.
Water held underground in the pores and cracks of soil and rock below the water table, where the ground is fully saturated.
The slow transfer of water through saturated rock or sediment, which feeds springs, rivers, lakes and the sea.
A layer in a water body in which salinity changes rapidly with depth, separating fresher surface water from saltier, denser water below.
A weak attraction between a slightly positive hydrogen atom of one molecule and a slightly negative atom, such as oxygen, of another molecule.
The continuous circulation of water between the oceans, atmosphere, land and living things, driven by solar radiation and gravity, through stores linked by transfers and transformations.
A surface such as concrete, asphalt or a roof that water cannot pass through, so rain becomes surface run-off instead of infiltrating.
The transfer of water from the ground surface into the soil.
The temporary storage of precipitation on leaves, stems and other surfaces before it evaporates or drips and flows to the ground.
The seasonal mixing of a whole lake from top to bottom when surface and deep water reach the same temperature and density, usually in spring and autumn.
Energy absorbed or released when a substance changes state without a change in temperature, such as the heat taken in by evaporation and given out by condensation.
The movement of water down through the soil and into the rock below, under the influence of gravity.
An uneven distribution of electric charge across a molecule; in water the oxygen atom is slightly negative and the hydrogen atoms slightly positive.
The transfer of water from the atmosphere to the Earth's surface as rain, snow, sleet, hail or drizzle.
The addition of water to an aquifer or other store, mainly by percolation of rain and snowmelt; the natural input that limits sustainable abstraction.
A liquid in which other substances dissolve; water dissolves more substances than any other common liquid because its molecules are polar.
The amount of energy needed to raise the temperature of 1 kg of a substance by 1 °C; for water it is about 4,180 J kg⁻¹ °C⁻¹, which is high.
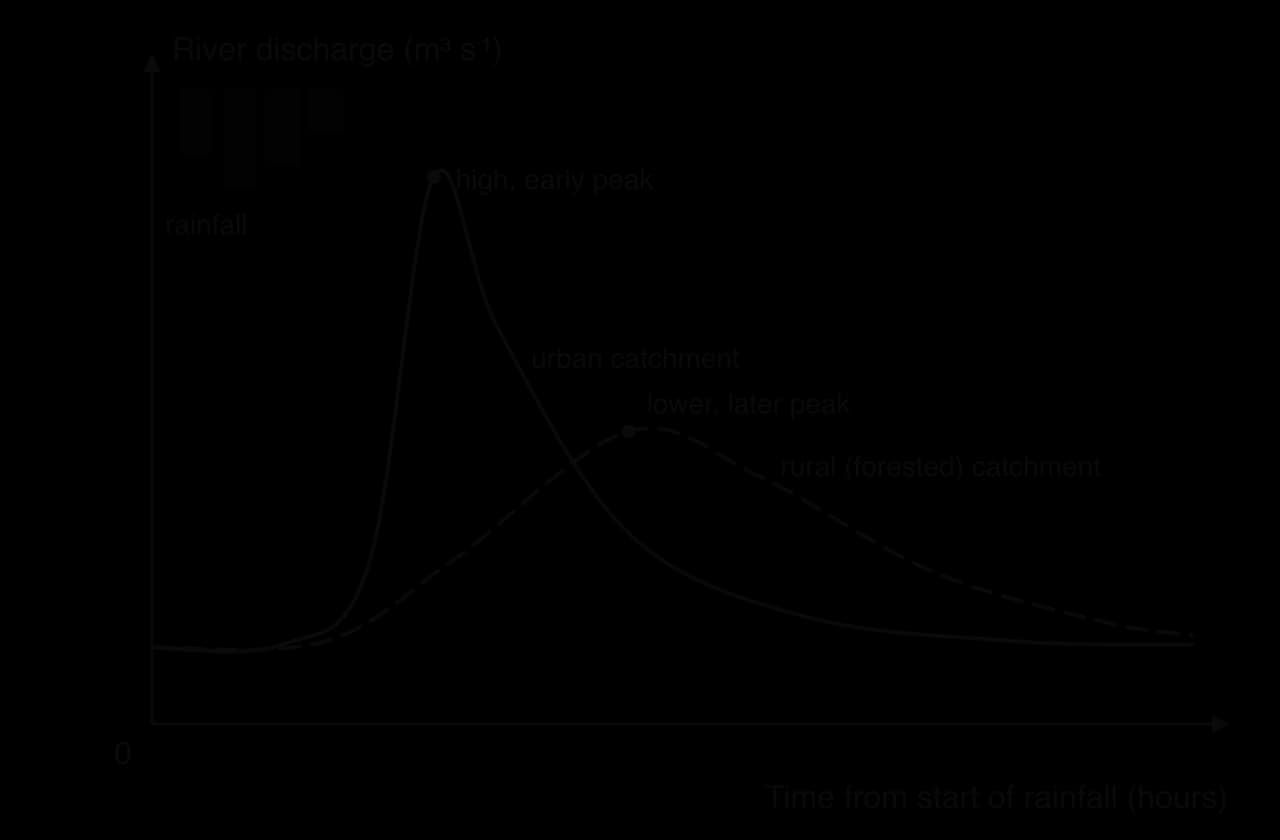
A graph of a river's discharge over time after a period of rainfall; the delay between peak rainfall and peak discharge is the lag time.
The formation of distinct layers in a water body, usually warm, less dense water above cold, denser water, which restricts mixing between them.
The transfer of water along a river or stream channel, downhill towards a lake or the sea.
The transformation of ice or snow directly into water vapour, without first melting into liquid water.
The upper layer of a lake or ocean in which wind and waves keep the water well mixed, so that its temperature, oxygen and salinity are nearly uniform.
The transfer of water over the land surface when rain or meltwater cannot infiltrate the ground fast enough, or the ground is already saturated or impermeable.
Fresh water held on the land surface in lakes, rivers, reservoirs, swamps and other wetlands.
The layer in a stratified water body in which temperature falls rapidly with depth, separating the warm surface mixed layer from the cold deep water.
The global ocean circulation driven by differences in water density, which are caused by differences in temperature and salinity; it carries heat around the planet.
The loss of water vapour from plants, mainly through the stomata of leaves, after water taken up by the roots has moved through the plant.
The rising of cold, dense, nutrient-rich water from depth to the surface, replacing surface water that winds have moved away.
An account of all the inputs and outputs of water for a store such as a lake, aquifer or drainage basin over a period, showing the change in storage.
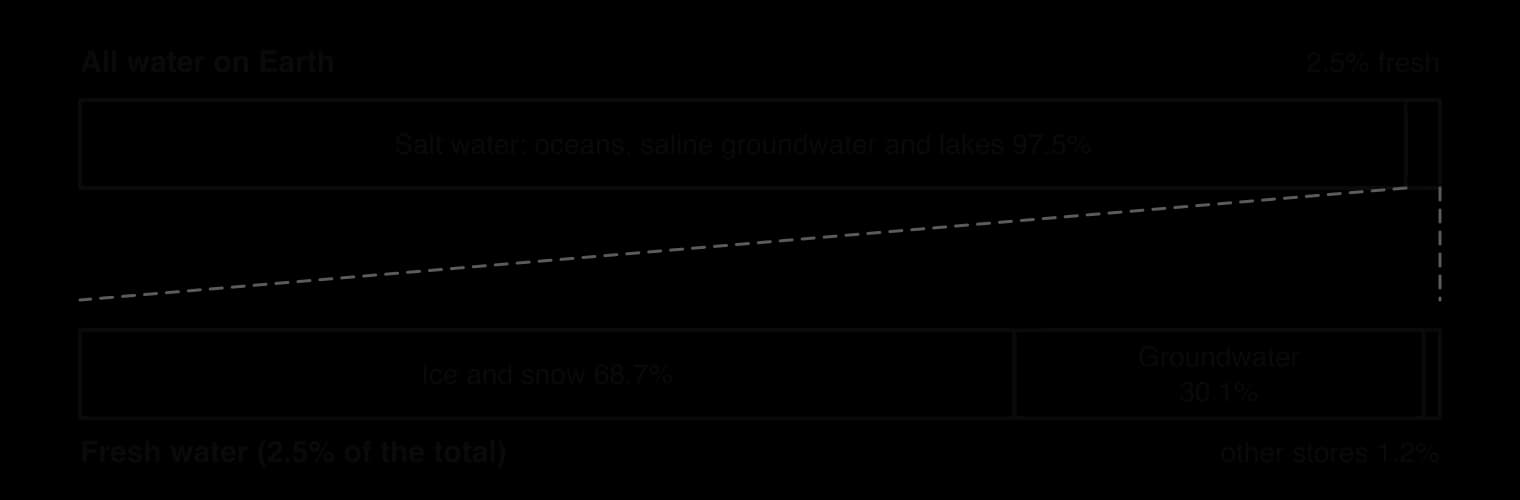
The hydrosphere is all the water on, under and above the Earth’s surface: in oceans, ice, rocks, soils, lakes, rivers, the air and living organisms. Its total volume is about 1.39 billion km³. Almost all of it is salt water in the oceans, and only a small fraction is fresh water that people and land ecosystems can use.
In systems terms, each place where water is held for a time is a store. The size of a store is measured as a volume (km³) or as a percentage of all the water on Earth. The proportions are approximate, because some stores, such as groundwater, can only be estimated, but their relative sizes are well established.
Store | Approximate share of all water on Earth | Average residence time |
|---|---|---|
Oceans | 96.5% | about 3,200 years |
Glaciers and ice caps | 1.7% | 20–100 years for glaciers; about 20,000 years for the Antarctic ice sheet |
Groundwater | 1.7% (fresh and saline) | 100–200 years when shallow; about 10,000 years when deep |
Surface fresh water (lakes, rivers, wetlands) | about 0.02% | 50–100 years for lakes; 2–6 months for rivers |
Atmosphere | about 0.001% | about 9 days |
Living organisms | about 0.0001% | days to weeks |
Sources: USGS and Gleick, _Water in Crisis (1993), via Wikipedia, “Water distribution on Earth” (2025); residence times from Wikipedia, “Water cycle” (2025)._
The residence time of a store is the average time a molecule of water spends in it before moving on. Small stores with large flows, such as the atmosphere, have short residence times: water vapour is replaced about every nine days. Large stores with small flows, such as deep groundwater and the Antarctic ice sheet, hold water for thousands of years, which is why water removed from them is replaced only very slowly.
Fresh water makes up about 2.5% of the hydrosphere. About 69% of it is locked in ice and snow, mainly in Antarctica and Greenland, and about 30% is groundwater. The rivers, lakes and soil moisture that supply most human needs hold only a tiny part of the total.

Two sources of energy keep water moving. Solar radiation heats the oceans and land and provides the energy to turn liquid water into water vapour. Gravity pulls water back down: it makes precipitation fall, drains water through soils and rocks, and carries rivers downhill to the sea.
Evaporation needs a large input of energy. Water molecules must gain enough energy to break away from the liquid surface, so evaporation takes in heat without raising the temperature of the vapour. This hidden energy is called latent heat. Water vapour then carries the latent heat upwards and sideways in the atmosphere.
When the vapour cools, usually as air rises, it turns back into liquid droplets by condensation. Condensation releases the latent heat into the surrounding air. In this way the water cycle moves energy as well as water: heat taken in at the ocean surface in the tropics is released high in the atmosphere and often far away, which helps redistribute energy around the planet.
Once water has condensed into droplets or ice crystals heavy enough to fall, gravity brings it down as precipitation. On land, gravity then controls almost every flow: water soaks into the soil, moves down through the rock, flows over the surface into streams and travels along rivers to the sea.
The scale of the global flows is very large. About 505,000 km³ of water evaporates each year, of which about 434,000 km³ comes from the oceans. About 398,000 km³ falls back on the oceans as precipitation, so roughly 36,000 km³ a year more evaporates from the oceans than falls on them. Winds carry this surplus over the continents, where it falls as rain and snow and eventually returns to the sea in rivers and groundwater.
Sources: Wikipedia, “Water cycle” (2025), citing global estimates of annual fluxes.
A systems diagram shows stores as boxes and flows as arrows labelled with the process. In the water cycle, each flow is either a transfer, which moves water to a new place without changing its state, or a transformation, which changes its state between solid, liquid and gas. Labelling each arrow as one or the other is the clearest way to show how the cycle works.
At the global scale the water cycle is a closed system: almost no water enters or leaves the Earth, while energy from the Sun enters and heat leaves. A drainage basin, a lake or an aquifer is an open system, because water and energy cross its boundary.
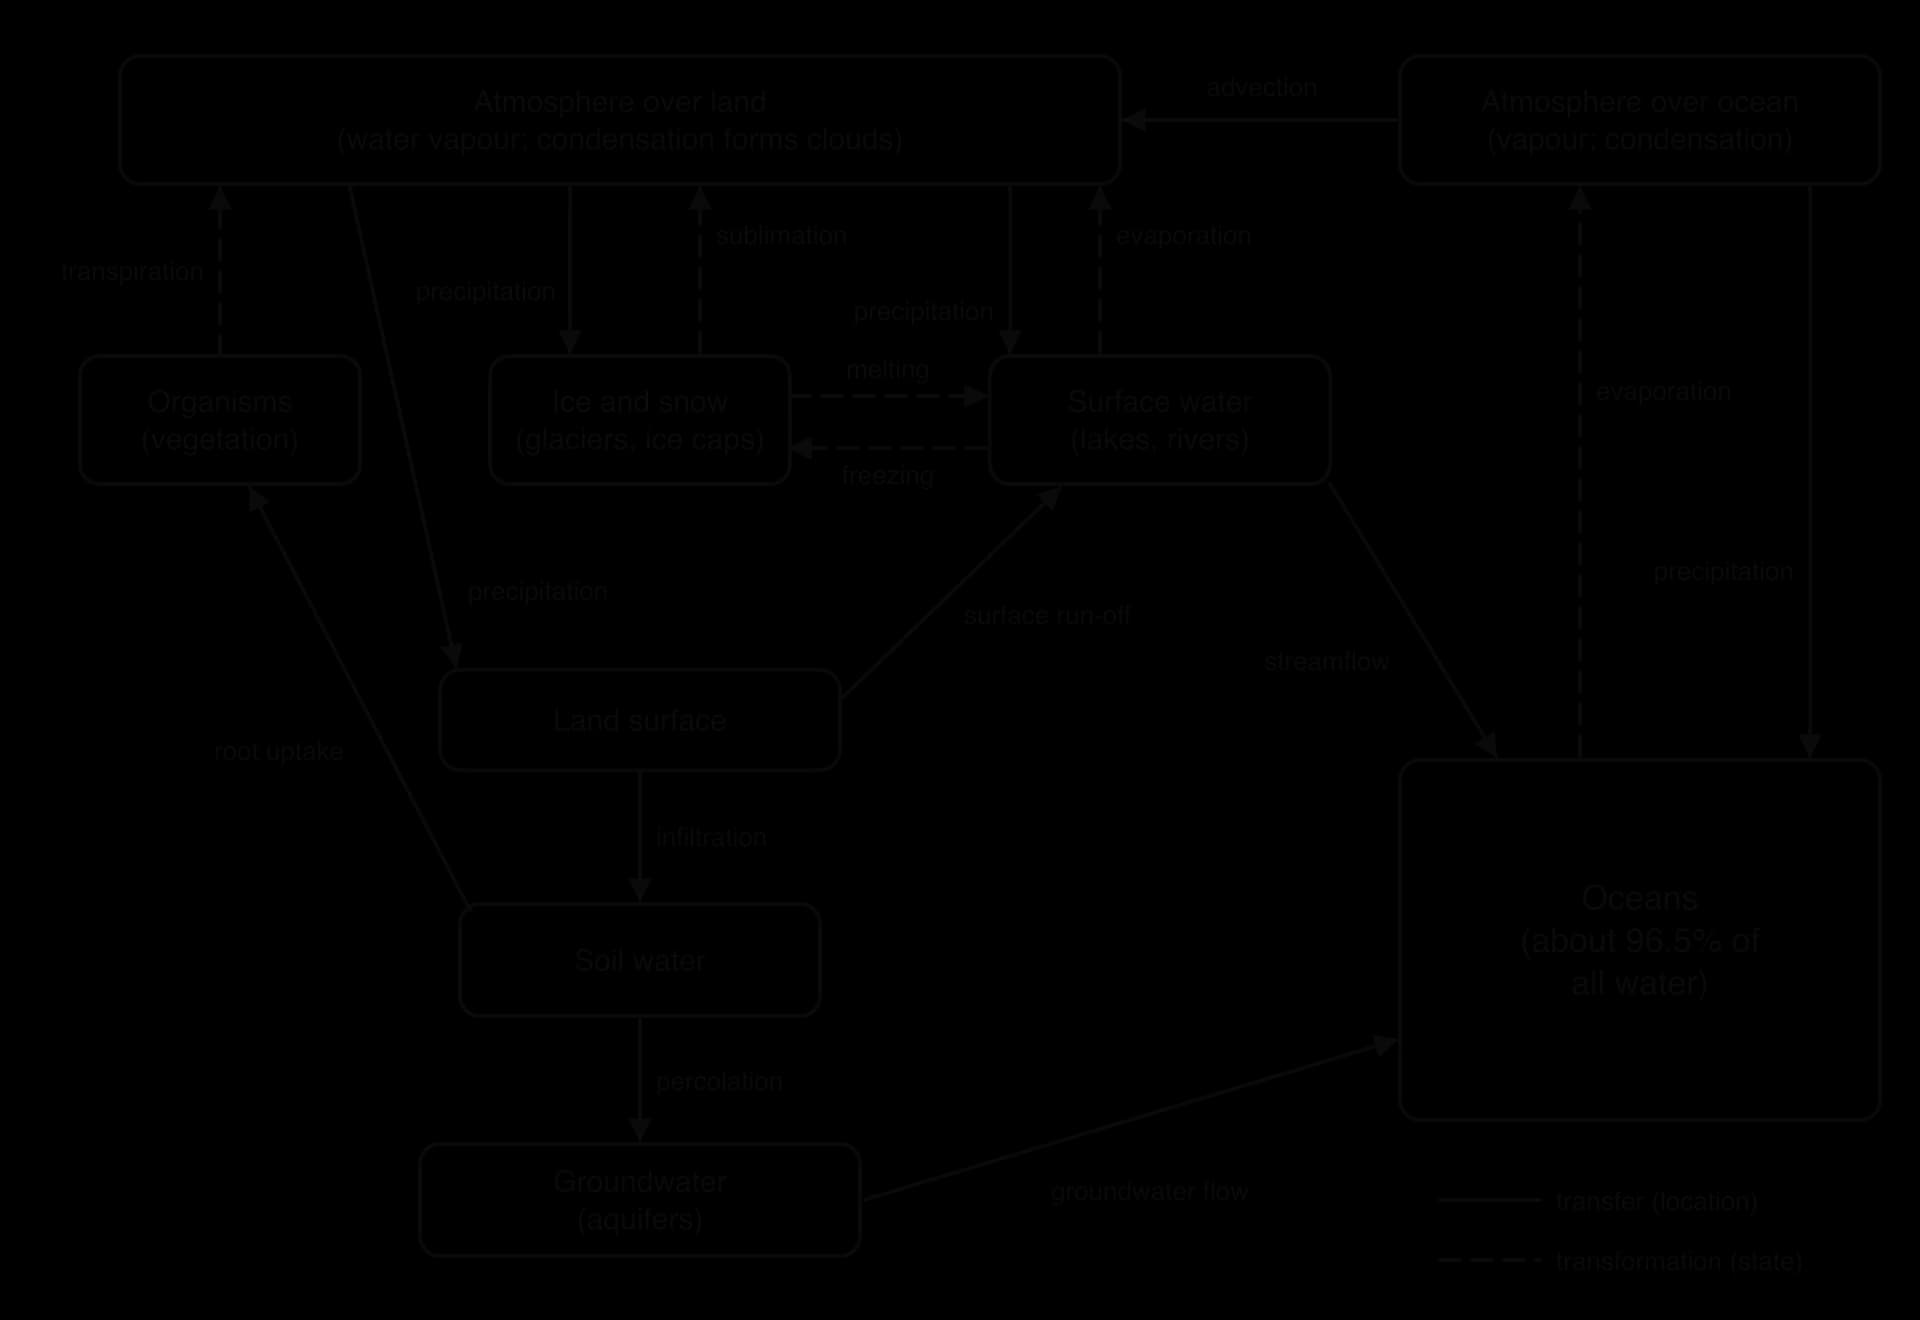
Transformations change water between ice, liquid and vapour. They take in or give out latent heat, so they link the water cycle to the energy balance of the planet.
Evaporation: liquid water becomes vapour, mainly from the oceans, but also from lakes, rivers, wet soil and water held on leaves.
Transpiration: plants draw water from the soil through their roots and lose it as vapour through the stomata in their leaves. Evaporation and transpiration from land are often measured together as evapotranspiration.
Sublimation: ice or snow turns directly into water vapour without melting first. It is important on dry, sunny, windy glaciers and high mountains.
Condensation: vapour becomes liquid droplets as air cools, forming clouds, fog and dew.
Melting and freezing: ice becomes liquid water as it warms, and liquid water becomes ice as it cools below 0 °C.
Transfers move water from one store to another without changing its state.
Advection: wind carries water vapour, and the droplets or ice crystals in clouds, horizontally from one place to another, for example from the ocean to over the land.
Precipitation: water falls from the atmosphere as rain, snow, sleet or hail.
Interception: leaves and stems catch precipitation before it reaches the ground. Some of it evaporates; the rest drips or runs down to the soil.
Infiltration: water enters the soil from the ground surface.
Percolation: water moves down through the soil and into the rock below, eventually reaching groundwater.
Surface run-off: water flows over the land surface when it cannot infiltrate fast enough, or when the ground is saturated, frozen or paved.
Streamflow: water flows along river and stream channels, downhill towards a lake or the sea.
Groundwater flow: water moves slowly through saturated rock and sediment, feeding springs, rivers, lakes and the sea.
Flow | Transfer or transformation | Main driver | From → to |
|---|---|---|---|
Evaporation | Transformation (liquid → gas) | Solar radiation | Oceans, lakes, soil → atmosphere |
Transpiration | Transformation (liquid → gas) | Solar radiation | Plants → atmosphere |
Sublimation | Transformation (solid → gas) | Solar radiation | Ice and snow → atmosphere |
Condensation | Transformation (gas → liquid) | Cooling of air | Within the atmosphere |
Melting / freezing | Transformation (solid ↔ liquid) | Temperature change | Ice ↔ surface water |
Advection | Transfer | Wind (solar heating of the air) | Atmosphere over sea → atmosphere over land |
Precipitation | Transfer | Gravity | Atmosphere → land or sea |
Infiltration | Transfer | Gravity | Ground surface → soil |
Percolation | Transfer | Gravity | Soil → rock and groundwater |
Surface run-off | Transfer | Gravity | Land surface → rivers and lakes |
Streamflow | Transfer | Gravity | Rivers → lakes and sea |
Groundwater flow | Transfer | Gravity | Aquifers → rivers, lakes and sea |
 YouTube
People alter the water cycle wherever they change the land surface or move water. The same few mechanisms appear again and again: less vegetation means less interception and transpiration; smoother or sealed surfaces mean less infiltration and more run-off; abstraction removes water from one store and moves it elsewhere. The usual overall result is that less water returns to the atmosphere through evapotranspiration and more of it rushes off the land as surface run-off.
Roofs, roads, car parks and pavements are impermeable surfaces: rain cannot soak through them. In a city, most rain that would have infiltrated soil instead becomes surface run-off, which gutters and storm drains then carry quickly to rivers. Infiltration, soil water and groundwater recharge all fall, while the speed and volume of run-off rise.
The effect shows clearly on a storm hydrograph, a graph of river discharge over time after rainfall. Compared with a forested drainage basin, an urban one has a shorter lag time between peak rainfall and peak discharge, a higher peak and a steeper rise. When the peak exceeds what the channel or drainage system can carry, a flash flood follows.
In July 2021 the city of Zhengzhou in Henan Province, China, received 201.9 mm of rain in one hour on 20 July, and 617.1 mm in the three days to 20 July, close to its usual total for a whole year. Water poured through streets, underground car parks, a road tunnel and Metro Line 5, where 14 people died. Across the province the floods left 398 people dead or missing.
The rainfall in Zhengzhou was so extreme that it would have caused flooding anywhere, and climate change is thought to have made it heavier. Urban surfaces and drains that could not carry the water made the flooding faster and deeper, and investigations afterwards questioned whether the city’s drainage was adequate. Flash floods in cities usually come from this combination of intense rain, sealed ground and limited drainage capacity.
Sources: Wikipedia, “2021 Henan floods” (2025), citing provincial government and China Meteorological Administration reports.
A forest stores large amounts of water and returns much of it to the atmosphere. Leaves intercept rain, roots and leaf litter keep the soil open so that water infiltrates, and transpiration returns huge volumes of water to the atmosphere. When the forest is cleared, interception and transpiration fall, the bare soil is compacted by rain and machinery, infiltration falls and more water runs off the surface, carrying soil with it.
Over a large area the change can affect rainfall itself. In the Amazon, much of the rain that falls in the west of the basin has already been recycled by transpiration from forests further east, so widespread clearance reduces the moisture carried inland. Deforestation therefore tends to make local climates drier and river flows more extreme, with higher floods after rain and lower flows in dry seasons.
Farming changes flows in several ways at once. Ploughing and heavy machinery compact soil and reduce infiltration; drainage ditches remove water from wet soils quickly; replacing forest or grassland with crops changes transpiration. The biggest change, however, is irrigation: water is abstracted from rivers, lakes and aquifers and spread on fields, where much of it is lost to evaporation.
Irrigation moves water from one store (a river or aquifer) to the soil and the atmosphere, and reduces the water reaching stores downstream. Where abstraction exceeds the natural input, the store shrinks, as the Aral Sea and many aquifers show. Dams and reservoirs built to supply irrigation also create new surface stores, increase evaporation and change the timing of river flows downstream.
Human activity | Flows increased | Flows decreased | Stores affected |
|---|---|---|---|
Urbanisation (sealed surfaces, drains) | Surface run-off, speed of streamflow | Infiltration, percolation, evapotranspiration | Soil water and groundwater fall; flood peaks rise |
Deforestation | Surface run-off, soil erosion | Interception, transpiration, infiltration | Soil water falls; less moisture in the atmosphere downwind |
Agriculture: irrigation | Evaporation from fields | Streamflow downstream, groundwater flow | Rivers, lakes and aquifers shrink; soil water rises on fields |
Agriculture: ploughing, compaction, drainage | Surface run-off, drainage flow | Infiltration | Soil water falls; wetlands drained |
Dams and reservoirs | Evaporation from the reservoir surface | Streamflow and sediment downstream | New surface store created; downstream wetlands shrink |
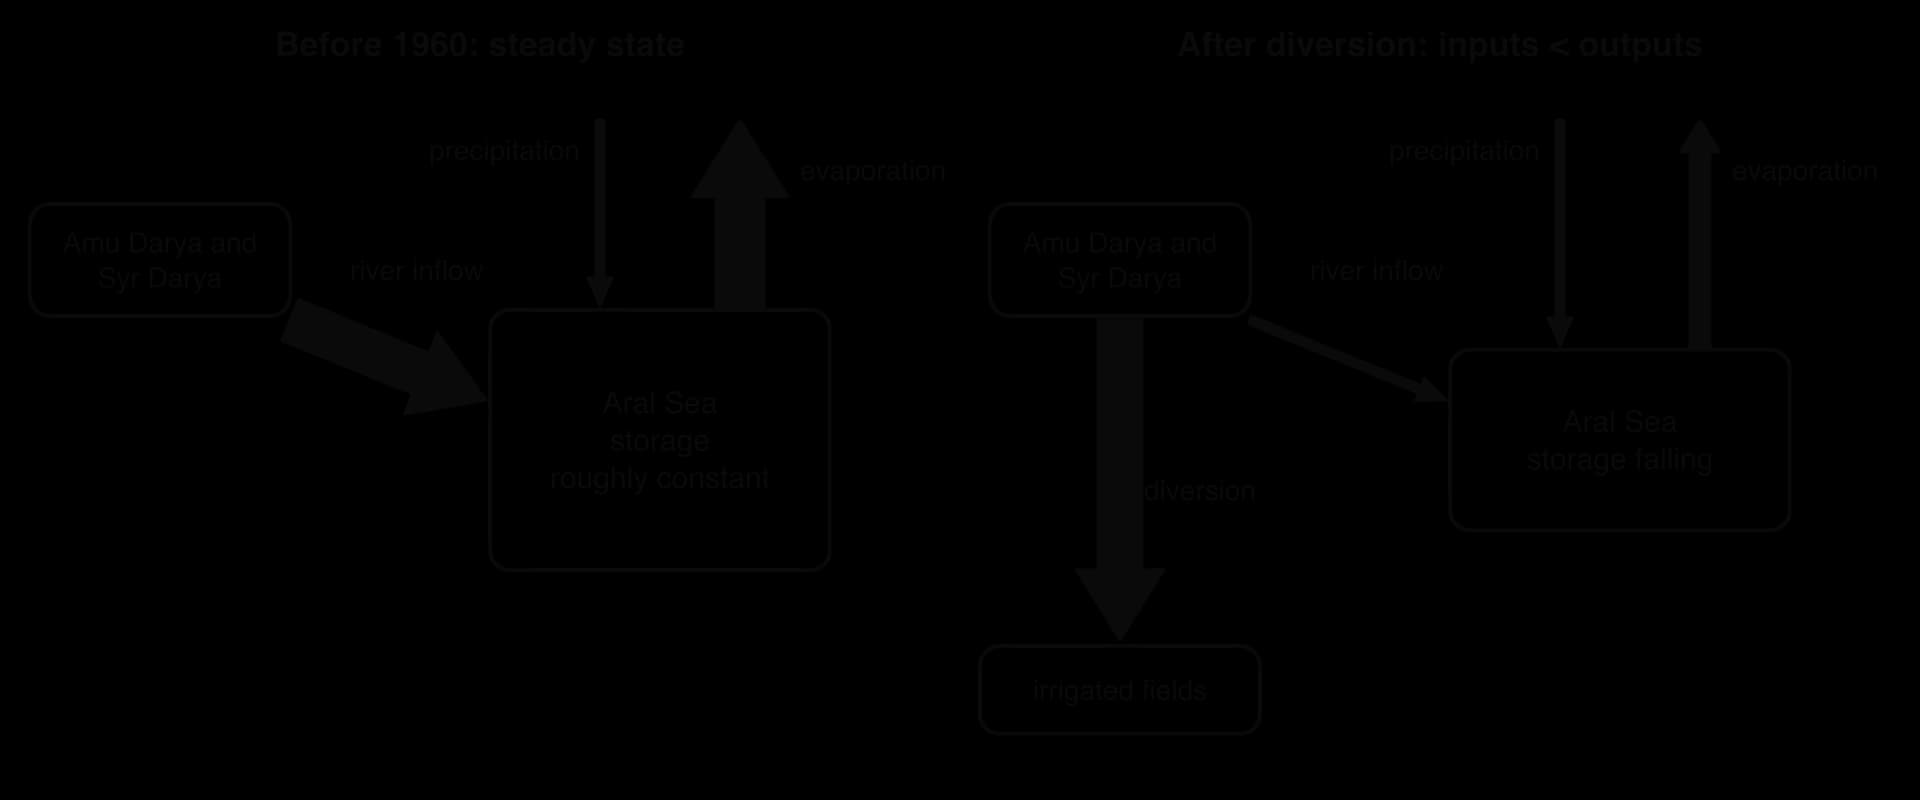
A lake, river basin or aquifer can be modelled as an open system with inputs and outputs of water. When the inputs equal the outputs over a period, the amount of water stored stays roughly constant even though water flows through it all the time. This is a steady-state equilibrium: the system is dynamic, but its storage does not change overall.
A water budget adds up the inputs and outputs of a store over a period, usually a year. The difference between them is the change in storage. A positive value means the store is filling; a negative value means it is shrinking.
Typical inputs to a lake are river inflow, precipitation onto the lake surface and groundwater seeping in. Typical outputs are river outflow, evaporation, seepage into the ground and abstraction by people. A lake with no outflow to the sea, called an endorheic lake, loses water only by evaporation and seepage, so it is especially sensitive to any fall in its inputs.
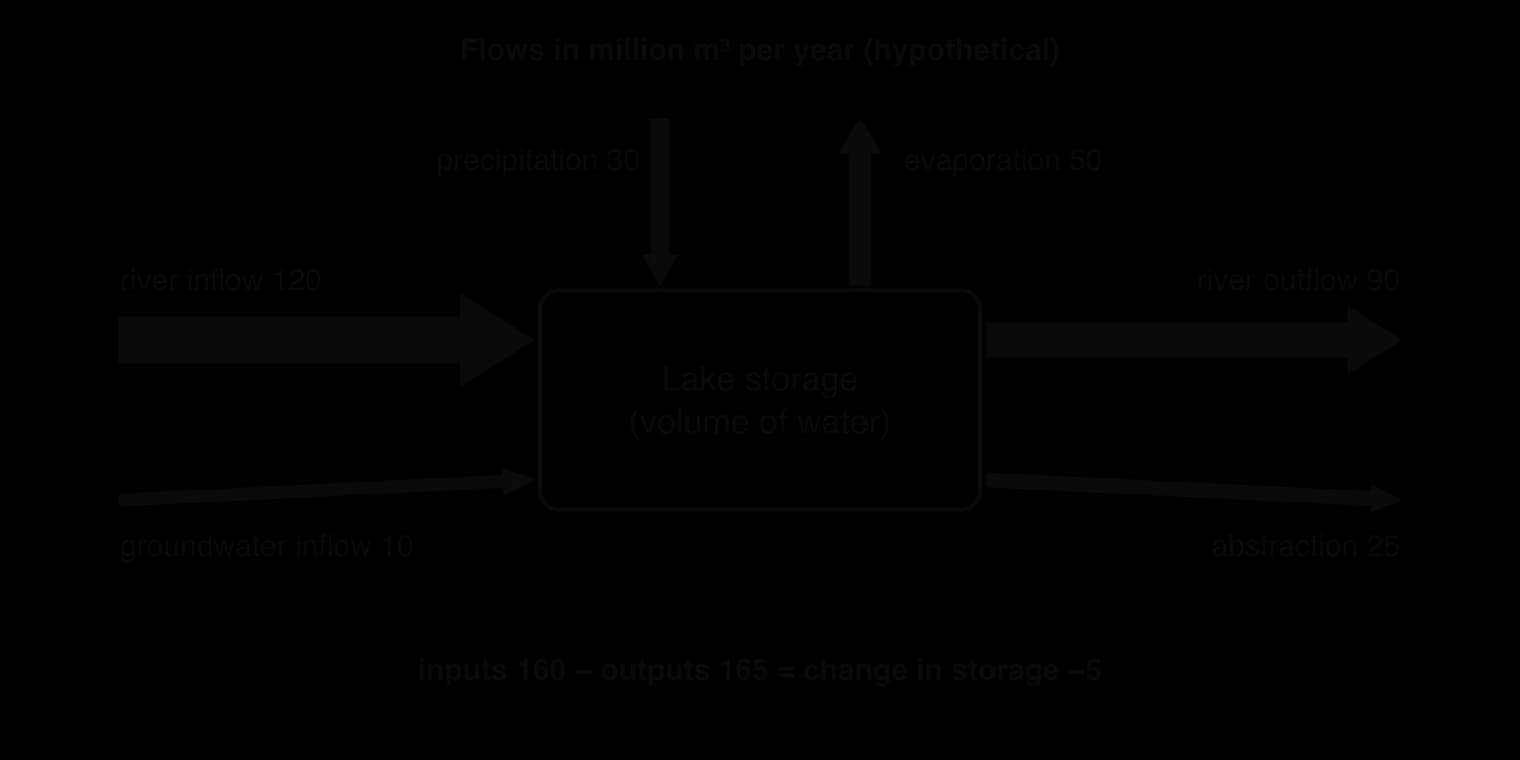
Water budgets show what a sustainable rate of harvesting is. Over the long term, abstraction from a store is sustainable only if it does not exceed the natural rate at which the store is replenished, minus the outflows needed by ecosystems and users downstream. For an aquifer, the natural input is recharge by percolation of rain and snowmelt.
Many aquifers receive very little recharge because they lie under dry climates or beneath thick, slowly permeable rock. Some were filled thousands of years ago in wetter climates and are effectively non-renewable on a human timescale. Pumping such water is closer to mining than to harvesting.
The Ogallala (High Plains) Aquifer in the United States underlies about 450,000 km² of eight states, from South Dakota to Texas, and supplies about 30% of the groundwater used for irrigation in the country. Recharge ranges from less than 1 mm a year in parts of Texas and New Mexico to about 150 mm a year in south-central Kansas, while pumping since the 1940s has lowered water levels by more than 90 m in some areas. The net loss of stored water since the late 1940s is estimated at about 410 km³, while levels have risen in parts of Nebraska where recharge is higher.
Sources: Wikipedia, “Ogallala Aquifer” (2025), citing US Geological Survey estimates.
A systems diagram of the water cycle is a model: a simplified representation that makes a complex system easier to understand and to calculate with. It shows clearly which stores exist, how they are linked and which flows people are changing. Water budgets built from the same model let managers set abstraction limits and predict the effect of a dam or a drought.
Like every model, it leaves things out. Global diagrams average over huge differences between places and seasons; flows such as groundwater recharge and evaporation are hard to measure and are often estimated; and stores interact with the carbon cycle, the energy balance and human decisions in ways a box-and-arrow diagram cannot show. Budgets based on average years can also give a false sense of security when droughts or climate change shift the inputs.
Perspective | How the water cycle is seen | Typical response to a shrinking water store |
|---|---|---|
Technocentric | A resource that engineering can control and increase | Build dams, transfer water between basins, drill deeper wells, desalinate seawater |
Anthropocentric | A shared resource to be managed for human well-being now and in the future | Set abstraction limits from water budgets, price or license water, improve irrigation efficiency |
Ecocentric | A natural system with value of its own, on which all life depends | Leave enough water in rivers and lakes for ecosystems, restore wetlands and forests, reduce demand |
Most real water management combines these views. A city may build a reservoir (technocentric), license abstraction according to a water budget (anthropocentric) and protect the upstream forest that regulates run-off (closer to ecocentric). The balance chosen reflects the values, wealth and political power of the people involved, which is why the same physical problem is handled differently in different societies.
The Aral Sea lies in the deserts of Central Asia, on the border between Kazakhstan to the north and Uzbekistan to the south. In 1960 it covered about 68,000 km² and held about 1,100 km³ of water, which made it the fourth-largest lake in the world. It was a brackish lake with a salinity of about 10 g L⁻¹, far less salty than seawater at about 35 g L⁻¹.
The Aral Sea is an endorheic lake: it has no outlet to the ocean. Its inputs were two great rivers, the Amu Darya and the Syr Darya, which carry snowmelt from the Pamir and Tian Shan mountains, plus a little precipitation on the lake surface. Its only significant output was evaporation into the dry desert air. Before 1960 these flows were roughly in balance, and the lake level had stayed near 53 m above sea level: a steady-state system.
From the 1960s, Soviet planners expanded irrigated agriculture across the desert, mainly to grow cotton, with rice and other crops. Canals took water from both rivers; by 1960 between 20 and 60 km³ a year was already being diverted, and withdrawals for irrigation doubled between 1960 and 2000. Many canals were unlined, and between 30% and 75% of the water in the Qaraqum Canal, the largest, was lost by seepage and evaporation before it reached the fields.
Seen as a system, the lake’s main input was cut while its output carried on. Evaporation, a transformation from liquid to vapour, continued at first at almost the same rate and fell only as the lake surface shrank, but streamflow into the lake, a transfer, fell to a small fraction of its former size. With outputs far greater than inputs, the change in storage became strongly negative every year and the steady state was broken.
The lake level fell by about 20 cm a year in the 1960s, 50–60 cm a year in the 1970s and 80–90 cm a year in the 1980s. As the water retreated from the gently sloping basin, the lake split into a northern part (the North or Small Aral, in Kazakhstan) and a southern part (the South or Large Aral, mainly in Uzbekistan), and the south later divided again into western and eastern basins.
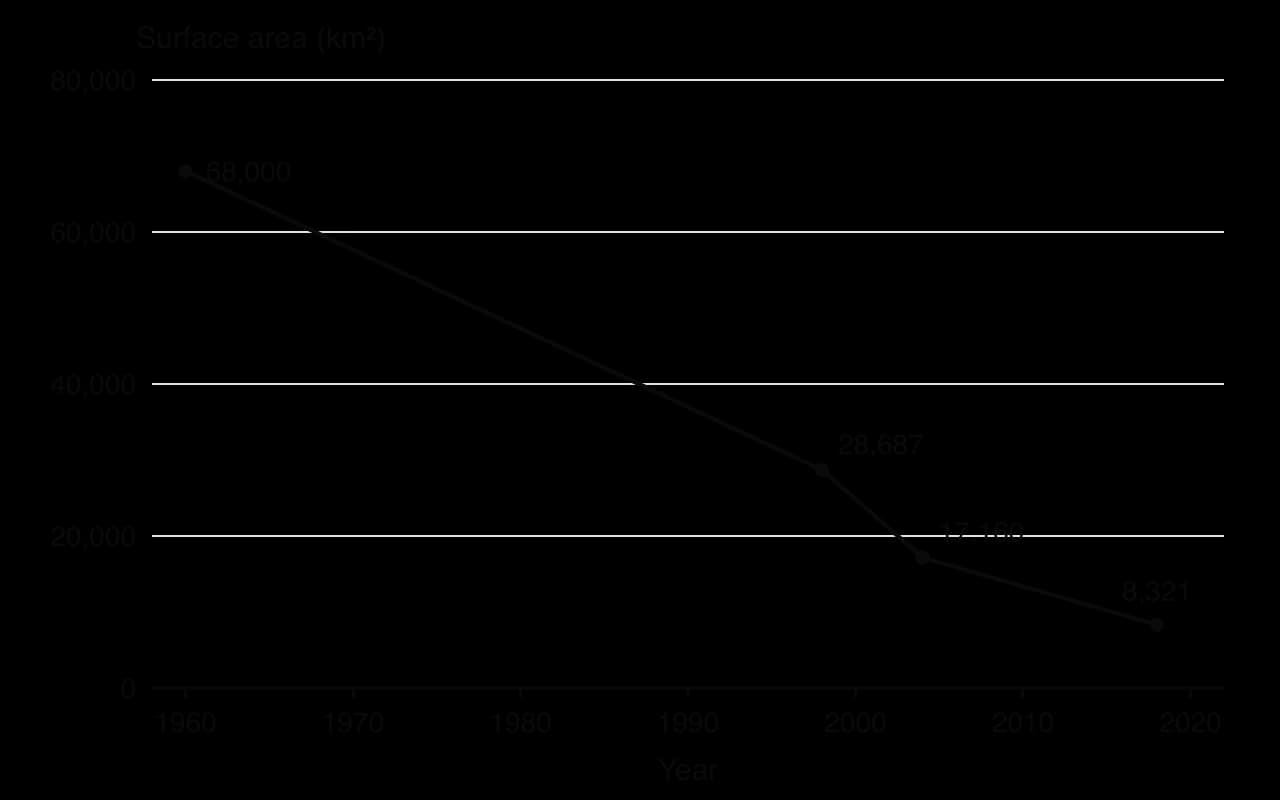
As the volume fell, the same amount of dissolved salt was held in less water. Salinity rose from about 10 g L⁻¹ to about 30 g L⁻¹ by 1990 and much higher later in the South Aral. Most native fish could not survive, and commercial fishing had stopped by 1987. The fishing industry had employed about 40,000 people and produced about a sixth of the Soviet Union’s fish catch. The port of Moynaq in Uzbekistan now lies 30–90 km from the shore, and in August 2014 satellite images showed that the eastern basin of the South Aral had dried completely for the first time in modern history.
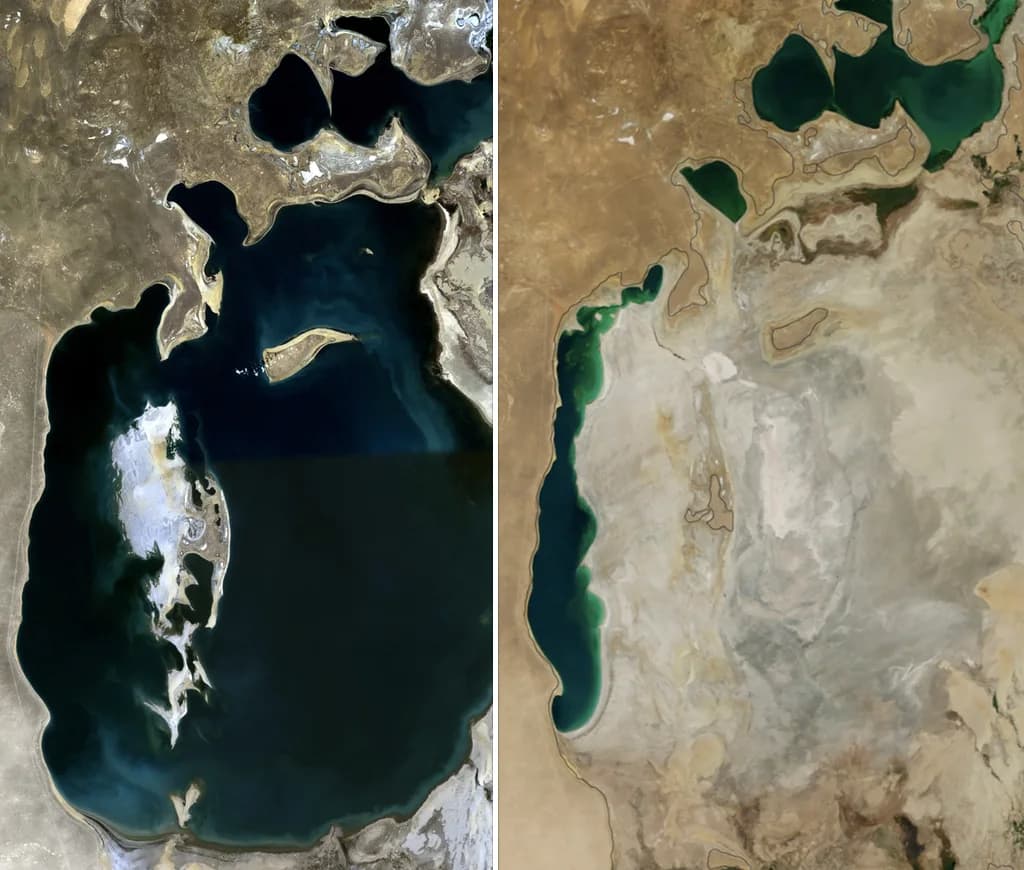
Ecosystems: most native fish species disappeared; the river deltas and their wetlands dried out; the exposed seabed became a new salt desert, the Aralkum.
Local climate: without the large water body to moderate temperatures, the region now has a wider annual temperature range and more dust storms.
Health: winds lift salt, dust and residues of pesticides once used on the cotton fields (including DDT and HCH) from the dry seabed. In the Aral Sea region, which includes Karakalpakstan in Uzbekistan, child mortality was 75 per 1,000 in 2009, and about a quarter of babies are born with a low birthweight.
Livelihoods: fishing towns lost their industry and many people left; farmland near the sea is damaged by wind-blown salt and must be flushed with extra water.
The two countries that now share the lake have responded in different ways. Kazakhstan chose to save the North Aral. With a World Bank loan, it built the Kok-Aral dike and dam, completed in August 2005, which stops the Syr Darya’s water from flowing on into the South Aral. Between 2003 and 2008 the surface area of the North Aral grew from about 2,550 km² to about 3,300 km², salinity fell to about 8 g L⁻¹, almost 24 freshwater fish species returned and catches recovered enough for fish to be exported again by 2006. In 2024 the North Aral held about 21.4 km³.
Uzbekistan, which depends heavily on the Amu Darya to irrigate cotton, has not reduced irrigation enough to restore the South Aral. Its responses have focused on adapting to the dry seabed: planting drought-tolerant shrubs and trees to fix the dust and salt, with the eventual aim of up to 200,000 hectares of forest on the Uzbek part, and exploring the seabed for oil. Lining canals has also begun; about 12% of the length of Uzbekistan’s irrigation canals had been waterproofed by 2012.
Sources: Wikipedia, “Aral Sea” (2025), citing UNEP, World Bank and published surveys; NASA Earth Observatory, “World of Change: Shrinking Aral Sea” (2025).
Group or perspective | View of the change | Assessment |
|---|---|---|
Soviet planners (technocentric, economic growth) | Desert land made productive; cotton self-sufficiency; the lake judged less valuable than the crops | Short-term economic gain; long-term costs to ecosystems and health were ignored or accepted |
Kazakhstan government (pragmatic restoration) | Restore what can be saved at a reasonable cost | The Kok-Aral dam is a clear local success for the North Aral, but it cut off the Syr Darya’s remaining flow to the South Aral |
Uzbekistan government (economic priority on irrigation) | Irrigated cotton and other crops support jobs and export income | Water use remains unsustainable for the lake; adaptation reduces dust but does not restore the system |
Karakalpak and fishing communities | Loss of livelihoods, health and a way of life | A clear case of environmental injustice: they bear the costs of decisions made far away |
Ecologists (ecocentric) | Loss of a whole lake ecosystem and its species | Full restoration is now impossible on any realistic timescale |
Judged against the water budget, the irrigation system was never sustainable: abstraction far exceeded the share of river flow the lake could lose and still stay in balance. Partial restoration of the North Aral shows that a damaged water system can recover quickly once inputs are restored, but only where enough river water is allowed to reach the lake.
Better canal lining and more efficient irrigation could return some water to the rivers, yet the economic dependence on irrigated crops makes large cuts politically difficult. The case also shows how decisions about water cross borders: the Amu Darya rises in the Pamir mountains on the border of Tajikistan and Afghanistan and the Syr Darya in the Tian Shan of Kyrgyzstan; between them they flow through or along the borders of six countries before ending in a lake shared by two states.
The Aral Sea shows every part of the water system working together. Diverting a transfer (streamflow) while a transformation (evaporation) continued broke the steady state of an endorheic lake, and the water budget turned negative for decades. The loss of the store then changed other systems: salinity, local climate, soils, ecosystems and human health. It also shows that the same physical problem is judged differently by different groups, and that restoration depends on restoring inputs, which is a political decision as much as a technical one.
Water behaves very differently from most other small molecules. It is liquid at the temperatures found over most of the Earth’s surface, it dissolves a huge range of substances, it resists changes in temperature, and its solid form floats. Nearly all of these properties come from the shape of the water molecule and the way its electric charge is spread.
A water molecule (H₂O) has one oxygen atom bonded to two hydrogen atoms, with the hydrogens at an angle rather than in a straight line. Oxygen attracts the shared electrons more strongly than hydrogen does, so the oxygen end of the molecule carries a slight negative charge (δ−) and the hydrogen ends a slight positive charge (δ+). This uneven spread of charge is called polarity.
Because opposite charges attract, the slightly positive hydrogen of one water molecule is attracted to the slightly negative oxygen of a neighbouring molecule. This weak attraction is a hydrogen bond. Each bond is weak and constantly breaking and re-forming, but liquid water contains enormous numbers of them, and together they give water its unusual properties.
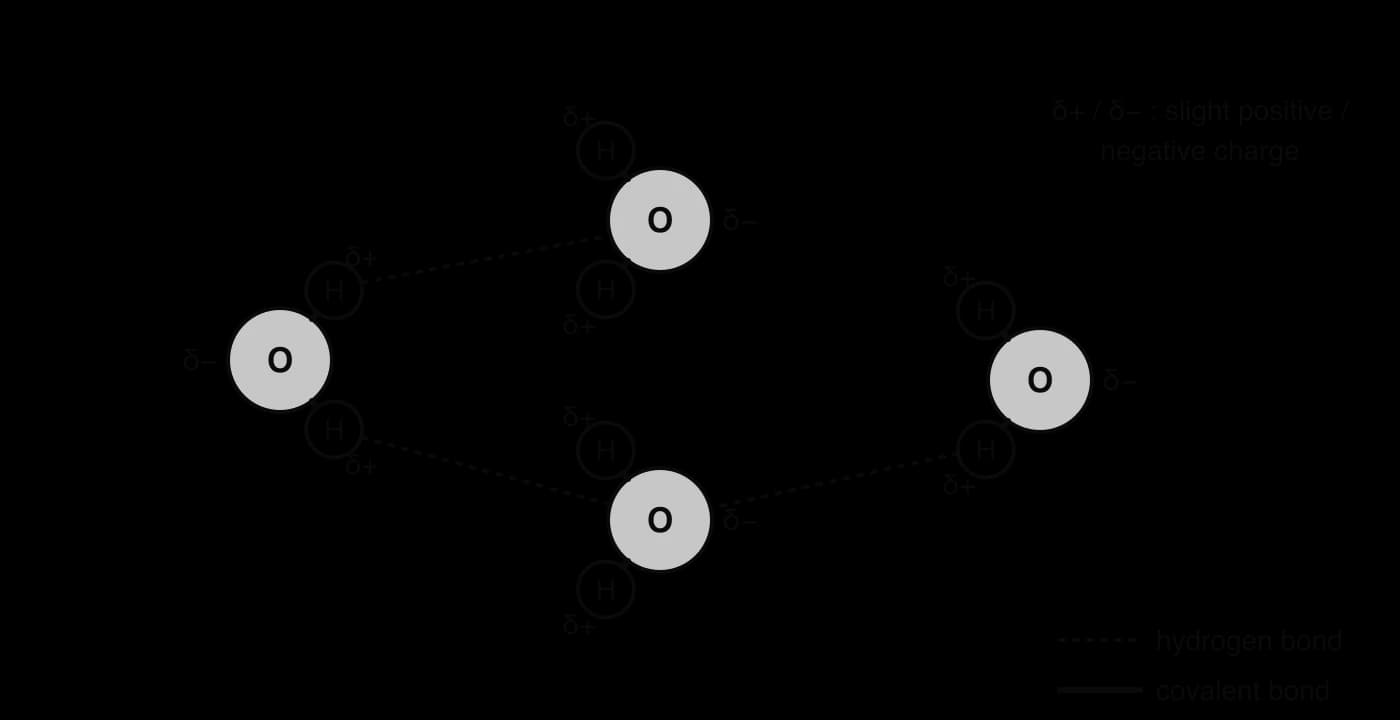
Cohesion: water molecules are attracted to each other by hydrogen bonds. Cohesion gives water a high surface tension, strong enough for pond skaters and other small animals to walk on, and it lets plants pull unbroken columns of water up from their roots to their leaves as water evaporates from the leaves.
Adhesion: water molecules are attracted to other polar surfaces, such as the walls of plant xylem vessels and soil particles. Adhesion helps water climb narrow tubes and holds water as thin films around soil grains, where roots can reach it.
Solvent properties: because it is polar, water dissolves ions such as nitrate, phosphate, sodium and chloride, and polar molecules such as sugars. Water is the medium in which nutrients are carried to roots and through organisms, and in which the chemical reactions of life happen. The same property means that water also carries pollutants.
Water is transparent to visible light, so sunlight can reach phytoplankton, seaweeds and rooted plants below the surface. Photosynthesis is therefore possible in the upper layer of lakes and oceans, down to the depth where light becomes too weak.
Water has a high specific heat capacity of about 4,180 J kg⁻¹ °C⁻¹: a large amount of energy is needed to warm it, and it releases a large amount as it cools. Hydrogen bonds absorb much of the energy before the molecules can move faster. As a result, lakes and oceans change temperature slowly, giving aquatic organisms stable conditions, and coastal places have milder climates than places far inland. The oceans store vast amounts of heat, which ocean currents carry around the globe.
Most liquids become steadily denser as they cool. Liquid water does so only down to about 4 °C, where its density is greatest. Below 4 °C the molecules begin to arrange themselves into the open, hydrogen-bonded pattern of ice, and the water becomes slightly less dense. When it freezes, its density drops by about 9%, so ice floats.
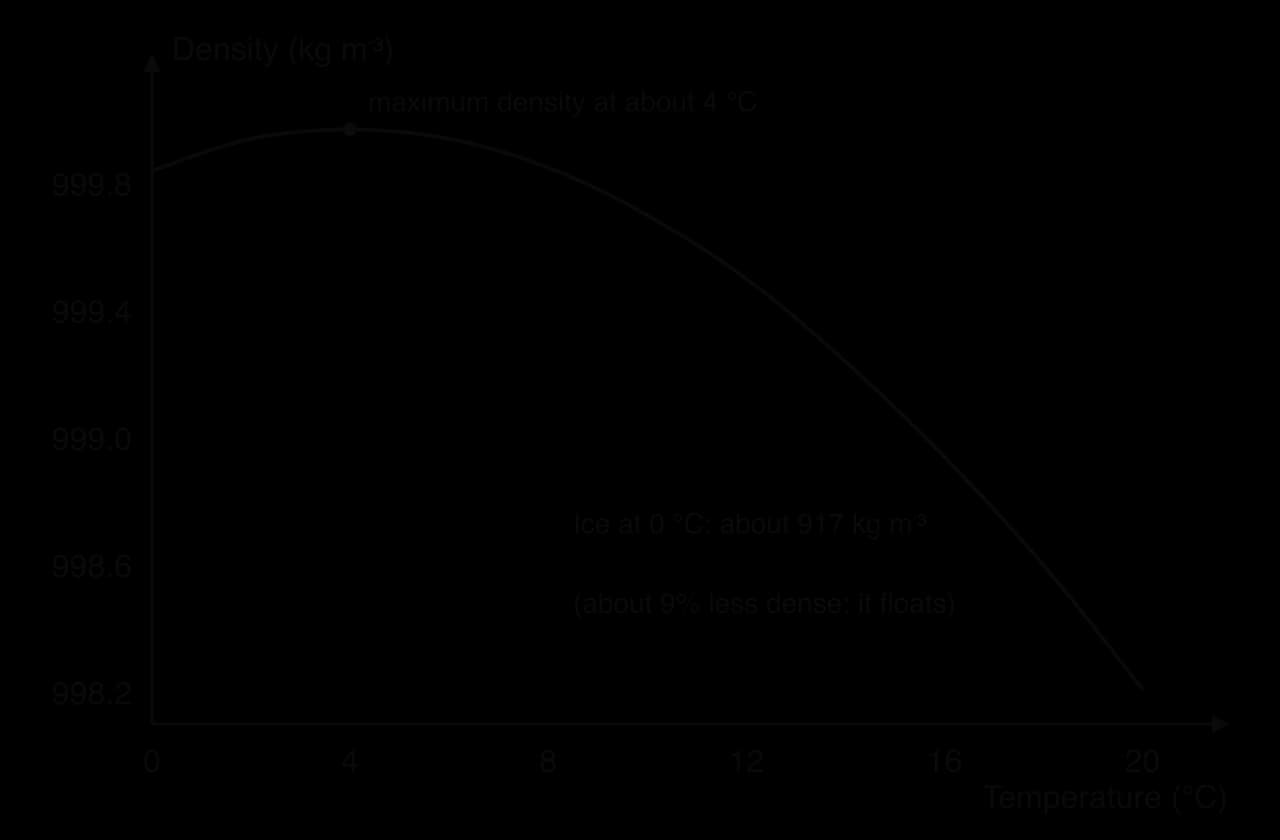
This density anomaly has large effects on freshwater life. In winter, water cooled at the surface below 4 °C stays on top, and ice forms there first. The layer of ice and snow insulates the water beneath, which stays liquid at around 4 °C at the bottom. Fish, invertebrates and plants survive the winter under the ice; if water were densest as a solid, lakes would freeze from the bottom up and many would freeze solid.
The amount of a gas that can dissolve in water depends on temperature and pressure. Cold water holds more dissolved gas than warm water, and water under higher pressure holds more than water at the surface. Fresh water in contact with air at sea-level pressure can hold about 14.6 mg of oxygen per litre at 0 °C, but only about 9.1 mg L⁻¹ at 20 °C and 7.6 mg L⁻¹ at 30 °C.
Sources: Engineering ToolBox, “Oxygen solubility in fresh water” (2025); Wikipedia, “Properties of water” (2025).
Carbon dioxide behaves in the same way. Cold polar seas absorb more CO₂ and oxygen than warm tropical seas, which is one reason why cold waters are so productive and why warming seas hold less oxygen. For aquatic animals, warm water is doubly stressful: their respiration speeds up as temperature rises, while the oxygen available to them falls.
Property | Cause | Why it matters for life |
|---|---|---|
Polarity and hydrogen bonding | Uneven charge across the molecule | Underlies all the other properties |
Cohesion | Hydrogen bonds between water molecules | Water columns in plants; surface tension supports small organisms |
Adhesion | Attraction to other polar surfaces | Water rises in xylem; water films around soil particles |
Solvent | Polar molecules surround ions and polar substances | Transports nutrients; medium for life’s chemistry; also carries pollutants |
Transparency | Little absorption of visible light near the surface | Photosynthesis under water |
High specific heat capacity | Energy absorbed by breaking hydrogen bonds | Stable water temperatures; milder coastal climates; heat stored and moved by oceans |
Density maximum at about 4 °C; ice floats | Open hydrogen-bonded structure of ice | Lakes freeze from the top; life survives under insulating ice |
Gas solubility falls with temperature | Gas molecules escape more easily from warm water | Cold water holds more O₂ and CO₂; warm water can become low in oxygen |
The oceans are a sink for carbon: they take in more carbon dioxide from the atmosphere than they release. CO₂ dissolves in surface seawater wherever the water contains less dissolved CO₂ than the air above it would support. Cold water, which can hold more gas, absorbs the most, especially in the North Atlantic and the Southern Ocean.
Since the start of the Industrial Revolution, ocean uptake has slowed the rise in atmospheric CO₂ from burning fossil fuels. In the decade 2014–2023 the oceans absorbed about 2.9 billion tonnes of carbon a year (2.9 GtC yr⁻¹), roughly a quarter of the CO₂ released by human activities. Without this sink, atmospheric CO₂ and global warming would be considerably higher than they are.
Sources: Friedlingstein et al., Global Carbon Budget 2024, _Earth System Science Data (2025)._
Most of the carbon absorbed each year stays dissolved in seawater, where it reacts with water to form carbonic acid. This lowers the pH of seawater, a process called ocean acidification. Seawater stays alkaline (pH above 7) but becomes less alkaline (more acidic), which makes it harder for corals, molluscs and some plankton to build shells and skeletons of calcium carbonate. The short-term sink therefore protects the climate at a cost to marine ecosystems.
Some dissolved carbon is fixed by phytoplankton through photosynthesis and passes along marine food chains. When organisms die, or produce faeces, part of this organic matter sinks into the deep ocean before it decomposes. Shells and skeletons of calcium carbonate also sink. On the seabed these accumulate as sediments of inorganic carbonates and incompletely decomposed organic carbon.
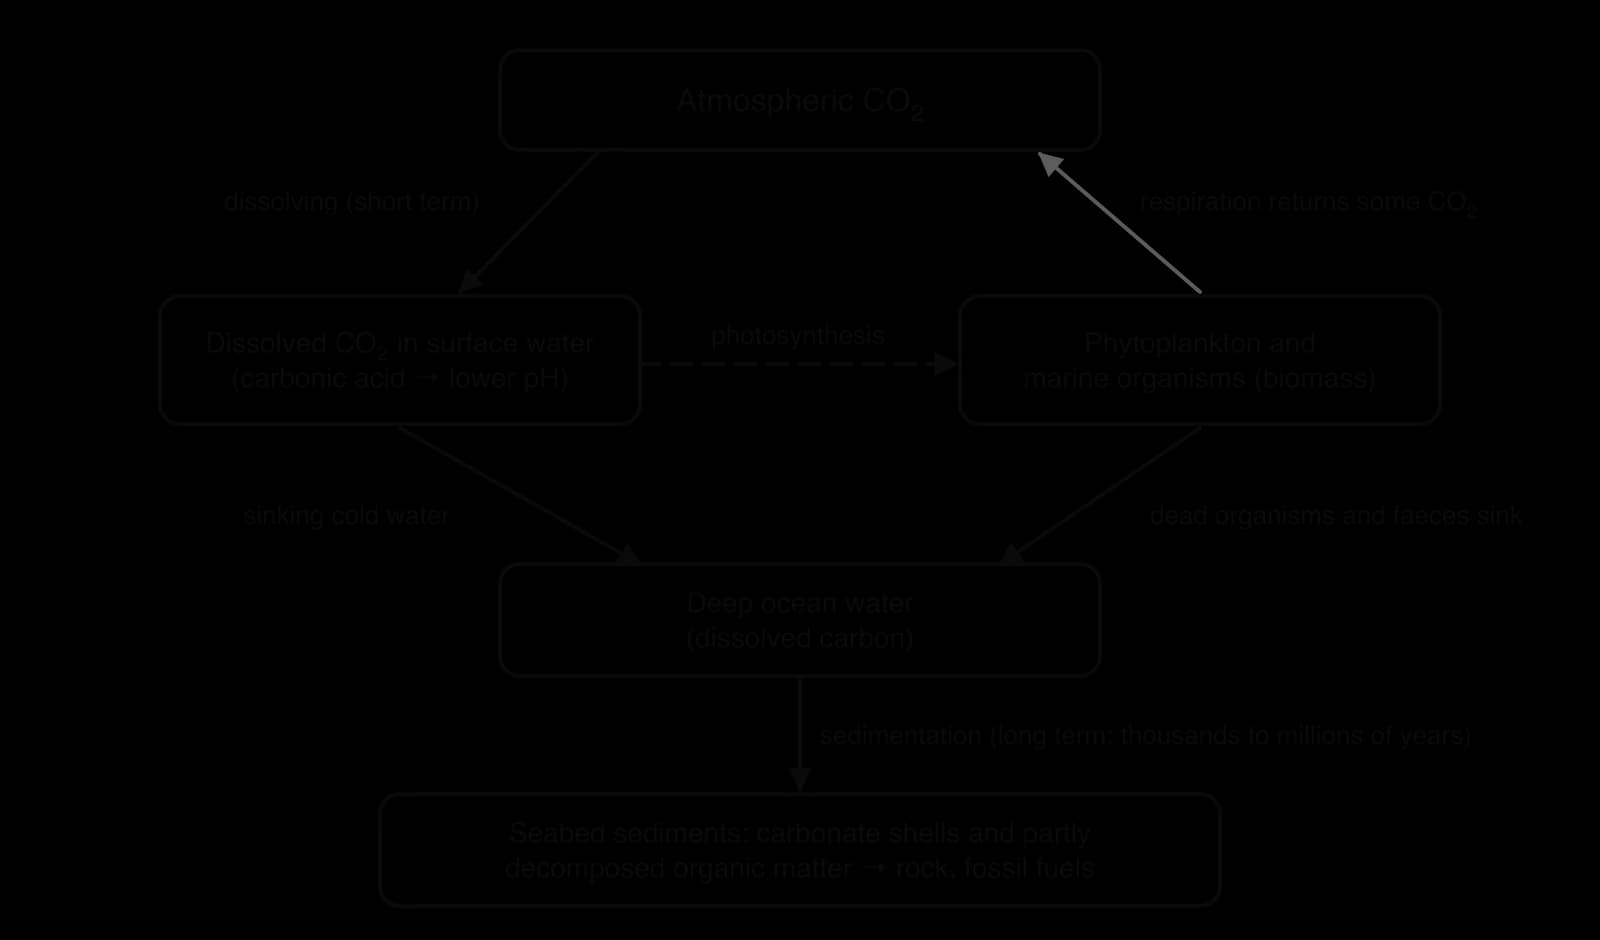
Over thousands to millions of years, buried sediments can become limestone, and buried organic matter can become oil and natural gas, removing carbon from the active cycle for geological time. The deep ocean is the largest carbon store in the active carbon cycle; only sedimentary rocks such as limestone hold more. The transfer of carbon into the deep ocean is slow compared with the speed of current emissions.
The ocean sink is not unlimited. As more CO₂ dissolves, the chemistry of seawater changes so that each extra tonne is absorbed less easily. Warmer surface water also holds less gas, and stronger stratification, the layering of water by density, slows the mixing that carries carbon-rich surface water down into the deep ocean. Scientists therefore expect the share of emissions taken up by the oceans to fall as warming continues, a point sometimes described as the sink approaching saturation.
Water bodies are heated from above. Sunlight warms the surface water, which becomes less dense and floats on the colder, denser water below. Wind and waves mix the upper layer, but they cannot easily push light, warm water down into dense, cold water. The water body therefore forms layers with different temperatures and densities. This layering is called stratification, and it can persist for months or, in the deep ocean, permanently.
The surface mixed layer (in lakes, the epilimnion): warm, well lit, mixed by wind and in contact with the air, so it is well supplied with oxygen. Phytoplankton photosynthesise here, but they quickly use up the nutrients.
The thermocline: a layer in which temperature falls rapidly with depth. It acts as a barrier to mixing between the layers above and below.
The deep layer (in lakes, the hypolimnion): cold, dense and dark. Dead organisms sinking from above are decomposed here, which releases nutrients such as nitrate and phosphate but uses up oxygen. With no contact with the air and no photosynthesis, oxygen in the deep layer can fall to very low levels.
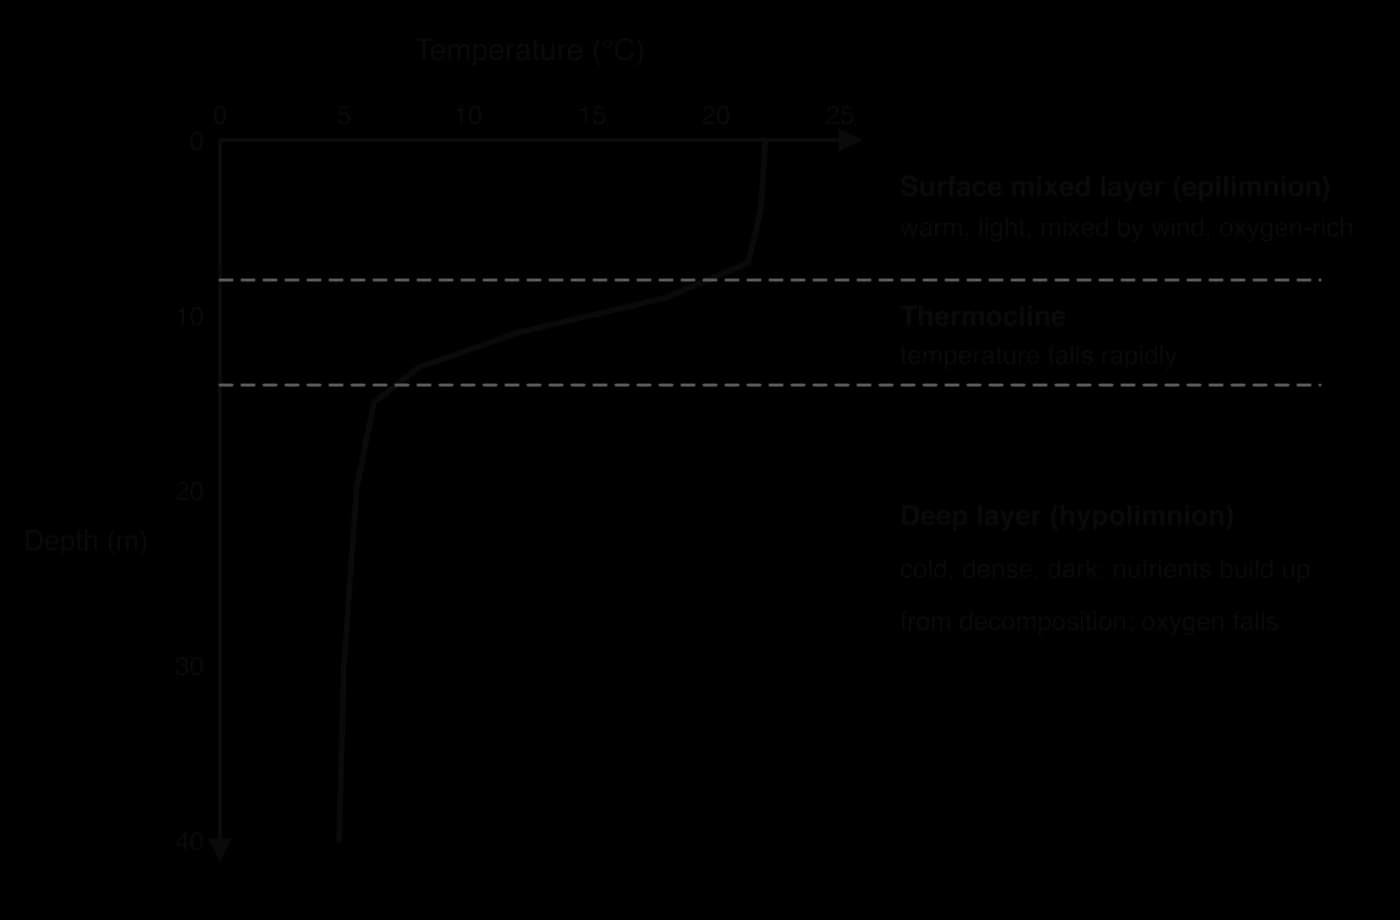
Stratification is found in deeper lakes, in coastal seas and enclosed seas, and in the open ocean. In the tropical open ocean the surface layer is warm all year and the thermocline is permanent. In enclosed seas such as the Baltic, a halocline can form as well: fresher river water floats over saltier, denser seawater, and differences in salinity strengthen the layering.
The separation of light from nutrients is the key consequence for living things. Phytoplankton can only grow where there is light, near the surface, but the nutrients they need build up in the dark deep water. Where stratification is strong and lasting, the surface water becomes poor in nutrients and productivity is low; this is why much of the tropical open ocean has clear, blue, nutrient-poor water.
In a deep lake in a temperate climate, stratification follows the seasons. In summer the surface warms and a strong thermocline forms. In autumn the surface cools until it reaches the temperature of the deep water; the whole lake then has the same density, and wind mixes it from top to bottom. This lake turnover carries oxygen down to the deep water and nutrients up to the surface. In winter, water just above 0 °C and ice lie over denser 4 °C water, and in spring the surface warms back to about 4 °C and the lake turns over again.
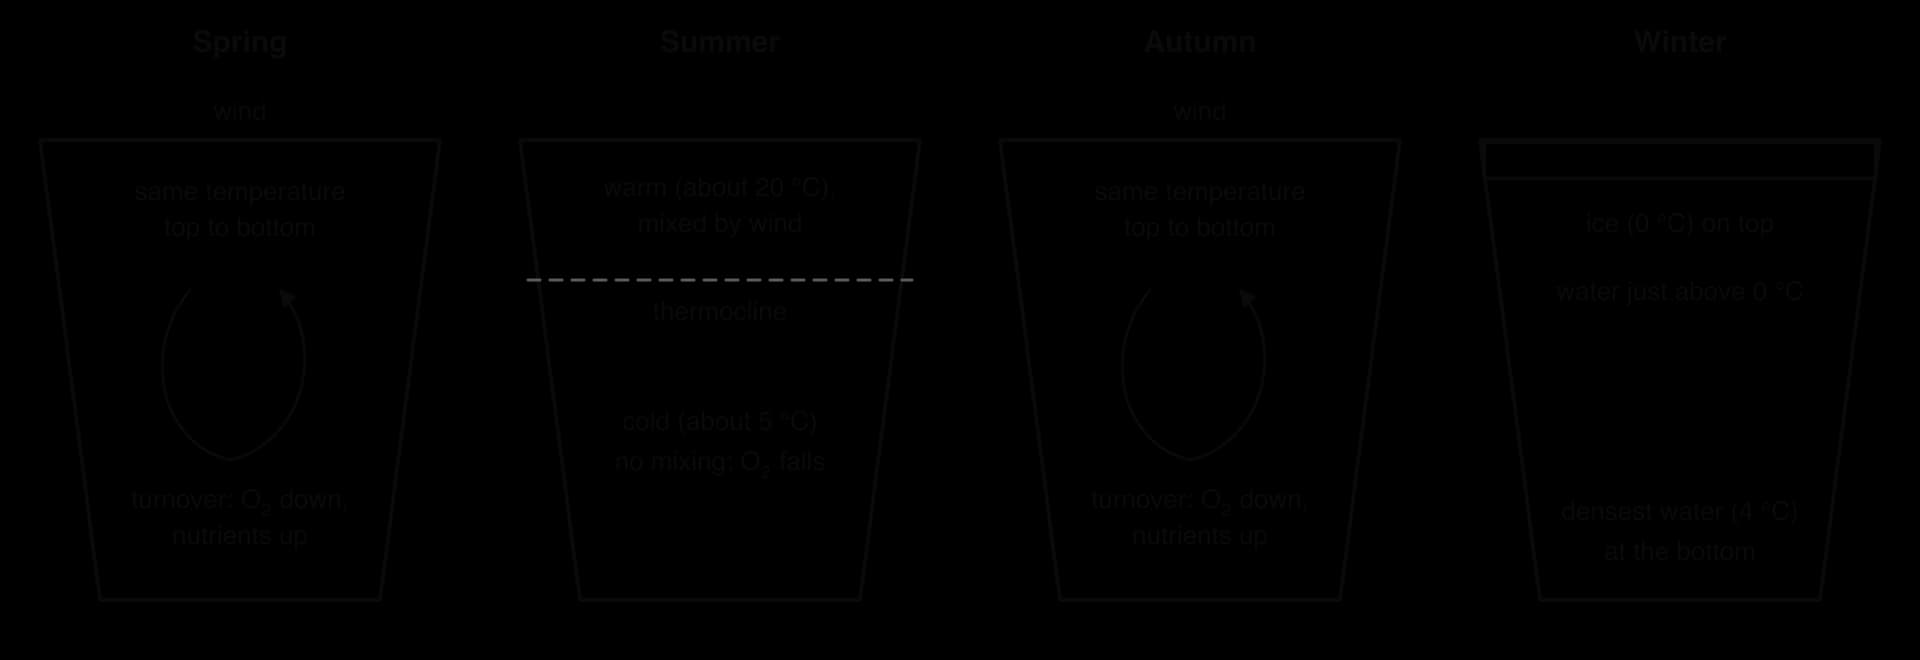
Each turnover is followed by a burst of phytoplankton growth, because the surface water is suddenly rich in nutrients. In summer, if the deep layer runs out of oxygen before autumn turnover, fish and other animals that live near the bottom can die, especially where nutrient pollution has increased the amount of organic matter decomposing there.
Global warming heats the surface of lakes and oceans faster than their deep water, which increases the density difference between the layers. Changes in salinity add to the effect: melting ice and heavier rainfall freshen the surface in some regions, including the seas around Antarctica, making surface water lighter still. One analysis of ocean measurements found that stratification of the upper 2,000 m increased by about 5.3% between 1960 and 2018. About 71% of the increase happened in the upper 200 m, and more than 90% of it was caused by warming rather than salinity change.
Sources: Li et al., “Increasing ocean stratification over the past half-century”, _Nature Climate Change (2020)._
Stronger stratification has global effects. Less mixing means fewer nutrients reach the surface, which can reduce phytoplankton productivity and the fisheries that depend on it; less oxygen reaches the deep water, so low-oxygen zones expand; and less carbon is carried into the deep ocean, weakening the ocean sink.
Lake Tanganyika in East Africa, one of the deepest and oldest lakes in the world, shows these effects. The lake is permanently stratified: seasonal mixing rarely reaches below about 150 m, and below roughly 100 m in the north and 250 m in the south the water contains no oxygen.
The surface of Lake Tanganyika has warmed since the 19th century, faster since the 1950s, strengthening stratification and reducing the upward mixing of nutrients. Sediment records suggest that primary productivity has fallen by about 20%, which could mean a decline of roughly 30% in fish yields from the sardine fishery (Stolothrissa tanganicae and Limnothrissa miodon), an important source of animal protein for people living around the lake.
Sources: Wikipedia, “Lake Tanganyika” (2025); O’Reilly et al., _Nature (2003)._
Upwelling is the large-scale vertical movement of cold, dense, nutrient-rich water from depth to the surface. It happens wherever surface water is moved away, usually by wind, and deeper water rises to replace it. Upwelling breaks through stratification and brings the nutrients of the deep layer into the sunlit surface layer, where phytoplankton can use them.
The strongest upwellings are along the western coasts of continents, such as Peru and Chile, California, north-west Africa and south-west Africa. There, winds blow along the coast towards the equator. Because of the Earth’s rotation, the surface water they drive is deflected away from the coast, out to sea. Cold water from below the thermocline rises near the shore to take its place.
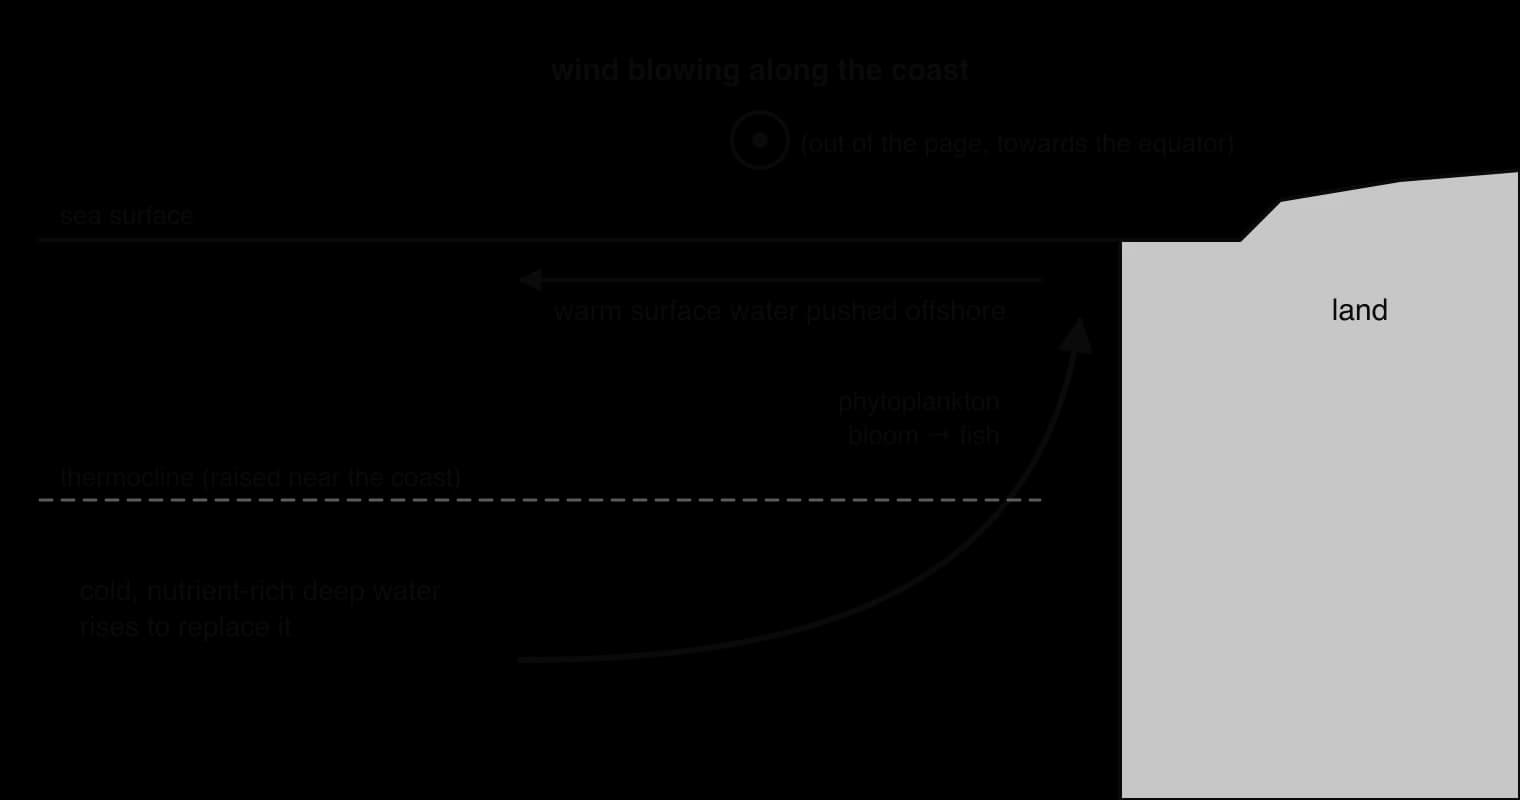
Upwelling zones cover a small part of the ocean but are among its most productive ecosystems. Off Peru, upwelling in the Humboldt Current system keeps sea surface temperatures as low as about 16 °C near 5° S, where most tropical seas are above 25 °C. The system supports huge shoals of anchoveta (Engraulis ringens) and accounts for roughly 18–20% of the world’s marine fish catch; in 1970 Peru’s anchoveta catch exceeded 12 million tonnes.
Sources: Wikipedia, “Humboldt Current” (2025), citing Montecino and Lange (2009).
Upwelling varies with the El Niño–Southern Oscillation. During an El Niño event, the trade winds weaken and warm surface water spreads east across the Pacific, deepening the thermocline off South America. The upwelling water is then warmer and poorer in nutrients, productivity falls and fish populations that depend on the upwelling decline. Seasonal lake turnover is the freshwater equivalent of upwelling: in both, mixing brings nutrients from deep water to the surface and sets off a burst of growth.
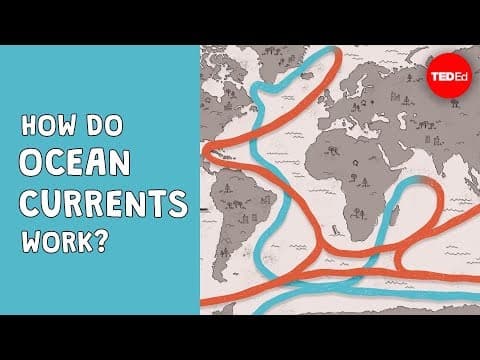
Surface ocean currents are driven mainly by wind, but the deep ocean moves too, much more slowly, because of differences in density. Seawater becomes denser when it is colder and when it is saltier. Where surface water becomes cold and salty enough, it sinks to great depths and spreads slowly along the ocean floor. The global circulation driven in this way is called thermohaline circulation (“thermo” for temperature, “haline” for salt).
In the Atlantic, winds carry warm surface water from the tropics north-east towards Europe in the Gulf Stream and the North Atlantic Drift. On the way, evaporation removes fresh water and leaves the salt behind, so the water becomes more saline. In the far North Atlantic, between Greenland, Iceland and Norway, the water releases its heat to the cold air above. Now cold and salty, it is dense enough to sink, forming North Atlantic Deep Water, which flows south along the floor of the Atlantic towards the Southern Ocean.
This overturning loop, the Atlantic Meridional Overturning Circulation (AMOC), is the engine of the North Atlantic conveyor belt. Rivers and melting ice bring fresh, low-salinity, low-density water into the North Atlantic, which works against the sinking: if enough fresh water is added, the surface water may not become dense enough to sink.
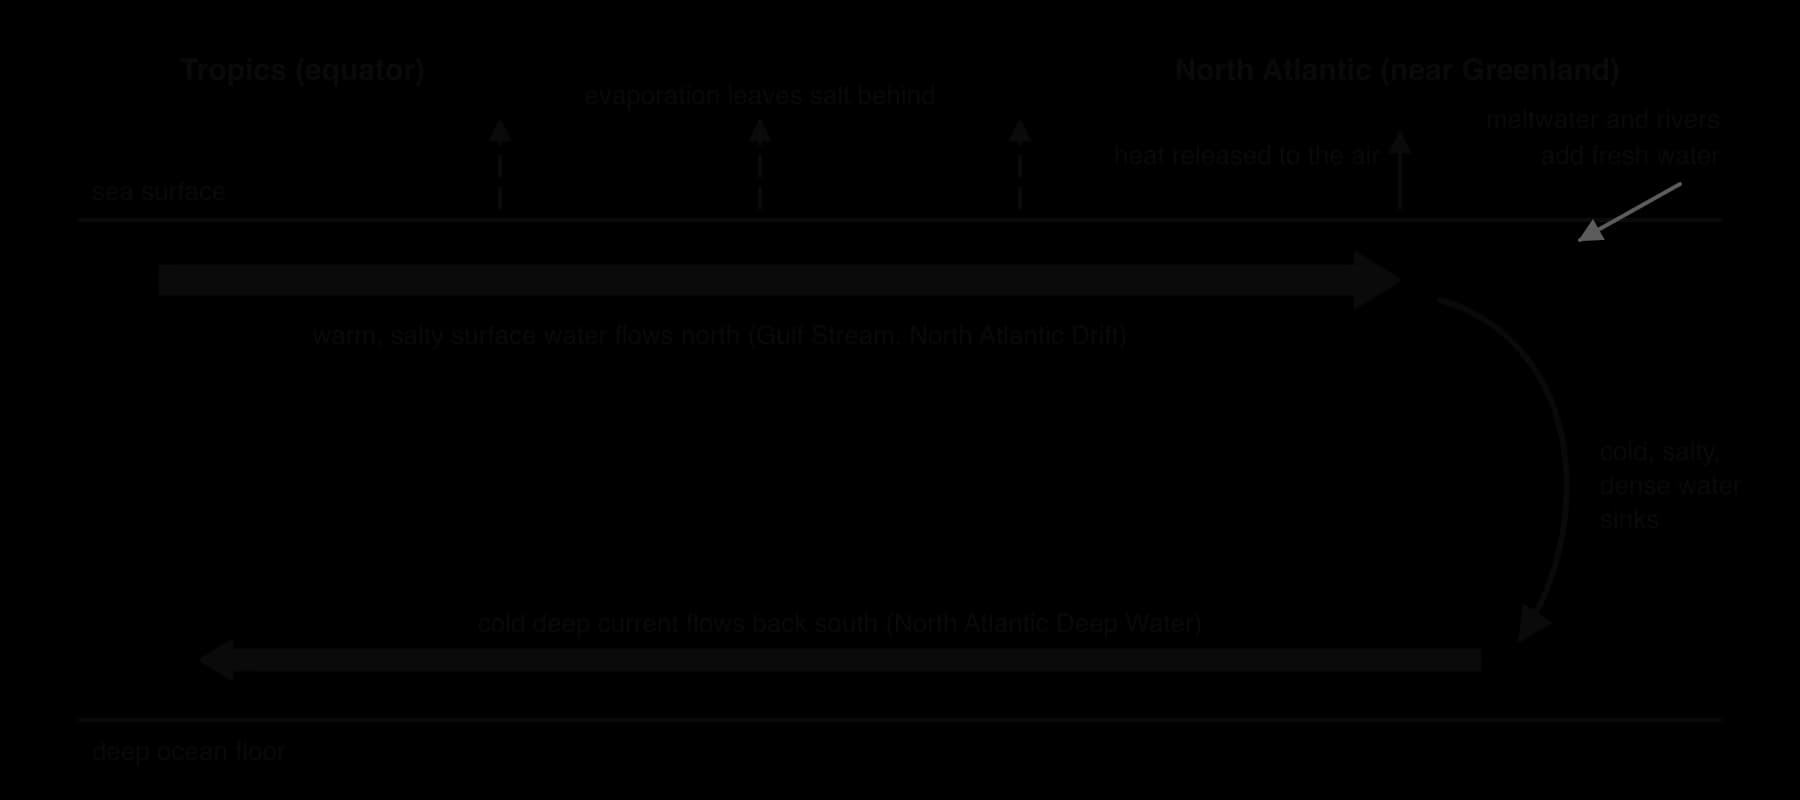
Deep water also forms around Antarctica, where sea ice forms in winter and leaves very salty, cold water behind, which sinks to the bottom of the oceans. From these sinking regions, deep water spreads through the Atlantic, Indian and Pacific Oceans, rises again by upwelling, especially in the Southern Ocean, and returns as surface currents. Water may take around 1,000 years to complete the journey, and the oldest deep water is found in the North Pacific.
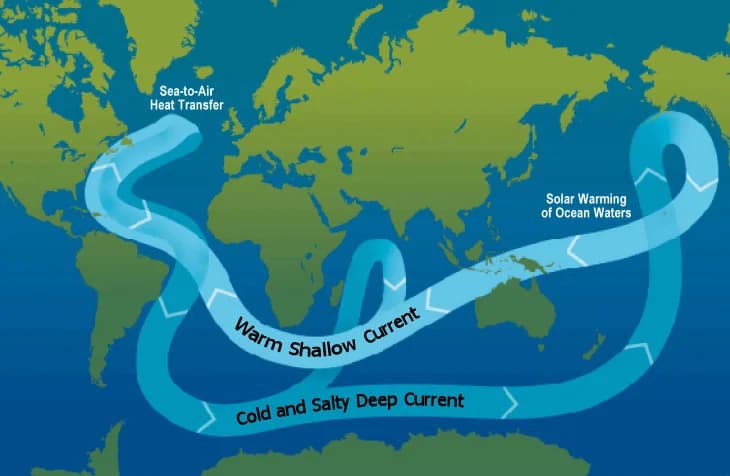
The conveyor belt moves heat from the tropics towards the poles and helps give north-west Europe a much milder climate than places at the same latitude in eastern Canada. It also carries dissolved oxygen into the deep ocean, returns nutrients to the surface where deep water upwells, and transfers dissolved carbon from the surface into deep water, where it stays for centuries.
 YouTube
Direct measurements of the AMOC began only in 2004, with a line of moored instruments across the Atlantic at 26° N, so longer-term changes are reconstructed from indirect evidence. One line of evidence is a patch of the North Atlantic south of Greenland, sometimes called the “cold blob”, that has cooled slightly over the 20th century while almost all the rest of the ocean warmed.
Reconstructions published from 2018 onwards suggest that the AMOC has weakened by about 15% since the mid-20th century, possibly because of meltwater from Greenland and greater rainfall, though some studies find little change before 1980 and attribute part of the cooling to changes in the atmosphere.
The IPCC’s 2021 assessment concluded that the AMOC is very likely to weaken over the 21st century under all emissions scenarios, and had medium confidence that it will not collapse abruptly before 2100. A collapse would sharply lower temperatures and precipitation in Europe and shift rainfall belts in the tropics, which is why the AMOC is treated as one of the Earth’s climate tipping points.
Sources: IPCC AR6 Working Group I (2021); Wikipedia, “Atlantic meridional overturning circulation” (2025), citing Caesar et al. (2018, 2021).
Water systems appear in both papers. Paper 2 Section A often asks for definitions of flows, a labelled systems diagram, a water budget calculation or an explanation of a human impact such as flash flooding. Paper 1 resources frequently include a lake, river basin or aquifer with data to process. Section B essays tend to combine the water cycle with human use and management, where evaluation from several perspectives is rewarded.
Short calculations with water budgets are common and quick to mark, so units and working matter.
The following resource is hypothetical data for a lake in a semi-arid basin, written for practice.
Year | River inflow (km³ yr⁻¹) | Precipitation on lake (km³ yr⁻¹) | Evaporation (km³ yr⁻¹) | Abstraction for irrigation (km³ yr⁻¹) | Lake area (km²) |
|---|---|---|---|---|---|
1980 | 12.0 | 1.5 | 13.0 | 0.5 | 5,200 |
1995 | 9.0 | 1.4 | 12.2 | 2.5 | 4,600 |
2010 | 6.5 | 1.3 | 10.8 | 4.0 | 3,700 |
Solar radiation drives evaporation, transpiration and sublimation; gravity drives precipitation and the downhill flows on land.
About 96.5% of water is in the oceans; fresh water is about 2.5%, mostly ice and groundwater, with very little in lakes and rivers.
The hydrological cycle is a system of stores (boxes) and flows (arrows): transformations change the state of water, transfers change its location.
Infiltration is water entering the soil; percolation is water moving down through soil and rock.
Urbanisation, deforestation and agriculture usually reduce infiltration and evapotranspiration and increase surface run-off, raising the risk of flash floods.
A water budget (change in storage = inputs − outputs) shows whether a lake or aquifer is in steady state; sustainable abstraction cannot exceed recharge.
Irrigation diversions broke the steady state of the Aral Sea, which lost most of its area; the Kok-Aral dam has partly restored the North Aral.
Polarity and hydrogen bonding give water cohesion, adhesion, solvent properties, a high specific heat capacity and a density maximum at about 4 °C. (HL)
The oceans absorb about a quarter of human CO₂ emissions; dissolved CO₂ makes seawater less alkaline (ocean acidification), while sinking organisms and sediments store carbon for the long term. (HL)
Stratification separates warm, oxygen-rich surface water from cold, nutrient-rich deep water across a thermocline, and warming is strengthening it. (HL)
Upwelling and lake turnover bring nutrients to the surface; thermohaline circulation moves heat around the globe and the AMOC is likely to weaken this century. (HL)
I can explain how solar radiation and gravity drive the water cycle.
I can state the main stores of water and their approximate relative sizes.
I can distinguish transfers from transformations and give examples of each.
I can construct a labelled systems diagram of the hydrological cycle.
I can explain how urbanisation, deforestation and agriculture change flows and cause flash floods.
I can calculate a water budget and a sustainable rate of abstraction.
I can evaluate the Aral Sea as an example of human alteration of a water system.
I can explain how the properties of water support life. (HL)
I can explain the short-term and long-term ocean carbon sink and why it may weaken. (HL)
I can describe stratification, the thermocline, lake turnover and upwelling. (HL)
I can explain how thermohaline circulation forms the ocean conveyor belt. (HL)