6.3 Climate change—mitigation and adaptation
Distinguish mitigation from adaptation, evaluate strategies from carbon taxes and renewables to flood defences and early warnings, and explain why sovereign states must cooperate to limit climate change.
- IB Environmental Systems and Societies
- Part of 6 Atmosphere and climate change
- SL and HL
Key terms introduced here
Each is in the ESS glossary, with every other term in the subject.
- Afforestation
The planting of trees on land that has not been forested for a long time, or never was, creating a new forest that stores carbon.
- B Corp
A for-profit company certified by the non-profit B Lab as meeting verified standards of social and environmental performance, accountability and transparency.
- Bioenergy with carbon capture and storage
A carbon removal method in which crops or trees are burned for energy and the carbon dioxide released is captured and stored underground, giving net removal from the atmosphere.
- Carbon capture and storage
A technology that captures carbon dioxide from power stations or industrial sources and stores it permanently, usually deep underground in rock formations, so that it does not reach the atmosphere.
- Carbon leakage
The movement of production and its emissions from a country with strict climate policies to one with weaker policies, which can cancel out the original emission cuts.
- Carbon neutrality
A state in which the carbon dioxide released by a country, organisation or activity is balanced by an equal amount removed from the atmosphere or offset, giving zero net emissions.
- Carbon offset
A reduction or removal of greenhouse gas emissions in one place, such as tree planting or avoided deforestation, that is paid for to compensate for emissions released elsewhere.
- Carbon pricing
Any policy that makes emitters pay for each tonne of carbon dioxide they release, either through a carbon tax or through an emissions trading scheme.
- Carbon tax
A tax charged on each tonne of carbon dioxide emitted, or on the carbon content of fuels, which raises the price of high-carbon activities so that emitters have an incentive to cut emissions.
- Climate change adaptation
Adjustment of human or natural systems to actual or expected climate change, reducing its harmful effects and making the most of any beneficial ones.
- Climate change mitigation
Action that reduces the causes of climate change by cutting greenhouse gas emissions, removing greenhouse gases from the atmosphere or reducing the warming process itself.
- Climate scepticism
Doubt or denial that climate change is happening, that it is caused mainly by human activity, or that it is serious enough to justify action.
- Conference of the Parties
The annual meeting of all the countries that are party to the UNFCCC, where climate agreements are negotiated and progress is reviewed.
- Cross-border carbon tax
A charge on imported goods according to the carbon dioxide emitted in making them, so that producers in countries without a carbon price cannot undercut those that pay one.
- Decarbonisation
The process of reducing or ending the use of energy sources that emit carbon dioxide, such as fossil fuels, and replacing them with low-carbon or renewable sources.
- Direct air capture
A technology that removes carbon dioxide directly from the surrounding air using chemical filters, after which the gas can be stored underground or used.
- Emissions trading
A scheme in which a government caps total emissions, issues permits up to the cap and lets emitters buy and sell them, so that emissions are cut where it is cheapest.
- Flood defence
A structure such as a levee, embankment, sea wall or storm surge barrier built to stop river or sea water from flooding land.
- Free rider
A person or country that enjoys the benefits of a shared resource or collective action without paying its share of the cost, such as a country that lets others cut emissions.
- Geoengineering
Deliberate, large-scale intervention in the Earth's climate system to counter global warming, either by reflecting sunlight away from the Earth or by removing carbon dioxide from the atmosphere.
- Intergovernmental Panel on Climate Change
The United Nations body, set up in 1988, that assesses the published science on climate change and reports on its causes, impacts and the options for mitigation and adaptation.
- Kyoto Protocol
An international agreement adopted in 1997 under the UNFCCC that set legally binding emissions targets for developed countries for 2008–2012.
- Land zoning
Planning rules that control what land may be used for in each area, for example banning new homes on floodplains or in zones at risk of storm surges.
- Loss and damage
Harm from climate change that cannot be avoided by mitigation or adaptation, such as destroyed homes or land lost to the sea, and the finance provided to help vulnerable countries recover.
- National Adaptation Programme of Action
A plan prepared by a least developed country under the UNFCCC that identifies its most urgent climate adaptation needs and ranks priority projects for funding.
- Nationally determined contribution
A country's own climate action plan under the Paris Agreement, setting out its emissions targets and policies, updated every five years.
- Net zero
A state in which human-caused greenhouse gas emissions are cut as far as possible and any that remain are balanced by an equal amount of greenhouse gas removed from the atmosphere.
- Non-structural adaptation
An adaptation to climate change that changes behaviour, rules, knowledge or practices rather than building infrastructure, such as early warnings, land zoning, building codes or drought-resistant crops.
- Ocean fertilisation
A geoengineering method that adds nutrients, usually iron, to parts of the ocean where they limit phytoplankton growth, so that the extra phytoplankton absorb carbon dioxide.
- Paris Agreement
The international climate agreement adopted at COP21 in 2015, in which almost every country agreed to keep warming well below 2 °C and to set its own emissions targets.
- Reforestation
The replanting or natural regrowth of forest on land where forest has recently been cleared or degraded.
- Shared Socioeconomic Pathways
A set of five storylines describing how society, population and the economy might develop this century, combined by the IPCC with emissions levels to project future climate change.
- Smart city
A city that uses sensors, data and digital networks to run services such as energy, transport, water and waste more efficiently, often with apps that help citizens choose low-carbon options.
- State sovereignty
The principle that each state has full authority over its own territory and affairs, so no outside body can force it to act without its consent, for example to cut its emissions.
- Stratospheric aerosol injection
A proposed geoengineering method that would release reflective particles such as sulfates into the stratosphere so that less sunlight reaches the Earth's surface.
- Structural adaptation
An adaptation to climate change that involves building or changing physical infrastructure, such as flood defences, sea walls, cyclone shelters or desalination plants.
- Subsidy
A payment or tax reduction from government that lowers the cost of a product or activity, used for example to encourage renewable energy, electric vehicles or insulation.
- United Nations Framework Convention on Climate Change
The international treaty agreed in 1992 whose aim is to stabilise greenhouse gas concentrations at a level that prevents dangerous human interference with the climate system.
Notes on 6.3 Climate change—mitigation and adaptation
Learning objectives
Distinguish between climate change mitigation and climate change adaptation, with examples of each.
Explain why state sovereignty makes international cooperation necessary to avoid catastrophic climate change, and outline the role of treaties and cross-border carbon taxes.
Define decarbonisation, carbon neutrality and net zero, and compare the dates that different countries have set for reaching them.
Describe at least two examples of each of the three categories of mitigation, and evaluate their effectiveness.
Describe at least two structural and two non-structural adaptation strategies, and evaluate them for a named place.
Outline how adaptation plans such as National Adaptation Programmes of Action are developed and funded.
Design a survey to investigate attitudes to a proposed climate solution.
Evaluate economic, legislative, industry and personal responses to climate change. (HL)
Outline the role of the UNFCCC, the IPCC and COP summits, the outcomes of the most recent COP and the Kigali Amendment. (HL)
Interpret graphs of the IPCC emissions scenarios and explain their implications. (HL)
Evaluate geoengineering and the use of new technology, including smart cities, in mitigation. (HL)
Discuss the barriers to climate action, the role of stakeholders, differing perspectives and the atmosphere as a commons. (HL)
Introduction
Human societies can respond to climate change in two ways: by tackling its causes, which means cutting the greenhouse gas emissions that drive global warming, and by preparing for the changes that can no longer be avoided. Both responses matter because the warming already under way will continue for decades, while the amount of further warming depends on choices made now.
Responding to climate change brings together all three foundation ideas of the course. The climate is a global system with long time lags and tipping points, so actions taken in one place affect people everywhere. Different perspectives lead people and countries to very different views of how urgent action is and who should pay for it. Every response is also a question of sustainability and environmental justice, because the countries that emitted least are often the most exposed to harm.
Mitigation and adaptation: two kinds of response
The causes of climate change can be followed as a chain. Human activities such as burning fossil fuels, clearing forests and farming release greenhouse gases; the higher concentrations strengthen the enhanced greenhouse effect; the extra energy retained warms the planet; and the warming produces impacts such as heatwaves, droughts, floods and sea-level rise. Responses can act at different points along this chain.
Mitigation acts on the first links of the chain. Replacing a coal power station with a wind farm, planting a forest or taxing petrol all reduce the amount of warming that will happen in future. Because carbon dioxide stays in the atmosphere for centuries, the benefits of mitigation build up slowly and are shared by every country, whoever paid for them.
Adaptation acts on the last link. A sea wall, a drought-resistant crop or a heatwave warning system does nothing to slow warming, but it reduces the damage that warming causes in one place. Its benefits are local and usually immediate, so communities are often more willing to pay for it. Some changes also bring opportunities, such as longer growing seasons at high latitudes, and adaptation includes making use of them.
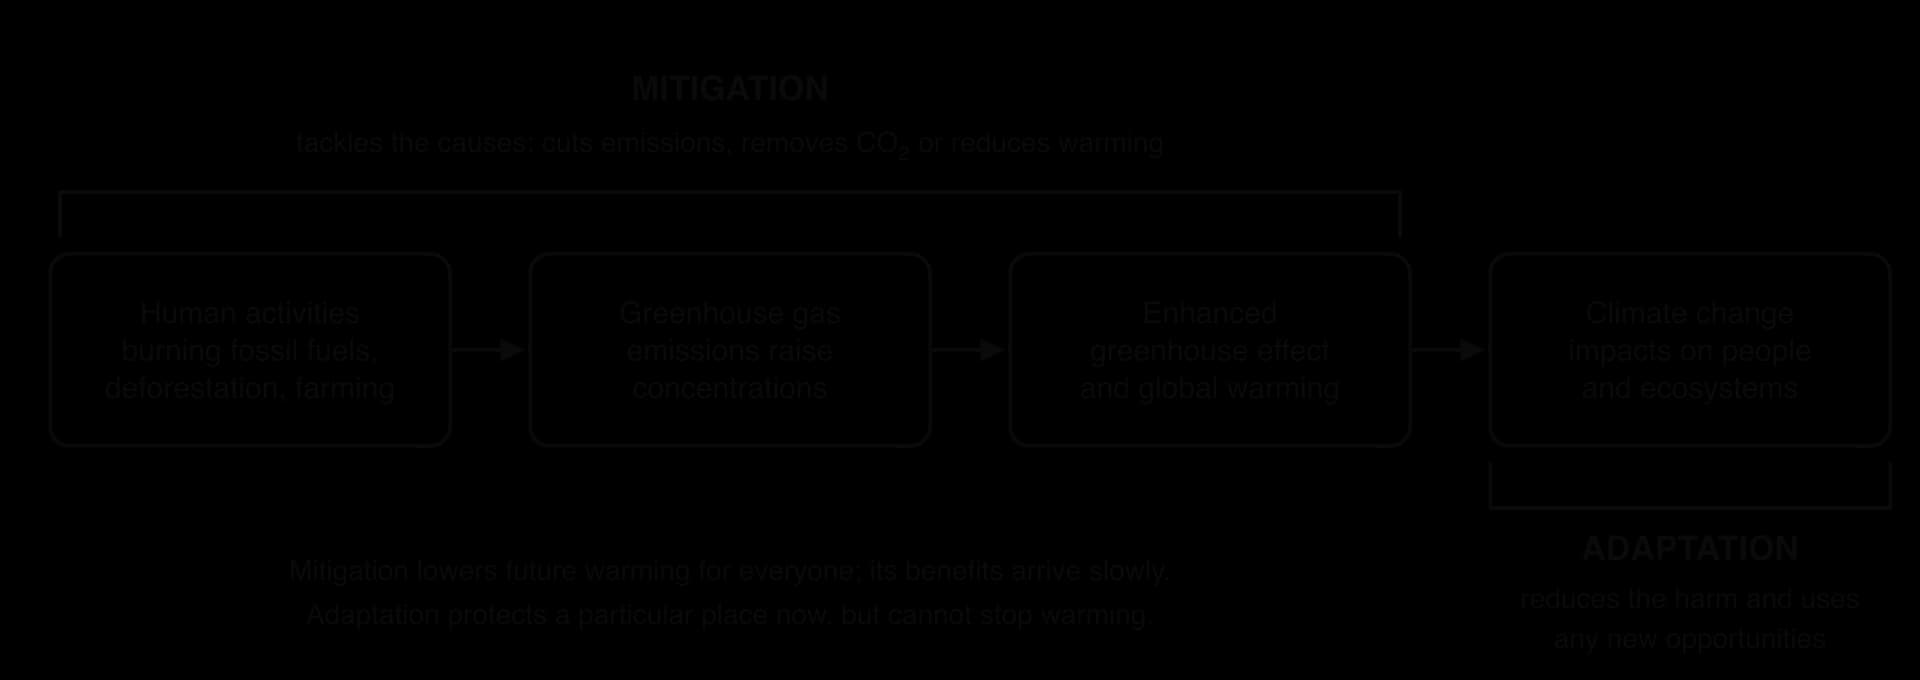
The two responses depend on each other. The more successful mitigation is, the less adaptation will be needed; the more warming is allowed to happen, the more expensive adaptation becomes, until some places reach the limits of adaptation, where no affordable measure can protect them. Low-lying islands facing a sea-level rise of a metre or more are the clearest example.
Mitigation | Adaptation | |
|---|---|---|
Aim | Reduce the causes of climate change | Reduce the harm from climate change, use any benefits |
Acts on | Emissions, greenhouse gas concentrations, the energy balance | Exposure and vulnerability of people and ecosystems |
Scale of benefit | Global: every country gains | Local or national: the place that invests gains |
Timing of benefit | Slow: decades, because of time lags in the climate system | Fast: protection from the next flood or drought |
Examples | Renewable electricity, carbon tax, afforestation, carbon capture | Flood defences, early warning systems, land zoning, drought-resistant crops |
Why climate change needs global action
Carbon dioxide mixes through the whole atmosphere within one to two years, so a tonne emitted in Germany has the same warming effect as a tonne emitted in India or Brazil. No country can protect itself from climate change by cutting only its own emissions. If a few countries cut deeply while the rest continue to grow their emissions, the global total still rises, and the countries that cut have paid a cost without gaining much protection.
State sovereignty is the foundation of international law, and it is the main obstacle to global climate action. There is no world government that can order a country to close its coal mines. Countries act together only when they agree to, so climate action depends on negotiation, and on agreements that countries choose to sign and then ratify.
Conventions, protocols and agreements
International cooperation on climate change is built in layers. A convention sets out general principles and creates the institutions; protocols and agreements added later set more specific commitments. Each country decides whether to join, and a treaty binds only the countries that are party to it.
The United Nations Framework Convention on Climate Change (UNFCCC) was opened for signature at the Rio Earth Summit in June 1992 and came into force in March 1994. Its aim is to stabilise greenhouse gas concentrations at a level that prevents dangerous human interference with the climate system. Almost every country is a party.
The Conference of the Parties (COP) is the meeting of all UNFCCC parties, held every year since 1995 except 2020, when the pandemic postponed it. COP summits are where the detailed agreements are negotiated.
The Kyoto Protocol (adopted 1997, in force 2005) gave developed countries legally binding emissions targets for 2008–2012. The United States signed but never ratified it, and Canada withdrew in 2012. Developing countries, including China and India, had no targets.
The Paris Agreement (adopted at COP21 in December 2015, in force November 2016) commits its parties to hold warming "well below 2 °C above pre-industrial levels" and to pursue efforts to limit it to 1.5 °C. Every party, rich or poor, sets its own target.
Sources: Wikipedia, "United Nations Framework Convention on Climate Change", "Kyoto Protocol" and "Paris Agreement" (2026).
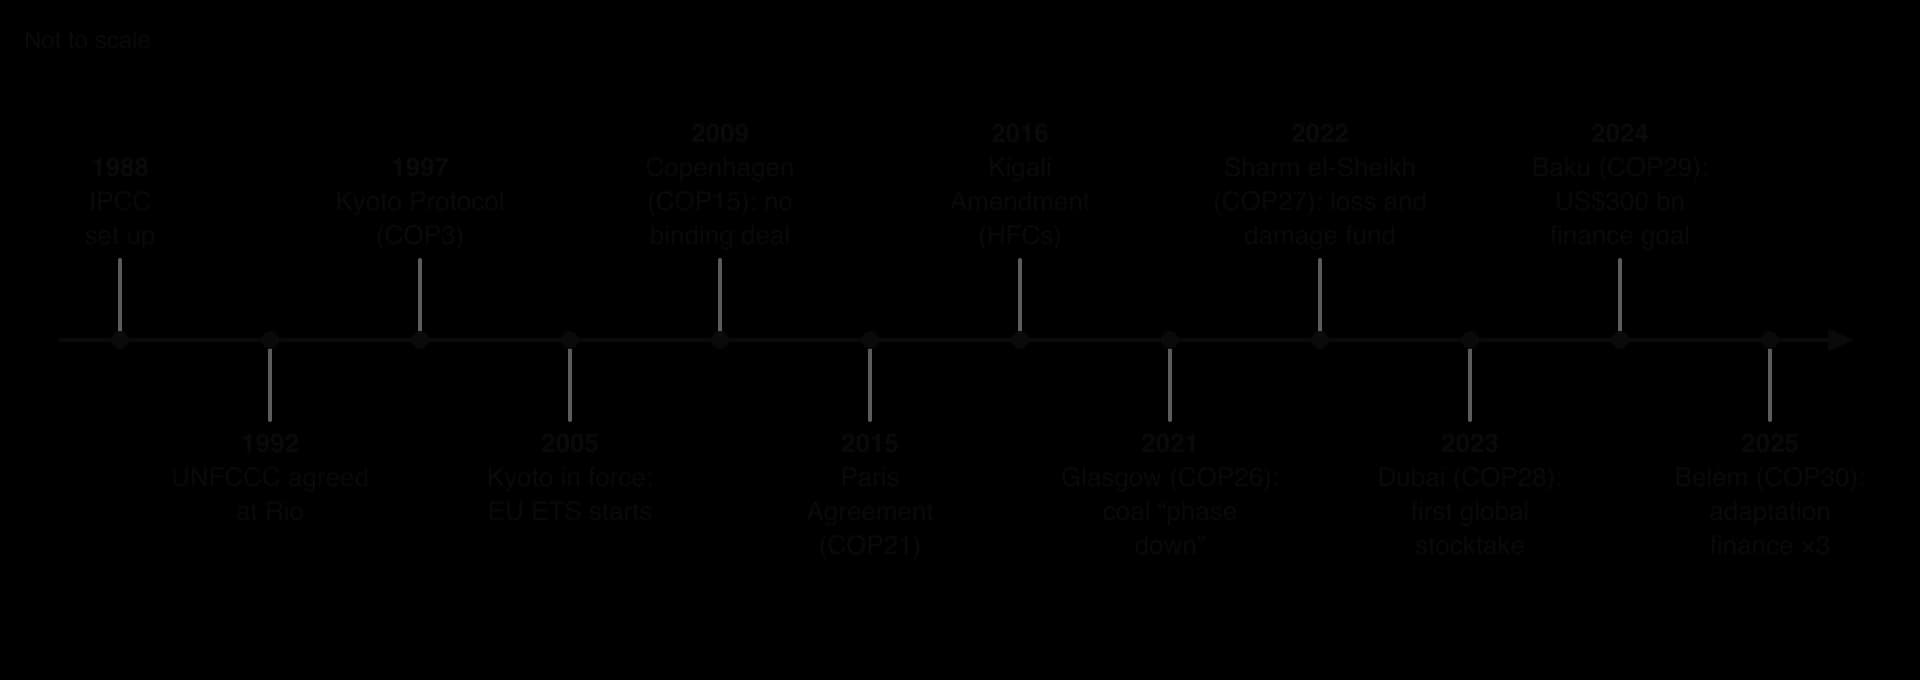
The Paris Agreement works through nationally determined contributions. Each NDC is meant to be more ambitious than the last, and a global stocktake every five years (the first was completed in 2023) checks whether the total adds up to the temperature goal. The targets themselves are not legally binding: countries must prepare, report on and update their NDCs, but no court or sanction forces them to meet the numbers. This design allowed almost every country to join, but the cuts promised in the NDCs submitted so far add up to far less than the temperature goal needs.
Participation can also change with national politics. The United States left the Paris Agreement in November 2020, rejoined in February 2021, and left again with effect from January 2026. Such reversals show the limits of an agreement that rests on each state's sovereign choice.
Sources: Wikipedia, "Paris Agreement" (2026).
Sanctions and cross-border carbon taxes
Because a treaty cannot force a sovereign state to act, countries that do act look for other ways to encourage the rest. One concern is carbon leakage: if steel made in a country with a carbon price costs more than steel made where emissions are free, production and its emissions may simply move abroad.
The European Union's Carbon Border Adjustment Mechanism (CBAM) is the first large cross-border carbon tax. From 2026, importers of carbon-intensive goods such as steel, cement and aluminium pay a charge linked to the carbon content of what they bring into the EU. Supporters see it as a fair way to protect climate policy and to push trading partners to price carbon; critics in countries such as India and China see it as a trade barrier that makes poorer exporters pay for Europe's goals.
Sources: Wikipedia, "European Union Emissions Trading System" (2026).
Who emits, and who should act first?
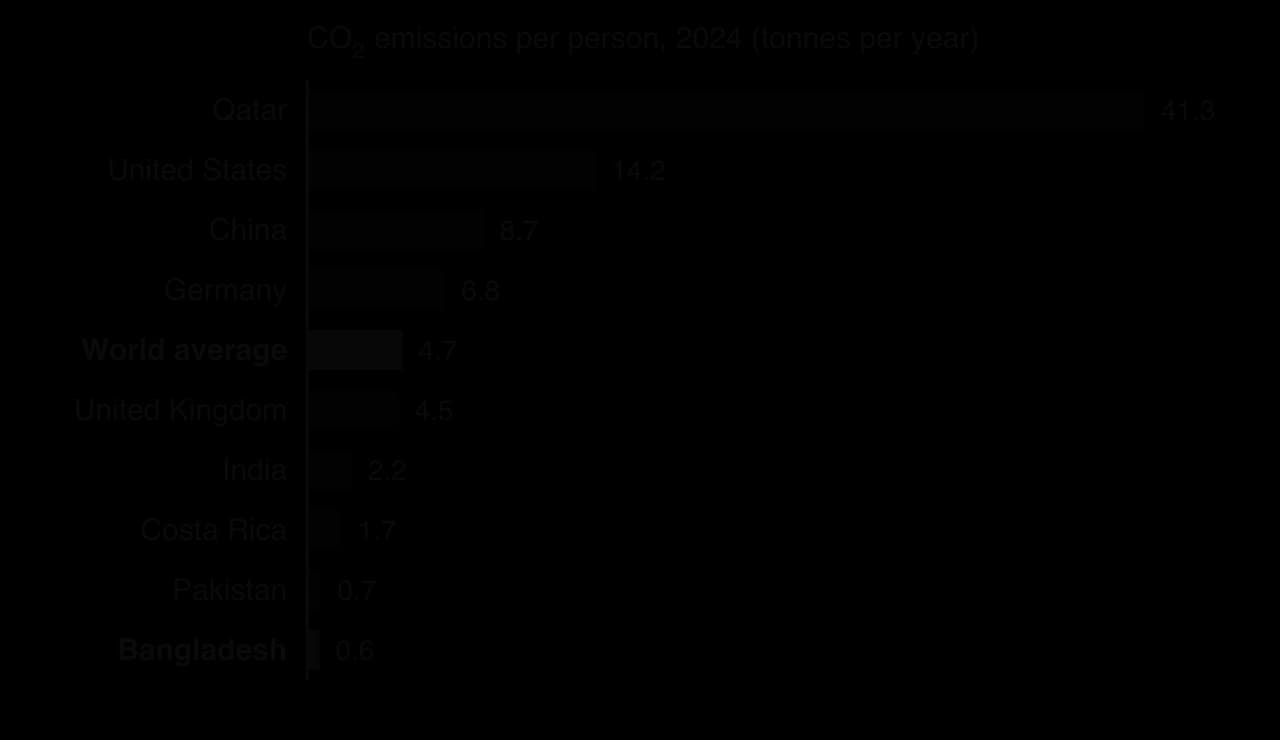
Countries differ enormously in their emissions per person, which shapes how they see their duty to act. Under the UNFCCC, countries accepted "common but differentiated responsibilities": all share responsibility, but those that have emitted most, and can afford most, should lead.
Decarbonisation and carbon neutrality
Most greenhouse gas emissions come from burning coal, oil and gas for electricity, heating, transport and industry. Cutting them on a large scale therefore means changing how economies produce and use energy.
Decarbonisation usually follows three steps: generating electricity from low-carbon sources such as wind, solar, hydroelectric and nuclear power; switching other uses of energy to that clean electricity (electric cars, heat pumps); and using less energy in the first place through efficiency. The world share of electricity from renewable energy rose from about 19% in 1990 to about 34% in 2025, but total fossil fuel use has also kept rising.
Sources: Ember and Energy Institute, via Our World in Data, "Share of electricity production from renewables" (2026).
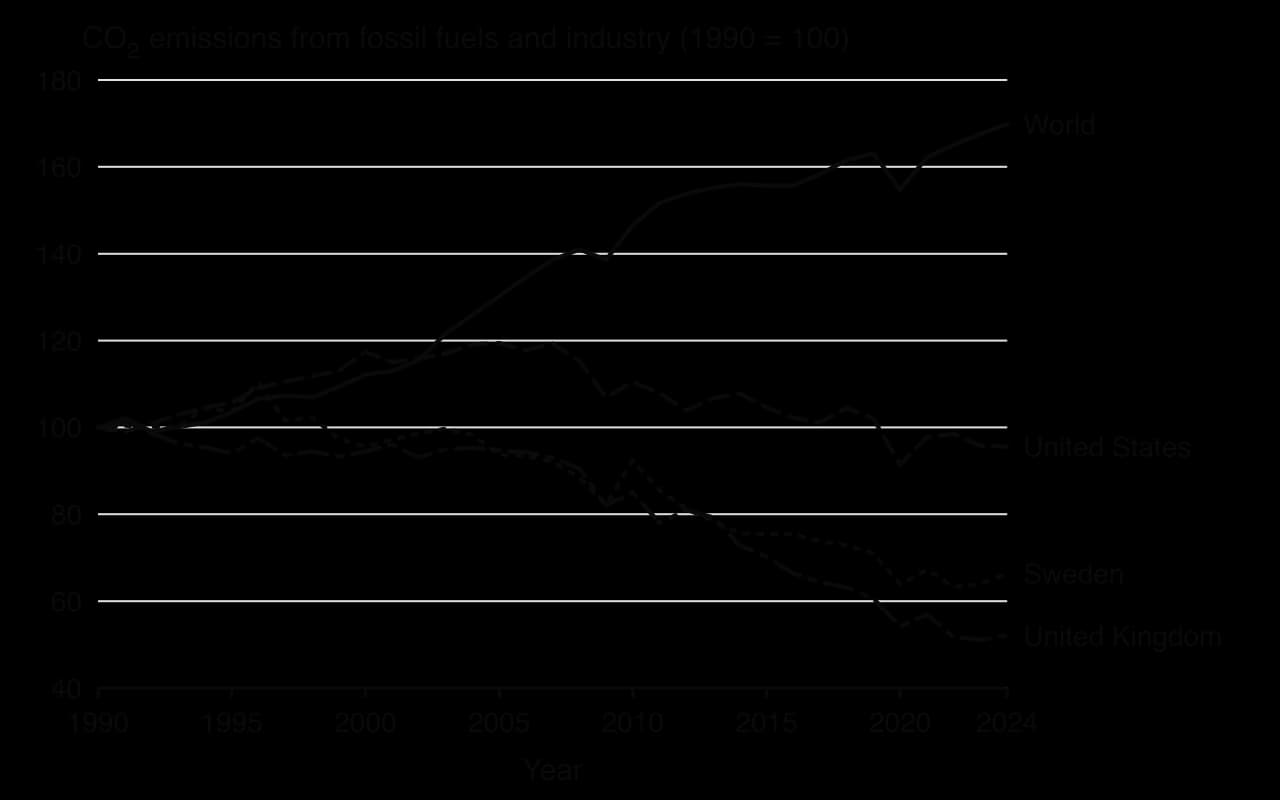
Some countries have shown that emissions can fall while the economy grows, a pattern known as decoupling. The United Kingdom's CO₂ emissions fell by about 48% between 1990 and 2024, mostly by replacing coal with gas and then with wind power. Over the same period China's emissions rose almost fivefold as its economy industrialised, which is why world emissions kept rising. Emissions counted where goods are produced also understate the footprint of rich countries that import manufactured goods.
Carbon neutrality and net zero are often used as if they mean the same thing. Net zero is usually the stricter target: it covers all greenhouse gases, and it means cutting emissions as far as possible (typically by 90% or more) and using removals only for the small amount left over. Carbon neutrality can sometimes be claimed by buying large numbers of carbon offsets while emissions continue.
Country or group | Target year for net zero or carbon neutrality | Notes |
|---|---|---|
Bhutan, Suriname | Already claim to be carbon negative | Large forests absorb more CO₂ than they emit; other greenhouse gases still make total emissions net positive |
Finland | 2035 | Written into law |
Germany, Sweden | 2045 | Written into law |
United Kingdom | 2050 | First set in law in 2019 (Climate Change Act amendment) |
European Union | 2050 | Climate neutrality, written into EU law |
Costa Rica, Brazil | 2050 | Costa Rica: National Decarbonisation Plan (2019) |
China, Saudi Arabia, Russia, Nigeria | 2060 | China is the largest emitter today |
India | 2070 | The latest date set by a major economy |
Sources: Wikipedia, "Net-zero emissions", "Climate Change Act 2008" and the "Climate change in …" articles for Costa Rica, Brazil, Nigeria, Finland, Germany and Sweden (2026).
About 145 countries, covering close to 90% of global emissions, had announced or were considering net zero targets by late 2023. The spread of dates reflects different perspectives on fairness. Industrialised countries that have emitted for 200 years face pressure to reach net zero first, while emerging economies argue that they need longer to lift people out of poverty. A target date has limited value without a plan, because the warming caused depends on the total amount emitted on the way to net zero rather than on the year it is reached.
Three categories of mitigation
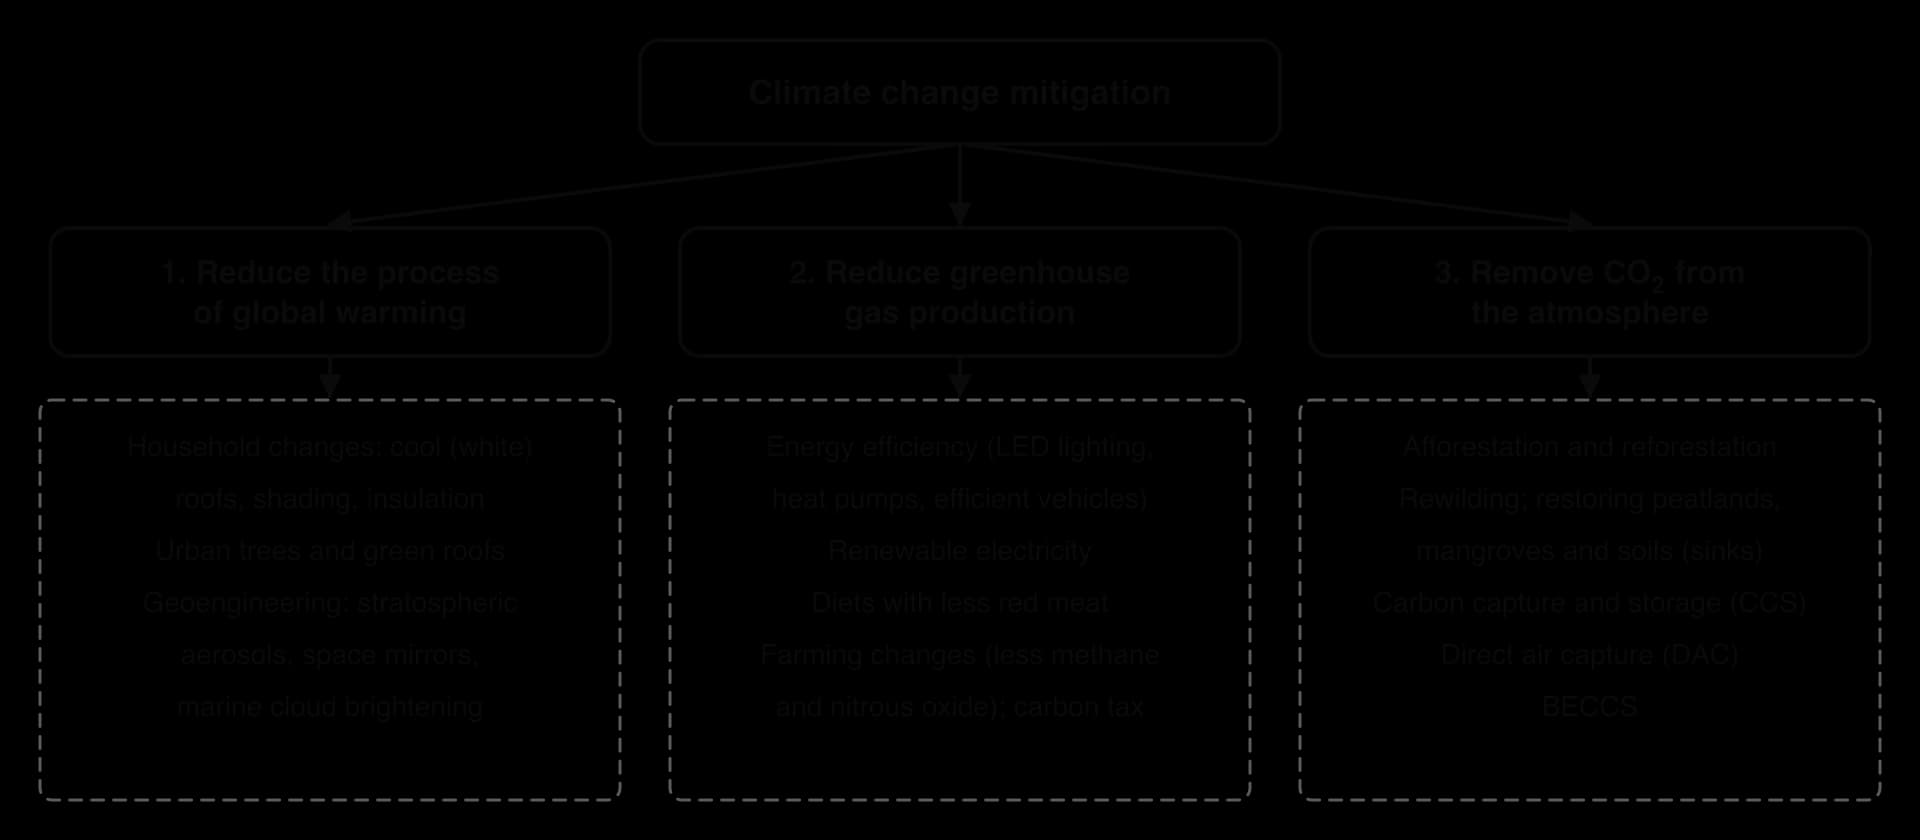
Mitigation strategies can be grouped by the part of the climate system they act on. Some reduce the warming process directly, without changing greenhouse gas levels; some reduce the production of greenhouse gases; and some remove carbon dioxide that is already in the atmosphere. A complete plan uses all three, because no single category is enough on its own.
1. Reducing the process of global warming
Measures in this category change how much solar energy is absorbed or how much heat builds up, without reducing greenhouse gases. At the household and city scale, light-coloured or "cool" roofs reflect more sunlight than dark ones (they have a higher albedo), so buildings absorb less heat and need less air conditioning. Shade trees, green roofs and insulation keep homes cooler in summer, reducing both local heat and the electricity used for cooling. These household changes are small individually but add up across millions of buildings, and they also reduce the urban heat island effect.
At the largest scale, geoengineering proposals would reflect a small fraction of incoming sunlight away from the whole planet, for example by adding reflective particles to the stratosphere. These ideas could cool the climate quickly, but they treat the symptom rather than the cause, because carbon dioxide continues to build up. They are untested at scale and highly controversial.
2. Reducing the production of greenhouse gases
This is the largest category, because it deals with the source of the problem. The main approaches are:
Energy efficiency: getting the same service from less energy, for example LED lighting, which uses a fraction of the electricity of old filament bulbs, well-insulated buildings and heat pumps. Efficiency usually saves money as well as emissions.
Renewable energy: generating electricity from wind, solar, hydroelectric and geothermal sources. Costa Rica generated almost all of its electricity from renewable sources in 2025, mainly hydroelectric, geothermal and wind; Germany's share reached about 59% in 2025.
Food choice changes: producing a kilogram of beef from a beef herd emits about 99 kg of CO₂-equivalent on average, compared with about 1 kg for peas, so diets with less red meat cut emissions from farming and land clearing.
Agricultural changes: reducing methane from cattle and flooded rice fields, applying nitrogen fertiliser more precisely to cut nitrous oxide emissions, and protecting carbon in soils.
Carbon tax: a price on each tonne of CO₂ emitted, which makes polluting activities more expensive and cleaner alternatives more competitive.
Sources: Our World in Data, "Share of electricity production from renewables" (2026) and "Greenhouse gas emissions per kilogram of food product" (Poore and Nemecek, 2018).
Sweden introduced one of the first carbon taxes in January 1991, and its CO₂ emissions have fallen by about a third since 1990 while its economy has grown. A carbon tax lets each household and business decide how to cut emissions, which tends to find the cheapest cuts first. It can, however, hit poorer households hardest, because they spend a larger share of their income on fuel and heating; returning the revenue as a payment to every citizen (a "carbon dividend") is one way of making it fairer.
Sources: Global Carbon Budget, via Our World in Data (2025); Wikipedia, "Carbon tax" (2026).
3. Removing carbon dioxide from the atmosphere
Even with deep cuts, some emissions (from aviation, cement and farming, for example) will be very hard to eliminate, and removals will be needed to balance them. Removal works by strengthening natural carbon sinks or by building technological ones.
Trees take in CO₂ by photosynthesis and store the carbon in wood, roots and soil, a form of carbon sequestration. The Great Green Wall in Africa's Sahel, endorsed by the African Union in 2007, aims to restore 100 million hectares of degraded land and capture 250 million tonnes of CO₂ by 2030; about 30% of the area had been restored by 2024. The project began as a line of planted trees and shifted towards helping farmers protect and regrow existing trees, because many planted seedlings died. Rewilding and the restoration of peatlands and mangroves also increase natural carbon storage while restoring biodiversity.
Sources: Wikipedia, "Great Green Wall (Africa)" (2026).
Norway's Sleipner gas field in the North Sea has injected about a million tonnes of CO₂ a year into a sandstone layer about 1,000 m below the seabed since 1996, the world's first offshore carbon capture and storage project.
Direct air capture (DAC) goes further by removing CO₂ from ordinary air. Climeworks, a Swiss company, opened its Orca plant in Iceland in 2021 (designed for up to 4,000 tonnes a year) and the larger Mammoth plant in 2024 (up to 36,000 tonnes a year), where the CO₂ is mineralised in basalt rock. These amounts are tiny compared with world emissions of about 38 billion tonnes of CO₂ a year, and DAC uses a great deal of energy, so it is expensive.
Sources: Wikipedia, "Sleipner gas field" and "Climeworks" (2026); Global Carbon Budget (2025).
 YouTube
Strategy (category) | Strengths | Limitations |
|---|---|---|
Renewable electricity (2) | Cuts emissions at the source; costs of solar and wind have fallen sharply; improves energy security | Intermittent supply needs storage or back-up; needs land, minerals and new grids |
Carbon tax (2) | Uses the market to find the cheapest cuts; raises revenue | Politically unpopular; can be regressive; carbon leakage if neighbours do not follow |
Diet change (2) | Large potential saving; also frees farmland | Depends on individual choice and culture; affects farmers' incomes |
Afforestation (3) | Cheap; also restores soils, water and habitats | Slow; storage can be lost to fire; monoculture plantations harm biodiversity; competes for land |
CCS and DAC (3) | Permanent storage; can deal with hard-to-cut emissions | Expensive and energy-hungry; small scale so far; may delay emission cuts |
Cool roofs (1) | Cheap; cools homes and cities | Local effect only; does not reduce CO₂ |
Adaptation strategies
Some climate change is now unavoidable: global temperature has already risen by more than 1 °C, and sea level will keep rising for centuries because the oceans warm slowly. Adaptation reduces the harm to people and ecosystems, and in a few places makes use of new opportunities, such as new crops in regions that become warmer.
Adaptation strategies fall into two broad groups, according to whether they build something or change how people behave and make decisions.
Structural adaptation
The Netherlands, where about a quarter of the land lies below sea level, has the world's best-known flood defences. After the North Sea flood of 1953, the Delta Works were built to close or protect the estuaries of the south-west. The Oosterscheldekering storm surge barrier (completed 1986) has huge movable gates that close only during storms, so that the tide still flows in and the saltwater ecosystem and oyster harvests survive; the original plan for a solid dam was changed after protests from fishers and environmentalists. Defences in the most populated provinces are designed to fail no more than once in 10,000 years.
London is protected by the Thames Barrier, operational since 1982, which had closed 221 times by mid-2026. It was designed for a rise in sea level of 8 mm per year and is planned to remain in use until about 2070, after which a new barrier or raised defences may be needed. Other structural adaptations include desalination plants that provide water when droughts reduce rivers and reservoirs, and movable or raised infrastructure, such as houses on stilts or floating buildings.
Sources: Wikipedia, "Delta Works" and "Thames Barrier" (2026).
Non-structural adaptation
Adapted farming: drought-tolerant and salt-tolerant crop varieties, changed planting dates and water-saving irrigation. In Bangladesh, rice varieties that tolerate salty water have been released for coastal farms.
Vaccination and health: as warmer, wetter conditions spread mosquito-borne diseases such as dengue and malaria to new areas, vaccination, mosquito control and health warnings reduce the harm.
Land zoning: planning rules that stop new building on floodplains or eroding coasts, and can move people and assets back from the shoreline over time (managed retreat).
Building codes: rules on how buildings are constructed. After Hurricane Andrew destroyed 63,500 homes in 1992, Florida brought in strict wind-resistance standards, and in 2002 a single statewide building code; a review after Hurricane Milton in 2024 found that no homes built under the 2002 code had been destroyed.
Early warning and education: forecasts, warning networks and evacuation drills, which have saved hundreds of thousands of lives in cyclone-prone countries.
Sources: Wikipedia, "Climate change in Bangladesh" and "Florida Building Code" (2026).
The Netherlands has also moved towards non-structural and nature-based approaches. The Room for the River programme (2006–2015, €2.2 billion) moved dykes back from rivers, lowered floodplains and created bypass channels in about 40 projects so that the Rhine and its branches could carry more water safely, instead of building dykes ever higher. Working with natural processes in this way often gives extra benefits, such as wetlands for wildlife and space for recreation.
Sources: Wikipedia, "Room for the River (Netherlands)" (2026).
Type | Example | Strength | Limitation |
|---|---|---|---|
Structural | Delta Works, Netherlands | Very high level of protection for a dense, wealthy population | Very expensive; must be raised as the sea rises; can give a false sense of safety |
Structural | Desalination plant | Reliable water in drought | High energy use and cost; salty brine waste |
Non-structural | Florida building code | Cheap per building; protects lives and property | Only applies to new buildings; enforcement needed |
Non-structural | Salt-tolerant rice, Bangladesh | Keeps farms productive as salinity rises | Has limits as salinity increases; seed must reach poor farmers |
Non-structural | Land zoning on floodplains | Prevents new exposure at low cost | Restricts landowners; politically difficult where land is scarce |
Investigating attitudes to a climate solution
Whether a mitigation or adaptation measure succeeds depends on whether people support it. A values survey or questionnaire can measure attitudes to a proposed solution in a school or community, such as solar panels on the school roof, a car-free zone near the school gates or a meat-free day in the canteen.
Adaptation plans at many scales
Adaptation works best when it is planned in advance rather than improvised after a disaster. Plans are now made at every scale: by individual households and farmers, by communities, by cities, and by national governments.
National Adaptation Programmes of Action were designed for the world's least developed countries, which have the fewest resources and are often the most exposed. Each NAPA uses existing knowledge and consultation with local communities to rank the activities that cannot wait, and it includes short profiles of priority projects so that donors can fund them. By 2011, 46 least developed countries had submitted NAPAs to the UNFCCC, and the Least Developed Countries Fund had approved about US$177 million for projects. Bangladesh's NAPA (2005) included priorities for agriculture (irrigation and drought-resistant crops), water resources, health, coastal zones (embankments and cyclone early warning) and flood shelters.
Sources: Wikipedia, "National Adaptation Programme of Action" and "Climate change in Bangladesh" (2026).
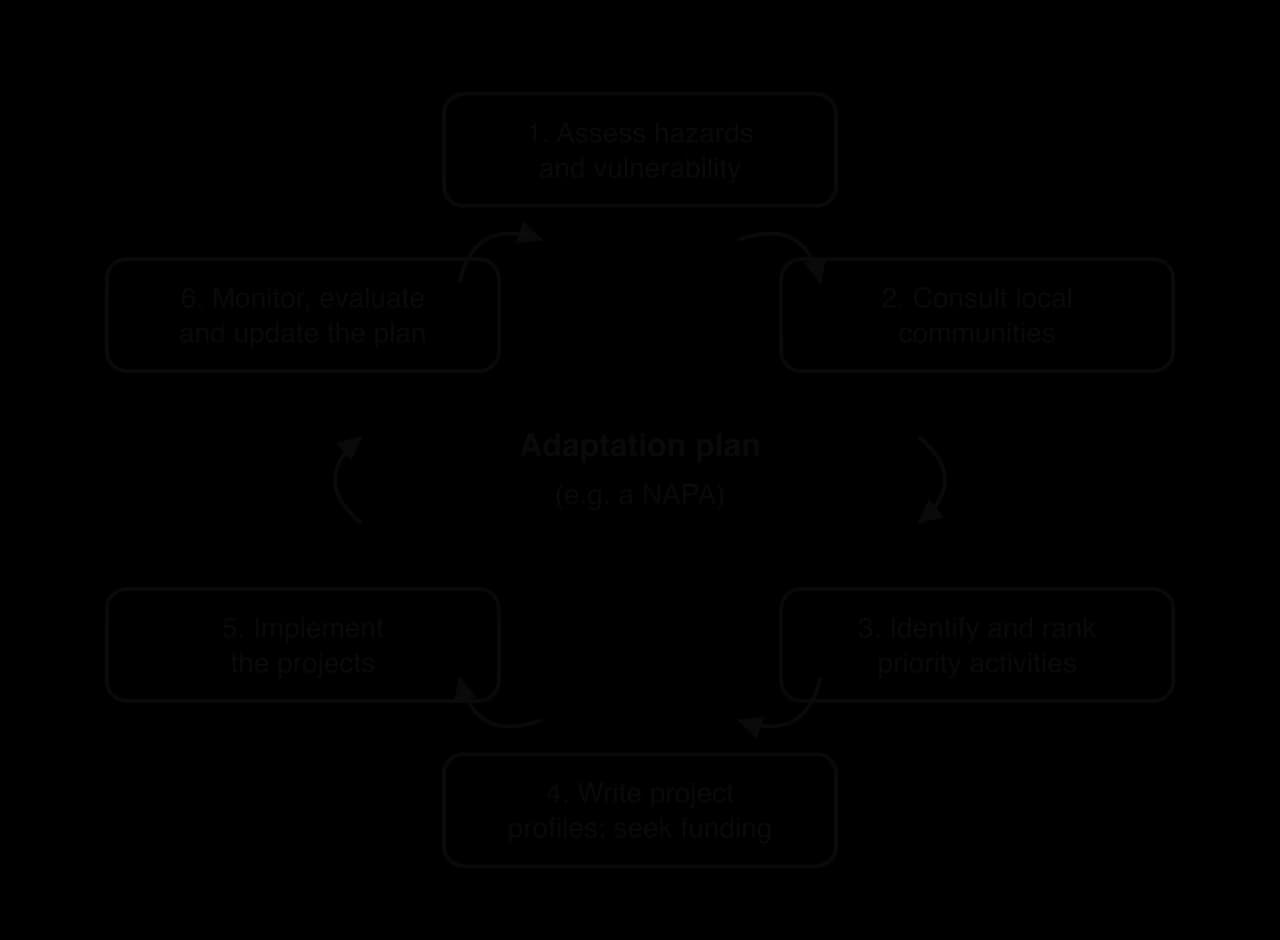
The UN Development Programme (UNDP) helps developing countries through this process. It supports governments in assessing vulnerability, consulting communities, drawing up local priority activities and applying to climate funds, and then in carrying out the projects. Many countries have since moved from short NAPAs to longer-term National Adaptation Plans that build adaptation into every area of government.
Cities and communities make their own resilience and adaptation plans. Rotterdam, much of which lies below sea level, has built "water squares" that are public spaces, such as sports courts and seating areas, in dry weather and store stormwater in heavy rain. At the household level, farmers in Bangladesh grow vegetables on floating gardens of water hyacinth and bamboo that rise with floodwater, an example of local and traditional knowledge used in adaptation.
How does an adaptation plan reduce vulnerability?
Vulnerability to a hazard depends on three things: exposure (whether people and assets are in harm's way), sensitivity (how badly they are affected) and adaptive capacity (their ability to cope and recover). A good plan works on all three: zoning reduces exposure, stronger buildings and crops reduce sensitivity, and education, savings, insurance and early warnings raise adaptive capacity.
Perspectives on mitigation and adaptation
People with different environmental value systems prefer different responses. The choice is rarely between the categories, but about the balance between them and about who pays.
Perspective | Preferred responses | Concerns |
|---|---|---|
Technocentric | Carbon capture, direct air capture, nuclear power, geoengineering, high-tech flood defences | That restricting consumption will harm economic growth; believes innovation can solve the problem |
Anthropocentric | Carbon pricing, efficiency, managed adaptation, international agreements and finance | Costs and benefits to people, fairness between countries and generations |
Ecocentric | Lower consumption, diet change, rewilding and forest protection, local renewable energy | That technological fixes and offsets delay real change and harm ecosystems |
Mitigation also links to several of the Sustainable Development Goals: SDG 13 (climate action) directly, SDG 7 (affordable and clean energy) through renewables, and SDG 15 (life on land) through forest restoration. Climate change is one of the planetary boundaries that has already been crossed, so mitigation is part of returning to a safe operating space for humanity.
Case study: cyclone preparedness and adaptation in coastal Bangladesh
Context
Bangladesh occupies most of the delta of the Ganges, Brahmaputra and Meghna rivers, one of the largest and most densely populated deltas in the world. Much of the coast is very low: about 62% of coastal land lies less than 3 m above sea level. The funnel shape of the Bay of Bengal concentrates tropical cyclone storm surges, which can push sea water many kilometres inland across islands and farmland.
The country has contributed very little to climate change. Emissions were about 0.6 t of CO₂ per person in 2024, compared with a world average of 4.7 t, and Bangladesh has produced about 0.1% of all the CO₂ emitted since 1750. It is nonetheless among the countries most exposed to rising seas, stronger cyclones and increasing salinity, which makes it a central example of climate justice.
Sources: Global Carbon Budget, via Our World in Data (2025); Wikipedia, "Climate change in Bangladesh" (2026).
The issue: deaths from cyclones and storm surges
On 12 November 1970 the Bhola cyclone struck what was then East Pakistan at high tide. A storm surge of about 10 m swept over the low islands of the delta, destroying villages and crops. At least 300,000 people died, and possibly 500,000, making it the deadliest tropical cyclone on record. There was almost no warning system, few places of safety and a slow relief effort, and anger at the government's response fed the political crisis that preceded Bangladesh's independence war of 1971.
The hazard has not gone away. Strong cyclones continue to strike every few years, and climate change is likely to make them more intense and to raise the sea level on which surges build. As the population of the coast has grown, more people and property are exposed than in 1970.
Sources: Wikipedia, "1970 Bhola cyclone" (2026).
Management and responses
Bangladesh has combined structural and non-structural adaptation over five decades, with support from the UNDP, the Red Crescent and other donors.
Early warning (non-structural): a Red Crescent warning system begun in 1966 became the Cyclone Preparedness Programme (CPP) in 1972, run jointly by the government and the Bangladesh Red Crescent Society. Trained village volunteers relay forecasts by radio, megaphone and door-to-door visits, and guide people to shelter.
Cyclone shelters (structural): raised concrete buildings that serve as schools or community centres in normal times. Over 200 were built in the 30 years after 1970, and about 1,800 multipurpose shelters stood along the coast by 2007.
Embankments and polders (structural): earth embankments protect low-lying farmland from tidal flooding and surges.
Coastal green belts (nature-based): planted mangroves and other trees, and the protection of the Sundarbans mangrove forest, slow storm surges before they reach villages.
Adapted farming (non-structural): salt-tolerant rice varieties and floating gardens help farmers cope with saltier soil and longer floods.
National planning: a NAPA in 2005, followed by a Climate Change Strategy and Action Plan and, in 2018, the Bangladesh Delta Plan 2100, prepared with the Netherlands to manage water, flooding and land over the rest of the century. About US$3 billion a year is now spent on adaptation and disaster management, 75% of it from domestic funds.
Sources: Wikipedia, "1970 Bhola cyclone", "Cyclone Sidr" and "Climate change in Bangladesh" (2026).
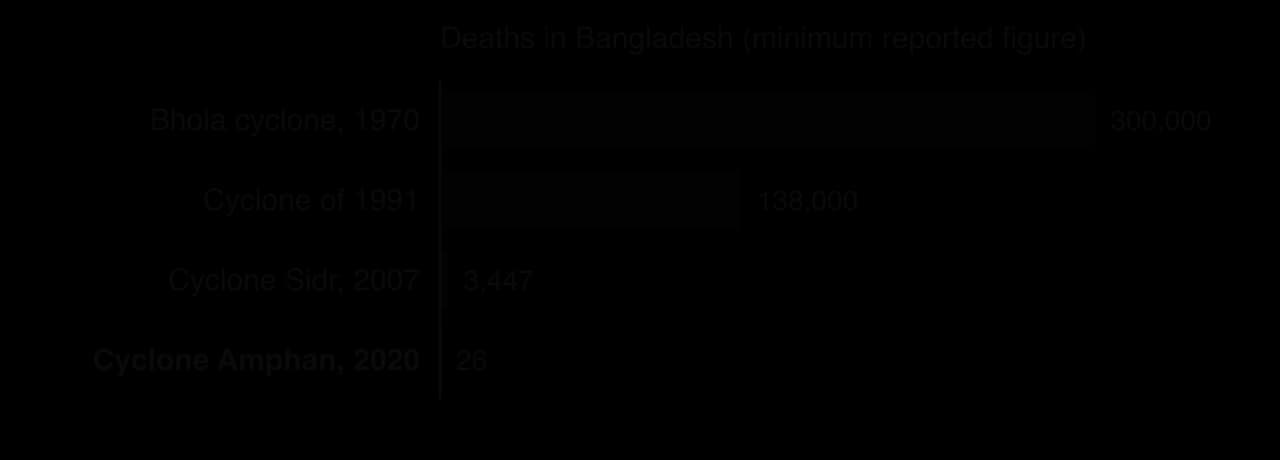
Data: deaths and evacuations in major cyclones
Cyclone | Deaths in Bangladesh | People in shelters or evacuated | Damage (US$) |
|---|---|---|---|
Bhola, 1970 | At least 300,000 (possibly 500,000) | Very few: almost no shelters or warnings | 86 million |
1991 cyclone | Over 138,000 | Over 350,000 moved to shelters or high ground after warnings 2–3 days ahead | About 1.5 billion |
Sidr, 2007 | At least 3,447 reported (estimates up to 10,000–15,000) | About 2 million in shelters; CPP volunteers evacuated at least 600,000 | 2.31 billion |
Amphan, 2020 | 26 | About 2.2 million evacuated; over 12,000 shelters opened | About 1.5 billion |
Sources: Wikipedia, "1970 Bhola cyclone", "Cyclone Sidr" and "Cyclone Amphan" (2026).
The pattern in the data is clear. The number of deaths fell from hundreds of thousands to a few dozen, while the number of people who reached safety rose from almost none to millions. During Cyclone Amphan in May 2020, schools and mosques were added as shelters, and occupancy was limited to a third of capacity because of COVID-19, yet the evacuation still worked. Damage to property, on the other hand, rose: there is now more to lose along the coast, and buildings, crops, fishing boats and embankments cannot be evacuated.
Evaluation
From the perspective of the national government and international donors, Bangladesh's preparedness is one of the world's great adaptation successes. Relatively cheap non-structural measures, especially warnings delivered by trusted local volunteers, have saved hundreds of thousands of lives. The CPP shows that adaptation depends on trained people and organisation as much as on buildings.
Coastal communities see a less complete success. Cyclone Amphan breached about 150 km of embankments and flooded around 100 villages; salt water flooded all 65 freshwater ponds in the Sundarbans. Sidr damaged about a quarter of the Sundarbans and destroyed rice crops weeks before harvest. Each storm leaves families without homes, land or livelihoods, and saltier soils and water push people to migrate: by 2013 an estimated 6.5 million people had been displaced by climate-related hazards, many to the slums of Dhaka. Women, who are mainly responsible for collecting water, bear much of the burden of salinised supplies.
Long-term limits remain. A sea-level rise of 1 m could cost Bangladesh 12–16% of its land, and by 2020 the Delta Plan was falling short of most of its first targets, leaving about 80 million people at risk of flooding against a goal of 60 million. From a climate justice perspective, a country that emitted a tiny share of the world's CO₂ is spending billions of dollars a year adapting to a problem caused mainly by others, which is why Bangladesh has been a leading voice for adaptation finance and a fund for loss and damage.
Perspective | View of the adaptation strategy |
|---|---|
National government and donors | A model of low-cost, life-saving adaptation that other countries copy |
Coastal farmers and fishers | Lives are saved, but livelihoods, land and fresh water are still lost |
Climate justice campaigners | Rich, high-emitting countries should pay much more of the cost |
Engineers and planners (technocentric) | Higher embankments, polders and the Delta Plan can secure the delta |
Ecocentric view | Protecting and restoring the Sundarbans mangroves gives cheaper, self-renewing protection |
What it shows
Bangladesh shows that adaptation can work even in a lower-middle-income country, and that non-structural measures such as warnings, volunteers and education can be as important as structural ones such as shelters and embankments. It also shows the limits of adaptation: it protects lives better than livelihoods, and it cannot keep pace with unlimited sea-level rise. Finally, it shows why mitigation by the largest emitters and international finance are needed alongside local adaptation, linking the case to state sovereignty, climate justice and the need for global action.
Sources: Wikipedia, "1970 Bhola cyclone", "Cyclone Sidr", "Cyclone Amphan" and "Climate change in Bangladesh" (2026); Global Carbon Budget (2025).
Economic, legal, industry and personal responses (HL only)
Responses to climate change are led by many kinds of actor. Governments can change prices and pass laws; companies can set goals and change how they produce; individuals can change what they buy and how they live. These responses work at different scales and reinforce or undermine one another.
Economic measures: putting a price on carbon
Greenhouse gas emissions are an externality: the emitter does not pay for the damage that climate change causes to others. Carbon pricing corrects this by making emitters pay for each tonne, either through a carbon tax (a fixed price, with the quantity of emissions left to the market) or through emissions trading (a fixed quantity, with the price left to the market).
The European Union Emissions Trading System (EU ETS), launched in 2005, was the world's first large emissions trading scheme. It covers power stations and heavy industry such as steel, cement and refineries, about 40% of the EU's greenhouse gas emissions. Each allowance permits one tonne of CO₂; the cap falls every year and is set to reach zero by 2039. Emissions from the covered power stations and factories fell by about 47% between 2005 and 2023.
The scheme's early years show how design matters. Too many free allowances were given out, so the price collapsed to about €0.10 per tonne in 2007 and to €2.81 in 2013, too low to change behaviour. Reforms, including a reserve that removes surplus allowances, pushed the price above €100 in early 2023. A second system covering buildings and road transport has been delayed to 2028, and the Carbon Border Adjustment Mechanism (from 2026) protects EU industry from imports made without a carbon price.
Sources: Wikipedia, "European Union Emissions Trading System" (2026).
Subsidies and tariffs are the other economic tools. Subsidies for wind and solar power helped bring down their costs as manufacturing expanded, and many governments subsidise electric vehicles, heat pumps and insulation. Subsidies can also work against climate goals: many countries still subsidise fossil fuels to keep energy cheap for consumers. Tariffs (taxes on imports) can protect a domestic clean-energy industry or, like the CBAM, put a carbon price on imports. The theory of these market-based instruments, and the polluter-pays principle, belongs to environmental economics.
Legislation: the UK Climate Change Act 2008
The United Kingdom's Climate Change Act, which received royal assent on 26 November 2008, was the first law of its kind to set a long-term, legally binding national emissions target. It originally required an 80% cut on 1990 levels by 2050; in June 2019 this was amended to net zero by 2050. The Act sets five-year carbon budgets that limit total emissions on the way, and created an independent Climate Change Committee to advise the government and report on progress.
Its impact has been substantial. UK CO₂ emissions fell by about 48% between 1990 and 2024, faster than in most other large economies, largely because coal was removed from electricity generation. Critics point out that the cuts so far have mostly come from the power sector, that emissions embodied in imports are not counted, and that the Committee has repeatedly warned that policies for transport, buildings and farming are not yet enough to meet later budgets. The Act therefore provides a framework and a target that courts and campaigners can use, while the cuts themselves depend on policies in each sector.
Sources: Wikipedia, "Climate Change Act 2008" (2026); Global Carbon Budget, via Our World in Data (2025).
Goal setting by industry: B Corps and company targets
To become a B Corp, a company must score at least 80 out of 200 on B Lab's impact assessment, write commitments to workers, communities and the environment into its legal documents, and recertify every three years. By March 2025 there were 9,576 certified B Corps in 102 countries. Patagonia, the outdoor clothing company, is a well-known example: it has given 1% of its sales to environmental groups since 1985, and in 2022 its founder transferred the company's ownership to a trust and a non-profit organisation so that its profits fund action on climate change.
Other companies set their own targets, such as switching to 100% renewable electricity or reaching net zero by a stated year. Such goals can drive real change in supply chains, but they are voluntary and can be used for greenwashing. In 2022, 30 certified B Corps petitioned against the certification of Nespresso, citing the low recycling rate of its aluminium coffee capsules, and some critics argue that certification lacks legal force.
Sources: Wikipedia, "B Corporation (certification)" and "Patagonia, Inc." (2026).
Personal life changes
Individuals can reduce their carbon footprint by using less energy (better insulation, lower heating, fewer flights), eating less red meat and dairy, wasting less food and buying fewer new goods. Individual choices matter most where they are widely copied, for example when early buyers of solar panels or electric cars help to create a market that lowers prices for everyone. Their direct impact is limited by the systems people live in: a person cannot take a train that does not exist or buy renewable electricity that is not supplied.
Response | Example | Impact | Limitation |
|---|---|---|---|
Economic | EU ETS (2005) | Emissions in covered sectors fell about 47% (2005–2023) | Weak early prices; carbon leakage risk |
Legislative | UK Climate Change Act (2008) | Binding net zero target; CO₂ fell about 48% since 1990 | Hard sectors lag; imported emissions not counted |
Industry goal setting | B Corp certification; Patagonia | Over 9,500 companies committed to standards | Voluntary; risk of greenwashing |
Personal | Less meat, energy and waste | Lower individual footprints; signals demand | Small alone; depends on available alternatives |
The UN and global climate strategy (HL only)
The United Nations provides the framework within which almost every country negotiates on climate. Three bodies work together: the UNFCCC sets the goal and the rules, the IPCC provides the scientific evidence, and the COP is where decisions are made.
The UNFCCC
The UNFCCC's ultimate objective, in its Article 2, is to stabilise greenhouse gas concentrations at a safe level, within a time frame that allows ecosystems to adapt naturally, protects food production and allows sustainable economic development.
stabilization of greenhouse gas concentrations in the atmosphere at a level that would prevent dangerous anthropogenic interference with the climate system
— United Nations Framework Convention on Climate Change, Article 2 (1992)
The Convention divides countries into Annex I (industrialised countries, expected to lead) and the rest, and is based on the principle of common but differentiated responsibilities. It has 198 parties and a secretariat in Bonn, Germany.
The IPCC does not carry out its own research. Thousands of scientists review the published literature and produce assessment reports, the most recent being the Sixth Assessment Report (2021–2023), and special reports on request, such as the 2018 report on warming of 1.5 °C requested by the UNFCCC. Governments approve the summaries line by line, which gives the reports great authority in negotiations but also means that the wording is sometimes cautious.
COP summits and their outcomes
COP | Year and place | Main outcome |
|---|---|---|
COP3 | 1997, Kyoto | Kyoto Protocol: binding targets for developed countries |
COP15 | 2009, Copenhagen | No binding deal; a political accord only "noted" |
COP21 | 2015, Paris | Paris Agreement: well below 2 °C, pursue 1.5 °C; NDCs from every country |
COP26 | 2021, Glasgow | Glasgow Climate Pact: "phase down" coal power |
COP27 | 2022, Sharm el-Sheikh | Agreement to set up a fund for loss and damage |
COP28 | 2023, Dubai | First global stocktake; call for "transitioning away from fossil fuels in energy systems" and tripling renewable capacity by 2030; loss and damage fund made operational (US$430 million pledged on the first day) |
COP29 | 2024, Baku | New finance goal: developed countries to provide US$300 billion a year by 2035; rules for international carbon markets |
COP30 | 2025, Belém | Adaptation finance to be tripled by 2035; Just Transition Mechanism; 59 adaptation indicators; no fossil fuel phase-out in the decision |
Sources: Wikipedia, "United Nations Climate Change Conference" and the articles on the 2023, 2024 and 2025 conferences (2026).
The most recent summit, COP30, was held in Belém, at the edge of the Brazilian Amazon, from 10 to 21 November 2025, with about 56,000 registered delegates, the second-largest COP after COP28.
The final decision called for adaptation finance to be tripled by 2035, launched a Just Transition Mechanism to support workers and communities moving away from fossil fuels, and adopted 59 indicators to track progress on adaptation. More than 80 countries pushed for a roadmap to phase out fossil fuels, but oil-producing countries blocked it, so the Brazilian presidency announced voluntary roadmaps for the fossil fuel transition and for halting deforestation outside the formal text. Brazil also launched the Tropical Forest Forever Facility, a planned US$125 billion fund to reward countries for keeping tropical forests standing.
For the first time, the United States sent no official delegation to a COP. The UN estimated that the NDCs submitted by November 2025 would cut global emissions by about 12% by 2035 compared with 2019, far less than the roughly 60% cut needed to limit warming to 1.5 °C. COP31 is due to be held in Antalya, Türkiye, from 9 to 20 November 2026.
Sources: Wikipedia, "2025 United Nations Climate Change Conference" (2026).
Loss and damage finance was a long-standing demand of vulnerable countries. The floods that covered large parts of Pakistan in 2022 strengthened their case at COP27 that year. The fund is still small compared with the damages, and contributions are voluntary.
The Kigali Amendment
The Montreal Protocol (1987) phased out ozone-depleting substances such as CFCs. Many were replaced by hydrofluorocarbons (HFCs), which contain no chlorine and so do not damage the ozone layer, but which are powerful greenhouse gases, hundreds to thousands of times more effective than the same mass of CO₂ at trapping heat. Their use was growing rapidly with the spread of air conditioning and refrigeration.
The Kigali Amendment, agreed in Kigali, Rwanda, on 15 October 2016 and in force from 1 January 2019, added HFCs to the Montreal Protocol. Developed countries began cutting HFC use in 2019 and must reach 15% of their baseline by 2036; most developing countries froze their use in 2024 and some hotter countries in 2028, with cuts of 80–85% by 2045–2047. The phase-down could avoid up to about 0.5 °C of warming by 2100, and because it uses the Montreal Protocol's proven system of trade controls and funding, it is often cited as one of the most effective climate measures yet agreed.
Sources: UNEP Ozone Secretariat, "The Kigali Amendment" (2016 text); Wikipedia, "Kigali Amendment" (2026).
IPCC emissions scenarios (HL only)
Future warming depends mainly on future emissions, which depend on human choices about population, the economy, technology and policy. Because these cannot be predicted, the IPCC uses a set of emissions scenarios: internally consistent stories of how the world might develop, each run through climate models to project the warming that would follow.
The Sixth Assessment Report combines the five Shared Socioeconomic Pathways (SSP1 sustainability; SSP2 middle of the road; SSP3 regional rivalry; SSP4 inequality; SSP5 fossil-fuelled development) with a level of radiative forcing in 2100. The number after the dash is that forcing in watts per square metre: SSP1-1.9 has very low emissions and SSP5-8.5 very high emissions.
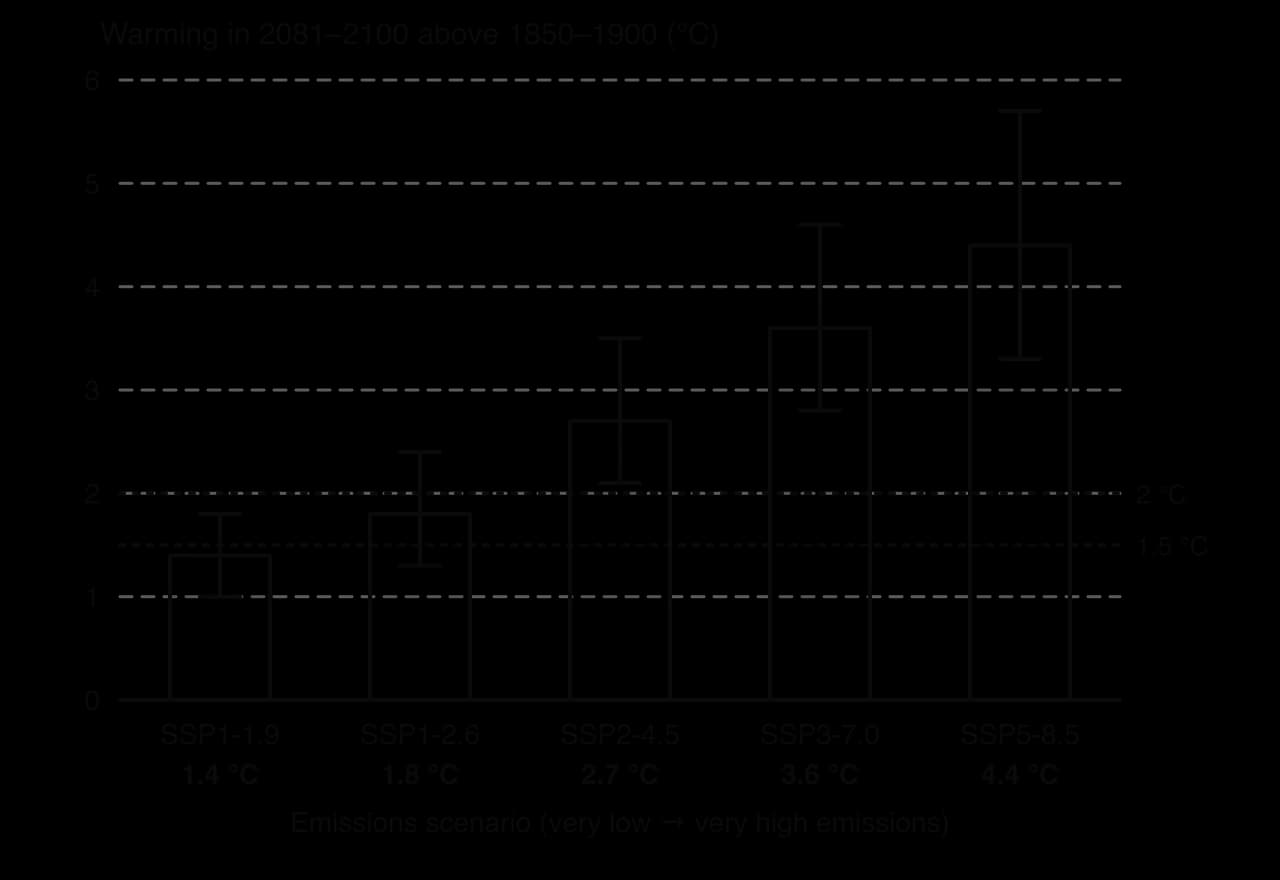
Scenario | Emissions | Best estimate warming, 2081–2100 (°C) | Very likely range (°C) |
|---|---|---|---|
SSP1-1.9 | Very low: CO₂ falls to net zero around 2050, then net negative | 1.4 | 1.0–1.8 |
SSP1-2.6 | Low: CO₂ falls to net zero after 2050, then net negative | 1.8 | 1.3–2.4 |
SSP2-4.5 | Intermediate: CO₂ stays around current levels until mid-century | 2.7 | 2.1–3.5 |
SSP3-7.0 | High: CO₂ roughly doubles from current levels by 2100 | 3.6 | 2.8–4.6 |
SSP5-8.5 | Very high: CO₂ roughly doubles from current levels by 2050 | 4.4 | 3.3–5.7 |
Sources: IPCC AR6 WGI Summary for Policymakers (2021); Wikipedia, "Shared Socioeconomic Pathways" (2026).
The scenarios have clear implications. Keeping close to 1.5 °C requires CO₂ emissions to reach net zero around 2050, which means roughly halving them between 2019 and 2030. Current pledges place the world nearer the middle scenarios. The scenarios are models, so they simplify reality: they are not predictions, and none is assigned a probability. Some researchers argue that SSP5-8.5 is now unlikely because coal use has not grown as it assumed, while others warn that the low scenarios depend on very large amounts of CO₂ removal that has not yet been shown to work at scale.
Technology for mitigation and smart cities (HL only)
Smart city technology is "socially embedded": it changes everyday choices. Apps can show drivers the nearest free electric-vehicle charging point or the nearest recycling centre, sensors can dim street lights when streets are empty, and smart meters let households see and shift their electricity use to times when renewable power is plentiful.
Songdo International Business District in South Korea, built on reclaimed land near Incheon since 2003, was designed as a smart city from the start. Computers are built into homes, offices and streets as part of a city-wide network. Household waste is sucked through underground pipes to a central collection point, so there are no rubbish trucks or street-corner bins; the city has about 25 km of cycle paths, charging stations for electric vehicles, over 40% of its area as green space and over 100 buildings certified as green.
About 167,000 people lived there in 2020. Critics argue that the city is designed around cars and that many of its sustainability claims are exaggerated, and building a new city from scratch has a large carbon cost of its own.
Sources: Wikipedia, "Songdo International Business District" (2026).
Universities and their spin-off companies develop much of the new technology. Climeworks, the direct air capture company, began in 2009 as a spin-off from ETH Zurich, a Swiss university, and its plants in Iceland use geothermal energy and store CO₂ with the Icelandic company Carbfix, which turns it into rock. Such technologies still need to become far cheaper and larger before they make a measurable difference, and an analysis published in 2025 found that the Icelandic plants had captured only a fraction of their stated capacity.
Sources: Wikipedia, "Climeworks" (2026).
Geoengineering (HL only)
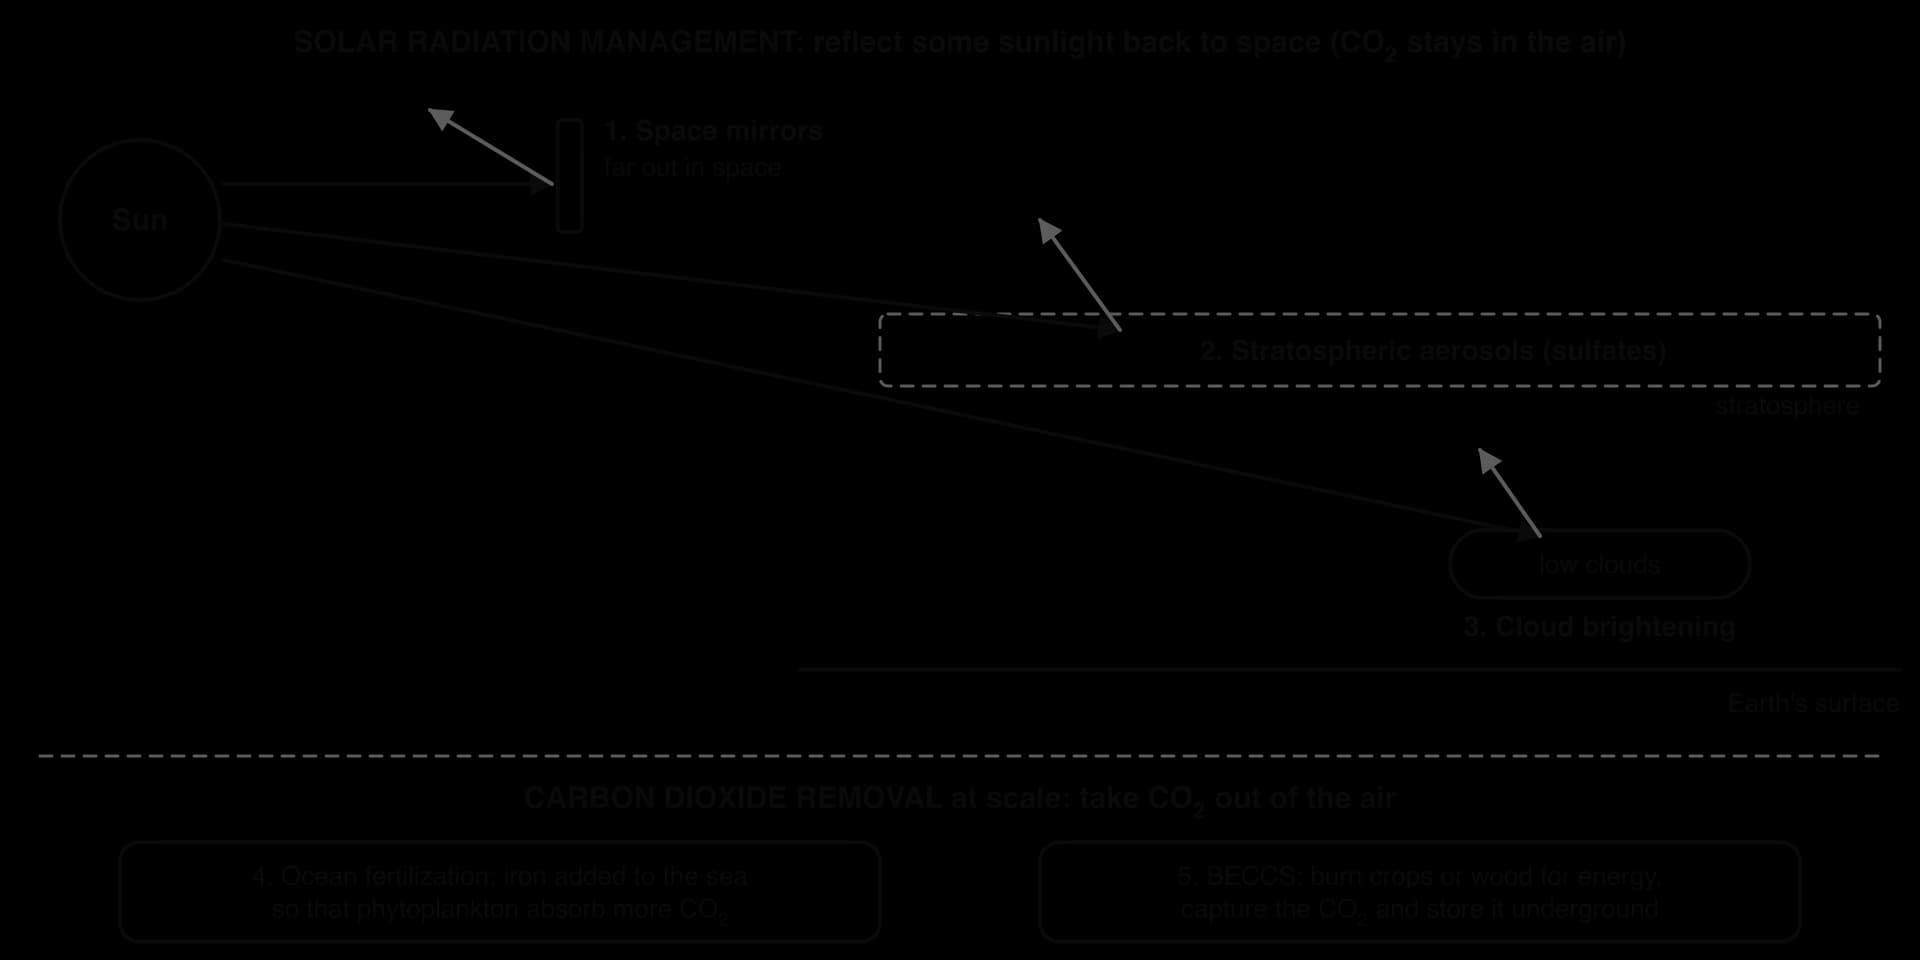
Geoengineering proposals fall into two groups. Solar radiation management reduces the amount of sunlight absorbed by the Earth, which lowers temperatures within months or years but leaves the extra CO₂ in the air. Carbon dioxide removal at planetary scale takes CO₂ back out of the atmosphere, which is slower but addresses the cause of warming more directly.
Solar radiation management
Stratospheric aerosol injection: spraying sulfate particles into the stratosphere to reflect sunlight. The natural model is the eruption of Mount Pinatubo in 1991, whose sulfate aerosols cooled global temperatures by about 0.5 °C for about two years. One study estimated the cost at about US$18 billion a year for each degree of warming avoided, cheap compared with the damage from warming, which is part of the concern: a single country could do it alone.
Space mirrors: reflectors or sunshades placed in space between the Sun and the Earth. They would avoid chemical side effects, but the scale and cost of launching them make them speculative.
Cloud brightening and cloud seeding: spraying fine sea salt into low marine clouds to make them whiter and more reflective. Cloud seeding to increase rainfall is already used locally for water supply, but brightening clouds over large ocean areas has not been tested at scale.
Large-scale carbon dioxide removal
Ocean fertilisation: adding iron to parts of the ocean where its shortage limits phytoplankton growth, so that blooms absorb CO₂ and some of the carbon sinks to the deep ocean. Thirteen major experiments between 1990 and 2012 all increased phytoplankton growth, but the amount of carbon that stayed in the deep ocean varied greatly. In July 2012 the Haida Salmon Restoration Corporation dispersed about 100 t of iron sulfate in the Pacific west of Haida Gwaii, Canada, intending to boost salmon; critics called it a breach of international moratoria, and in 2013 the London Protocol was amended to allow only legitimate scientific research.
Bioenergy with carbon capture and storage (BECCS): growing crops or trees, burning them for energy and capturing and storing the CO₂, so that the carbon taken up by the plants ends up underground. An ethanol plant in Decatur, Illinois, can capture over a million tonnes a year. At the scale imagined in some scenarios, removing 10 billion tonnes of CO₂ a year would need over 300 million hectares of land, an area larger than India, competing with food production and natural habitats.
Sources: Wikipedia, "Stratospheric aerosol injection", "Iron fertilization" and "Bioenergy with carbon capture and storage" (2026).
 YouTube
Arguments for and against geoengineering
Arguments for | Arguments against |
|---|---|
Solar methods could cool the planet within a few years, buying time if a tipping point approaches | Treats the symptom: CO₂ keeps rising, so ocean acidification continues |
Could be cheap compared with the damage from warming | Uncertain side effects, for example on rainfall and monsoons, which could harm some regions while helping others |
Removal methods address the cause and can balance hard-to-cut emissions | If aerosol injection stopped suddenly, the hidden warming would return within years (termination shock) |
Research could show whether the risks are acceptable before an emergency | No convincing large-scale trials; models disagree |
Political hesitancy and potential geopolitical conflict: who controls the global thermostat? | |
Moral hazard: the promise of a technical fix may reduce pressure to cut emissions |
Perspectives on geoengineering are sharply divided. A technocentric view sees it as an essential back-up or a way of buying time. An ecocentric view sees deliberate interference with the whole climate system as reckless, and points out that ecosystems would face new, unpredictable changes. Countries in the monsoon regions of Asia and Africa have particular reason to fear changes in rainfall caused by decisions taken elsewhere. Because one country could act alone, many experts argue that international rules are needed before any large deployment.
Barriers to climate action (HL only)
The science of climate change and many of the solutions are well understood, yet emissions are still rising. Several kinds of barrier explain the gap between knowledge and action.
Lack of belief that climate change is serious. Climate scepticism ranges from denying that warming is happening, to accepting warming but denying that humans cause it, to accepting both but claiming that it is not serious or that action is too costly. Even where most people accept the science, many underestimate how urgent it is or how much others support action.
Lack of money or planning. Low-income countries often lack the funds and skilled staff to plan and build adaptation or new energy systems, and promises of international finance have repeatedly been late or smaller than needed.
Lack of leadership. Action can stall when political leaders, transnational companies, NGOs or individuals wait for others to move first. Electoral cycles of four or five years reward short-term decisions, while the benefits of mitigation arrive over decades.
International inequalities. Economies that earn much of their income from fossil fuels, such as Qatar and Saudi Arabia, lose most from a rapid transition; low-income countries argue that they should not have to give up cheap energy before rich countries have cut their own emissions.
Differences in perspective. Younger people, who will live with the consequences longest, tend to see action as more urgent than older people; coastal and low-lying communities see sea-level rise as an immediate threat, while inland and upland communities may see it as distant.
Some barriers are deliberately created. Industries that profit from fossil fuels have funded campaigns to cast doubt on climate science, which delayed action in some countries for decades. Others are structural: many people live in places where a car is the only practical way to travel, or where cheap electricity still comes from coal.
Stakeholders and perspectives on climate action (HL only)
Stakeholders who shape perspectives
People form their views on climate change from the people and organisations around them. A stakeholder who is trusted can change a person's perspective far more than a statistic can.
Stakeholder | Example | How it influences perspectives |
|---|---|---|
Charismatic individual | Greta Thunberg began a school strike outside the Swedish parliament on 20 August 2018; the Fridays for Future strikes on 20 September 2019 involved over 4 million people | Personal story and moral urgency; gives young people a sense of agency |
Local community group | A neighbourhood group that installs shared solar panels or campaigns for safe cycle routes | Shows that action is practical; builds trust through people people know |
NGO | Environmental NGOs such as Greenpeace or WWF; aid NGOs such as the Red Crescent | Campaigns, research reports and legal action; links distant impacts to local choices |
Media | News coverage of floods and heatwaves; social media campaigns | Sets the agenda; can inform or spread misinformation and false balance |
Educational institution | Schools and universities teaching climate science; university research | Gives reliable knowledge; shapes the values of the next generation |
Sources: Wikipedia, "School Strike for Climate" (2026).
Why perspectives differ
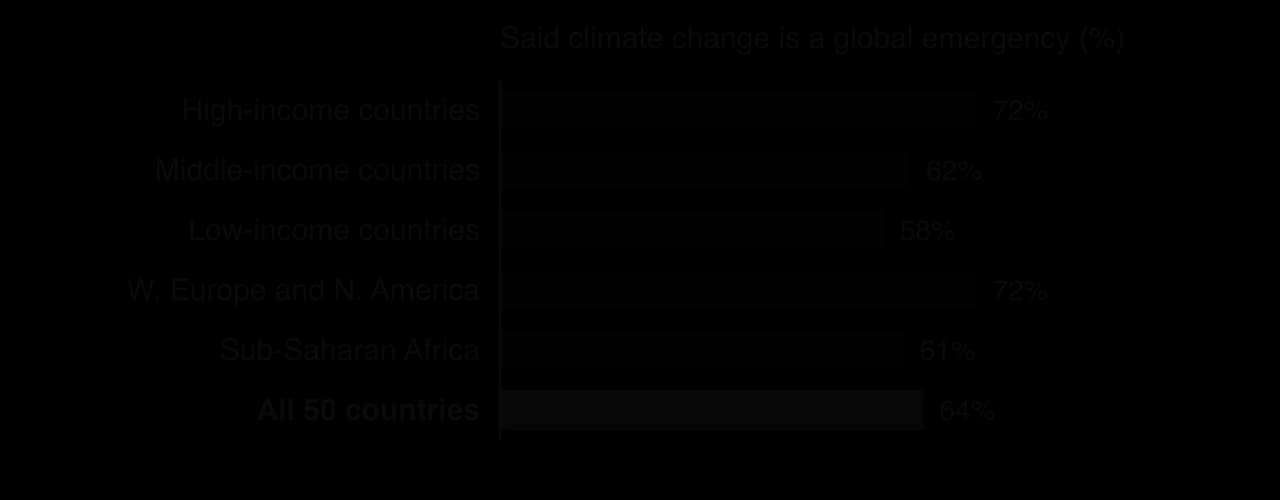
Views on the necessity, practicality and urgency of action differ because people experience different costs, benefits and risks. In the UNDP's 2021 Peoples' Climate Vote, the largest survey of public opinion on climate change, 64% of 1.2 million respondents in 50 countries said that climate change was a global emergency. The share was higher in high-income countries than in low-income ones, possibly because people in poorer countries face more immediate problems, such as poverty and health, and have had less access to information about climate change.
Groups compared | Typical differences in perspective |
|---|---|
Younger and older people | Young people will face more warming and often see action as urgent; in a 2021 survey of 10,000 young people in 10 countries, almost 60% were very or extremely worried. Older people may weigh present costs and lifestyles more heavily. |
Developed and developing societies | Developed countries emphasise cutting emissions everywhere; developing countries emphasise historical responsibility, the right to development and the need for finance. |
Coastal and inland communities | Low-lying coasts and small islands see sea-level rise as a threat to their existence; inland and upland communities may feel less immediate risk. |
Fossil fuel economies and others | Countries and regions that depend on coal, oil and gas income or jobs see rapid decarbonisation as an economic threat; importers of fossil fuels see renewables as a gain in energy security. |
Sources: Wikipedia, "Public opinion on climate change" and "Eco-anxiety" (2026).
These perspectives connect to environmental value systems. An ecocentric person may see urgent action as a moral duty to the natural world and to future generations; a technocentric person may be confident that innovation will solve the problem in time; an anthropocentric person may weigh the costs and benefits for people, now and in future. The ethical questions behind these positions, such as what present generations owe future ones, are central to environmental ethics.
The atmosphere as a global commons (HL only)
The tragedy of the commons describes how a shared resource that no one owns can be overused when each user gains all the benefit of using more while the cost is shared by everyone. The atmosphere is the largest commons of all: every country uses it as a free dump for greenhouse gases.
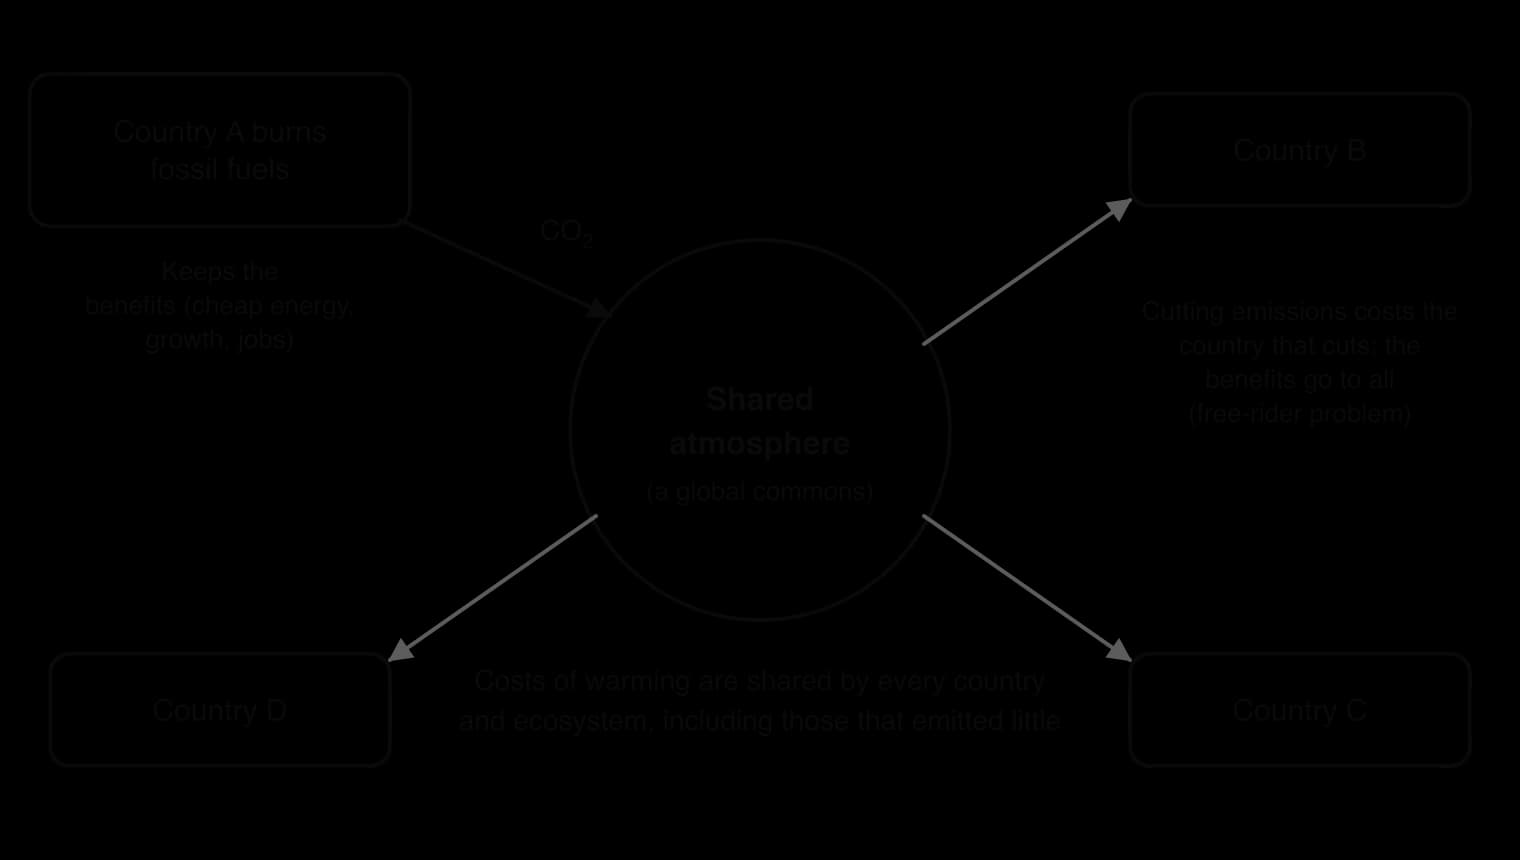
When one nation burns fossil fuels, it keeps the benefits (cheap energy, industry, jobs) but the costs of the resulting warming are shared by all nations and ecosystems, including those that emitted little. The reverse is also true. If one nation pays to restore the atmosphere, for example by building carbon capture and storage, it bears the whole cost while every nation shares the benefit. Each country is therefore tempted to be a free rider, letting others cut emissions while it continues to emit.
Cumulative emissions show how unevenly the commons has been used. A few industrialised countries emitted most of the roughly 1.85 trillion tonnes of CO₂ released from fossil fuels and industry between 1750 and 2024, while the countries most exposed to the resulting harm, such as Bangladesh, emitted a tiny share.
Sources: Global Carbon Budget, via Our World in Data, "Cumulative CO₂ emissions" (2025).
Can the commons be managed?
Garrett Hardin, who popularised the idea in 1968, argued that a commons can be protected only by regulation or by dividing it into private property. Neither is easy for the atmosphere: there is no world government to regulate it, and it cannot be fenced. Climate agreements are attempts to create rules among sovereign states, which is why international cooperation on an unprecedented scale is needed.
Elinor Ostrom, who received the Nobel Prize in Economic Sciences in 2009, showed that communities often manage local commons well when they have clear boundaries, trust, their own rules and penalties for overuse. These conditions are hard to meet for a resource shared by eight billion people, but they suggest why action at many scales (cities, regions, companies and coalitions of countries) can build trust and momentum alongside global treaties. Carbon pricing, emissions trading and cross-border carbon taxes are ways of making emitters pay for their use of the commons, a question explored in environmental economics.
Sources: Wikipedia, "Tragedy of the commons" (2026).
Why is the climate commons harder to manage than a fishery?
A fishery has a limited number of users, the decline of fish is visible within a few years, and the users who overfish also suffer the losses. With the atmosphere, there are billions of users, the damage appears decades after the emissions because of time lags, and the worst impacts fall on people far away or not yet born. Each of these differences weakens the incentive to cooperate.
Exam practice
Mitigation and adaptation appear in every paper. Paper 2 Section A asks for definitions, examples and short explanations; Paper 1 asks you to apply the ideas to an unfamiliar place and its data; and Paper 2 Section B essays ask you to evaluate strategies and weigh perspectives. Questions often check that you can tell mitigation from adaptation and structural from non-structural measures.
Paper 2 Section A-style questions
Questions on international action reward reasons that are developed with a named example, not just listed.
Short "explain" questions on classification need both the category and the reason for it.
Paper 1-style data question
Resource (hypothetical data): The coastal town of Marina (fictional) lies on a low delta. Its council is considering three options to deal with more frequent storm surges.
Option | Description | Cost (US$ million) | Expected reduction in flood damage (%) |
|---|---|---|---|
A | Raise the existing sea wall by 1.5 m | 120 | 70 |
B | Ban new building in the lowest zone and fund early warnings and shelters | 15 | 40 |
C | Replant 800 ha of mangroves along the shore | 25 | 35 |
Paper 2 Section B-style essay
HL questions
Questions on the most recent COP change every year, so check the latest outcomes before the exam.
Summary
Mitigation reduces the causes of climate change; adaptation reduces its harmful effects and uses any opportunities. Both are needed.
State sovereignty means global action depends on negotiated agreements: the UNFCCC (1992), the Kyoto Protocol (1997) and the Paris Agreement (2015) with its NDCs; cross-border carbon taxes such as the EU CBAM protect countries that act.
Decarbonisation replaces CO₂-emitting energy with renewables; carbon neutrality and net zero targets range from 2035 (Finland) to 2070 (India).
Mitigation strategies reduce the warming process (cool roofs, geoengineering), reduce greenhouse gas production (efficiency, renewables, diet, farming, carbon tax) or remove CO₂ (afforestation, rewilding, CCS, DAC).
Adaptation is structural (flood defences, shelters, desalination) or non-structural (zoning, building codes, warnings, adapted crops, vaccination).
NAPAs and other adaptation plans, supported by the UNDP, rank urgent local priorities; Bangladesh cut cyclone deaths from at least 300,000 in 1970 to 26 in 2020, though damage and displacement continue.
Economic measures (EU ETS), legislation (UK Climate Change Act 2008), industry goals (B Corps) and personal changes all contribute, with different strengths and limits. (HL)
The UNFCCC, IPCC and annual COPs lead global strategy; COP30 (Belém, 2025) tripled the adaptation finance goal but agreed no fossil fuel phase-out; the Kigali Amendment (2016) phases down HFCs. (HL)
The IPCC's five SSP scenarios project 1.4–4.4 °C of warming by 2081–2100, depending on emissions. (HL)
Smart-city and university-led technologies can aid mitigation; geoengineering treats symptoms and carries high risks. (HL)
Barriers include climate scepticism, lack of finance and leadership, inequalities and differing perspectives shaped by stakeholders. (HL)
The atmosphere is a global commons: emitters keep the benefits and share the costs, so unprecedented cooperation is needed. (HL)
Self-check
- To do:
I can distinguish between mitigation and adaptation and give named examples of each.
- To do:
I can explain how state sovereignty makes international cooperation necessary, and outline the UNFCCC, Kyoto, Paris and cross-border carbon taxes.
- To do:
I can define decarbonisation, carbon neutrality and net zero, and compare countries' target dates.
- To do:
I can describe and evaluate two examples from each of the three categories of mitigation.
- To do:
I can describe and evaluate two structural and two non-structural adaptation strategies.
- To do:
I can outline how NAPAs and other adaptation plans are developed, and use the Bangladesh case study.
- To do:
I can design a survey of attitudes to a proposed climate solution.
- To do:
I can evaluate economic, legislative, industry and personal responses with one example of each. (HL)
- To do:
I can outline the roles of the UNFCCC, IPCC and COPs, the outcomes of COP30 and the Kigali Amendment. (HL)
- To do:
I can interpret a graph of the IPCC SSP scenarios. (HL)
- To do:
I can evaluate geoengineering and smart-city technology. (HL)
- To do:
I can discuss barriers, stakeholders, perspectives and the atmosphere as a commons. (HL)
Flashcards for 6.3
The official deck for this part of the syllabus.
6.3 Climate change—mitigation and adaptation · front
What is climate change mitigation?
6.3 Climate change—mitigation and adaptation · front
What is climate change adaptation?
- 6.3 Climate change—mitigation and adaptation244 cards
Carry on with 6.3 in Augment
With a free account, Augment remembers where you stopped and what you have practiced.