Notes on 6.2 Climate change—causes and impacts
Learning objectives
Outline how climate is described for an area and how it results from physical processes in the atmosphere.
Describe the rise in atmospheric carbon dioxide since the Industrial Revolution and explain why emissions accelerated after 1950.
Interpret ice-core, tree-ring and sediment evidence for the correlation between carbon dioxide and global temperature over the last 800,000 years.
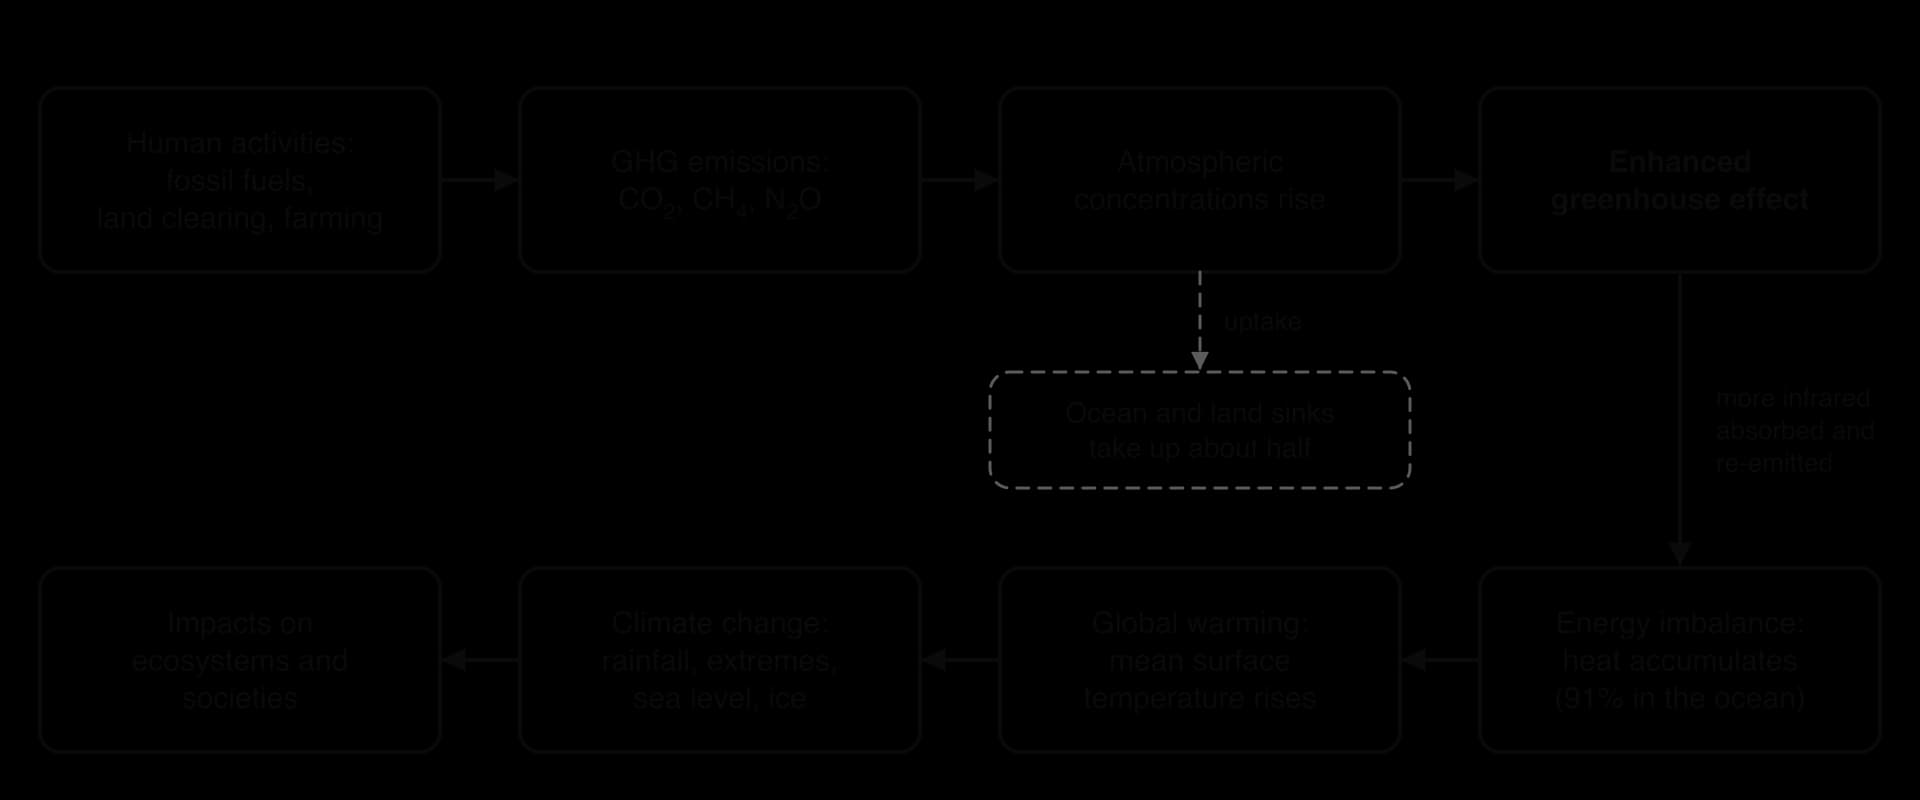
Explain how anthropogenic greenhouse gas emissions enhance the greenhouse effect and lead to global warming and climate change.
Discuss the impacts of climate change on ecosystems and their resilience, from local to global scale, using named examples.
Discuss the impacts of climate change on human societies and why resilience differs between places and socio-economic groups.
Construct systems diagrams of the global energy balance and of positive and negative climate feedback loops.
Evaluate the evidence that the planetary boundary for climate change has been crossed.
Analyse how different factors and value systems shape perspectives on climate change.
Evaluate climate models, the role of hindcasting and the use of emissions scenarios to project impacts. (HL)
Explain climate thresholds, tipping points and tipping cascades using named tipping elements. (HL)
Evaluate the responsibility and vulnerability of different countries and the implications for climate justice. (HL)
Introduction
Climate change is the long-term shift in temperature, rainfall, ice cover, sea level and extreme weather that follows from human emissions of greenhouse gases. It already affects every ecosystem and society on Earth: in 2024 the global mean surface temperature was about 1.55 °C above its 1850–1900 average, the highest in the instrumental record.
The topic draws on all three foundation ideas of the course. The atmosphere, oceans, ice and living things form one Earth system with storages, flows and feedback loops; people disagree about the problem because they hold different perspectives; and the most affected communities are often those that did least to cause it, which makes climate change a central question of sustainability and justice.
Climate as the product of atmospheric processes
Weather is the state of the atmosphere at a particular place and time, while climate is the typical pattern of weather in an area, usually averaged over about 30 years. A single cold week is an event in the weather, while a change in climate can only be identified from decades of records.
The climate of an area is described mainly by two variables and how they change through the year: temperature and precipitation. A climate graph shows both, month by month, and its shape identifies the climate type. Tropical rainforest has high, steady temperatures with rain in every month; a Mediterranean climate has hot, dry summers and mild, wet winters; a tundra climate has a very short cool summer and a long winter far below freezing.
These patterns result from physical processes in the atmosphere. The equator receives more solar energy per square metre than the poles, so air rises, cools and drops its moisture in the tropics and sinks in the subtropics, producing deserts at about 30° north and south. Global circulation cells, ocean currents, distance from the sea, altitude and the direction of prevailing winds then modify the pattern locally. Any change in the energy entering or leaving the system changes these processes, and therefore changes climate.
Rising carbon dioxide since the Industrial Revolution
Before about 1750, the concentration of carbon dioxide in the atmosphere had stayed close to 280 parts per million (ppm) for several thousand years. Natural flows of carbon between the atmosphere, oceans, soils and living things were roughly in balance, so the atmospheric store was close to a steady-state equilibrium.
The Industrial Revolution began in Britain in the late 18th century and spread to the rest of Europe and North America in the 19th. Coal replaced wood, water and muscle as the main source of energy, first for steam engines and later for electricity and steel. Burning coal, and later oil and gas, transfers carbon that had been locked in the lithosphere for millions of years into the atmosphere as CO₂ within a few decades.
Why emissions accelerated after 1950
Emissions grew slowly through the 19th century and then rose much faster in the second half of the 20th. World emissions from fossil fuels and industry were about 5.9 billion tonnes of CO₂ in 1950 and 38.6 billion tonnes in 2024, more than six times higher. Several linked factors drove the acceleration:
Spreading industrialisation: after 1950, industrial growth spread from Europe and North America to Japan, the Soviet Union and later China, India, Brazil and other emerging economies.
Population growth: world population rose from about 2.5 billion in 1950 to over 8 billion by the 2020s, raising demand for energy, food and materials.
Rising consumption per person: cars, air travel, electricity in the home, meat-rich diets and more manufactured goods all need fossil energy.
Cheap oil and gas: abundant oil and gas after the Second World War made energy cheap and supported global trade and suburban growth.
Land-use change: clearing forests for farms and pasture releases carbon stored in trees and soils.
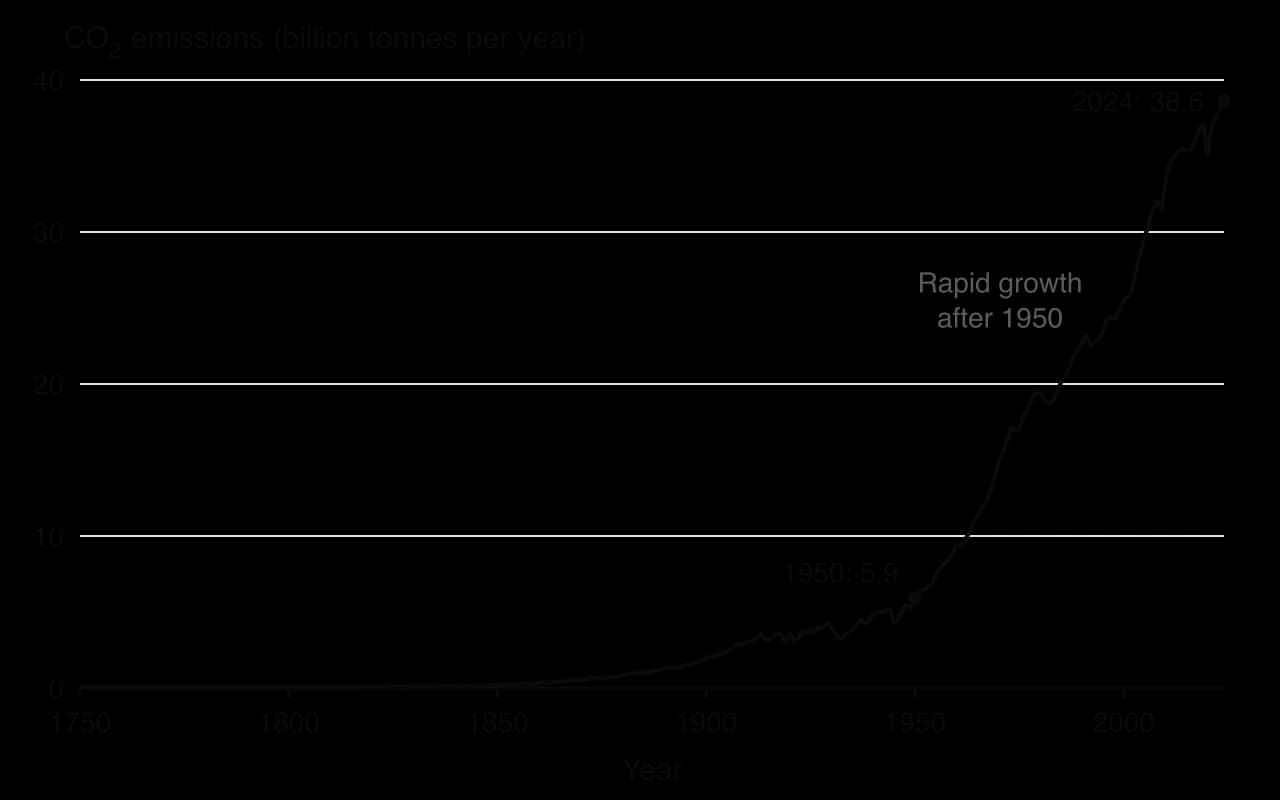
The emissions curve dips only briefly during global recessions, such as in 2009 and in 2020 during the COVID-19 pandemic, before recovering. This shows how closely emissions have been tied to economic activity. In 2024, China emitted about 32% of the world total, the USA about 13% and India about 8%, while many low-income countries each emitted well under 1%.
Sources: Global Carbon Project via Our World in Data (2025); UN DESA World Population Prospects.
The Keeling curve
Direct, continuous measurement of atmospheric CO₂ began in March 1958 at the Mauna Loa Observatory in Hawaii, about 3,400 m up the northern slope of the Mauna Loa volcano and far from local sources of pollution. The record was started by the American scientist Charles David Keeling of the Scripps Institution of Oceanography and is now kept by both Scripps and the US National Oceanic and Atmospheric Administration (NOAA).
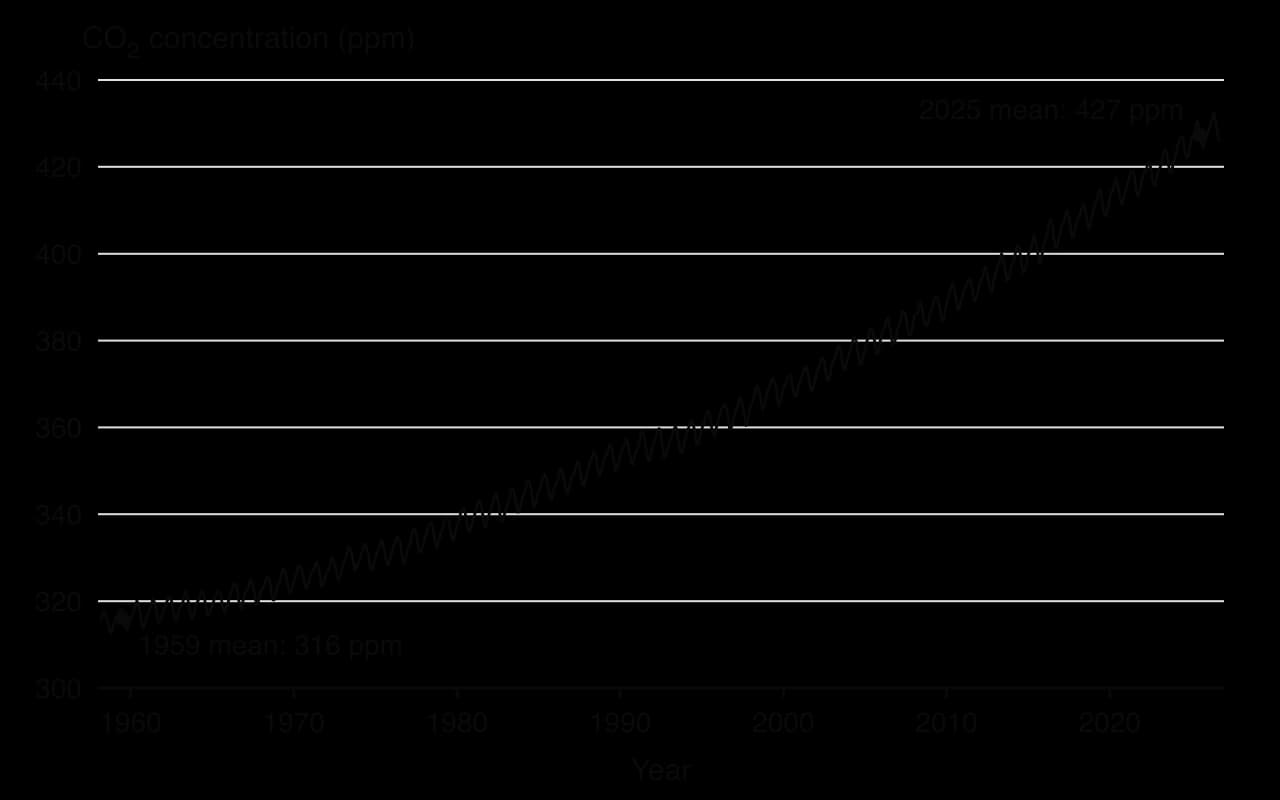
The Keeling curve has two features. The first is the seasonal oscillation: each year the concentration falls from about May to September and rises again through the northern winter. Most of the world's land, and therefore most of its vegetation, is in the Northern Hemisphere; in its summer, photosynthesis removes more CO₂ than cellular respiration and decomposition release, and in its winter the balance reverses.
The second feature is the long-term trend. Annual mean CO₂ at Mauna Loa rose from 315.98 ppm in 1959 to 427.35 ppm in 2025. The rate of increase has also grown, from under 1 ppm per year in the early 1960s to between 2 and 3.5 ppm per year in the 2020s. Measurements at stations around the world, including the South Pole, show the same rise, so it is a global change rather than a local one.
Sources: NOAA Global Monitoring Laboratory, Mauna Loa annual and monthly means (2026).
Evidence from the past: ice cores, tree rings and sediments
Thermometers have been used widely only since the mid-19th century, and continuous CO₂ measurements began in 1958. To see how climate behaved before people changed the atmosphere, scientists use proxy data: natural records that preserve a signal of past conditions.
Ice cores
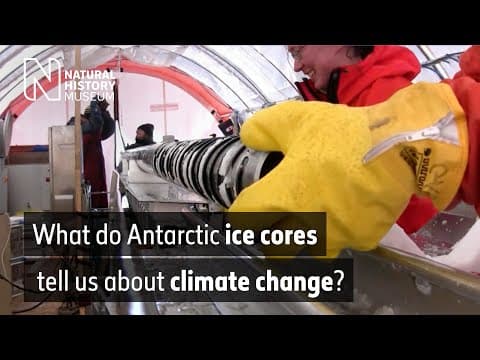
Snow that falls on the Antarctic and Greenland ice sheets is slowly buried and compressed into ice, trapping tiny bubbles of air. Each year forms a new layer, so a vertical cylinder of ice drilled from the surface downwards is a timeline. The deepest Antarctic cores, such as the European Project for Ice Coring in Antarctica (EPICA) core from Dome C, reach ice about 800,000 years old.
Two kinds of measurement come from the same core. The air bubbles are analysed directly for CO₂ and methane, giving the past composition of the atmosphere. The ice itself records temperature through the ratio of heavy to light isotopes of hydrogen and oxygen in the water: colder air produces snow with a lower proportion of the heavy isotopes. Dust, volcanic ash and sea salt in the layers add further information about winds, eruptions and sea ice.
 YouTube
Tree rings and sediments
Dendrochronology uses the annual growth rings of trees. In a warm, wet year a tree adds a wide ring; in a cold or dry year the ring is narrow. Matching the ring patterns of living trees with those of old timber and preserved logs extends records back thousands of years, and each ring can be dated to an exact calendar year.
Deposited sediments build up layer by layer on lake beds, in peat bogs and on the ocean floor. Pollen grains preserved in lake and peat sediments show which plants grew nearby, and therefore whether the climate was warm enough for forest or cold enough only for tundra. Ocean sediments contain the shells of tiny plankton whose chemistry and species mix depend on the temperature of the water they lived in.
Proxy | What is measured | What it records | Typical time span |
|---|---|---|---|
Ice cores | CO₂ and CH₄ in air bubbles; isotopes in the ice; dust and ash | Atmospheric composition and local temperature, year by year near the top | Up to about 800,000 years (Antarctica) |
Tree rings | Width and density of annual rings | Growing-season temperature and rainfall at one site | Hundreds to about 10,000 years |
Lake and peat sediments | Pollen types and amounts in each layer | Vegetation, and so the regional climate | Thousands to tens of thousands of years |
Ocean sediments | Shells of plankton: chemistry and species present | Ocean temperature and global ice volume | Millions of years |
What 800,000 years of ice shows
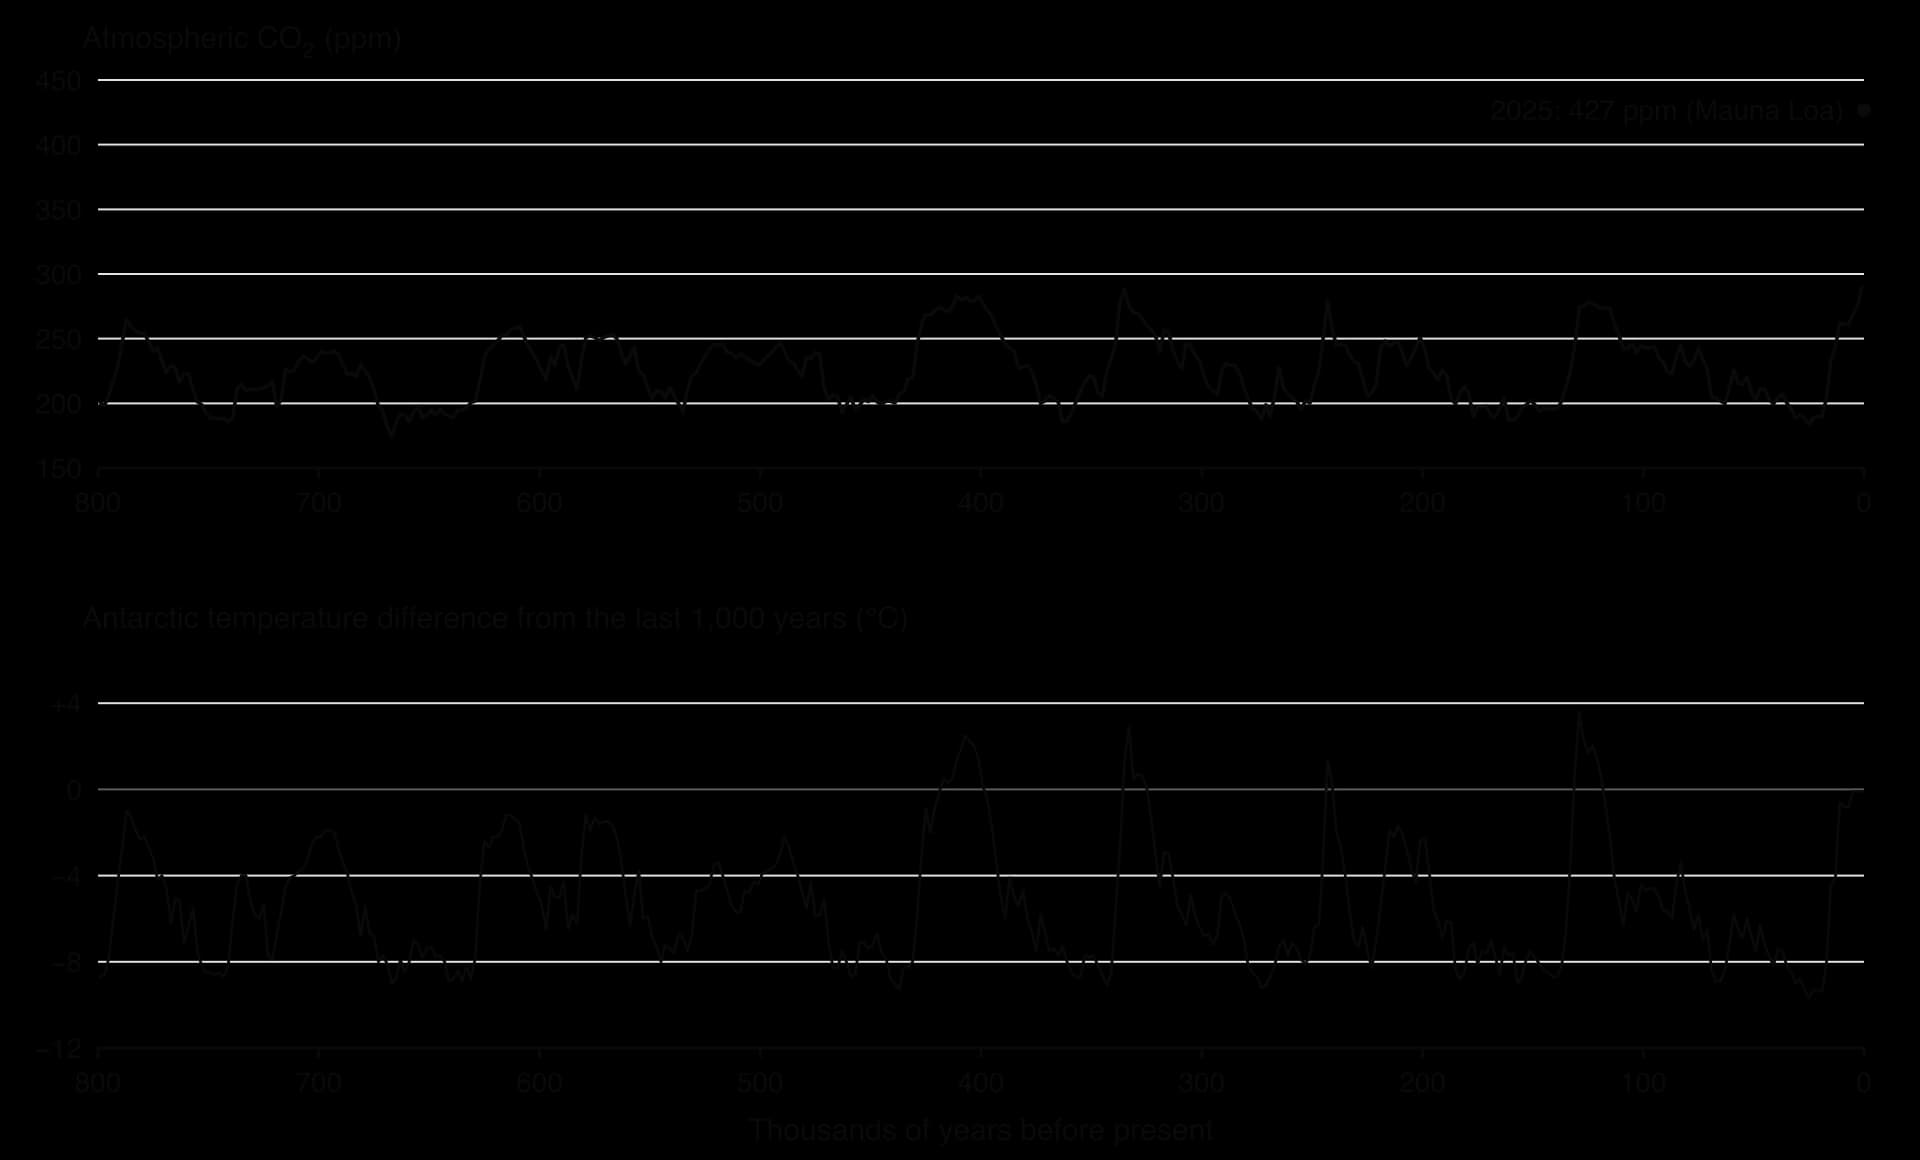
The ice-core record shows a strong positive correlation between atmospheric CO₂ and temperature. In cold glacial periods, CO₂ fell to about 180–200 ppm and Antarctic temperatures were up to about 10 °C below those of the last 1,000 years. In warm interglacials, CO₂ rose to about 260–300 ppm. The cycle repeated roughly every 100,000 years, with long, irregular cooling followed by relatively rapid warming.
An interglacial is the warmer interval between two glacials, usually lasting 10,000–30,000 years. The present interglacial, the Holocene, began about 11,700 years ago, and human farming and civilisation developed entirely within it.
The glacial cycles were triggered by small, regular changes in Earth's orbit and tilt, the Milankovitch cycles, which change how much sunlight reaches high northern latitudes in summer. These changes alone are too small to explain the size of the temperature swings. As the oceans warmed, they released CO₂ (warm water holds less dissolved gas), and the extra CO₂ amplified the warming; as they cooled, they absorbed CO₂ and the cooling deepened. CO₂ therefore acted both as a result of temperature change and as a cause of further change.
Two conclusions follow. The record shows how sensitive the climate is to changes in CO₂, and it shows that today's concentration of over 420 ppm lies far outside the natural range of the last 800,000 years. The IPCC concluded that CO₂ in 2019 was higher than at any time in at least 2 million years.
Sources: NOAA NCEI Paleoclimatology (2015, 2007 datasets); IPCC AR6 Working Group I, Summary for Policymakers (2021).
The enhanced greenhouse effect and global warming
The natural greenhouse effect keeps Earth's surface about 33 °C warmer than it would otherwise be: greenhouse gases such as water vapour, CO₂, methane and nitrous oxide absorb some of the long-wave infrared radiation emitted by the warm surface and re-emit it in all directions, including back towards the ground.
The enhanced greenhouse effect is the strengthening of this natural effect by anthropogenic greenhouse gas emissions. Adding more of these gases means that more of the outgoing infrared radiation is absorbed and re-emitted, so less energy escapes to space than arrives from the Sun. The extra energy accumulates in the climate system and raises its temperature. The resulting rise in mean global surface temperature is global warming; the wider set of changes it causes, in rainfall, ice, sea level, ocean chemistry and extreme weather, is climate change.
The main anthropogenic greenhouse gases
Large quantities of three gases, and smaller quantities of several others, are responsible for most of the enhancement. Their concentrations have risen far above the range of natural variation recorded in ice cores.
Gas | Main anthropogenic sources | Concentration in 2019 | Rise since 1750 |
|---|---|---|---|
Carbon dioxide (CO₂) | Burning coal, oil and gas; cement production; deforestation | 410 ppm | 47% |
Methane (CH₄) | Cattle and other ruminants; rice paddies; landfill; leaks from gas, oil and coal extraction | 1,866 ppb | 156% |
Nitrous oxide (N₂O) | Nitrogen fertilisers on farmland; manure; some industrial processes | 332 ppb | 23% |
Fluorinated gases (e.g. HFCs) | Refrigerators, air conditioners and industrial processes | Very small, but each molecule is a powerful absorber | None before industrial production began in the 20th century |
Sources: IPCC AR6 Working Group I, Summary for Policymakers, A.1.1 and A.2.1 (2021).
CO₂ causes most of the warming because so much of it is emitted and because much of it stays in the atmosphere for centuries. Methane is emitted in smaller amounts, but each molecule absorbs far more infrared radiation than a molecule of CO₂ over a few decades; nitrous oxide is a stronger absorber still. Their effects are compared using the global warming potential.
Not all emitted CO₂ stays in the air. Over the past six decades, land and ocean sinks have taken up a nearly constant proportion, globally about 56%, of human CO₂ emissions each year. The rest accumulates, which is why the Keeling curve keeps rising. The ocean's share of this uptake makes seawater more acidic, an effect known as ocean acidification.
Evidence that the world is warming
Global temperature is reported as a temperature anomaly because it is easier to measure change accurately than absolute values. Thousands of land weather stations, ships and ocean buoys contribute, and independent groups in the UK, USA, Japan and Europe process the data in different ways, and their results agree closely.
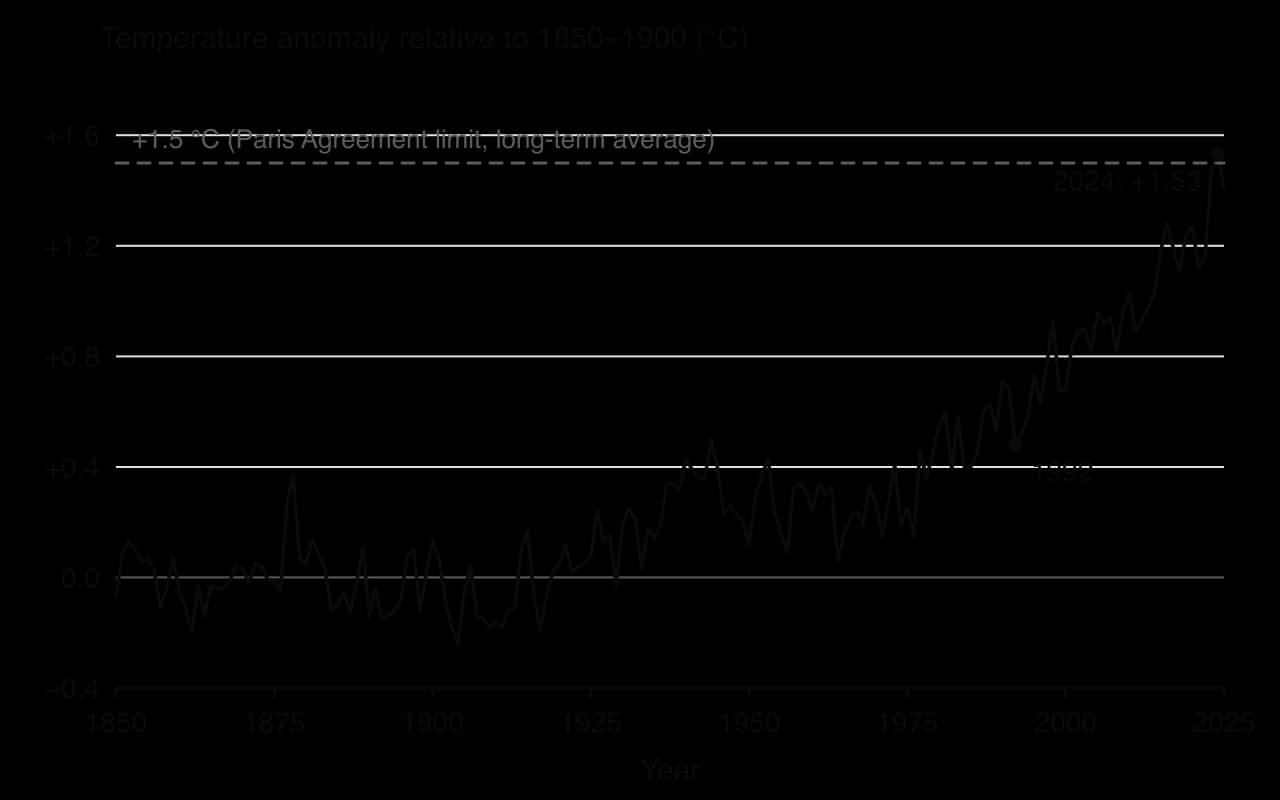
The record shows several things. The decade 2011–2020 was 1.09 °C warmer than 1850–1900, and each of the last four decades has been warmer than any decade before it since 1850. The World Meteorological Organization (WMO) combined six datasets to find that 2024 was 1.55 ± 0.13 °C above the 1850–1900 average, the first calendar year above 1.5 °C. The eleven warmest years in the HadCRUT5 record are 2015 to 2025. Land has warmed faster than the ocean: by 1.59 °C compared with 0.88 °C in 2011–2020.
Temperature is only one line of evidence. Other measured changes all point the same way: the upper ocean has warmed since the 1970s; Arctic sea ice in September covered about 40% less area in 2010–2019 than in 1979–1988; glaciers are retreating worldwide; global sea level rose by about 20 cm between 1901 and 2018; and spring arrives earlier in many ecosystems.
The Intergovernmental Panel on Climate Change (IPCC), in its Sixth Assessment Report of 2021, stated that it is unequivocal that human influence has warmed the atmosphere, ocean and land. Its best estimate of human-caused warming from 1850–1900 to 2010–2019 was 1.07 °C, almost all of the observed warming. Natural drivers, the Sun and volcanoes, contributed between −0.1 °C and +0.1 °C. Satellites show that the Sun's output has not increased in recent decades, so solar changes cannot explain the trend.
Sources: IPCC AR6 WGI SPM (2021); WMO (2025); Met Office Hadley Centre HadCRUT5 (2026).
Impacts on ecosystems: from local to global
Every species has a range of temperature, water availability and chemical conditions it can tolerate. Climate change shifts these conditions faster than many species can move or adapt, so it changes where organisms live, when they breed and grow, and how ecosystems function. Its effects act at every scale, from a single coral reef to the circulation of the whole ocean.
Local and regional impacts
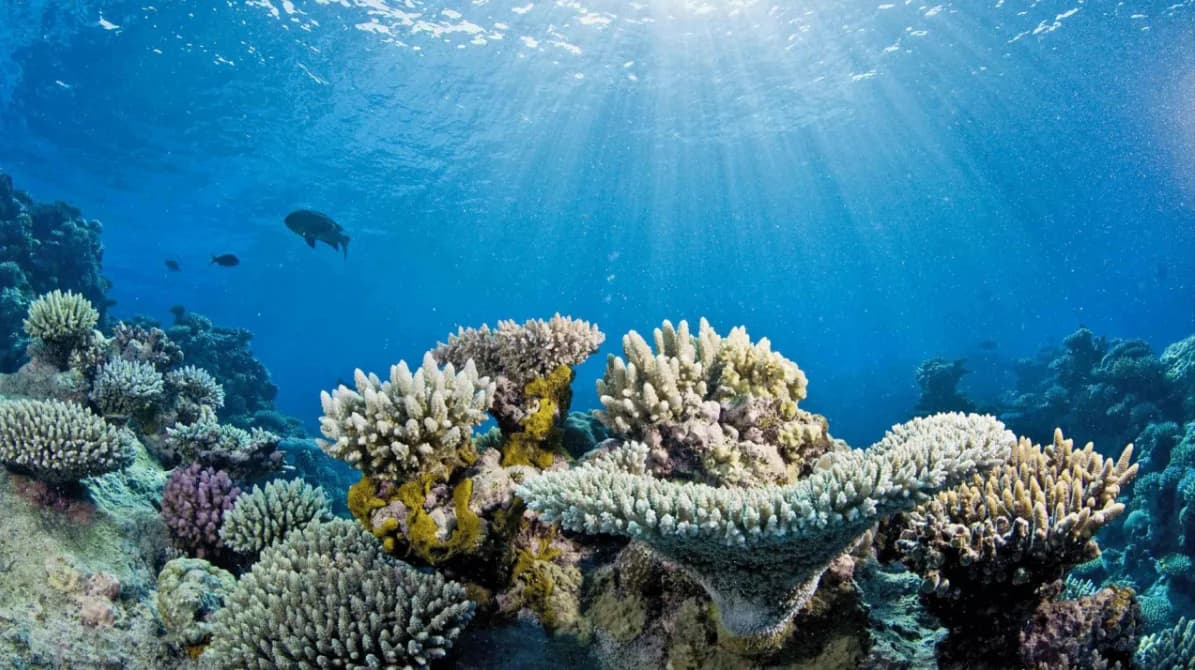
Coral bleaching. Reef-building corals live in partnership with zooxanthellae, single-celled algae inside their tissues that photosynthesise and supply most of the coral's food. When sea temperature stays about 1 °C or more above the usual summer maximum for several weeks, the partnership breaks down and the coral expels the algae, turning white. If the heat lasts too long, the coral starves and dies. Mass coral bleaching driven by marine heatwaves has become the most visible climate impact on tropical seas; the Great Barrier Reef is the subject of the case study.
Desertification in the Sahel. The Sahel, the semi-arid belt south of the Sahara from Senegal to Sudan, receives less than 1,000 mm of rain a year, almost all in one short rainy season. A severe drought from the late 1960s to the 1980s caused famine that killed about 100,000 people in 1968–1973 and turned grazing land into degraded, bare ground. Its causes were a mix of shifting sea surface temperature patterns, air pollution from other continents, rising greenhouse gases and overgrazing and land clearing. Since the 1980s rainfall has partly recovered and some areas have "greened", but rainfall has become more variable, which makes desertification a continuing risk.
Boreal forest fires. In 2023 Canada had its largest area burned on record: by early October about 185,000 km² had burned, about 5% of the country's forest and more than six times the long-term average for that time of year. Hot, dry conditions dried out the fuel; the fires released about 327 million tonnes of carbon into the atmosphere and displaced between 185,000 and 232,000 people.
Sources: Wikipedia, "Sahel drought" and "2023 Canadian wildfires", with their cited sources (2026).
Global impacts
Sea-level rise is a global impact with local consequences. Global mean sea level rose by about 0.20 m between 1901 and 2018, and the rate is increasing: from 2.1 mm per year in 1993–2002 to 4.7 mm per year in 2015–2024. Between 1971 and 2018, half of the rise came from thermal expansion and most of the rest from melting glaciers and ice sheets. Rising seas erode coasts, flood salt marshes and mangroves, and push salt water into coastal aquifers and farmland.
Changes to ocean circulation. The Atlantic Meridional Overturning Circulation (AMOC) carries warm surface water north in the Atlantic and cold, dense water south at depth, warming north-west Europe. Warming and fresh water from melting Greenland ice make surface water less dense, which weakens the sinking that drives the circulation. The IPCC judged it very likely that the AMOC will weaken over the 21st century under all emissions scenarios.
Ocean acidification and deoxygenation. As the ocean absorbs CO₂, its pH falls, which makes it harder for corals, molluscs and some plankton to build calcium carbonate shells and skeletons. Warmer water also holds less oxygen, and oxygen levels have dropped in many upper-ocean regions since the mid-20th century.
Biome shifts and changes in timing. As temperature and rainfall belts move, species shift their ranges towards the poles and up mountains, and whole biomes begin to move. Trees are spreading into Arctic tundra; species on mountain tops have nowhere higher to go. Phenology, the timing of seasonal events, is also changing: spring flowering, leaf growth and egg laying occur earlier in many places, which can leave predators and their prey, or flowers and their pollinators, out of step.
Where natural productivity may increase
Not every effect is negative. In cold regions with short growing seasons, such as parts of Canada, Scandinavia and Siberia, warmer temperatures lengthen the growing season, and satellite images show "greening" of parts of the Arctic. Higher CO₂ concentrations can also increase the rate of photosynthesis in many plants (CO₂ fertilisation), raising net primary productivity where water and nutrients are not limiting. These gains are uneven and often offset by drought, fire, pests and heat stress elsewhere, so they do not cancel the losses.
What makes an ecosystem resilient to climate change
Resilience is the ability of a system to resist damage and recover from or adapt to disturbance. Ecosystems differ greatly in how well they cope with climate change, and several factors explain why:
Biodiversity. An ecosystem with many species, and with genetic diversity within species, is more likely to contain some that tolerate new conditions and can take over the roles of those that decline.
Size of storages and populations. Large, connected populations recover faster than small, isolated ones, because individuals can recolonise damaged areas.
Connectivity and space to move. Species can track a shifting climate only if there are corridors of habitat; fragmented landscapes and mountain tops leave them trapped.
Rate of change. Slow change allows migration and adaptation; rapid change, or repeated shocks with little time between them, does not.
Other stresses. Pollution, overfishing, invasive species and habitat loss reduce resilience, so an ecosystem facing several pressures is more likely to cross a tipping point.
Impact | Scale | Named example | Effect on the ecosystem |
|---|---|---|---|
Coral bleaching | Local to regional | Great Barrier Reef, Australia | Coral death, loss of habitat for reef fish, slower reef growth |
Desertification | Regional | Sahel, West and Central Africa | Loss of vegetation cover, soil erosion, lower productivity |
Wildfire | Regional | Boreal forest, Canada (2023) | Loss of forest and stored carbon; changes in species composition |
Sea-level rise | Global, felt locally | Coastal wetlands and mangroves worldwide | Flooding and erosion of coastal habitats; salt water in freshwater systems |
Ocean circulation change | Global | Atlantic Meridional Overturning Circulation | Changes in heat transport, rainfall belts and nutrient supply |
Arctic warming | Regional to global | Arctic sea ice and tundra | Loss of sea-ice habitat; tundra greening; permafrost thaw |
Sources: IPCC AR6 WGI SPM (2021); WMO, State of the Global Climate 2024 (2025).
Impacts on human societies and their resilience
Climate change affects human societies through health, water supply, food production and infrastructure. The same physical change can have very different consequences in different places, because the harm depends on exposure (who and what is in the way), sensitivity (how easily it is damaged) and the capacity to adapt, which depends on wealth, technology, governance and social networks.
Area of impact | How climate change acts | Example |
|---|---|---|
Health | More frequent and intense heatwaves; changes in the range of diseases carried by mosquitoes; smoke from wildfires | The 2003 European heatwave caused more than 70,000 deaths, mostly among elderly people; 14,802 heat-related deaths occurred in France alone |
Water supply | Shrinking mountain glaciers and snowpack; more intense droughts and floods; salt water entering coastal aquifers | Hundreds of millions of people in South Asia rely on rivers fed by glaciers in the Hindu Kush Himalaya |
Agriculture and food | Heat stress on crops and livestock; changed rainfall timing; floods and droughts destroying harvests | Drought in the Sahel led to crop failure and famine in Niger in 2010 |
Infrastructure | Flooding of homes, roads and ports; storm damage; heat damaging railways and power lines | In 2023, wildfires in Canada forced the evacuation of entire towns, including Yellowknife |
Displacement | Homes and livelihoods lost to floods, storms, drought and sea-level rise | In 2024, weather-related disasters caused the highest number of new displacements in 16 years |
Sources: Wikipedia, "2003 European heat wave", "Sahel drought" and "2023 Canadian wildfires" (2026); WMO (2025).
Why some societies are more resilient than others
Resilience to climate change depends on socio-economic conditions as much as on the climate itself. A wealthy city can build sea walls, air-condition hospitals and insure property; a poor rural community with little savings and no insurance may lose its harvest, its animals and its home in one flood. The 2003 heatwave showed that resilience can also be low in rich countries: in France many of the dead were elderly people living alone in buildings that stayed hot at night, with no one to help them cool down.
Scale matters too. An individual farmer may adapt by changing crops; a city can change building codes; a nation can build flood defences and early-warning systems. Each scale has different resources and responsibilities. Because the poorest people often live in the most exposed places, such as low-lying deltas, informal settlements on flood plains or drylands, climate change tends to widen existing inequalities, a link developed fully as environmental justice.
Modelling climate change with systems diagrams and feedback loops
Climate change is easiest to understand as a change in a system. A systems diagram shows the storages of energy or matter as boxes and the flows between them as labelled arrows; a feedback loop shows how the output of a process returns to affect the same process. Both kinds of model are simplified representations, but they make clear why a small push can lead to a large change.
The global energy balance
Earth gains energy as incoming solar radiation and loses it in two ways: some sunlight is reflected straight back to space, and the rest is absorbed and later emitted as infrared radiation. When the energy absorbed equals the energy emitted, the global energy balance is in equilibrium and the mean temperature stays steady. If more energy comes in than goes out, heat accumulates and the temperature rises until a warmer Earth emits enough extra infrared radiation to restore the balance.
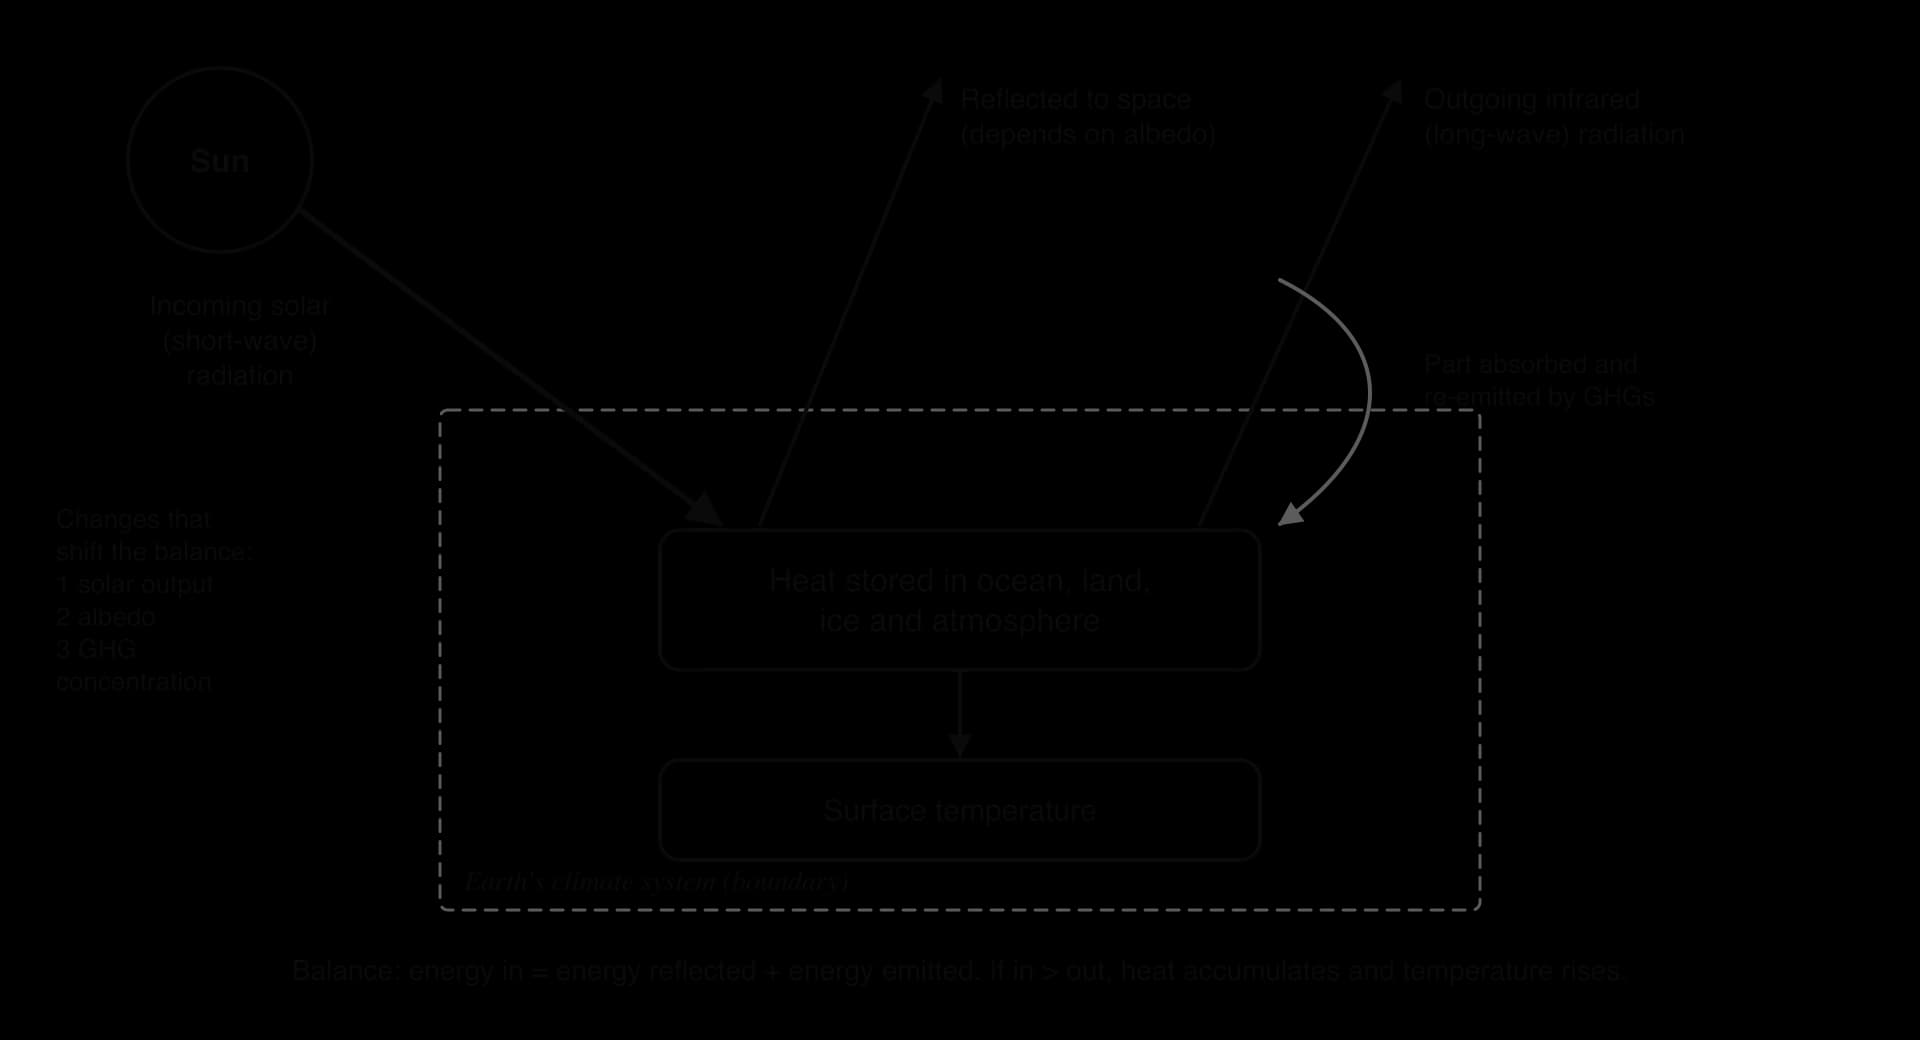
Three kinds of change can shift the balance, and climate models include all of them:
Variation in solar radiation. The Sun's output varies slightly over an 11-year cycle, and the Milankovitch cycles change how sunlight is distributed over thousands of years. These variations drove past climate change, but measured solar output has not risen since the 1950s.
Changes in terrestrial albedo. Albedo is the proportion of incoming radiation a surface reflects. Fresh snow and ice reflect most of it; open ocean and dark forest absorb most. Melting ice, deforestation and soot on snow all change the albedo of the surface.
Changes in greenhouse gas concentrations. More greenhouse gases reduce the infrared radiation escaping to space. Since 1750, human activity has created a radiative forcing of about +2.7 W m⁻², which is why the climate system currently gains more energy than it loses.
The present imbalance is measurable. The rate at which the climate system has been accumulating heat rose from about 0.50 W m⁻² in 1971–2006 to 0.79 W m⁻² in 2006–2018, and 91% of that heat went into the ocean. The ocean's huge storage of heat explains why surface warming lags behind the forcing and why sea level will keep rising for centuries.
Sources: IPCC AR6 WGI SPM, A.4.1–A.4.2 (2021).
Feedback loops in the climate system
A positive feedback amplifies a change, pushing the system further from its starting state; a negative feedback counteracts the change and stabilises the system. The climate contains both kinds, and the balance between them determines how much warming results from a given rise in greenhouse gases.
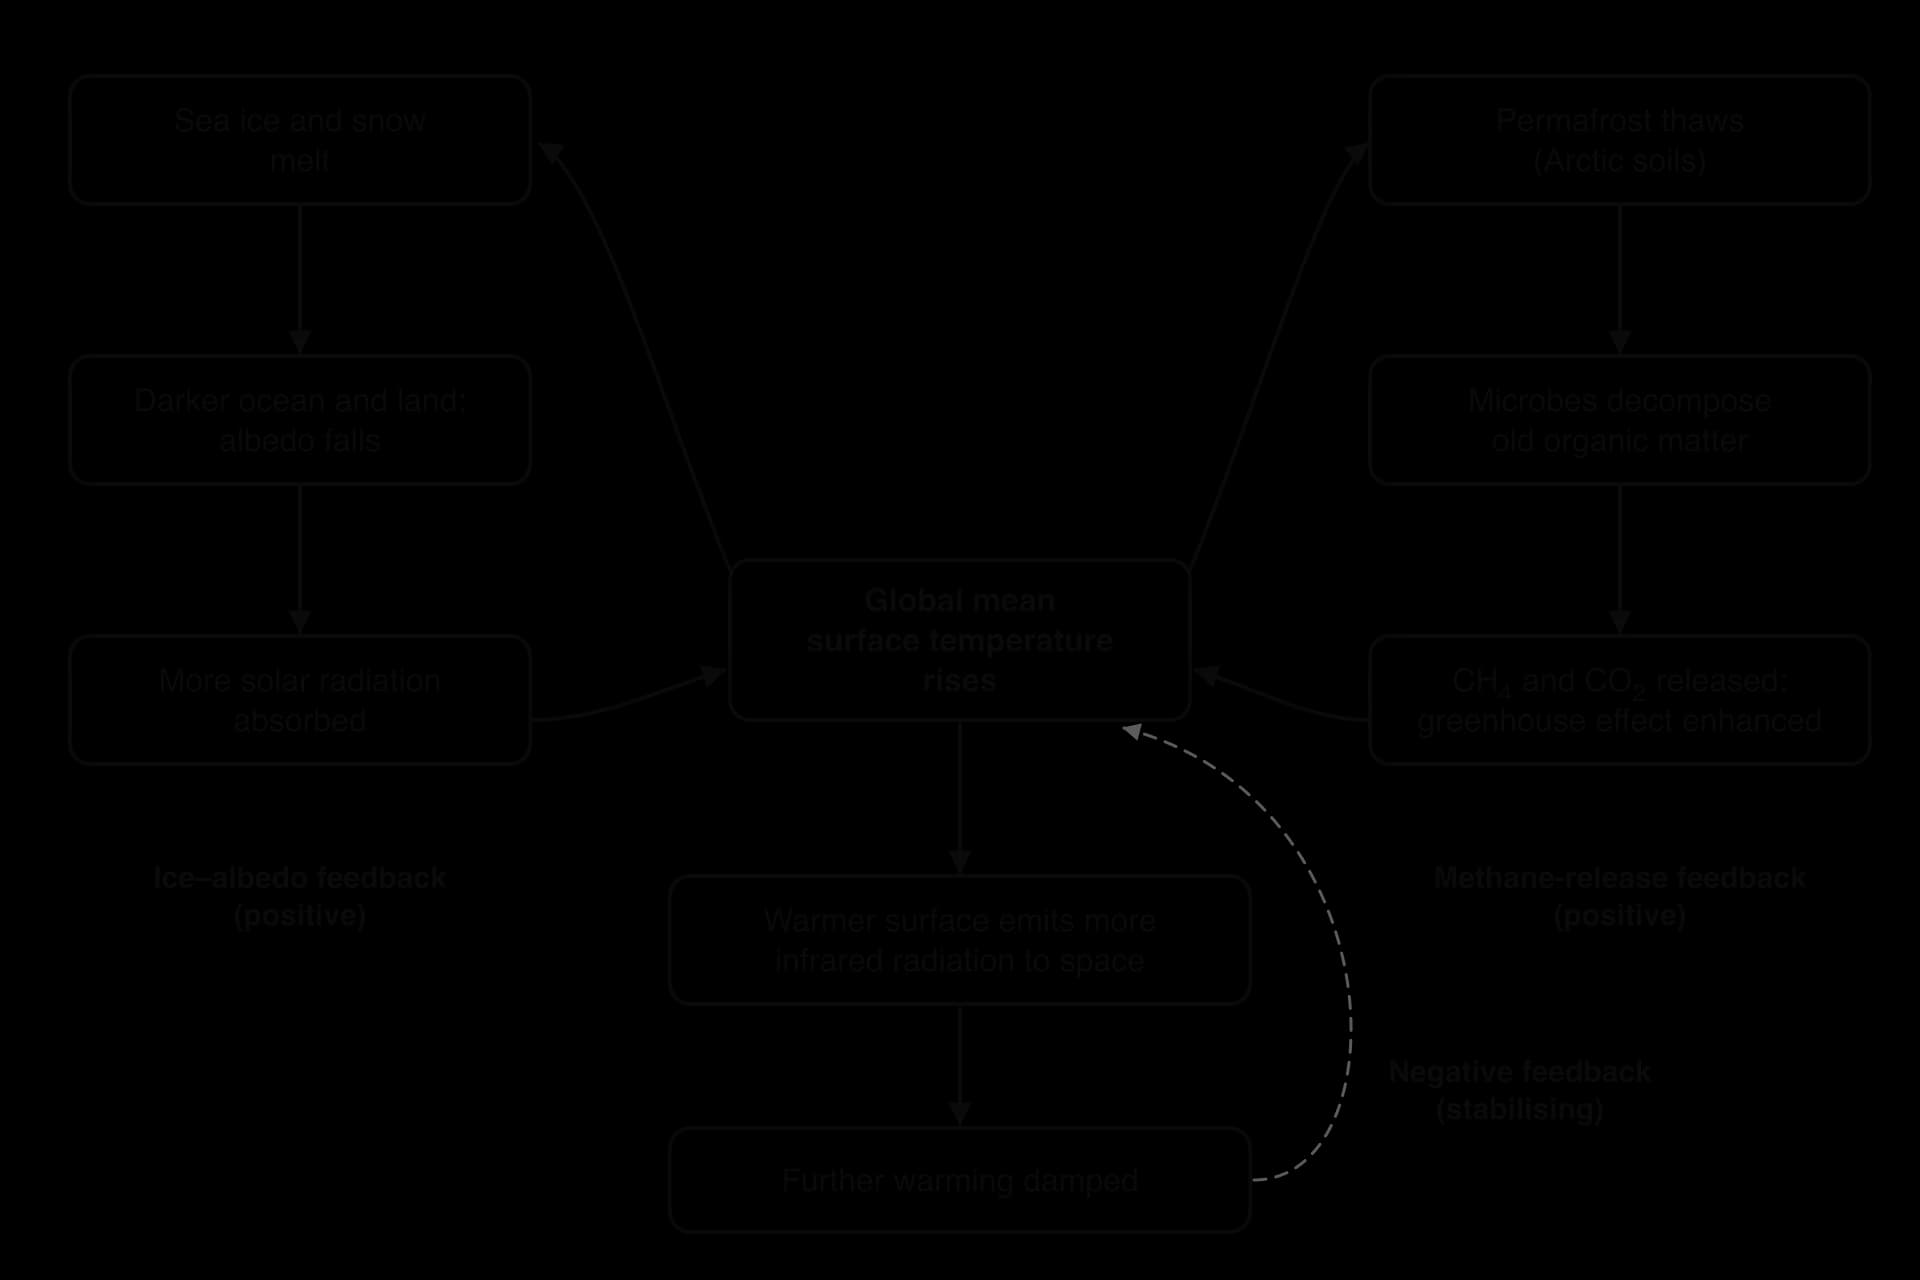
The ice–albedo feedback
Sea ice reflects most of the sunlight that falls on it, while dark open water absorbs most of it. As the Arctic warms, sea ice melts earlier in spring and forms later in autumn, so more open water is exposed during the sunniest months. The water absorbs more energy, warms, and melts more ice. This ice–albedo feedback is a major reason why the Arctic has warmed several times faster than the global average, and why September sea ice area fell by about 40% between 1979–1988 and 2010–2019.
The methane-release feedback
Permafrost is ground that stays frozen for at least two years in a row. Across Siberia, Alaska, northern Canada and the Tibetan Plateau it holds the remains of plants and animals that have built up over thousands of years. The northern permafrost region holds an estimated 1,460–1,600 billion tonnes of organic carbon, roughly twice as much as the atmosphere.
When permafrost thaws, microbes become active and decompose this organic matter. Where oxygen is available, they release CO₂; in waterlogged, oxygen-free soils and thaw lakes, they release methane, a much more powerful greenhouse gas over a few decades. The extra greenhouse gases enhance the greenhouse effect, cause more warming and thaw more permafrost. A similar loop involves methane clathrates, methane locked in ice in ocean sediments and permafrost, which could be released if the ocean warms enough.
Other feedbacks
Feedback | Type | How it works |
|---|---|---|
Water vapour | Positive | Warmer air can hold more water vapour, itself a greenhouse gas, which absorbs more infrared radiation and causes more warming. |
Forest dieback and fire | Positive | Heat and drought kill trees and increase fires, releasing stored carbon as CO₂ and reducing uptake by forests. |
Weaker carbon sinks | Positive | A warmer ocean dissolves less CO₂, and the IPCC projects that land and ocean sinks will absorb a smaller proportion of emissions as emissions grow. |
Outgoing infrared radiation | Negative | A warmer surface emits more infrared radiation to space, which limits further warming. This is the main stabilising feedback. |
CO₂ fertilisation | Negative | Higher CO₂ can increase photosynthesis and plant growth where water and nutrients allow, removing some CO₂ from the atmosphere. |
Clouds | Uncertain | More low cloud reflects sunlight (cooling) but more high cloud traps infrared (warming); the IPCC assesses the net effect as amplifying, with the largest uncertainty of any feedback. |
Because the positive feedbacks outweigh the negative ones, the climate warms more than greenhouse gases would cause on their own. The IPCC's best estimate of the equilibrium climate sensitivity, the long-term warming from a doubling of CO₂, is 3 °C, with a likely range of 2.5–4 °C.
Sources: IPCC AR6 WGI SPM, A.1.5, A.4.4, B.4 (2021); Wikipedia, "Permafrost carbon cycle" (2026).
The planetary boundary for climate change
The planetary boundaries model identifies nine Earth-system processes and sets a limit for each, inside which humanity can operate with low risk of destabilising the planet. The limits mark a safe operating space based on the stable conditions of the Holocene. For climate change the model uses two control variables: an atmospheric CO₂ concentration of 350 ppm, and a total human-caused radiative forcing of +1 W m⁻² since about 1750.
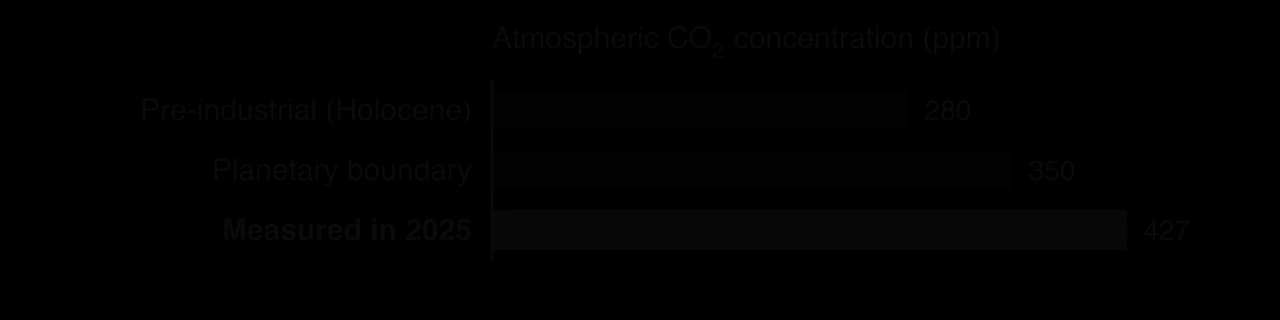
By both measures the climate boundary has been crossed. The 2026 Planetary Health Check gave current values of 426 ppm of CO₂ and +3.10 W m⁻² of radiative forcing, far beyond 350 ppm and +1 W m⁻². The Mauna Loa annual mean first passed 350 ppm in 1988 (351.69 ppm) and was 427.35 ppm in 2025. Climate change was one of the three boundaries already judged to be crossed in the first assessment in 2009, and the 2025 and 2026 checks assessed seven of the nine boundaries as transgressed.
Crossing a boundary does not mean that disaster follows immediately. It means that the risk of large, possibly irreversible changes rises sharply, in the way that driving past a speed limit raises the risk of a crash without making one certain. The evidence that risk is rising includes accelerating ice loss, record marine heatwaves and coral bleaching, and the observed increase in heat extremes.
Strengths of the climate boundary | Limitations of the climate boundary |
|---|---|
Uses simple, measurable control variables (ppm of CO₂ and W m⁻²) with long, reliable records | The value of 350 ppm involves judgement; there is no single sharp threshold at that number |
Communicates a global limit clearly to governments and the public | A global value hides big regional differences in impacts and in who caused the problem |
Based on evidence from the Holocene and on the risk of tipping points | Says nothing directly about fairness or how to share the remaining emissions |
Links climate to the other boundaries, such as ocean acidification and biosphere integrity | Interactions between boundaries are hard to quantify |
Sources: Potsdam Institute for Climate Impact Research, _Planetary Health Check 2026; NOAA Global Monitoring Laboratory (2026)._
Perspectives on climate change
People who see the same data on CO₂ and temperature can reach very different views about how serious climate change is and what should be done. Their perspective on the issue comes from their values and worldview, which are shaped by many factors.
Age. Younger people will live with the consequences for longer and often see action as more urgent; this concern can also appear as climate anxiety.
Location and exposure. People on low-lying coasts, small islands, drylands or glacier-fed river basins already experience impacts directly; people in cooler, inland or wealthy regions may see the threat as distant.
Livelihood and income. Workers in coal, oil and gas, and countries whose economies depend on exporting fossil fuels, may fear losing jobs and revenue from rapid change.
Culture, religion and Indigenous knowledge. Many faith traditions and Indigenous worldviews stress care for the Earth and responsibility to future generations; traditional ecological knowledge records long-term changes in seasons, ice and animal behaviour.
Political beliefs. Views about the proper role of government, markets and international agreements strongly shape support for policies such as carbon taxes.
Media and education. The sources people trust, and how the issue is framed, influence whether they see climate change as settled science or as uncertain.
Personal experience. Living through a flood, heatwave or wildfire often changes how people view the risk.
Value system | View of the problem | Preferred response | Example |
|---|---|---|---|
Technocentrism | A technical problem that innovation can solve without major changes to lifestyles or growth | Renewables, nuclear power, carbon capture, geoengineering research | Investment in direct air capture and electric vehicles |
Anthropocentrism (managerial) | A threat to human well-being, food security and the economy that needs careful management | Carbon pricing, regulation, international agreements, adaptation planning | National net-zero laws and emissions trading |
Ecocentrism | A symptom of overconsumption and of treating nature only as a resource | Lower consumption, protection and restoration of ecosystems, local self-reliance, degrowth | Campaigns to keep fossil fuels in the ground; rewilding |
Personal perspectives sit within these broad categories and can change. A student who first meets climate change as a distant global issue may change their view after a local flood, a conversation with a farmer whose harvests have failed or a school project measuring local temperatures. Societies also shift: support for climate action in many countries has grown as impacts have become more visible, while in others it has become more politically divided.
Case study: repeated mass coral bleaching on the Great Barrier Reef
Context
The Great Barrier Reef, off the coast of Queensland in north-eastern Australia, is the world's largest coral reef system. It is made up of over 2,900 individual reefs and 900 islands stretching for more than 2,300 km over an area of about 344,400 km². It became a World Heritage Site in 1981 and is largely protected within the Great Barrier Reef Marine Park.
The reef is built by hard corals whose tissues contain zooxanthellae. Through photosynthesis the algae supply the coral with most of its food, while the coral gives the algae shelter and nutrients, a form of mutualism. The reef supports a very high biodiversity, a tourism industry worth several billion Australian dollars a year and the culture of Aboriginal and Torres Strait Islander Traditional Owners, who have used and cared for this Sea Country for tens of thousands of years.
What happened
Before 1998 bleaching on the reef was occasional and patchy. Since then mass bleaching events have become larger and more frequent. In 1998 and 2002, 42% and 54% of reefs bleached to some extent. In 2016 a marine heatwave killed an estimated 29–50% of the reef's coral, with the greatest losses in the northern third; near Port Douglas more than half of the bleached corals died. Further mass bleaching followed in 2017, 2020, 2022, 2024 and 2025.
The 2024 event, part of the fourth global coral bleaching event confirmed by NOAA in April 2024, was the fifth mass bleaching on the reef since 2016 and had the largest spatial footprint of any bleaching yet recorded there. Worldwide, about 84% of coral reefs were exposed to bleaching-level heat between 2023 and 2025.
Viewed as a system, the reef has an input of heat from the warming ocean, a storage of living coral, and outputs of dead coral and lost habitat. Recovery depends on the input of new coral larvae and on enough time without disturbance for young corals to grow. Repeated heat stress removes the adult corals that produce larvae, so each event leaves the reef less able to recover from the next.
Data
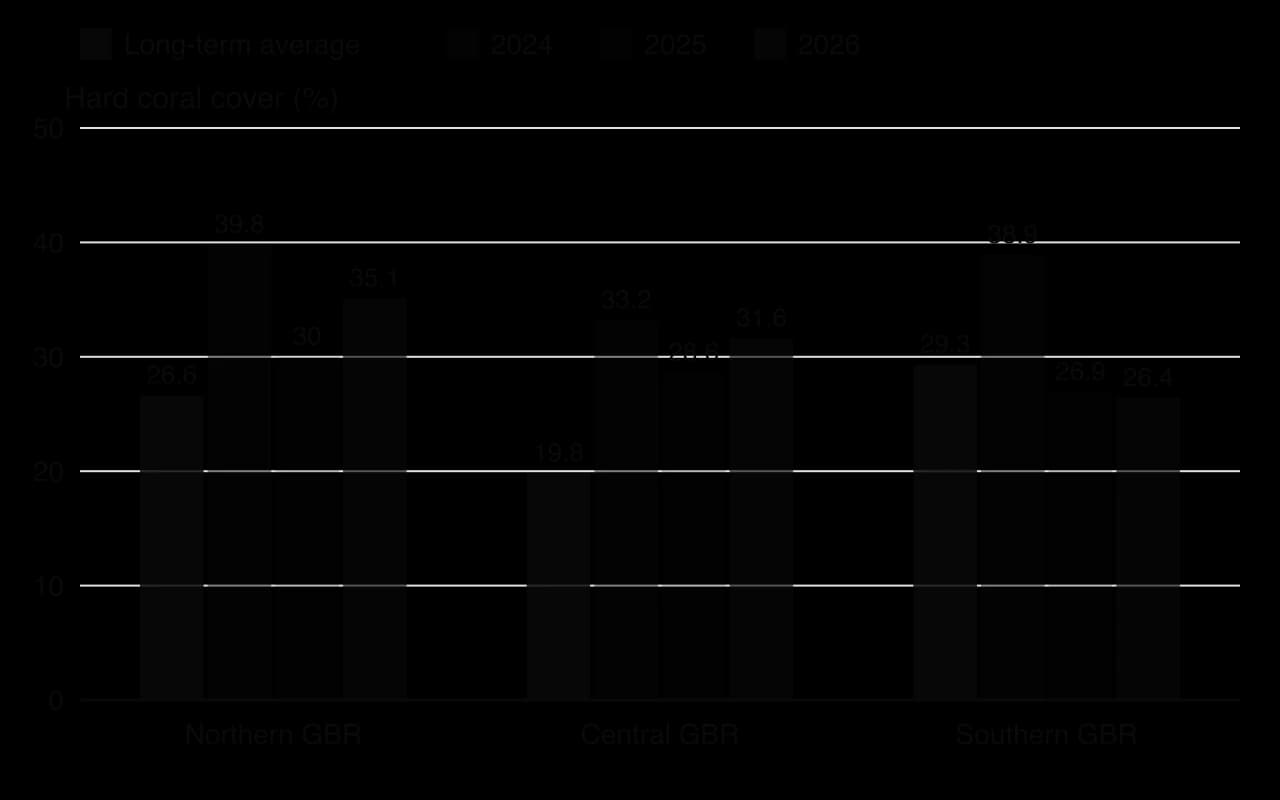
The Australian Institute of Marine Science (AIMS) has monitored the reef for about 40 years. Its 2024–25 survey of 124 reefs found that hard coral cover fell by 24.8% in the Northern region (from 39.8% to 30.0%), 13.9% in the Central region (from 33.2% to 28.6%) and 30.6% in the Southern region (from 38.9% to 26.9%), the largest annual declines recorded for the Northern and Southern regions. Nearly half the surveyed reefs (48%) declined and only 10% increased.
In early 2026 a late-summer monsoon eased heat stress, and cover rose to 35.1% in the Northern region and 31.6% in the Central region, while the Southern region slipped to 26.4%. The partial recovery shows the reef's capacity to regrow when it is given a few years without a major disturbance.
The data also show that bleaching is not the only stress. An analysis of coral loss from 1985 to 2012 found that cover fell by about half, with tropical cyclones and outbreaks of the coral-eating crown-of-thorns starfish responsible for most of the loss and bleaching for about 10%. Since 2016 bleaching has become the dominant disturbance, and run-off of sediment and nutrients from farms adds to the pressure by fuelling starfish outbreaks.
Management and responses
Australian and Queensland governments. The Reef 2050 Long-Term Sustainability Plan, adopted in 2015 and updated in 2021, funds water-quality improvement, crown-of-thorns starfish control, reef restoration research and fisheries reform. In 2023 the federal government promised UNESCO a combined investment of A$4.4 billion. Critics, including many reef scientists, point out that the plan does not address the root cause, greenhouse gas emissions, while Australia remains a major exporter of coal and gas.
UNESCO. The World Heritage Committee has repeatedly considered listing the reef as "in danger"; a 2022 monitoring mission recommended it. Australia lobbied against the listing, arguing that its management was among the best in the world.
Scientists and managers. AIMS and partner organisations are testing coral restoration, breeding heat-tolerant corals and cooling or shading small areas of reef. These methods work at the scale of individual reefs, a tiny fraction of the whole system.
Traditional Owners. Aboriginal and Torres Strait Islander groups take part in Sea Country management through agreements with the Marine Park Authority, combining traditional ecological knowledge with monitoring, and in 2011 four Traditional Owner groups agreed to stop hunting dugongs in their area after numbers declined.
Tourism operators depend on a healthy reef and support monitoring and local restoration, but also worry that publicity about bleaching discourages visitors.
Evaluation
Local management has real benefits. Improving water quality and controlling starfish increase the reef's resilience by removing other stresses, and protected zones help fish populations. However, none of these measures prevents marine heatwaves. Coral bleaching on the reef is projected to occur about three times a decade at 1.5 °C of global warming and roughly every other year at 2 °C, faster than most reefs can recover. The long-term future of the reef therefore depends mainly on global emissions, which Australia alone cannot control.
Perspective | View of the problem | Preferred response |
|---|---|---|
Reef scientists | Global warming is the main threat; local measures only buy time | Rapid global emissions cuts, plus local resilience measures and restoration research |
Australian government | The reef is a national asset to be managed while the economy and exports are protected | Reef 2050 Plan, funding for water quality and restoration; gradual climate policy |
Fossil-fuel export industry | Coal and gas provide jobs and revenue; Australia's share of global emissions is small | Continued exports, with emissions handled by importing countries |
Traditional Owners | The reef is part of Sea Country, with cultural and spiritual value as well as economic value | Co-management, use of traditional knowledge, recognition of rights |
Tourism operators | Livelihoods depend on visitors seeing a healthy reef | Local protection and restoration; positive messaging |
What it shows
The Great Barrier Reef shows climate change acting at local scale on an ecosystem whose resilience is falling. Each marine heatwave is a disturbance; the time between disturbances is now often shorter than the time corals need to recover, and other stresses reduce resilience further. It also shows how impacts on ecosystems become impacts on societies, through tourism, fisheries and cultural loss, and how perspectives on the response divide along economic and cultural lines. Finally, it shows the limits of local management for a global problem, because the reef's future depends largely on emissions far from Queensland.
Sources: AIMS Long-Term Monitoring Program annual summaries 2023–24, 2024–25 and 2025–26 via GCRMN (2024, 2025, 2026); Wikipedia, "Great Barrier Reef", "Coral bleaching" and "Environmental threats to the Great Barrier Reef" (2026).
Measuring climate: direct and indirect data (HL only)
Studying climate change depends on long, consistent records. Two kinds of data are used. Direct measurements are made with instruments at the time; indirect measurements infer past conditions from proxies. Each kind has its own strengths, and together they extend the record from the present back hundreds of thousands of years.
Direct measurements
Weather stations on land, and instruments on ships and drifting ocean buoys, measure temperature, rainfall, pressure and wind. Some stations have records from the mid-19th century, which is why 1850–1900 is used as the reference period.
Observatories such as Mauna Loa measure the concentrations of CO₂, methane and other gases continuously, and a global network of sampling stations confirms that the changes are worldwide.
Weather radar tracks rainfall and storms in real time and builds records of extreme rainfall.
Satellites have measured sea ice extent since the late 1970s and global sea level since 1993, and they also record surface temperature, ice-sheet mass, cloud cover and incoming and outgoing radiation. Satellite images track land-use change, such as deforestation in the Amazon or the spread of cities.
Indirect measurements (proxies)
Before instruments, climate must be reconstructed from proxies. The most important are isotope ratios and trapped air in ice cores, which record temperature and greenhouse gas concentrations; dendrochronology, which gives year-by-year records of growing conditions; and pollen from peat and lake cores, which records past vegetation and therefore climate. Each proxy must be calibrated against the period when it overlaps with instrument records.
Type of data | Strengths | Limitations |
|---|---|---|
Direct: instruments | Precise, frequent, measured in standard units; global coverage from satellites | Short records (decades to about 175 years); early records sparse, especially over oceans, polar regions and Africa; changes in instruments and station sites must be corrected |
Indirect: proxies | Extend records back thousands to millions of years; show natural variability and past responses to CO₂ | Need calibration and dating, which add uncertainty; often record local or seasonal conditions; lower time resolution further back |
Both kinds of data feed climate models. Instrument records are used to test whether a model can reproduce recent climate; proxies show how the climate behaved under conditions very different from today, such as the last glacial maximum, which tests the model over a wider range.
Sources: IPCC AR6 WGI SPM (2021); WMO, State of the Global Climate 2024 (2025).
Climate models and hindcasting (HL only)
A global climate model divides the atmosphere and ocean into a three-dimensional grid of boxes, often around 100 km wide and stacked in dozens of layers. In each box, equations based on the laws of physics calculate how energy, air, water and carbon move and change over a short time step, and the calculation is repeated millions of times to simulate decades or centuries. Processes smaller than a grid box, such as individual clouds, have to be represented by simplified rules called parameterisations.
The model is driven by inputs, or forcings: greenhouse gas and aerosol concentrations, solar output, volcanic eruptions and land use. Changing an input and comparing the outputs shows how the climate responds. Running the model with natural forcings only, and then with natural and human forcings together, is one of the clearest tests of what caused recent warming.
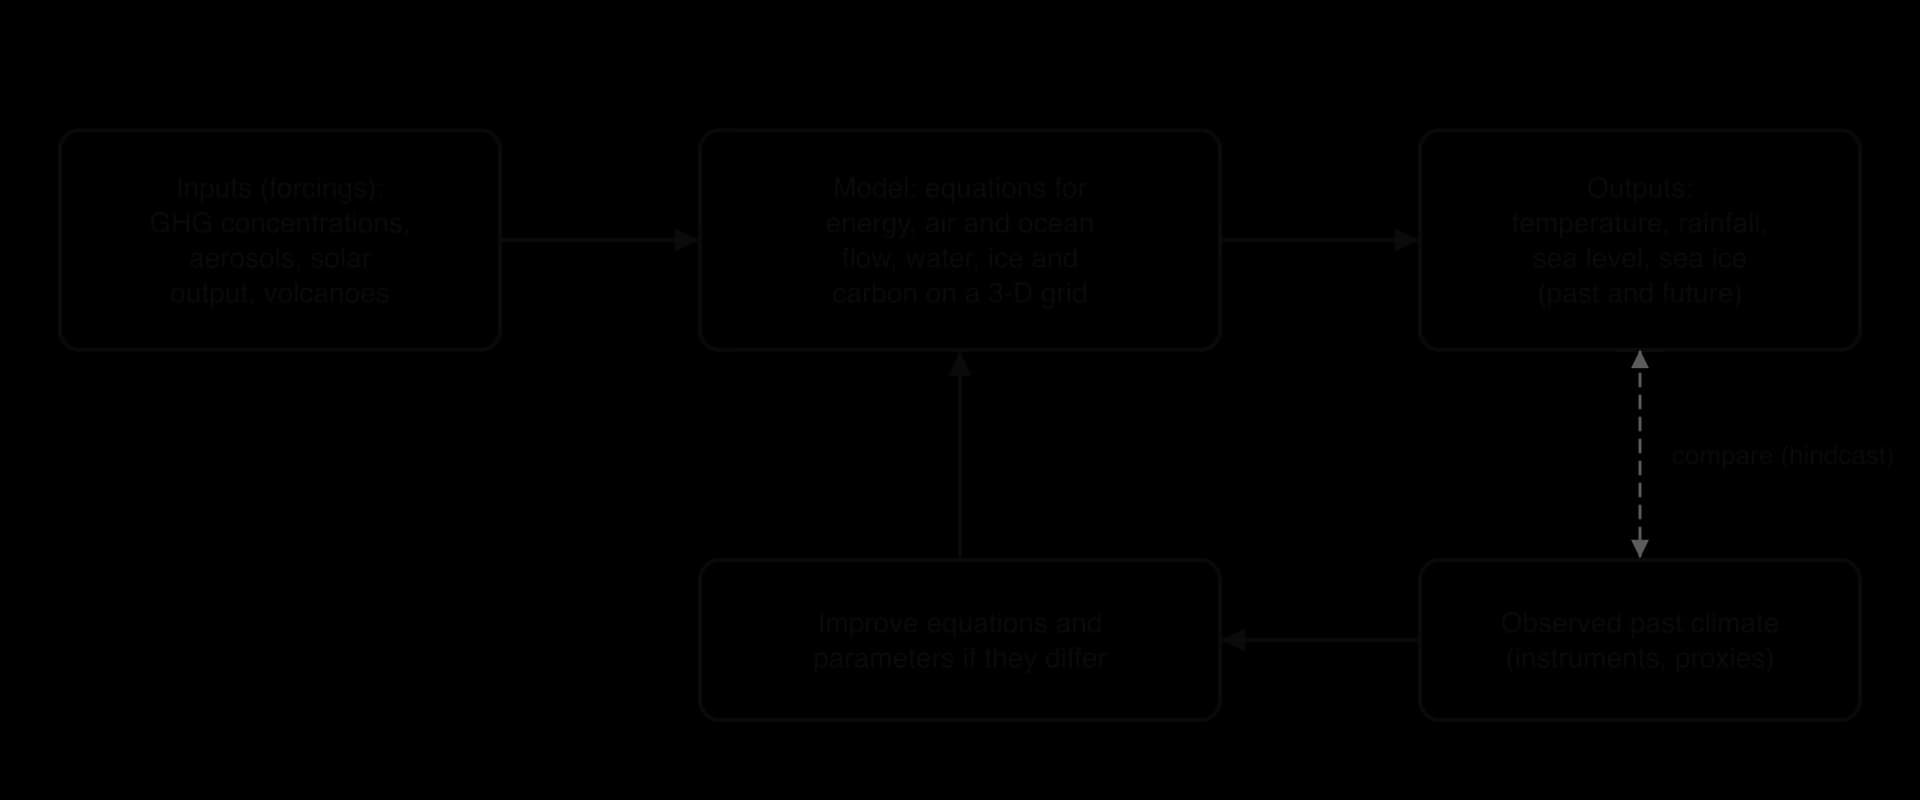
Hindcasting checks a model's validity by running it over the past, where the answer is already known. If a model starting in 1850, given the real record of greenhouse gases, aerosols, solar changes and volcanic eruptions, reproduces the observed rise in temperature, its equations are likely to capture the main processes. The CMIP6 models assessed by the IPCC in 2021 reproduced the observed global temperature change since 1850 to within about 0.2 °C for most of the period. Models that include volcanic aerosols also reproduce the short global cooling of a few tenths of a degree after the eruption of Mount Pinatubo in the Philippines in 1991.
Hindcasts provide strong evidence about the causes of warming. Model runs with only natural forcings show little warming since 1950 and cannot reproduce the observed rise; runs that include human greenhouse gas emissions match it. This is one of the main reasons the IPCC concluded that human influence is unequivocally responsible for recent warming.
Uncertainty in model outputs
Model outputs are given as ranges, not single numbers, because uncertainty enters at several points:
Uncertain inputs. Past forcings, especially aerosols, and proxy data used to set starting conditions have their own uncertainties. Future inputs depend on human choices that cannot be known.
Uncertain processes. Clouds, ice-sheet behaviour and some carbon-cycle feedbacks, such as permafrost thaw, are not fully understood or are simplified. The IPCC noted that the CMIP6 models show a wider range of climate sensitivity than its own best assessment, largely because of differences in cloud feedback.
Natural variability. Events such as El Niño cause year-to-year swings that no model can predict exactly decades ahead.
Resolution. Grid boxes are too large to capture local features such as small islands, mountain valleys or individual storms, so regional projections are less certain than global ones.
To manage this, scientists run many different models from many research centres, and the same model many times with slightly different starting conditions. The spread of results gives a range of possible futures. Agreement between independent models increases confidence; disagreement shows where research is needed.
Strengths of climate models | Limitations of climate models |
|---|---|
Based on physical laws, not just on extending past trends | Simplify small-scale processes (clouds, ice-sheet dynamics) through parameterisation |
Tested by hindcasting against observed climate since 1850 and against past climates from proxies | Cannot predict human choices, so must use scenarios |
Allow controlled experiments impossible on the real Earth (for example, removing human forcings) | Regional and local projections, especially of rainfall, are less reliable than global temperature |
Many independent models give a range and a measure of confidence | Some feedbacks and tipping points (permafrost, ice sheets) are poorly represented or missing |
Sources: IPCC AR6 WGI SPM, Box SPM.1 and Figure SPM.1 (2021); Wikipedia, "1991 eruption of Mount Pinatubo" (2026).
Scenarios and projected impacts (HL only)
Because future emissions depend on human decisions, models are run under a set of emissions scenarios rather than one forecast. The IPCC's Sixth Assessment Report used five illustrative Shared Socioeconomic Pathways (SSPs), from very low emissions (SSP1-1.9, reaching net zero CO₂ around 2050) to very high emissions (SSP5-8.5). Each scenario produces a different range of outcomes.
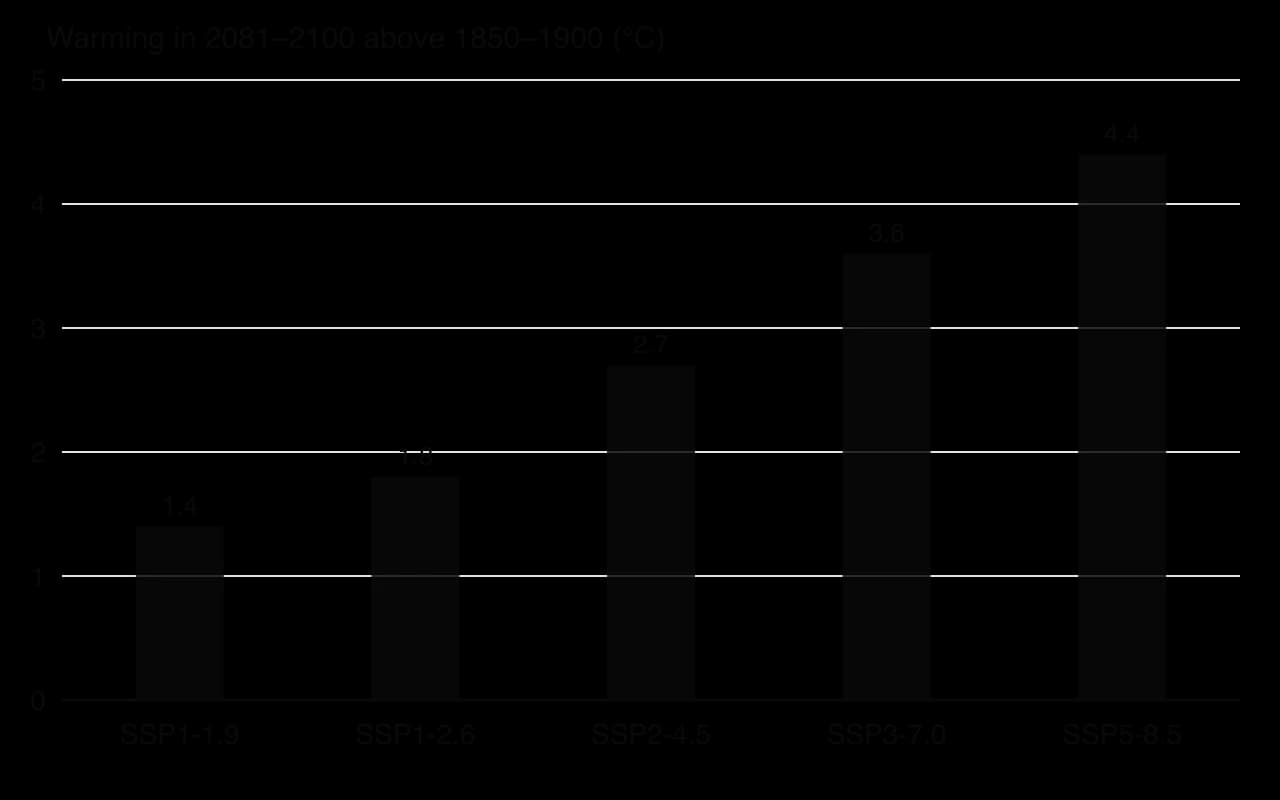
The scenarios show that warming over the next 20 years is similar under all paths (about 1.5–1.6 °C in 2021–2040), because of past emissions and the slow response of the ocean. The paths diverge strongly after 2050. Under the intermediate scenario (SSP2-4.5), 2 °C would extremely likely be exceeded during the 21st century; under the very low scenario (SSP1-1.9) it is extremely unlikely.
Projected sea-level rise
Scenario | Likely global mean sea-level rise by 2100 (relative to 1995–2014) |
|---|---|
SSP1-1.9 (very low emissions) | 0.28–0.55 m |
SSP1-2.6 (low) | 0.32–0.62 m |
SSP2-4.5 (intermediate) | 0.44–0.76 m |
SSP5-8.5 (very high) | 0.63–1.01 m |
A rise approaching 2 m by 2100 cannot be ruled out under very high emissions because of deep uncertainty in how the Antarctic ice sheet will behave. Sea level will keep rising for centuries even after warming stops, because the deep ocean continues to warm and ice sheets continue to melt: about 2–3 m over the next 2,000 years if warming is limited to 1.5 °C, and 19–22 m with 5 °C. For low-lying nations such as the Maldives, Kiribati and Tuvalu, where most land is only a few metres above sea level, the scenario followed may decide whether adaptation remains possible or whether islands have to be abandoned.
Projected extremes and local change
Changes in extremes matter more for people and ecosystems than changes in the global average. The IPCC compared how often an extreme event that occurred once in 10 years in 1850–1900 would happen at different levels of global warming.
A "once in 10 years" event in 1850–1900 | At present (about 1 °C) | At 1.5 °C | At 2 °C | At 4 °C |
|---|---|---|---|---|
Hot temperature extreme over land | 2.8 times as often | 4.1 times | 5.6 times | 9.4 times |
Heavy one-day rainfall over land | 1.3 times | 1.5 times | 1.7 times | 2.7 times |
Agricultural and ecological drought in drying regions | 1.7 times | 2.0 times | 2.4 times | 4.1 times |
Warming is also uneven. Land warms faster than the ocean, and the Arctic warms fastest of all. Rainfall is projected to increase in high latitudes and in many monsoon regions but to decrease in some subtropical regions such as the Mediterranean, so the same global scenario means very different local futures.
Carbon budgets
The models show a near-linear relationship between total CO₂ emitted and the warming it causes: each 1,000 billion tonnes of CO₂ adds a best estimate of about 0.45 °C. This means a temperature limit corresponds to a fixed carbon budget. From the start of 2020, the IPCC estimated a remaining budget of 500 billion tonnes of CO₂ for a 50% chance of keeping warming to 1.5 °C. Between 1850 and 2019 humanity had already emitted about 2,390 billion tonnes.
Sources: IPCC AR6 WGI SPM, B.1, B.2.2, B.5, D.1 and Tables SPM.1–SPM.2 (2021); Global Carbon Project via Our World in Data (2025).
Thresholds and tipping points in the climate system (HL only)
Most climate impacts grow gradually as warming increases. Some parts of the Earth system, however, can change abruptly. A tipping point is the critical threshold at which a small extra change pushes a system out of one stable state and into another, often through positive feedback. In the climate system such changes may be rapid, hard to predict and difficult or impossible to reverse on human timescales. The parts of the system that can behave this way are called tipping elements.
Tipping can happen at global scale (an ice sheet or an ocean circulation) and at local scale (a lake, a forest, a single reef). The IPCC describes these as low-likelihood, high-impact outcomes whose probability rises with every increment of warming. A 2022 assessment of the scientific literature by Armstrong McKay and colleagues estimated the warming at which each element is likely to tip.
Tipping element | Change | Estimated threshold (range), °C | Timescale of change once tipped |
|---|---|---|---|
Greenland ice sheet | Collapse | 1.5 (0.8–3.0) | About 10,000 years |
West Antarctic ice sheet | Collapse | 1.5 (1.0–3.0) | About 2,000 years |
Low-latitude coral reefs | Die-off | 1.5 (1.0–2.0) | About 10 years |
Boreal permafrost | Abrupt thaw | 1.5 (1.0–2.3) | About 200 years |
Amazon rainforest | Dieback | 3.5 (2.0–6.0) | About 100 years |
Atlantic Meridional Overturning Circulation | Collapse | 4.0 (1.4–8.0) | About 50 years |
Sources: Armstrong McKay et al. (2022), via Wikipedia, "Tipping points in the climate system" (2026).
Melting of the Antarctic ice sheets
The West Antarctic Ice Sheet is in places more than 4 km thick and rests on bedrock mostly below sea level. Warm ocean water melts it from beneath where the ice meets the sea. As the grounding line, the point where the ice lifts off the bed and floats, retreats into deeper water, the ice front gets thicker and flows faster, so retreat accelerates: a positive feedback called marine ice sheet instability. If the whole ice sheet melted it would raise sea level by about 3.3 m over thousands of years.
Thwaites Glacier, the widest glacier in the world at about 120 km, is a key part of this system. Between 1992 and 2017 it retreated by 0.3–0.8 km a year and lost over 600 billion tonnes of ice, about 4% of global sea-level rise over that period. Some outlet glaciers in West Antarctica may already be close to, or beyond, the point of self-sustaining retreat.
Slowing of the Atlantic overturning circulation
The thermohaline circulation in the Atlantic depends on cold, salty surface water near Greenland becoming dense enough to sink. Warmer water and fresh meltwater from Greenland reduce its density, so less water sinks and the circulation slows. A slower circulation carries less salty tropical water north, which reduces sinking further: a positive feedback that could lead to a threshold. Reconstructions suggest the AMOC has weakened since the mid-20th century, but how much is due to climate change rather than natural variability is debated.
Scientists disagree about how close the threshold is. The IPCC has medium confidence that the AMOC will not collapse abruptly before 2100, but some recent studies of early-warning signals, and the Global Tipping Points Report 2025, warn that collapse may be possible below 2 °C of warming. If it did collapse, the IPCC expects a southward shift of the tropical rain belt, weaker African and Asian monsoons and drying and much colder winters in Europe.
The Amazon rainforest–Cerrado transition
The Amazon rainforest produces about half of its own rainfall: water transpired by trees is carried west by the winds and falls again as rain further inland. Deforestation and warming reduce this moisture recycling, lengthen the dry season and make fires more likely. Fires and drought kill rainforest trees, which reduces transpiration and rainfall further. Past a threshold, large parts of the forest could shift to a drier, more open vegetation resembling the Cerrado, the tropical savanna of central Brazil, or to degraded scrub.

Warming alone may need 3.5–4 °C to trigger large-scale dieback, but combined with deforestation the threshold could be much lower. One modelling study found that 1.5–1.9 °C of warming combined with 22–28% deforestation could trigger a near-system-wide transition across 62–77% of the forest; about 17–18% of the Amazon has already been cleared. Dieback would release large amounts of stored carbon, adding to global warming.
Tipping points are also crossed in local systems. The repeated mass bleaching of the Great Barrier Reef is an example: when heatwaves return before corals can recover, a reef dominated by living coral can shift to one dominated by algae and rubble. The Global Tipping Points Report 2025 concluded that, with global warming already at about 1.4 °C, warm-water coral reefs are crossing their thermal tipping point.
Sources: IPCC AR6 WGI SPM, B.5.2 and C.3.4 (2021); Global Tipping Points Report (2025); Wikipedia, "Thwaites Glacier", "Atlantic meridional overturning circulation" and "Tipping points in the climate system" (2026).
Tipping cascades (HL only)
Tipping elements are connected through the ocean, the atmosphere and the carbon cycle, so tipping one can push others closer to their thresholds. Some of the links are physical and some are biological, and the elements themselves can be abiotic (ice sheets, ocean currents), biotic (coral reefs, forests) or both (permafrost, where microbes release carbon from frozen soil).
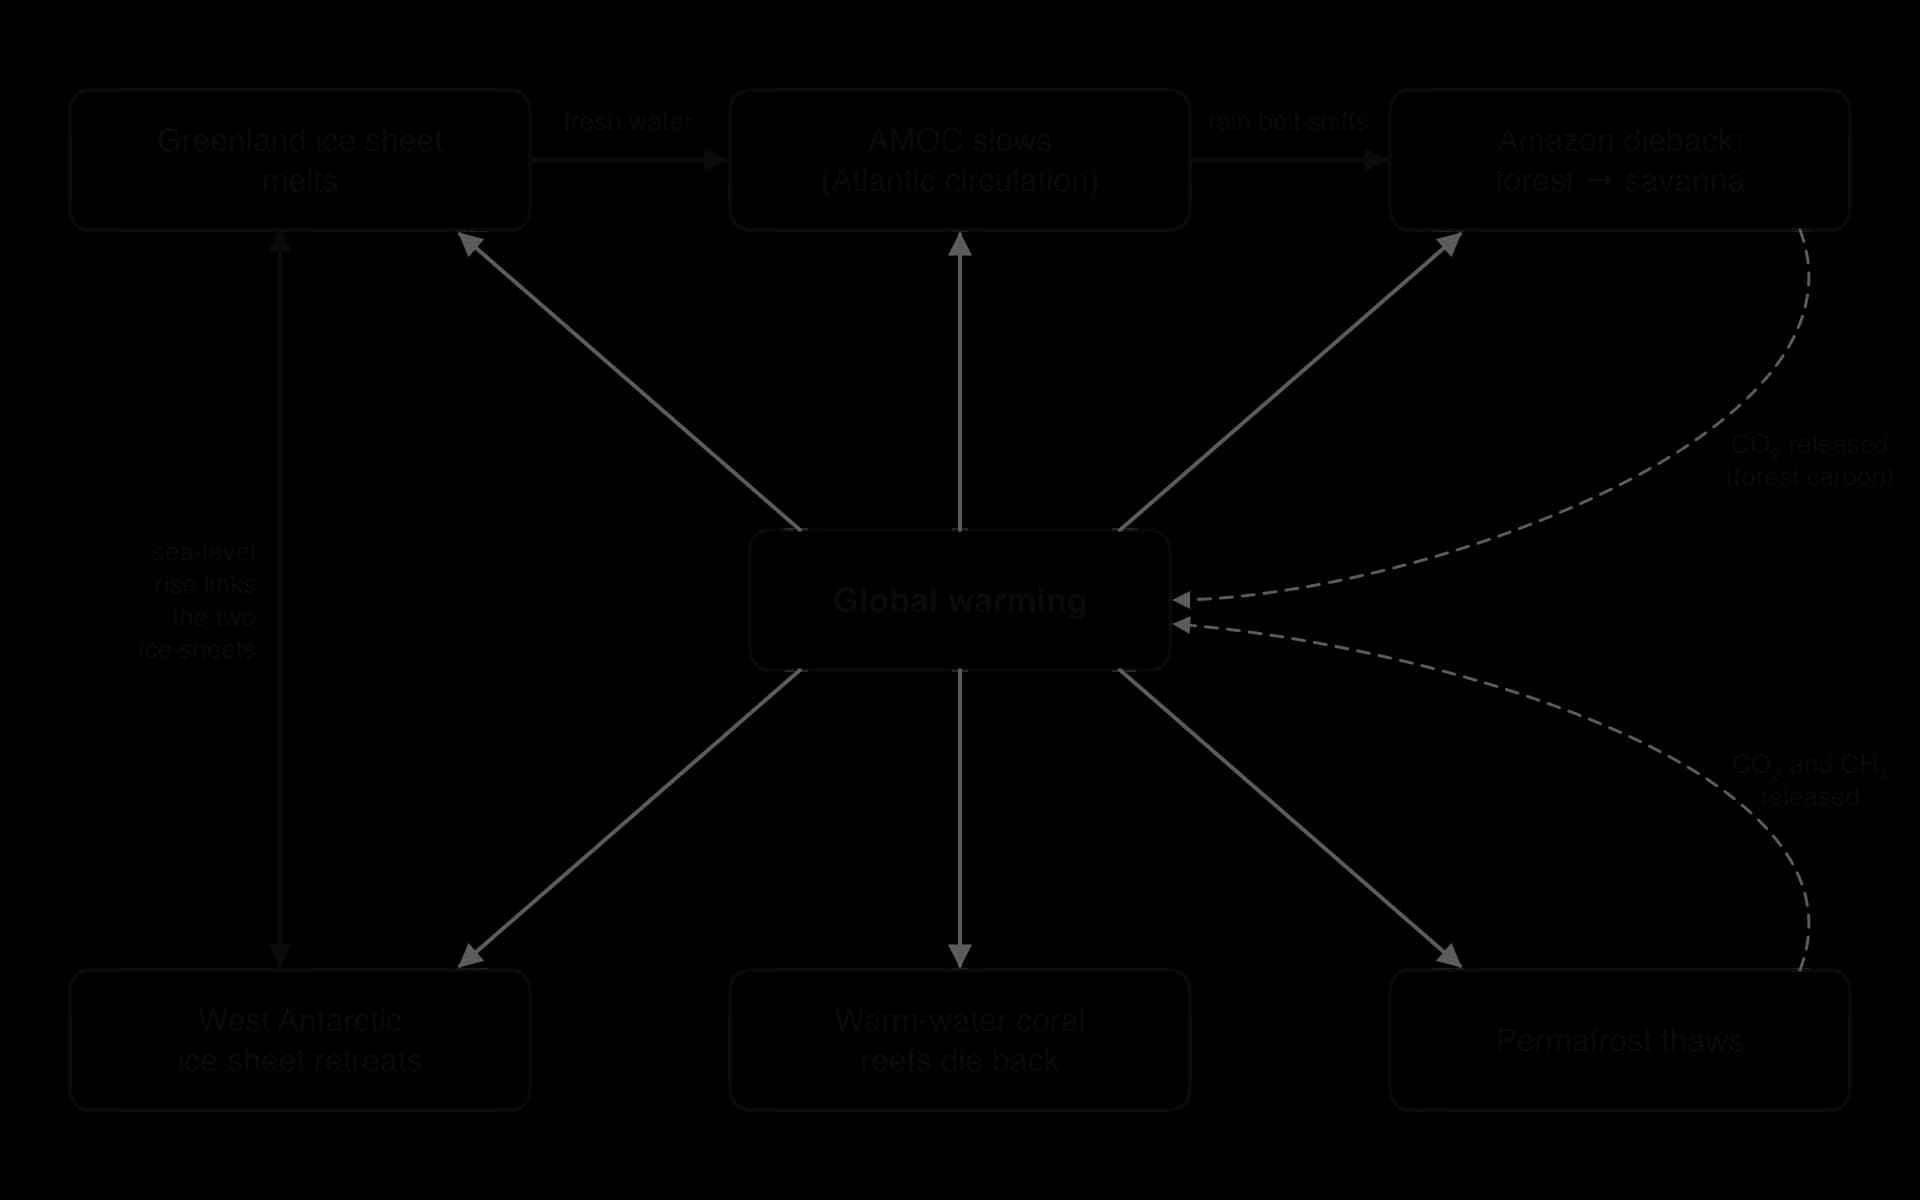
Greenland → AMOC. Meltwater from Greenland freshens the North Atlantic, making a slowdown or collapse of the AMOC more likely.
AMOC → Amazon and monsoons. A weaker AMOC would shift the tropical rain belt southwards, which could change rainfall over the Amazon and weaken the West African and Asian monsoons.
Greenland ↔ West Antarctica. Ice loss from either ice sheet raises sea level, which helps warm water undercut the grounding lines of the other.
Amazon and permafrost → global warming. Forest dieback and permafrost thaw release CO₂ and methane, which raises global temperature and pushes all the other elements closer to their thresholds.
Because of these interactions, the overall response of the climate system could be larger and faster than the sum of its parts. A 2021 study using about three million computer simulations of a simplified climate model found that nearly one-third produced domino effects even when warming was limited to 2 °C. Overshooting a temperature target, even temporarily, was found to increase the risk.
The science of cascades is young and uncertain. Thresholds are estimated with wide ranges, the strength of the links between elements is poorly known, and many of the processes are missing from the main climate models. Some scientists argue that cascades justify the strongest possible action under the precautionary principle; others caution that presenting them as likely, rather than possible, can lead to fatalism. Both groups agree that the risk rises with every increment of warming, and that limiting warming keeps more elements on the safe side of their thresholds.
 YouTube
Sources: Wikipedia, "Tipping points in the climate system" (2026), summarising Wunderling et al. (2021) and Armstrong McKay et al. (2022).
Responsibility, vulnerability and climate justice (HL only)
Countries differ greatly in how much they have contributed to climate change and in how badly they are affected by it. Responsibility can be measured in several ways, and each gives a different picture.
Current annual emissions. In 2024 China emitted about 32% of the world's fossil CO₂, the USA about 13% and India about 8%.
Cumulative emissions since 1750. Because CO₂ stays in the atmosphere for centuries, past emissions still cause warming today. By this measure the USA is responsible for about 23.5% of all fossil CO₂ emitted, China 15.4%, Russia 6.6%, the UK 4.3% and India 3.6%. The whole of Africa has emitted 2.9%. High-income countries together account for about 62% of cumulative emissions; low-income countries for under 1%.
Emissions per person. In 2024 an average person emitted about 14.2 tonnes of CO₂ in the USA, 8.7 t in China, 2.2 t in India, 0.7 t in Pakistan and 0.1 t in Niger; the world average was 4.7 t. Some oil- and gas-producing states have far higher figures, such as Qatar at 41.3 t.

Inequality within countries is also large. A 2020 report by Oxfam and the Stockholm Environment Institute found that the richest 1% of the world's population caused about 15% of cumulative emissions between 1990 and 2015, twice as much as the poorest 50% (7%).
Sources: Global Carbon Project via Our World in Data (2025); Oxfam and SEI (2020) via Wikipedia, "Climate justice" (2026).
The least responsible are often the most vulnerable
Climate vulnerability is often highest where responsibility is lowest. Low-income countries are frequently in hot, dry or low-lying regions; their economies depend heavily on climate-sensitive farming and fishing; and they have less money for defences, insurance, health care and recovery.
Pakistan is responsible for about 0.3% of cumulative fossil CO₂ and emits less than 1% of global greenhouse gases. From June to October 2022, floods caused by unusually heavy monsoon rain, following a severe heatwave, affected 33 million people, killed 1,739 and caused about US$40 billion of damage; one study estimated that global warming made the rainfall up to 50% worse. Tuvalu, a Pacific island nation of low-lying atolls, has contributed a negligible fraction of global emissions (about 0.00002% of the cumulative total) yet faces the loss of habitable land to rising seas.
Implications for climate justice
Climate justice applies the idea of environmental justice, the fair distribution of environmental benefits and harms, to the climate. It raises three kinds of question:
Political. Who should cut emissions first and fastest? Low-income countries argue that rich countries built their wealth on fossil fuels and should lead, while rich countries point out that most growth in emissions now comes from middle-income countries such as China and India. This debate runs through every round of United Nations climate negotiations.
Economic. Who should pay for adaptation and for damage that cannot be avoided? Vulnerable countries have called for finance from those most responsible, leading to the agreement on a fund for loss and damage after the 2022 Pakistan floods.
Equity. Fairness can be judged by responsibility (who caused the problem), capability (who can afford to act) and benefit (who gained from the activities that caused it). It also has an intergenerational dimension: children born in 2020 are projected to experience many more heatwaves over their lives than people born in 1960.
Several HL lenses apply. From a legal angle, the International Court of Justice gave an advisory opinion in July 2025 on the obligations of states in respect of climate change. From an economic angle, greenhouse gas emissions are an externality whose costs fall on people who did not create them. From an ethical angle, rights-based arguments stress the rights of the most vulnerable to life, health and a home, while consequentialist arguments weigh the total harm and benefit of different ways of sharing the burden.
Group | Perspective on climate justice |
|---|---|
Small island developing states (e.g. Tuvalu) | Climate change threatens national survival; demand rapid global cuts, finance for adaptation and compensation for loss and damage |
High-income, historically high emitters (e.g. USA, EU, UK) | Accept a leading role in cutting emissions and providing finance, but want large current emitters to act too and resist open-ended liability |
Large emerging economies (e.g. China, India) | Have the right to develop; per capita and historical emissions are lower than those of rich countries, so rich countries should act first |
Fossil-fuel exporting states (e.g. Qatar) | Economies depend on oil and gas revenue; favour gradual transition and technologies such as carbon capture |
Young people and future generations | Will bear the largest impacts of decisions made now; intergenerational equity requires fast action |
Sources: Wikipedia, "2022 Pakistan floods" and "Climate justice" (2026); Global Carbon Project via Our World in Data (2025).
Exam practice
Questions on climate change appear in both papers. Paper 2 Section A uses short-answer and data-based items: reading values from the Keeling curve or an ice-core graph, calculating rates or percentage changes, constructing feedback loops and explaining named impacts. Paper 1 presents an unseen case study, often with temperature, rainfall or emissions data for a place, and asks for interpretation and evaluation. Section B essays ask for extended discussion of causes, impacts, perspectives and, at HL, models, tipping points and justice.
Paper 2 Section A-style questions
Short "distinguish" and "explain" items reward precise terms: name the process (absorption and re-emission of infrared radiation, albedo) rather than describing it loosely.
Calculation items carry a mark for working and a mark for the answer with its unit, so every step should be written down.
Paper 1-style data question
Resource (hypothetical data for a coastal city in a tropical country, stated as such):
Decade | Mean annual temperature (°C) | Days per year above 35 °C | Mean sea level relative to 1980s (mm) |
|---|---|---|---|
1980s | 27.1 | 12 | 0 |
1990s | 27.3 | 15 | 25 |
2000s | 27.6 | 21 | 58 |
2010s | 28.0 | 30 | 98 |
2020s (to 2025) | 28.3 | 38 | 135 |
HL question
Paper 2 Section B-style essay
Summary
Climate is the typical pattern of weather over about 30 years, described by seasonal temperature and precipitation and produced by physical processes in the atmosphere.
Anthropogenic CO₂ emissions began with the Industrial Revolution and accelerated after 1950; Mauna Loa CO₂ rose from 316 ppm in 1959 to 427 ppm in 2025.
Ice cores, tree rings and sediments show a strong positive correlation between CO₂ and temperature over 800,000 years; today's CO₂ is far outside that natural range.
Anthropogenic CO₂, methane and nitrous oxide enhance the greenhouse effect, causing global warming (1.55 °C in 2024; about 1.3 °C long-term) and wider climate change.
Climate change affects ecosystems from local (coral bleaching, desertification) to global scales (sea-level rise, ocean circulation), causing biome shifts and reducing resilience.
Impacts on societies, through health, water, food and infrastructure, depend on exposure, sensitivity and the capacity to adapt, so resilience is unequal.
Systems models show the global energy balance and feedbacks: ice–albedo and methane release are positive feedbacks; increased outgoing infrared is negative.
The planetary boundary for climate (350 ppm; +1 W m⁻²) has been crossed (427 ppm in 2025; +3.10 W m⁻² in the 2026 assessment).
Perspectives on climate change vary with age, location, livelihood, culture, politics and value system.
Climate models are built on physical equations, tested by hindcasting and run under emissions scenarios that give a range of projected outcomes. (HL)
Tipping elements such as the Antarctic ice sheets, the AMOC and the Amazon can shift to new states and may interact in tipping cascades. (HL)
The least responsible countries and people are often the most vulnerable, raising political, economic and equity questions of climate justice. (HL)
Self-check
- To do:
I can outline how climate is described and how it results from atmospheric processes.
- To do:
I can describe the Keeling curve, explain its seasonal oscillation and calculate rates of change in CO₂.
- To do:
I can explain why emissions accelerated after 1950.
- To do:
I can interpret ice-core, tree-ring and sediment evidence for the link between CO₂ and temperature.
- To do:
I can explain how anthropogenic greenhouse gases enhance the greenhouse effect and cause global warming.
- To do:
I can discuss named impacts of climate change on ecosystems and societies and the factors that affect their resilience.
- To do:
I can construct systems diagrams of the global energy balance and of positive and negative feedback loops.
- To do:
I can evaluate the evidence that the planetary boundary for climate change has been crossed.
- To do:
I can analyse how different factors and value systems shape perspectives on climate change.
- To do:
I can evaluate climate models, hindcasting and emissions scenarios. (HL)
- To do:
I can explain tipping points and tipping cascades using named tipping elements. (HL)
- To do:
I can evaluate responsibility, vulnerability and climate justice using cumulative and per capita emissions. (HL)