Distinguish data from information, knowledge and wisdom, explain how data is collected, organised, represented, secured and analysed, and evaluate the dilemmas of bias, ownership, privacy and surveillance.
Each is in the Digital Society glossary, with every other term in the subject.
Processing a dataset to remove or alter personally identifiable information so that individuals can no longer be identified, directly or indirectly, by any reasonably likely means.
Datasets so large, varied and fast-changing that they cannot be stored, processed or analysed with traditional tools, and need specialised systems to extract useful information.
A digital record of transactions stored as a chain of linked blocks and copied across many computers, in which each block contains the hash of the previous one so that past entries cannot be changed without detection.
Raw facts, figures, symbols or observations that have been recorded but not yet organised or interpreted, such as a list of readings from a temperature sensor.
The process of examining data, often with software and algorithms, to find patterns, draw conclusions and support decisions.
A systematic error in data, caused by how it was collected, selected or recorded, that makes it unrepresentative of the reality or population it is meant to describe.
A company that collects personal data from many sources, such as public records, purchases and online tracking, combines it into profiles and sells them to other organisations.
Permanently removing data from a storage device so that it cannot be recovered, by overwriting it, destroying the encryption key that protects it, or physically destroying the device.
The accuracy, completeness and consistency of data throughout its life cycle, protected from unauthorised or accidental change.
The sequence of stages data passes through, from creation or collection through storage, processing, analysis and access, to preservation and reuse.
Hiding sensitive parts of a dataset by replacing real values with altered, scrambled or realistic but fake values, so the data can be used without exposing the original information.
The legal rights and practical control a person or organisation has over data, including the right to decide how it is collected, used, shared and deleted.
The right of individuals to control how information about them is collected, used, stored and shared, and the practices that protect that right.
The extent to which data is accurate, consistent and from a trustworthy source, so that it can be depended on.
The measures used to protect data from unauthorised access, alteration, theft or loss, so that it stays confidential, accurate and available.
The representation of data in a visual form, such as a chart, map or interactive dashboard, so that patterns and relationships can be seen and understood quickly.
An organised, structured collection of data stored electronically, usually managed by software that allows users to search, add, update and delete the data.
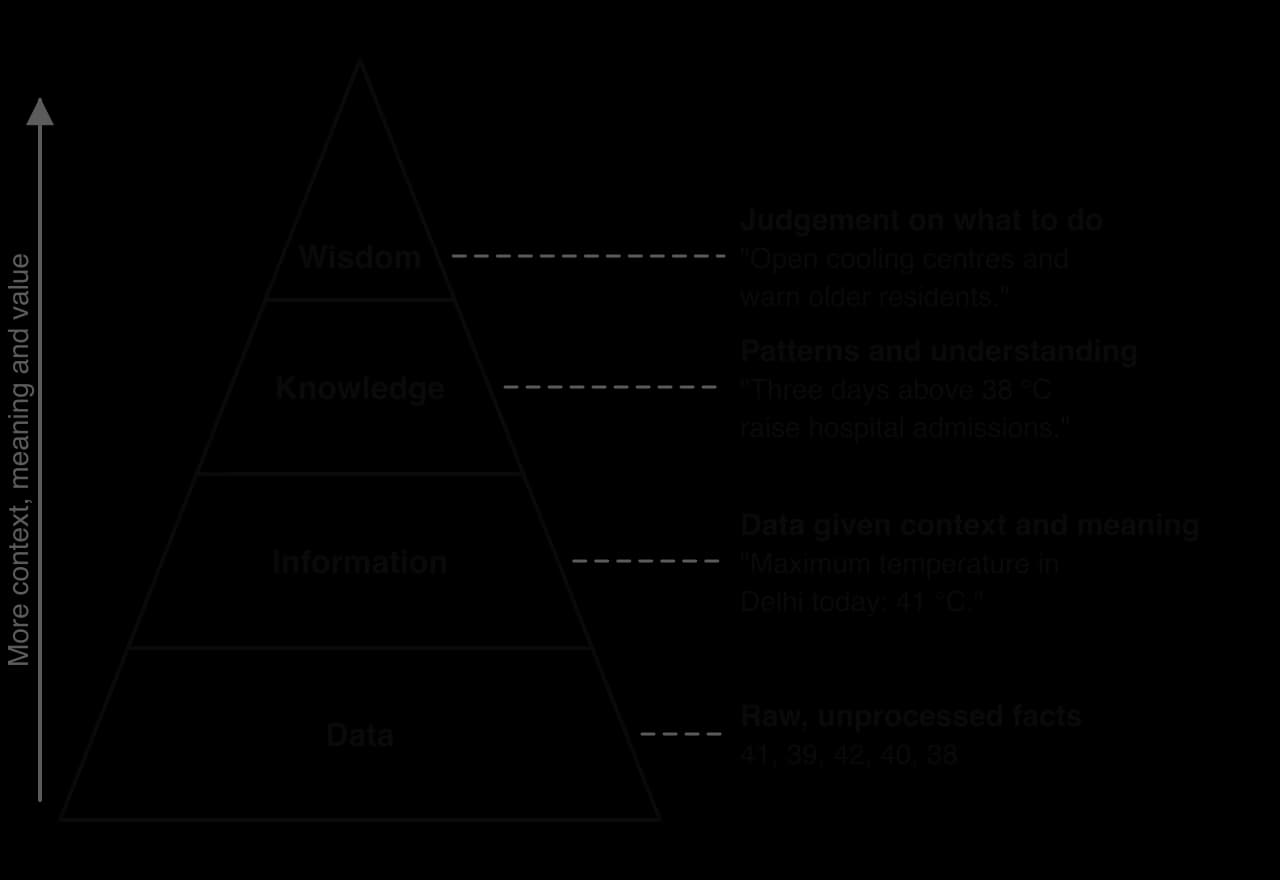
A model that arranges data, information, knowledge and wisdom in four layers, each built from the one beneath it and adding context, meaning and judgement.
Converting readable data (plaintext) into an unreadable form (ciphertext) using an algorithm and a key, so that only someone with the correct key can convert it back.
One column of a database table, holding one attribute that every record has, such as a name or a date of birth.
A field in one database table that holds the primary key of a record in another table, creating a link (relationship) between the two tables.
The European Union's data protection law, in force since May 2018, which sets rules for handling the personal data of people in the EU and gives them rights such as access and erasure.
A function that turns any input into a short, fixed-length string (a hash) that acts as a fingerprint of the data: the same input always gives the same hash, while any change to the input gives a completely different one.
A visual presentation that combines charts, images, icons and brief text to communicate information or a message quickly to a broad audience.
Data that has been organised, processed and given context so that it has meaning for a person or a system.
Agreement to the collection and use of one's data, given freely by a person who understands what data will be collected, how it will be used and who it will be shared with.
Understanding gained from information through experience, study or analysis, which allows a person to explain patterns and make predictions.
Data that describes other data, such as the date a file was created, its author, its size or the location where a photo was taken.
Any data that can be used to identify a particular individual, either directly, such as a name or ID number, or indirectly when combined with other data, such as date of birth, postcode and gender.
The use of statistical models and algorithms on historical and current data to estimate the likelihood of future outcomes or behaviour.
Data collected first-hand by the person or organisation that will use it, for a specific purpose, for example through a survey, interview or observation.
A field, or combination of fields, whose value is unique for each record in a table, so that every record can be identified unambiguously.
Descriptive, non-numerical data about qualities, opinions or experiences, such as interview answers, written reviews or images.
Data that can be counted or measured and expressed as numbers, such as age, income, temperature or the number of followers an account has.
Linking records in a supposedly anonymous dataset back to the real people they describe, usually by matching them with other available data.
One row of a database table, holding all the data about a single item, such as one student or one transaction.
A database that stores data in tables of records and fields and links the tables through shared key values.
Data that was collected by someone else, often for a different purpose, and is reused, such as census tables or published research.
Data organised in a predefined format, such as the fields of a table, so that it can be searched and processed easily.
The systematic monitoring of people's behaviour, communications or movements, usually by governments or organisations, to gather information, influence behaviour or exercise control.
Data without a predefined format, such as free text, emails, images, audio and video.
The many types and formats of data in big data, structured and unstructured, drawn from many different sources.
The speed at which big data is generated and must be processed, often in real time.
The degree to which big data is accurate, complete and trustworthy; because it comes from many uncontrolled sources, its veracity is often uncertain.
The very large amount of data in big data, measured in terabytes, petabytes or more.
The ability to apply knowledge with good judgement, weighing values, consequences and long-term effects, to decide what action is right.
Distinguish between data, information, knowledge and wisdom, using the DIKW pyramid.
Identify types of data, including quantitative and qualitative data, data from different domains and metadata.
Outline the uses of data and describe the stages of the data life cycle.
Distinguish between primary and secondary data collection, and explain how databases organise data through classifications and relationships.
Describe ways of representing data and evaluate how well a representation communicates.
Explain how encryption, data masking, data erasure and blockchain protect data.
Describe the characteristics of big data and explain how data analytics is used to model and predict human behaviour.
Discuss the dilemmas of data bias, reliability, integrity, ownership, access, privacy, anonymity and surveillance for people and communities.
Data is the raw material of every digital system: each search, payment, step count and photo is recorded as data, stored and processed, and often combined with other data to make decisions about people. Understanding what data is, how it is handled and who controls it explains a large part of how digital society works and why it raises so many ethical questions.
Data underpins the rest of the content topics. Algorithms (3.2) process it, computers (3.3) store it, networks (3.4) move it, and artificial intelligence (3.6) learns from it. It is examined through every concept, most often power (who owns and controls data), identity (how data represents a person), values and ethics (what is fair to collect) and systems (how data flows between organisations). It appears in every context, from health records (4.4) and credit scores (4.2) to election campaigns (4.6).
With a free account, Augment remembers where you stopped and what you have practiced.
In everyday speech, "data" and "information" are often used as if they mean the same thing. In digital society the two are kept apart. Data is the recorded material; information is what that material means once it has been organised and placed in context.
A single value such as 41 is data. On its own it could be an age, a shoe size or a temperature. In a digital system it is stored as a pattern of binary digits, and the system cannot "know" what it refers to until a person or a program attaches context.
The DIKW pyramid is a model that arranges data, information, knowledge and wisdom in four layers. It is usually attributed to the systems theorist Russell Ackoff, who described the hierarchy in 1989. Each layer is built from the one beneath it, and each step upwards adds context, meaning and human judgement. The layers become smaller towards the top because large amounts of data are condensed into smaller amounts of information, knowledge and wisdom.
The heat example in the pyramid shows the four layers in action:
Data: a weather station records daily maximum temperatures of 41, 39, 42, 40 and 38.
Information: once the numbers are labelled with a place, a date and a unit, they become "the maximum temperature in Delhi today was 41 °C". Information answers questions such as who, what, where and when.
Knowledge: when information from many days is compared with hospital records, a pattern appears: several consecutive days over 38 °C are followed by a rise in admissions. Knowledge answers how and why.
Wisdom: using that knowledge, city officials decide to open cooling centres and send warnings to older residents before the next heatwave. Wisdom is about what should be done, and it involves values as well as facts.
Knowledge and wisdom are harder to define precisely. Knowledge is understanding gained from information through experience, study or analysis, which allows a person to explain and predict. Wisdom is the ability to apply knowledge with good judgement, weighing values, consequences and long-term effects, to decide what action is right.
The DIKW pyramid is a simplification. Critics point out that the boundaries between layers are blurred: one person's knowledge is another person's data. A doctor's diagnosis (knowledge for the doctor) becomes a single data point in a national health database. The model also suggests a one-way path upwards, whereas in practice knowledge shapes which data is collected in the first place.
Through the concept of values and ethics, the top of the pyramid is the most contested layer. Two governments with the same knowledge may decide differently because they weigh cost, freedom and protection differently. The model is still useful as a reminder that more data does not automatically mean better decisions.
Data can be classified in several ways at once. Three ways of classifying data are especially useful: by its form (quantitative or qualitative), by its organisation (structured or unstructured) and by its domain (the area of life it describes).
Quantitative data can be analysed with mathematics and statistics: averages, trends and correlations. It may be discrete (counted in whole units, such as the number of messages sent) or continuous (measured on a scale, such as height or time spent online).
Qualitative data describes qualities, opinions, experiences and categories that are not naturally expressed as numbers. Interview transcripts, product reviews, photos, social media posts and answers to open questions such as "Why did you stop using the app?" are all qualitative. It is rich in detail and context but harder to analyse at scale, which is one reason natural language processing (3.6) has become valuable.
Quantitative data | Qualitative data | |
|---|---|---|
Form | Numbers | Words, images, sounds, categories |
Strength | Comparable, easy to analyse statistically, good for spotting patterns | Explains reasons and meanings, captures experiences numbers miss |
Limitation | Shows what happens but rarely why | Hard to compare, time-consuming to analyse, open to interpretation |
Example (a music streaming service) | Number of times a song is skipped in its first 30 seconds | A listener's written review explaining why the song felt repetitive |
Many inquiries combine both types (mixed methods), for example measuring how long students spend on a learning platform and interviewing them about why they stop watching lessons.
Structured data is organised in a fixed format, usually rows and columns, such as a bank's transaction list. Unstructured data has no predefined format: emails, voice notes, videos and social media posts. Much of the data organisations hold is unstructured, which is why tools that process text, images and audio are valuable.
Data is also described by the area of life it comes from. The domains in the table overlap: a GPS trace from a bus is both transport data and geographical data.
Domain | What it records | Real-world example |
|---|---|---|
Cultural | Artworks, languages, traditions, heritage, cultural participation | Europeana gives online access to tens of millions of digitised items from European museums, libraries and archives |
Financial | Transactions, prices, income, credit and debt | Stock exchange prices; mobile money transfer records; credit histories held by credit reference agencies |
Geographical | Location, land use, borders, terrain | OpenStreetMap, a map of the world built and edited by volunteers |
Medical | Health records, test results, prescriptions, genetic data | Electronic health records in national health services; data from wearable heart-rate monitors |
Meteorological | Temperature, rainfall, wind, air pressure | Weather station, satellite and ocean buoy readings fed into forecasting models |
Transport | Journeys, traffic flows, timetables, vehicle locations | Transport for London publishes live arrival and journey data that apps such as Citymapper use |
Scientific | Measurements and observations from research | Particle collision data from CERN's Large Hadron Collider; genome sequences |
Statistical | Data collected and summarised to describe populations | National censuses; World Bank development indicators |
The domain matters because it shapes the rules and risks attached to the data. Medical data is among the most sensitive kinds, so most data protection laws give it extra protection. Meteorological data, by contrast, is widely shared between countries because forecasting depends on observations from across the globe.
Metadata is often summarised as "data about data". A digital photo contains the image itself and a hidden block of metadata (the EXIF data), which can include the camera model, the date and time and, on many smartphones, GPS coordinates. A phone call produces metadata about who called whom, when and for how long, even if its content is never recorded.
Metadata makes data searchable and manageable: library catalogues and search engines depend on it. It also exposes more than users often expect. In 2012 the magazine Vice published a photo of the technology entrepreneur John McAfee, who was avoiding police questioning; the image's GPS metadata placed him in Guatemala, and he was located shortly afterwards.
Through the concept of identity, patterns of whom a person contacts, where they go and when they are online can describe that person in great detail, which is why bulk collection of metadata is a common form of surveillance.
People and organisations collect data because it helps them understand the world and make decisions. Two broad uses stand out: finding trends, patterns, connections and relationships, and recording measurable facts about people and communities.
These four words describe different things that analysis can find:
A trend is a general direction of change over time, such as the steady rise in the share of the world's population using the internet.
A pattern is a regularity that repeats, such as peaks in electricity demand every evening or in online shopping before festivals.
A connection links separate items, such as two social media accounts that share the same followers, or customers who buy one product and then another.
A relationship describes how one variable changes with another, such as the link between hours of sleep and test performance.
Retailers use connections between items to recommend products, public health agencies look for patterns in illness reports to detect outbreaks early, and climate scientists identify long-term trends invisible in a single year's readings.
Governments and researchers collect data to describe populations: how many people live in an area, their ages, jobs, languages, health and access to services. This data decides where schools, clinics and roads are built.
A national census is the clearest example. Kenya's 2019 census was the country's first to be collected digitally: enumerators recorded answers on tablets instead of paper, so results could be checked and processed faster. It counted about 47.6 million people and guides how funds are shared between counties.
Through the concept of power, measurable facts are never neutral. What is counted, and what categories are offered (for example the options for ethnicity, gender or disability), shapes which groups become visible to policymakers. Communities that are undercounted, such as people without fixed addresses, can lose access to resources as a result.
The data life cycle describes the stages that data passes through from the moment it is created until it is preserved, reused or deleted. Thinking in terms of a life cycle helps organisations handle data responsibly at each stage.
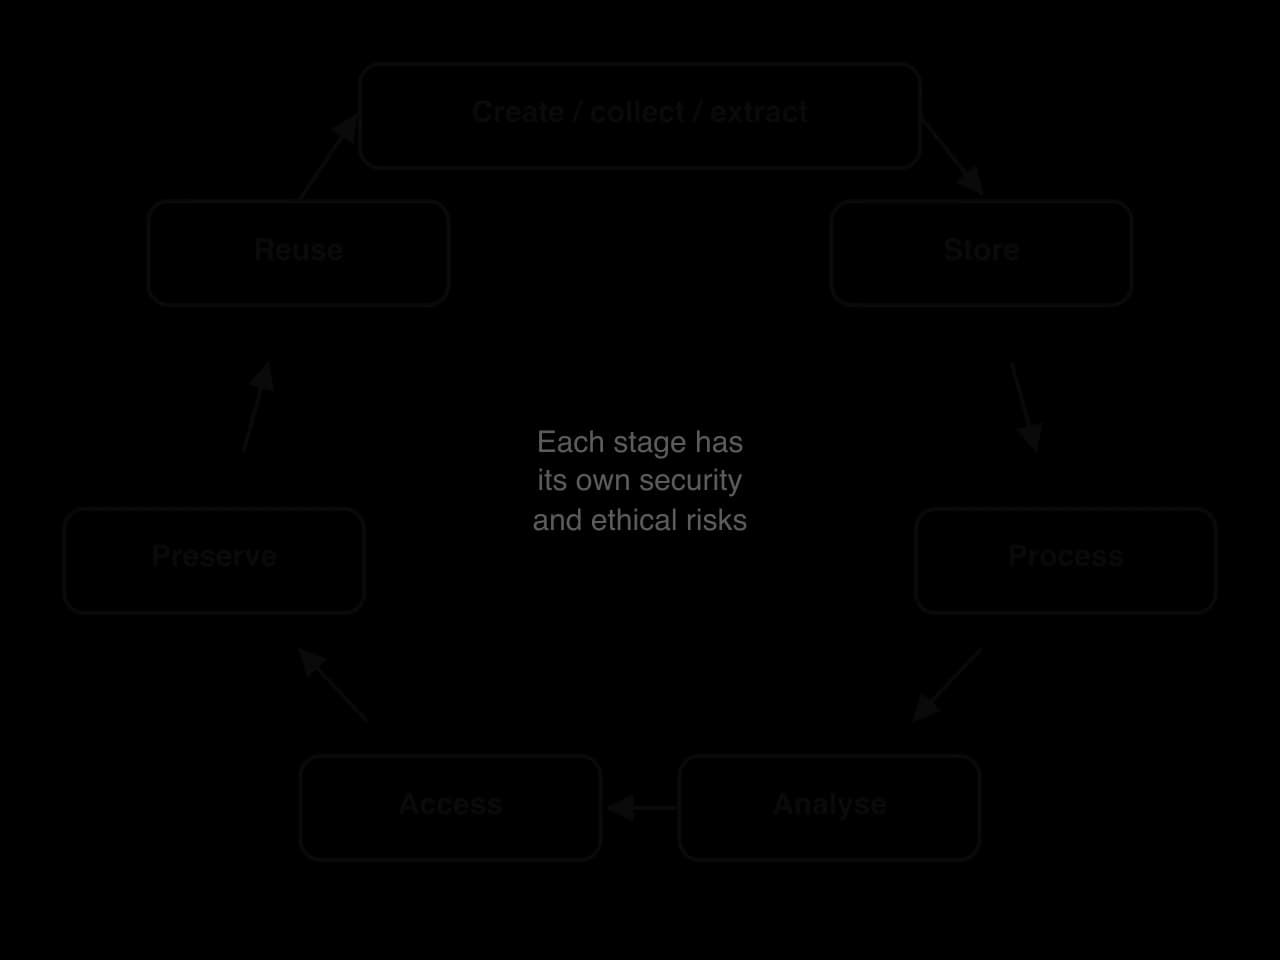
The stages in the cycle diagram can be followed through a single real-world example: data from a city's bike-sharing scheme.
Stage | What happens | Bike-sharing example | Typical risk |
|---|---|---|---|
Create / collect / extract | Data is generated by people or devices, gathered from sources, or extracted from existing records | Each bike's GPS unit records start and end points; the app records the user's account and payment | Collecting more than is needed |
Store | Data is saved on a medium: a local drive, a server or the cloud | Journey records are saved in the operator's cloud database | Breaches; loss through hardware failure |
Process | Data is cleaned, sorted, converted and combined into a usable form | Duplicate records removed; times converted to a standard format; journeys linked to stations | Errors introduced while cleaning |
Analyse | Patterns and relationships are found | Analysts identify the busiest routes and times | Biased or misleading conclusions |
Access | Data or results are made available to those with permission | Planners view a dashboard; a summary is published as open data | Unauthorised access; re-identification |
Preserve | Data is archived for the long term | Yearly totals are kept for future planning | Formats becoming obsolete |
Reuse | Data is used again, often for a new purpose | Researchers use the archive to study how cycling changed after new bike lanes opened | Use for purposes people did not agree to |
Extract means taking data out of an existing source, such as scraping prices from websites. Preserve differs from storing: it means keeping data usable for decades by migrating it to new formats as old ones become obsolete (3.5). Reuse raises the most ethical questions, because data collected to run a service may later train an AI model, be sold or be shared with police, uses the original users never imagined.
Some versions of the life cycle add a final stage, destroy or delete, for data that should no longer be kept. Data protection laws require organisations to keep personal data only as long as necessary, so planned deletion is part of handling data responsibly.
Through the concept of systems, the life cycle shows that data rarely stays inside one organisation. A fitness record may be collected by a watch maker, stored by a cloud provider and analysed by an insurer, so responsibility is shared and often unclear.
Primary data collection includes surveys, interviews, observations, experiments and readings from sensors that the researcher controls. A school that sends a questionnaire to students about their screen time is collecting primary data. Secondary data includes government statistics, published research, company reports, news archives and open datasets. A student who uses ITU figures on internet access for an inquiry is using secondary data.
Primary data | Secondary data | |
|---|---|---|
Examples | Own survey, interview, observation, app usage logs collected by the organisation itself | Census tables, World Bank indicators, academic studies, datasets downloaded from a government portal |
Advantages | Fits the exact question; collector knows how it was gathered; up to date | Quick and cheap; often large scale; allows comparison across countries and years |
Disadvantages | Expensive and slow; usually small samples; collector's bias can shape questions | May not fit the question; definitions and methods may be unclear; may be out of date |
Questions to ask | Is the sample representative? Are the questions neutral? | Who collected it, why and how? Has it been changed since? |
Digital systems blur the line: a platform's primary data about its users becomes secondary data for any company that buys it. Collection also varies in visibility. A survey is obvious; tracking cookies and a smart speaker's voice logs are not.
A database is an organised collection of data, stored electronically, that is designed so that data can be found, managed and updated efficiently.
Databases make data:
accessible: users can search for exactly the records they need, such as all patients prescribed a particular medicine;
manageable: rules ensure that every record has the same structure and that data is stored once rather than copied in many places;
capable of being updated: a change, such as a new address, is made in one place and is immediately reflected everywhere that record is used.
Most databases used by organisations are relational. A relational database stores data in tables, and links tables through shared values. Each table holds data about one kind of thing, such as students, classes or payments.
A record is one row of a table: all the data about one item, such as one student.
A field is one column: one attribute that every record has, such as a name or a date of birth.
A primary key is a field whose value is unique for every record, such as a student ID number, so that each record can be identified without confusion.
A foreign key is a field in one table that holds the primary key of a record in another table, creating a link between them.
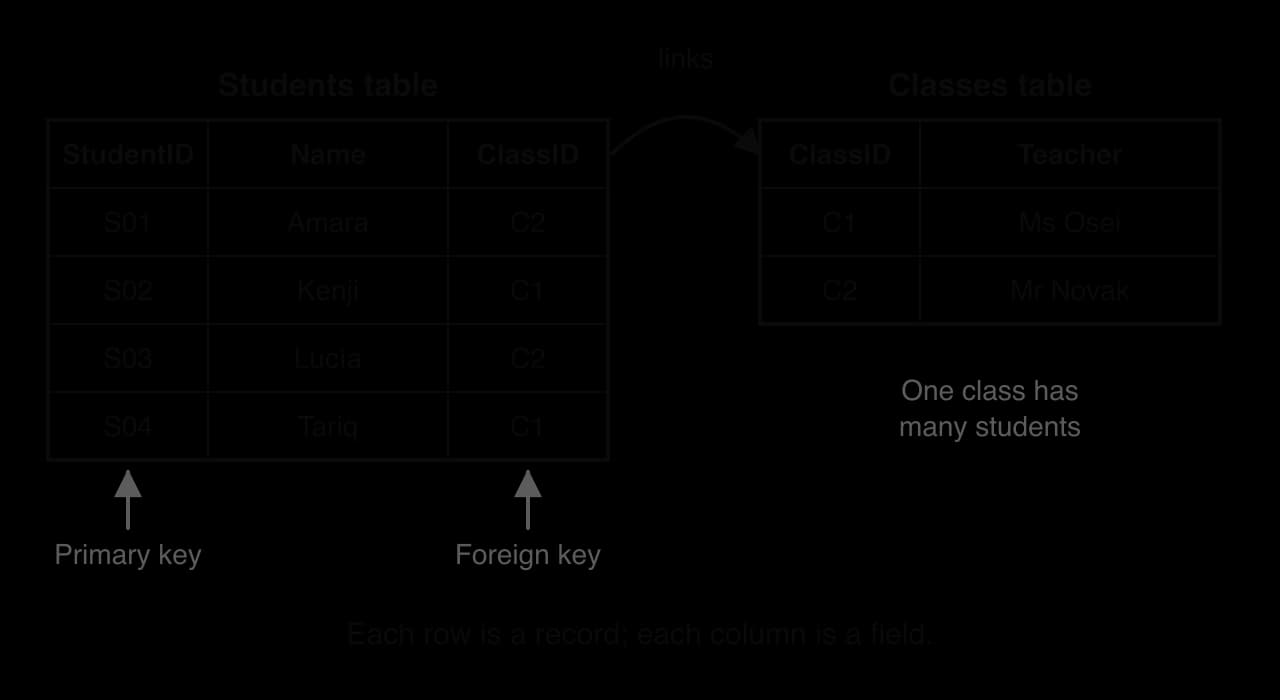
The structure in the diagram prevents inconsistency. If Mr Novak changes his name, only one record in the Classes table needs updating; in a single spreadsheet the name would be repeated for every student in his class, and a missed copy would leave the data inconsistent.
Data is retrieved with a query, usually written in SQL (Structured Query Language), such as "find every student in class C2 with their teacher's name". Not every database is relational: NoSQL databases store documents, graphs or key–value pairs, which suits large volumes of unstructured data.
Data classification means sorting data into categories so that it can be organised, searched and protected appropriately. It works at two levels.
The first is classification by type or category inside a database. Each field has a data type, such as text, integer, decimal, date or true/false, which tells the system how to store and process the value. Records are also grouped into categories, such as patients by condition.
The second is classification by sensitivity, which decides who may access data and how it must be protected. Many organisations use levels such as these:
Level | Meaning | School example |
|---|---|---|
Public | Can be shared with anyone | The school's term dates |
Internal | For staff and students only | The staff room timetable |
Confidential | Limited to people who need it | Students' grades and attendance |
Restricted | Highest protection; disclosure could cause serious harm | Safeguarding reports; medical and counselling records |
Laws also classify data. The GDPR treats certain kinds of personal data as "special categories" that need stronger protection, including health, genetic and biometric data, racial or ethnic origin, religious beliefs, political opinions, trade union membership and sexual orientation.
Data relationships describe how records in different tables are linked:
One-to-one: each record matches exactly one other, such as one citizen and one passport number.
One-to-many: one record links to many, such as one class with many students (the relationship in the diagram).
Many-to-many: many records link to many, such as students and clubs, since each student joins several clubs and each club has several students. Relational databases handle this with a third linking table.
Relationships are what allow data to be combined. Linking a customer table to a purchases table lets a shop see each customer's history; linking it to location data lets it see where customers shop. The same power makes it possible to build detailed profiles of individuals.
Representing data visually or in summary form turns thousands of rows into information that people can grasp quickly. The choice of representation shapes what the audience notices, so it is never purely technical.
Form | What it is | Best used for | Example |
|---|---|---|---|
Table | Data arranged in rows and columns | Exact values; comparing a few items on several attributes | A timetable; a league table |
Chart | A graphical display of numbers: bar, line, pie, scatter | Bar charts compare categories; line charts show change over time; scatter plots show relationships | A line chart of daily COVID-19 cases |
Report | A written document that presents data with analysis and conclusions | Explaining findings and recommending action to decision-makers | A government's annual crime statistics report |
Infographic | A designed combination of images, charts, icons and short text | Communicating a few key messages to a general audience | A public health poster on vaccination rates |
Visualisation | Any visual representation of data, often interactive and built from large datasets | Exploring complex or changing data: maps, dashboards, network graphs | The Johns Hopkins University COVID-19 dashboard (2020–2023) |
Visualisation is older than computers. In 1854 the physician John Snow mapped cholera deaths in London's Soho and showed that they clustered around one water pump on Broad Street. Florence Nightingale's diagrams of soldiers' deaths in the Crimean War, most of them from preventable disease, helped persuade the British government to reform army hospital sanitation. Digital tools have made visualisation interactive: Hans Rosling's Gapminder animations show income and life expectancy changing for every country over two centuries.
A good representation fits the data, the audience and the purpose: an analyst may need a detailed table, while a newspaper reader needs a clear chart with one message.
Representations can also mislead, whether deliberately or not:
Truncated axes: a bar chart whose vertical axis starts at 95 instead of 0 makes a 2% difference look huge.
Selective time ranges: a line chart that starts in an unusually bad year exaggerates improvement.
Area distortion: icons or circles scaled by height rather than area overstate differences.
Missing context: a map of total cases makes populous regions look worst, when cases per 100,000 people would tell a different story.
Through the concept of expression, data visualisations are a form of argument. The designer chooses what to include, what colours to use and what title to give, and those choices carry a perspective. Readers therefore need to ask who made a chart and why.
Data security is the practice of protecting data from unauthorised access, corruption and loss throughout its life cycle. Security professionals often describe its aims with three words, the CIA triad:
Confidentiality: only authorised people can read the data.
Integrity: the data is accurate and has not been changed without permission.
Availability: the data can be reached by authorised people when they need it.
The cost of weak security can be very high. In 2017 attackers broke into the US credit reporting agency Equifax through a known software flaw that had not been patched for months, and stole the personal details, including names, dates of birth and social security numbers, of about 147 million people. None of them had chosen to give their data to Equifax. The company later agreed a settlement of up to $700 million with US regulators.
The four techniques that follow protect data in different ways and at different stages of the life cycle.
Encryption protects confidentiality. The original message is called the plaintext; the scrambled version is the ciphertext. An encryption algorithm uses a key, a secret value, to turn one into the other, and decryption reverses the process.
A very old example shows the idea. The Caesar cipher shifts every letter a fixed number of places along the alphabet. With a key of 3, A becomes D and B becomes E.
Modern encryption follows the same principle with far more complex mathematics. There are two main approaches.
Symmetric encryption uses one shared key to encrypt and decrypt. It is fast, so it suits large amounts of data. Its weakness is the key exchange problem: the sender must get the key to the receiver without anyone else intercepting it.
Public-key (asymmetric) encryption solves that problem with a pair of linked keys. The public key can be shared with anyone and is used to encrypt. The private key is kept secret by its owner and is the only key that can decrypt what the public key encrypted. A common comparison is a padlock: anyone can snap the padlock shut on a box (public key), but only the person with the padlock's key can open it (private key).
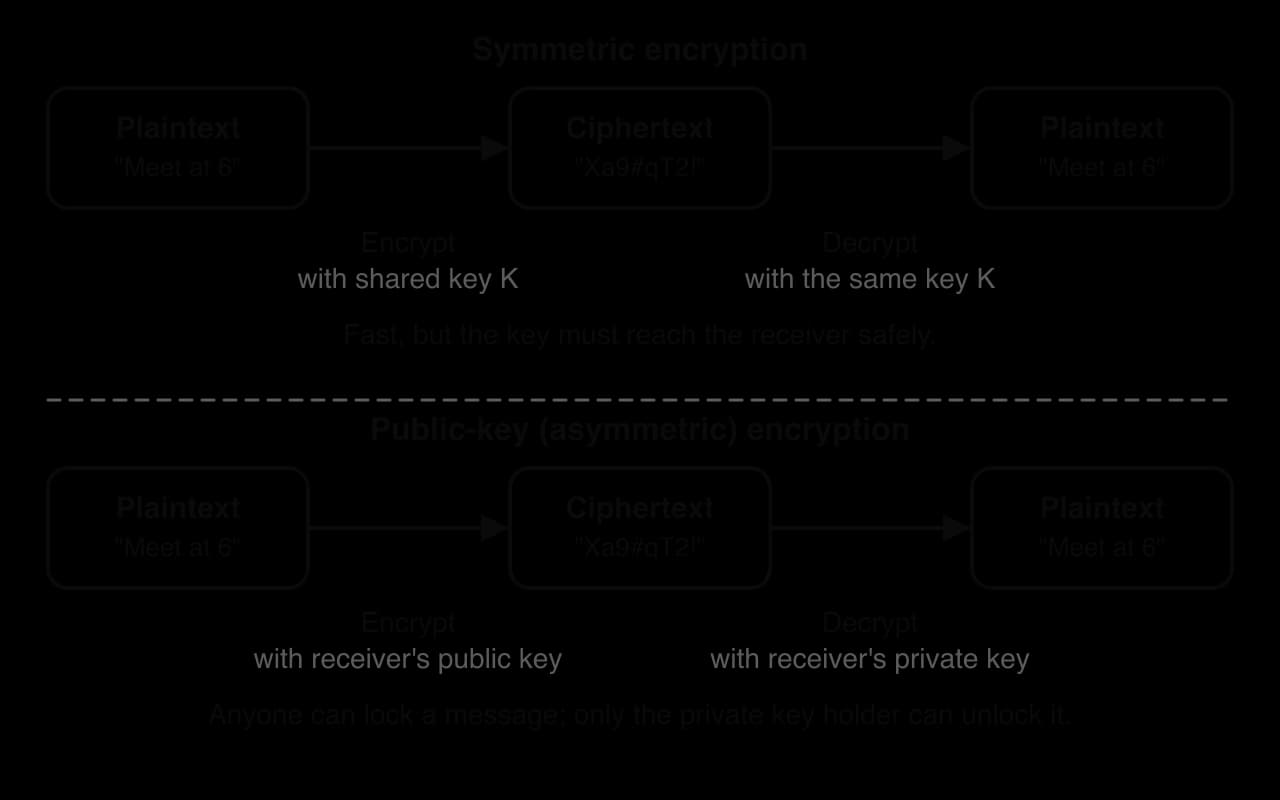
In practice the two work together. When a browser connects to a website over HTTPS, public-key encryption is used to agree a fresh symmetric key safely, and that symmetric key then encrypts the rest of the session quickly (3.4). WhatsApp, which turned on end-to-end encryption by default in 2016, uses the same idea so that only sender and receiver, not the company, can read messages.
 YouTube
Encryption protects data in transit (crossing a network) and at rest (stored on a device or server), so a stolen laptop or copied database is useless without the key.
Through the concept of values and ethics, strong encryption is a dilemma. It protects journalists, activists and ordinary users from criminals and surveillance, but it also stops police reading suspects' messages. Security experts warn that any built-in access for authorities could also be found by attackers.
Data masking is used when people need to work with data but should not see all of it. A shop receipt that shows a card number as **** **** **** 4821 is a simple example: the last four digits let the customer recognise their card, while the rest is hidden.
Masking is especially common when software is tested. Developers need realistic data to check a new banking system, but real customer records would expose people, so the data is masked: names are swapped for invented ones (substitution), values are moved between records (shuffling), dates of birth are shifted slightly (variance) and parts of numbers are hidden (redaction).
Masking differs from encryption because masked data is not meant to be restored: the test team never needs the real names back. Badly masked data can still be linked to individuals if enough other details remain.
When a file is "deleted" on most computers, the data stays on the drive; the system only marks the space as free. Until it is overwritten, recovery software can often bring the file back, which is why second-hand drives sometimes still hold their previous owners' files.
Data erasure makes recovery impossible. Common methods, described in standards such as the US National Institute of Standards and Technology's guidelines on media sanitisation (SP 800-88), are:
Overwriting: special software writes new patterns (such as zeros or random data) over every part of the drive.
Cryptographic erasure: if a drive was encrypted, deleting the key leaves only unreadable ciphertext. Modern phones use this method when reset to factory settings.
Physical destruction: shredding, crushing or melting the device, used for the most sensitive data.
Erasure links security to law and the environment. The GDPR gives individuals a "right to erasure", so organisations must be able to delete a person's data from every system on request. Physical destruction prevents data leaks but sends working devices to waste; secure overwriting allows phones and laptops to be resold and reused instead (4.3).
A blockchain is a type of distributed ledger: a shared record that many participants hold copies of, instead of one central organisation keeping the master version. It was first used for Bitcoin, the cryptocurrency launched in 2009, but it can record any kind of transaction.
Understanding a blockchain needs one idea from cryptography, the hash function. A hash function turns any input into a short fixed-length string of characters called a hash. The same input always gives the same hash, but changing even one character of the input gives a completely different hash. A hash acts like a fingerprint of the data.
A blockchain uses hashes in four steps:
Transactions are grouped into a block. Each block holds a batch of records, such as "Farm A ships 20 boxes to Packer B", with a timestamp.
Each block stores the hash of the previous block. This is what links the blocks into a chain.
The block's own hash is calculated from its contents, including the previous block's hash.
Copies of the chain are kept by many computers (nodes). Before a new block is added, the nodes must agree that it is valid, using a set of rules called a consensus mechanism.
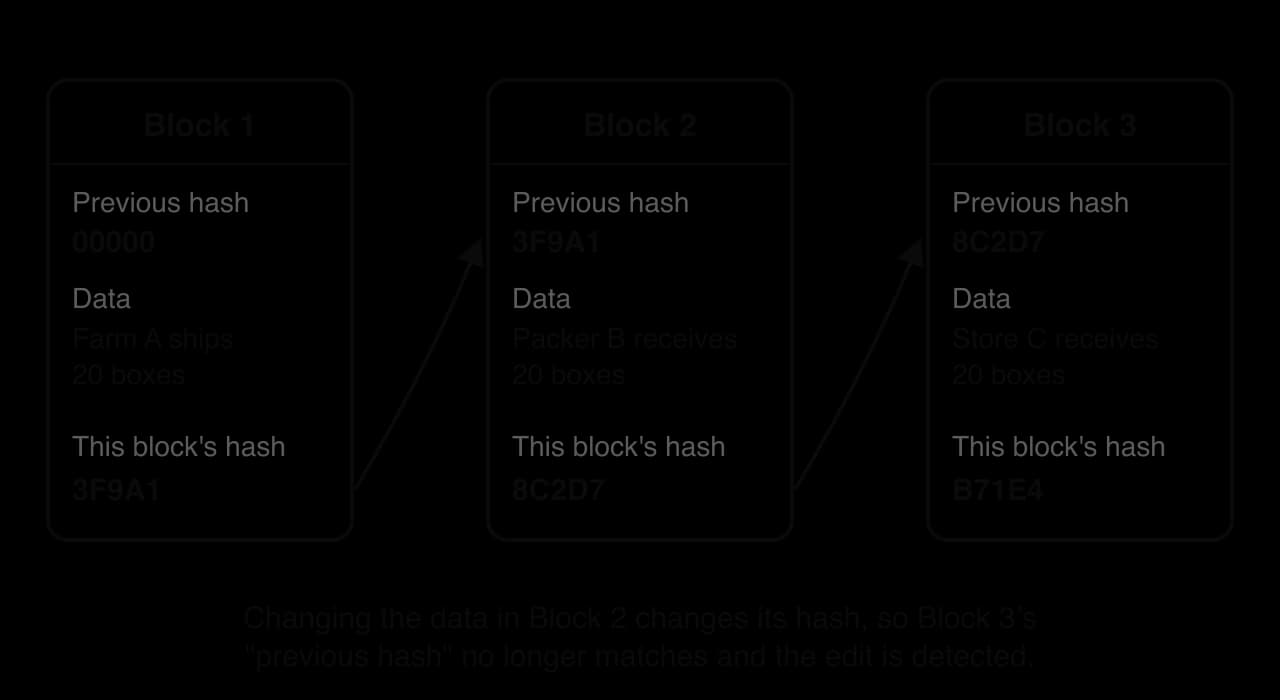
The chaining is what makes a blockchain hard to tamper with. If someone changes the data in Block 2, its hash changes. Block 3 still holds the old hash of Block 2, so the mismatch is obvious. Hiding the change would mean recalculating every later block on most copies across the network at once, which is designed to be practically impossible.
Blockchain is most useful where parties who do not fully trust each other need a shared record that no single organisation controls.
In a 2016 pilot with IBM, the US retailer Walmart recorded each step in the journey of sliced mangoes on a blockchain. Tracing a package back to its farm took nearly seven days with the old paper-based system and 2.2 seconds with the blockchain. Faster tracing lets a retailer withdraw only the affected batches when contaminated food makes people ill. Walmart later required suppliers of leafy greens to join the system.
Blockchain also has clear limits:
Garbage in, garbage out. A blockchain shows that a record has not changed since it was added; it cannot show that the record was true in the first place. If a supplier enters false data, the blockchain preserves the false data permanently.
Energy use. Some consensus mechanisms, especially the "proof of work" used by Bitcoin, consume large amounts of electricity (4.3).
Conflict with privacy law. Records on a blockchain are designed to be permanent, which clashes with the right to erasure. Designers avoid storing personal data directly on the chain for this reason.
Big data is defined less by a fixed size than by its characteristics. In 2001 the analyst Doug Laney described data growth in terms of three Vs: volume, velocity and variety. A fourth, veracity, was added later. Together they are often called the 4 Vs.
Characteristic | Meaning | Example |
|---|---|---|
Volume | The very large amount of data, measured in terabytes, petabytes or more | Billions of searches, posts and transactions generated every day |
Variety | The many types and formats of data, structured and unstructured, from many sources | A smart city combines traffic camera video, bus GPS traces, air-quality sensor readings and social media posts |
Velocity | The speed at which data is generated and must be processed, often in real time | Card payment systems that check each transaction for fraud in a fraction of a second |
Veracity | The trustworthiness and accuracy of the data, which can be noisy, incomplete or biased | Social media posts that include sarcasm, bots and false information |
The first three Vs describe why big data is powerful; veracity describes why it can mislead. A huge dataset of poor quality can produce confident but wrong conclusions.
Data analytics turns big data into information and knowledge. It can find patterns in billions of records that no human could read, which is the central reason big data matters. Analytics is often described in four levels, each answering a harder question:
Descriptive analytics: what happened? (Total sales by month.)
Diagnostic analytics: why did it happen? (Sales fell in regions where a competitor opened.)
Predictive analytics: what is likely to happen? (Sales next month, given past patterns.)
Prescriptive analytics: what should be done? (Which prices to set to meet a target.)
Much of this work is done by algorithms (3.2) and machine learning (3.6), which find patterns automatically. Analytics may also need large computing infrastructure, such as cloud data centres (3.4, 4.3).
 YouTube
Predictive analytics uses patterns in past and current data to estimate the probability of future events. Banks predict which loan applicants are likely to repay; streaming services predict which film a user will watch next; hospitals predict which patients are at risk of being readmitted.
In 2012 The New York Times described how the US retailer Target analysed shopping histories to give customers a "pregnancy prediction score": purchases such as unscented lotion and certain supplements, in combination, suggested a customer was pregnant, so Target could send baby-product coupons before competitors. The prediction inferred a sensitive fact the customer had never shared.
A model is a simplified representation of a real system, built from data, that can be used to test "what if" scenarios. Weather forecasting is the classic example. Centres such as the European Centre for Medium-Range Weather Forecasts feed millions of observations from satellites, weather stations, aircraft and ocean buoys into mathematical models of the atmosphere, running them many times to estimate the range of likely outcomes. During the COVID-19 pandemic, epidemiological models estimated how lockdowns might change the spread of the virus.
Past behaviour: digitised archives let historians and social scientists analyse millions of documents. Tools such as Google's Ngram Viewer chart how often words appeared in books over centuries, tracing changes in language and ideas.
Current behaviour: real-time data shows what people are doing now. From July 2019 Transport for London began using depersonalised Wi-Fi connection data from phones in London Underground stations to see how passengers move through stations and where crowding builds up.
Future behaviour: predictive models estimate what people will do next, such as which customers will cancel a subscription.
Through the concept of change, big data has shifted many decisions from human judgement to statistical prediction, from policing to hiring. Through the concept of power, the few organisations able to analyse data at this scale gain an advantage others cannot match.
The same dataset that helps a city plan bus routes can be used to track individuals. Data dilemmas fall into three groups: bias, reliability and integrity; control, ownership and access; and privacy, anonymity and surveillance.
Data bias matters because conclusions and algorithms built on biased data reproduce the bias, often on a large scale. Common sources include:
Sampling bias: some groups are under-represented. Data from smartphone apps leaves out people without smartphones, who are more often older, poorer or rural.
Historical bias: data reflects past discrimination. A hiring model trained on a company's past hires learns to prefer the kinds of people it hired before (3.6).
Measurement bias: the tool records some groups less accurately than others.
Measurement bias can have life-or-death effects. Pulse oximeters, clip-on devices that estimate blood oxygen by shining light through the skin, were found in a 2020 study in the New England Journal of Medicine to miss dangerously low oxygen levels in Black patients about three times as often as in White patients. During the COVID-19 pandemic, when oxygen readings guided treatment, this could delay care.
Data bias is the root of much algorithmic bias (3.2): an algorithm can be designed fairly and still produce unfair results if the data it learns from is skewed.
Data reliability is about whether data is accurate, consistent and from a credible source. A government census with documented methods is more reliable than an online poll that anyone can answer as many times as they like.
Data integrity is about whether data stays accurate, complete and unchanged as it moves through the life cycle. Integrity can be lost through errors (a typing mistake, a failed file transfer), poor design (the same fact stored in several places, so copies drift apart) or deliberate tampering (an attacker changing records). Relational databases, validation rules (such as rejecting a date of birth in the future), backups and blockchain all help preserve integrity.
Both link closely to the veracity of big data, which comes from many sources of unknown quality and passes through many systems.
Three linked questions are central to the concept of power: who controls data (decides how it is used), who owns it (has legal rights over it) and who has access to it (can see or use it). These are often different parties: a user creates fitness data, the app company controls it, an insurer may have access to it, and the law may give the user rights to see or delete it.
Data ownership is contested. Companies treat data they collect as a business asset; privacy advocates argue that personal data should belong to, or at least be controlled by, the person it describes. In most legal systems, nobody "owns" facts as such; instead, laws give individuals rights over personal data and give organisations duties.
Data brokers show how control can move away from individuals. These companies, such as Acxiom and Experian, collect data from public records, loyalty cards, online tracking and purchases, combine it into profiles and sell those profiles to advertisers, lenders and others. The people described usually do not know that the broker exists.
Access is also a question of fairness. Open data, such as transport timetables and government spending published free for anyone, lets citizens and small businesses build services and hold governments to account. Large technology companies, by contrast, hold vast datasets that independent researchers often cannot access.
Data privacy centres on personally identifiable information (PII): any data that can identify a specific person, either on its own or when combined with other data. Direct identifiers include a name, a passport number, a face image or a phone number. Indirect identifiers, such as postcode, date of birth and gender, identify people in combination.
The power of indirect identifiers was shown by the computer scientist Latanya Sweeney. Using 1990 US census data, she estimated in 2000 that about 87% of the US population could be uniquely identified by just three facts: five-digit ZIP code, gender and full date of birth. Earlier, she had used such details to pick out the governor of Massachusetts's "anonymous" hospital records.
Informed consent is the main way privacy law tries to give people control. Consent is informed when a person understands what data will be collected, for what purpose and who will receive it, and agrees freely. In practice, long privacy policies mean many people "consent" without understanding, which critics argue makes consent a formality.
The General Data Protection Regulation (GDPR) is the European Union's data protection law, in force since May 2018. It applies to any organisation, anywhere in the world, that handles the personal data of people in the EU. Its main principles are:
personal data must be processed lawfully, fairly and transparently, for specific purposes only;
only the data needed should be collected (data minimisation), and kept only as long as necessary;
individuals have rights to access, correct, move and erase their data;
organisations must keep data secure and report serious breaches, usually within 72 hours.
Fines can reach €20 million or 4% of a company's worldwide annual turnover, whichever is higher. The largest fines so far have fallen on the biggest platforms.
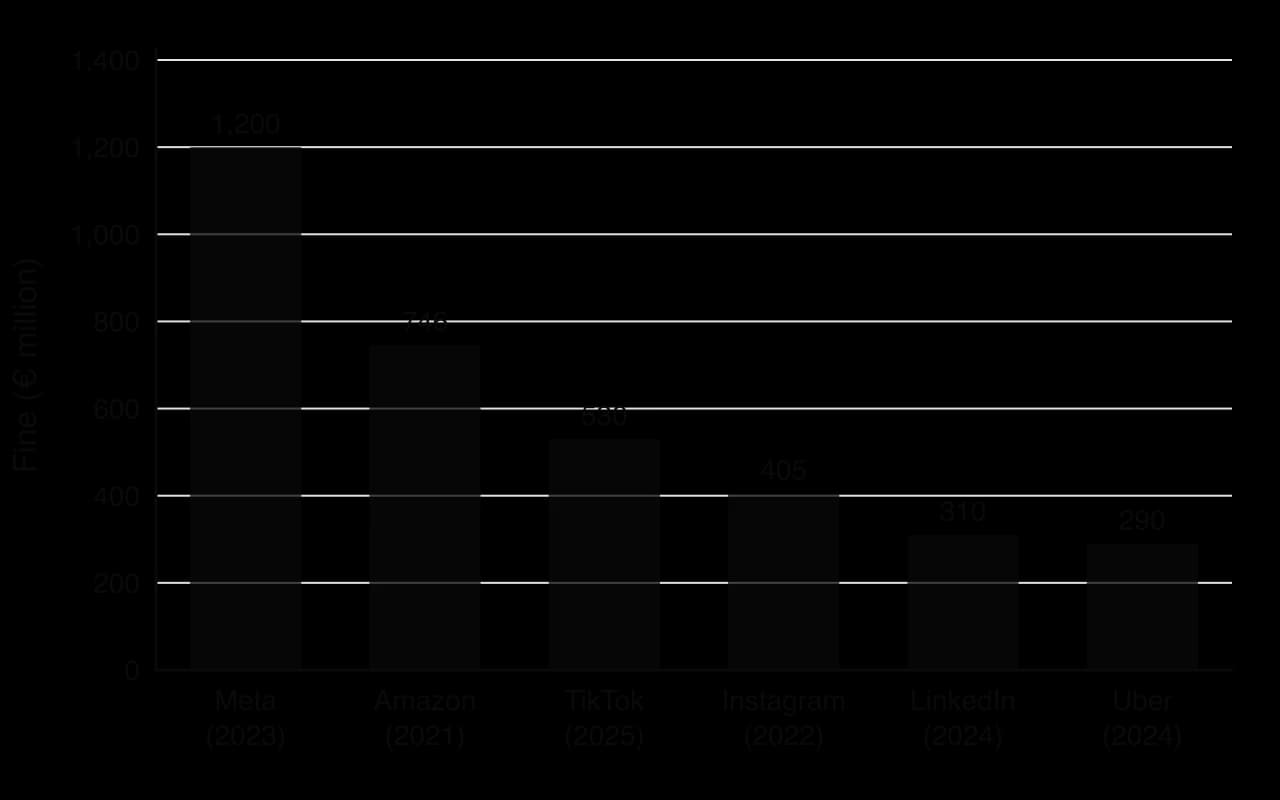
Many countries have followed with similar laws, including Brazil's LGPD (2020), China's Personal Information Protection Law (2021) and India's Digital Personal Data Protection Act (2023). Through the concept of space, these laws show national and regional rules being applied to data that flows across borders (2.5, 4.6).
Anonymity means that a person cannot be identified. Anonymisation is the process of removing or changing PII in a dataset so that the people in it can no longer be identified. Truly anonymised data falls outside the GDPR, which makes anonymisation attractive to organisations.
Anonymisation is much harder than removing names. Rich datasets contain patterns that act like fingerprints, and re-identification links "anonymous" records back to real people by matching them with other data.
In 2006 Netflix released about 100 million film ratings from roughly 480,000 subscribers for a public competition, the Netflix Prize, after replacing names with random numbers. Two researchers at the University of Texas, Arvind Narayanan and Vitaly Shmatikov, showed that a few ratings with approximate dates were enough to match many anonymous Netflix users with their public reviews on IMDb, identifying them and exposing their full viewing histories. After a lawsuit and regulatory concerns, Netflix cancelled a second competition in 2010.
A related technique is pseudonymisation: replacing identifiers with codes while keeping a separate key that can link them back. It reduces risk but is not anonymisation, and the GDPR still treats pseudonymised data as personal data.
Surveillance has always existed, but digital systems have made it cheaper, larger and more continuous. Phones, CCTV, card payments and social media leave trails of data that can be analysed automatically.
Who watches | Main purposes | Example |
|---|---|---|
Governments | Security, crime prevention, public health, political control | US and UK mass-surveillance programmes made public by Edward Snowden in 2013, which collected phone metadata in bulk |
Companies | Advertising, product design, risk assessment | Tracking of browsing across websites to build advertising profiles (surveillance capitalism, 2.4) |
Employers and schools | Productivity, safety, academic integrity | Software that monitors workers' keystrokes or students' screens during online tests |
Through the concept of values and ethics, the debate is about balance. Supporters point to crimes solved and diseases tracked. Critics point to the "chilling effect", in which people who know they are watched avoid lawful activities such as protest or searching for health information, and to the risk that data collected for one purpose will be used for another. The lines between watchers also blur. In 2022 Amazon's Ring, which sells doorbell cameras, confirmed that it had given US police footage from customers' cameras without the owners' consent at least 11 times in the first half of that year, in cases it classed as emergencies, so private devices became part of public policing.
Strava is a social fitness app used by runners and cyclists to record activities with a phone or GPS watch and share them. In November 2017 the company published an updated global heatmap, an interactive map showing where its users exercised. According to Strava, it was built from about one billion activities, totalling more than three trillion GPS points; the app had about 27 million users at the time. Popular paths glowed brightly; unused areas stayed dark.
In January 2018 Nathan Ruser, a 20-year-old Australian university student who analysed conflicts for a small research group, posted on Twitter that the heatmap showed the locations and layouts of military bases. In countries such as Afghanistan, Syria and Iraq, where few local people used fitness trackers, the only bright lines in otherwise dark regions were the jogging loops of foreign soldiers around the perimeters of their bases. Analysts quickly found further sites, including in parts of Africa, and routes between them.
The heatmap combined several stages of the data life cycle. Each user's device collected GPS coordinates every few seconds during an activity. Activities were stored on Strava's servers and, unless users had changed their settings, processed and aggregated into the public map by default. The map removed names and showed only how often each path was used, so Strava described it as anonymised.
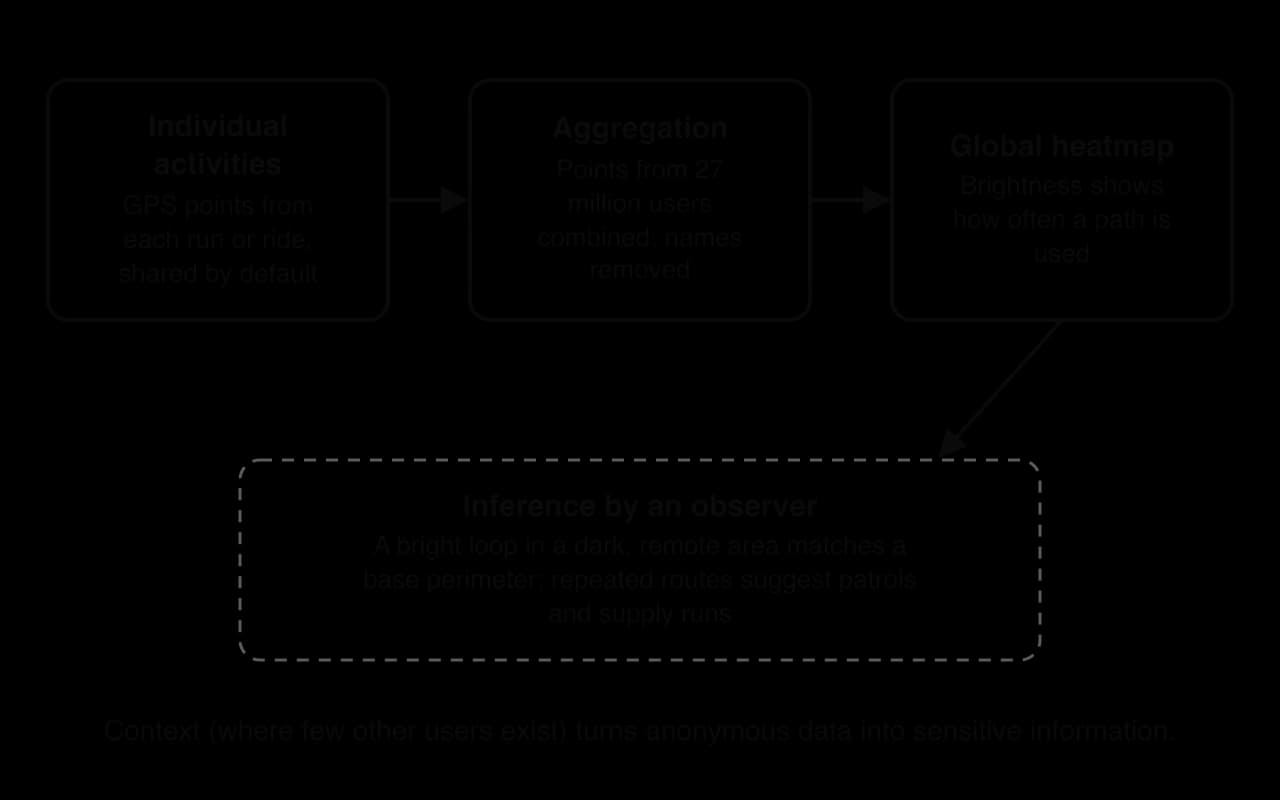
The flaw lay in context. Aggregation hides individuals when many people share a space, as in a city park. In a remote desert with a few hundred users, all of them soldiers, the "anonymous" pattern described one group precisely. Analysts also found that the heatmap could be combined with other Strava features, such as public routes and leaderboards, to find the profiles and names of some individual users.
Stakeholder | Impacts and implications |
|---|---|
Military personnel | Bases, patrol routes and supply runs exposed, raising the risk of attack; some individual soldiers potentially identifiable |
Military and governments | Operational security weakened; the US Department of Defense reviewed its policies, and in August 2018 it banned the use of geolocation features on devices in designated operational areas |
Strava | Reputational damage; criticism that privacy settings were hard to find and opt-out rather than opt-in |
Ordinary users | Became aware that data they had shared for motivation was part of a public dataset; some users in other sensitive roles, such as aid workers, faced similar risks |
Researchers and journalists | Gained a powerful example of open-source intelligence and of the risks of aggregate data |
Strava responded by pointing users to its privacy zones and to the setting that removes activities from the heatmap, and said that it would review its features and simplify its privacy settings.
Through the concept of values and ethics, the case turns on informed consent. Users had technically agreed to share data, and the settings to opt out existed. Few users understood that a run around a base would become part of a world map, so their consent was not meaningfully informed. A privacy-by-design approach (2.7) would have made sharing opt-in and excluded sparsely used areas.
Through the concept of space, the case shows how data turns physical space into a visible digital space. Base layouts and patrol routes that appeared on no public map became visible through movement data, and a digital map produced in California changed the physical security of places thousands of kilometres away.
Through the concept of power, the case shows that aggregated data can be a source of intelligence as well as a commercial asset. Analysts with no special access used a free public map to learn what powerful governments had tried to keep secret, so the soldiers and their commanders lost control over what their movement data showed to outsiders.
The Strava case shows that whether data is anonymous depends on its context. Removing names was enough in busy cities and not enough in remote regions, because the sparse data there could be linked to a known population. Responsibility was shared: Strava made sharing the default and treated aggregation as sufficient protection; militaries had not considered fitness trackers a security risk; users did not check their settings.
The responses reduced the most obvious risks, but the issue is wider than one app: every location-based service, from ride-hailing to dating apps, produces similar traces. The strongest lesson for data handling is that the risk of re-identification should be judged before data is published, considering who else might hold or infer matching data, and that default settings largely decide what is shared, because most users never change them.
The second question follows the source-based format, with a short written source.
I can distinguish between data, information, knowledge and wisdom, and evaluate the DIKW pyramid as a model.
I can distinguish between quantitative and qualitative data, and between structured and unstructured data.
I can give an example of cultural, financial, geographical, medical, meteorological, transport, scientific and statistical data.
I can define metadata and explain why it can be sensitive, and outline how data is used to identify trends, patterns, connections and relationships, and to record facts about people and communities.
I can describe each stage of the data life cycle and a risk at each stage.
I can distinguish between primary and secondary data collection, with advantages and disadvantages of each.
I can explain how a relational database uses records, fields, primary keys and foreign keys, and describe data classifications and relationships.
I can describe charts, tables, reports, infographics and visualisations, and explain how a representation can mislead.
I can explain how encryption (symmetric and public-key), data masking and data erasure protect data.
I can explain how a blockchain uses hashes to make records tamper-evident, and evaluate its limits.
I can describe the 4 Vs of big data and explain how data analytics supports prediction and modelling of human behaviour.
I can discuss data bias, reliability, integrity, ownership, access, privacy, anonymity and surveillance with real-world examples.
I can analyse the Strava heatmap case through at least two concepts.